Electron correlations rule phonon-driven instability in single layer TiSe2
Abstract
We investigate the controversial case of charge-density-wave (CDW) order in single layer 1T-TiSe2 by employing the density functional perturbation theory with on-site Hubbard interactions. The results emphasize the crucial role of electron correlations via Hubbard corrections in order to capture the accurate electronic structure, low- and high-temperature limits of the CDW phonon mode, and temperature-charge phase diagram. We show, in close agreement with the experiments, that total phase diagram consists of both commensurate and incommensurate CDW regions, where the latter coincide with the superconductive phase and might be instrumental for its formation. In addition to the established roles of quantum lattice fluctuations and excitonic interactions, our analysis emphasizes the overlooked crucial role of the momentum dependent electron-phonon coupling and electron correlations for the CDW phase transition in single layer TiSe2.
Despite almost five decades of extensive research [1, 2], microscopic origins of charge-density-wave (CDW) formation in bulk and two-dimensional (2D) 1T-TiSe2 are still a matter of active debate [3, 4, 5, 6], where either electron-phonon [7, 8, 9, 10, 11, 12, 13] or electron-electron [14, 15, 16, 17, 18, 19, 20, 21] interactions are discussed as a main driving force.
In phonon-driven scenario [22, 23] relevant phonon mode is softened by electron-hole pair transitions between center and edge of the Brillouin zone (BZ) [7], which pushes the system in new ground state with distorted bonds. A key role of electron-phonon coupling (EPC) for CDW in TiSe2 was corroborated by several experimental observations, namely, temperature dependent Kohn anomaly [24, 25], large periodic lattice distortions (PLD) [26], high electrical resistivity [14, 27], and superconductivity at higher pressures and by Cu intercalation [28, 29, 30, 31]. Even though density functional theory (DFT) is able to reproduce a correct PLD and phonon frequencies of the low-temperature CDW structure, as well as strong EPC [9, 32, 11], it fails in explaining the correct transition temperature , the temperature dependence of the CDW mode both for bulk and monolayer (1L) as well as the charge melting of their CDW phases [33, 34, 35, 36, 37, 20], and, therefore, does not provide a proper microscopic support for the phonon-induced instability.
In purely electron-driven, or excitonic insulator instability [38, 39] stabilization of the charge order comes from the soft electronic mode, i.e., exciton or plasmon, which was confirmed to exist in TiSe2 by means of the electron loss spectroscopy [19] and later by the DFT calculations [21]. Prerequisites for this spontaneous exciton condensation are believed to be small indirect or negative energy gap and weakly screened electron-hole interaction. Recent angle-resolved photoemission (ARPES) study claimed that purely excitonic mechanism is unlikely in 1L TiSe2 [13], while the presence of ungapped Fermi surface for CDW phase in bulk might quench the exciton and downsize its role [40].
There are, in fact, growing evidences, extracted from theoretical models [41, 42, 43, 44] and various time-resolved pump-probe experiments [45, 46, 47, 10, 48, 49, 4, 3, 5], that both subsystems cooperate to induce the CDW in TiSe2. It is, therefore, paramount to construct coherent and quantitative microscopic theory that can single out a dominant driving force.
In order to reach the aforesaid goal, we investigate 1L TiSe2 and provide reliable evidences showing that 2D charge order is governed by the unconventional phonon-driven instability, underlain by the momentum-dependent EPC, as, e.g., it is the case in NbSe2 [50, 51, 52], as well as significant electron correlations, which are crucial for obtaining the right transition temperatures and the temperature-charge phase diagram, consisting of commensurate and incommensurate CDW regions. Accordingly, invoking the presence of purely electronic soft modes in the context of CDW melting or formation is not crucial in single layer TiSe2. The latter is in line with the recent time-resolved ultrafast electron diffraction study of bulk TiSe2 indicating that excitonic correlations are in charge only for the out-of-plane CDW order [5].
To simulate phonon dynamics while properly accounting for electron correlations, we utilize density functional perturbation theory (DFPT) [53, 54] corrected with on-site Coulomb (Hubbard) interaction U [55, 56, 57] (see Supplemental Material (SM) [58] for more computational details), which was proven to be affordable and accurate tool for quantitative studies of EPC in correlated materials [59].
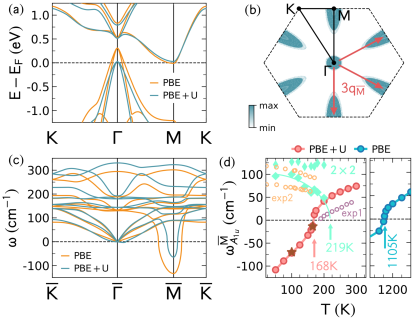
Figure 1(a) shows the electronic band structure of 1L TiSe2 along high symmetry points obtained by using semi-local exchange-correlation PBE functional corrected with Hubbard on-site interaction (PBEU), compared with pure PBE result. Here we use Hubbard on-site energy of eV for Ti atom, obtained self-consistently by using a first-principles linear response approach [56]. PBE band structure is metallic with strongly depopulated Se- hole-like states at the point and partially occupied Ti- electron-like states at the M point [9, 32, 36, 37], at odds with ARPES measurements [61, 62, 63, 13]. By including Hubbard correction the Se- bands at become almost fully populated (see also Fig. S1 in SM [58]), while keeping electron-like bands at M point intact. Therefore, electron correlations transform 1L TiSe2 to an almost zero-gap semiconductor, in agreement with early measurements [62], and hybrid-functional calculations, which include portion of the exact exchange [61, 32, 11]. Note that further quasiparticle renormalizations due to electron-phonon [64] and electron-hole [65] interactions might slightly open the gap between electron- and hole-like bands, which would be in accordance with recent ARPES study [13]. Further analysis (see Fig. S1 [58]) demonstrates considerable sensitivity of low-energy bands on excess charge concentration, temperature, and value of U, which is relevant for apprehending the mechanism of the CDW formation. For instance, low (high) temperature regime is governed by electron-like (hole-like) carriers, which is known from the transport experiments [66, 27]. All these re-confirms the already established role of U corrections for obtaining the right electronic structure of both 1L and bulk TiSe2 [67, 68, 21, 44].
Fermi surface of the PBEU band structure [Fig. 1(b)] already indicates that perfect nesting, a precondition for purely electronic, i.e., Peierls instability, is not probable in TiSe2 [14, 8]. Nevertheless, three nonequivalent interband transitions from the center to the edge of the BZ are possible and instrumental for the appearance of the Kohn anomaly and formation of the PLD.
Phonon band structures of 1L TiSe2 with and without proper description of electron correlations are depicted in Fig. 1(c). Inclusion of Hubbard correction blueshifts most of the phonon spectra, which could be explained as the overall reduced screening, i.e., transition from metal to small-gap semiconductor when the correct U is added. Particularly relevant is the hardening of the acoustic phonon frequency at , unstable mode which is believed to be instrumental for the CDW formation, accompanied with characteristic PLD and opening of the charge-order gap, in the phonon-induced scenario [2, 11, 13]. Microscopic origins of this electron-correlation-induced phonon renormalization are analyzed below. Consequently, the CDW transition (electron) temperature is reduced from K, as obtained with DFPT calculations and PBE functionals, to K [see Fig. 1(d)], greatly improving the agreement with the experiments [69, 61, 68, 62, 70, 63]. Softening and hardening of the CDW phonon as a function of electron temperature for normal (high-) and CDW (low-) phases also reproduces nicely the trends as observed in the inelastic x-ray [24, 25] and Raman [60] studies. Note that the amplitude mode softening for the low- reaches zero for K. This comes from additional relaxation of the Se atoms with PBE+U and for each of the temperatures, while the previously mentioned result ( K) is obtained for fixed Se atoms and relaxed with PBE for (e.g., distances between the Ti and Se planes are Å and Å for PBE and PBE+U). This emphasizes the sensitivity of the CDW properties with respect to length of the Ti-Se bonds, as previously discussed [71, 34].
According to the previous DFT-based studies [32, 11] both PBE and hybrid functionals significantly overestimate the value of in 1L and bulk TiSe2, while the inclusion of the long-range exchange via HSE hybrid functional enhances the EPC of the bulk CDW soft mode. Having in mind our findings, this leads to the following hierarchy of the calculated phonon frequencies , and the corresponding transition temperatures [32, 11]. If one assumes that nesting is not significantly modified in these three approaches (as it was shown at least to be the case for PBE and HSE [11]), one might draw the conclusion that EPC strengths of the CDW soft mode at are ordered as (see Figs. S2 and S3 in SM for additional comparison between the three functionals [58]).
We would also like to point out that structural stability and lattice dynamics of bulk TiSe2 as obtained with DFTU was carried out in Refs. [67] and [32], where it was concluded that the CDW instability is suppressed for certain values of U that reproduce the correct electronic structure. However, it was further discussed that these contradictory results might be underconverged and that certain improvements are necessary [67] (see also Sec. S2 in SI). In addition, quantum lattice fluctuations were shown to be important to understand the CDW transitions in various transition metal dichalcogenides [11, 72, 73]. For instance, in the case of TiSe2 monolayer, it reduces the harmonic PBE transition temperature from K to K [11]. Here we suggest that anharmonic corrections (which are always present in the case of CDW transitions) depend on the chosen functional, and, therefore, have different impact in the case of PBE and PBEU (see Fig. S4 in SM [58]). Also, as we show below, the right electronic structure as obtained with PBEU is essential for reproducing certain CDW features (e.g., melting of the CDW with electron doping and incommensurate CDW) that cannot be explained in terms of phonon entropy.
Three soft phonon modes with nonidentical (but symmetry related) displacement patterns (induced by previously mentioned three interband transitions) are responsible for the well-established PLD and CDW supercell [14, 37], shown in Fig. S5 of SM [58]. For the low- structure, the Ti- bands are folded from the edge to the center of the BZ, where two out of three unoccupied conduction states hybridize with the Se- states forming a CDW gap, while the lowest one remains unperturbed. Experimentally determined gap between the second conduction Ti- and occupied Se- bands at in the CDW phase was reported to be in the eV range [74, 75]. Here we obtain the values of eV with PBEU and eV with PBE. Infrared spectroscopy study showed that the low-energy edge of the CDW gap extends towards 0.15 eV [74], while the smallest gap between occupied and second unoccupied bands slightly away from are eV and eV for PBEU and PBE, respectively. This shows how PBEU provides a good electronic structure even for the low- distorted structure. Regarding the calculated PLD in the low- regime, the displacements of the Ti and Se atoms obtained with PBE are in very good agreement with x-ray diffraction experiments [26], while PBEU provides almost five times smaller values for Ti atoms (see Fig. S6 [58]). Within the present approach, this might indicate that besides the dominant EPC mechanism, there are other interactions supporting the CDW formation, like exciton-phonon coupling that was shown to increase PLD [43].
Note also the following consistent pattern: in comparison with PBE calculations Kohn anomaly obtained with PBEU is smaller, transition temperature is lower, PLD and the concomitant CDW gap are reduced (see also Fig. S3 [58]). The goal of the following analysis is to decipher in more details microscopic origins underlying the Kohn anomaly of the CDW mode and the above-mentioned pattern.
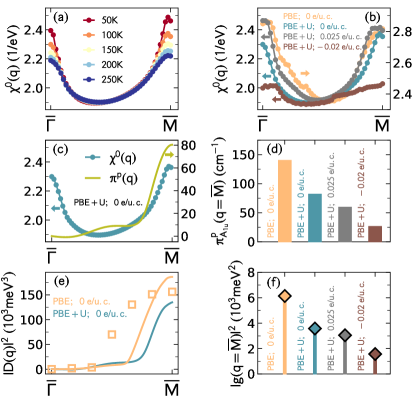
Electron-lattice contribution to the dynamical matrix consists of static phonon self-energy , while the phonon frequency renormalization of mode can be written as , where and are bare and renormalized phonon frequencies due to EPC [53, 76]. If one assumes a weak coupling theory (i.e., no high-order EPC terms as it is the case in DFPT) [77] and the effective EPC function for which the electronic degrees of freedom are averaged out, i.e., , the phonon self-energy can be written as , where is the bare charge correlation function [52, 11]. In that way we can juxtapose the roles of Fermi surface nesting via and EPC via .
Figure 2(a) shows the calculated for PBEU along , where only intraband and interband electronic transitions between two Se- and one Ti- states in the original cell are considered. Temperature dependence arises only from the Fermi-Dirac factors, i.e., from the electrons. There are two pronounced peaks in , i.e., at and , that additionally show moderate temperature dependence. at K with and without U are compared in Fig. 2(b). Even though low-energy band structure is considerably modified by the inclusion of U, the structure of the peak at is almost unchanged. Hence, the electron-correlation-induced hardening of the CDW mode at [Fig. 1(c)] is probably driven by modifications of EPC, rather than the nesting properties (as in Peierls scenario). In addition, we show how small electron and hole dopings affect . That is, populating the Ti- valley at M with excess charge carriers does not lead to significant modifications of , while the depopulation of both electron and hole pockets at and M alters considerably the phase space for electronic transitions (see also Fig. S1 in SM [58]).
Further, we provide a comparison between and the phonon self-energy in order to extract the effective EPC function and deformation potential for the mode. The partially-screened phonon self-energy accounting only for relevant electron transitions between low-energy Ti and Se bands is obtained by means of constrained DFPT (cDFPT) [78, 79, 80] (see also Sec. S1 in SI). The results are reported in Figs. 2(c)-(f). shows considerable momentum dependence along , as well as sensitivity to inclusion of U and excess charge carriers. More remarkably, we show that the effective EPC function is momentum dependent and, thus is a prime driving force of the Kohn anomaly and the accompanying lattice instability. Moreover, it is evident from Fig. 2(f) that the inclusion of the proper electron correlations via U reduces the EPC strength and deformation potential (see also Fig. S3 in SM [58]). One can therefore conclude that the momentum-dependent EPC plays a more dominant role than the Fermi surface nesting for the CDW formation in TiSe2, similarly to the case of NbSe2 [50, 51, 52]. This is in line with early theoretical considerations [7], however, contrary to more recent models, where -independent EPC is considered [65], as well as to what was recently concluded in time-resolved ultrafast electron diffraction study [3]. Note that temperature dependence of the Kohn anomaly is, nevertheless, ruled by the entropy of the electron subsystem entering via .
The results also demonstrate that modifications of nesting properties and EPC strength of the CDW mode both collaborate in the carrier-induced melting process of the CDW. Theoretical modeling of the temperature-charge phase diagram in TiSe2 is important for comprehending the following experimental observations: the competition of the superconductive and CDW orders in bulk TiSe2 as a function of doping [28, 29], the corresponding melting of the CDW order in 1L and bulk [70, 13], and generally higher values of in supported 1L TiSe2, where unavoidable Se vacancies might be present leading to the intrinsic electron doping [62, 63, 13].
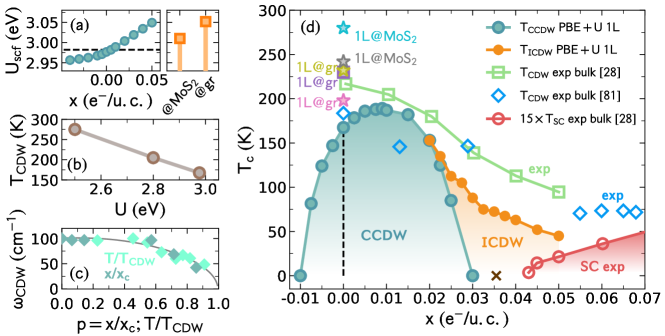
Figure 3(a) depicts the self-consistently obtained U values as a function of hole and electron doping concentrations. In addition, values of U for Ti atoms are provided when 1L TiSe2 is adsorbed on 3L MoS2 and 3L graphite (see Fig. S8 in SM for more details on the structures [58]), as it is often the case in the experiments [70, 62, 13]. From these results it is evident that modifications of charge concentrations and dielectric environment does not provide sufficient alterations of Hubbard parameter U that could in turn explain discrepancies of for 1L deposited on graphene/graphite and MoS2 [81, 70]. In fact, as demonstrated in Fig. 3(b), much higher modifications of U are necessary in order to increase by about K. Screening of the EPC function due to the presence of the substrate might also be ruled out, since the corresponding screened Coulomb interaction is (where d is distance between 1L and substrate, while V is the bare Coulomb interaction) [84] so that the screening due to substrate is 1, i.e., , at the edge of the BZ (i.e., for large ). On the other hand, different concentrations of the Se vacancies might explain the discrepancies between reported in various experiments [11], as well as different lengths of the Ti-Se bonds, which provide considerable modifications to the (see Fig. 1(d), corresponding discussion, as well as Ref. [34]).
As depicted in Fig. 3(c), the doping considerably affects the CDW amplitude mode (i.e., for ) that softens towards in the same manner as the temperature-induced softening towards . Note that our results for the critical doping agrees very well with the experimental estimation of the quantum critical point [14, 83]. The analysis on momentum-dependent electron-phonon coupling reported above reveals that the doping-dependent softening of the amplitude mode comes from the reduction of the electron-phonon coupling strength [see Fig. 2(f)], as it was speculated in Ref. [85].
Temperature-charge phase diagram as obtained with PBEU is reported in Fig. 3(d), along with the experimental values for bulk and 1L [28, 61, 70, 81, 82]. Experiments have thus far only provided the values of for electron doping [28, 13], while here we calculate the full phase diagram, which includes also the CDW melting via hole carriers. Interestingly, maximum value of is obtained for , which is closer to the experimental values of 1L on graphite [70], indicating that supported 1L samples are doped. In Ref. [63] the estimated doping for TiSe2 on graphene is , for instance. A dome-like structure analogous to the superconductivity phase diagram [28] is obtained for the instability, corresponding to the commensurate CDW (CCDW) phase (blue circles). Starting at around , we also observe a phonon instabilities away from the point (see Fig. S9 [58]) with a higher critical temperatures (orange points), which forms the incommensurate CDW (ICDW) phase [86, 87, 82, 83, 88, 89]. For these doping concentrations, the occupation of the electron Ti- pocket at the M point increases, which renders the perfect electron-hole transitions less, while transitions with more probable. Interestingly, for hole dopings we do not obtain the ICDW phase. By combining these results we get a very good agreement with the experiments [28, 82], showing that the total experimental phase diagram consists of the CCDW and ICDW regimes. Further, at the point where the CCDW is completely melted (; see brown cross for the experimental estimation of the quantum critical point [14, 83]), the superconducting phase emerges [28], coexisting with the ICDW [87]. This theoretically confirms already speculated relationship between the incommensurate ordered phases and superconductivity, as observed in various transition metal dichalcogenides. Note that standard PBE calculations without Hubbard corrections, on the other hand, grossly overestimates the point of the CDW melt and the overall phase diagram [20, 37]. As mentioned, the anharmonic corrections improve the CDW melting picture compared to the harmonic PBE results, however, when it comes to the electron-doping properties described above (-doping phase diagram, doping-induced softening of the CDW amplitude mode, and the ICDW phase) the electronic degrees of freedom along with the electron-phonon coupling seemed to be more relevant compared to the phonon entropy (e.g., in Ref. [11] no signs of these properties are observed in electron-doped TiSe2 where was used).
Simple qualitative condition for the stability of the CDW ground state can be written as , where is the Coulomb interaction and is the screened exchange interaction [90, 2]. Here we have demonstrated that considerable momentum-dependent EPC and broadened singularity in stabilizes the CDW order in TiSe2, in accordance with the above condition. Without proper description of and , as it is the case for semi-local exchange-correlation functionals such as PBE, the calculated transition temperature is an order of magnitude larger than the experimental one, i.e., . The present study highlights the role of on-site Coulomb (Hubbard) interaction U that makes the CDW “less stable”, hardens the Kohn anomaly, and greatly improves the agreement with experimental observations, e.g., . Importance of the screened exchange interaction was already demonstrated [32, 11], so one can speculate that its inclusion along with U might lift the agreement with the experiments even more (e.g., increase the PLD and the CDW gap). Recent ARPES experiments, in addition, suggest strong-coupling theory of CDW in TiSe2 [13], where larger distortions are expected and therefore nonlinear, high-order electron-phonon terms and anharmonicity might be important [77, 91, 92, 11]. All these renders the CDW phase in TiSe2 a highly unconventional, where all degrees of freedom are actively involved, while phonons have a leading role.
Acknowledgements.
We gratefully acknowledge useful discussions with R. Bianco, J. Berges, S. Poncé, E. Cappelluti, E. Tutiš, O. S. Barišić, and J. Krsnik. D.N. acknowledges financial support from the Croatian Science Foundation (Grant no. UIP-2019-04-6869) and from the European Regional Development Fund for the “Center of Excellence for Advanced Materials and Sensing Devices” (Grant No. KK.01.1.1.01.0001). Part of the computational resources were provided by the DIPC computing center.References
- Grüner [1988] G. Grüner, Rev. Mod. Phys. 60, 1129 (1988).
- Rossnagel [2011] K. Rossnagel, Journal of Physics: Condensed Matter 23, 213001 (2011).
- Otto et al. [2021] M. R. Otto, J.-H. Pöhls, L. P. R. de Cotret, M. J. Stern, M. Sutton, and B. J. Siwick, Science Advances 7, eabf2810 (2021).
- Duan et al. [2021] S. Duan, Y. Cheng, W. Xia, Y. Yang, C. Xu, F. Qi, C. Huang, T. Tang, Y. Guo, W. Luo, D. Qian, D. Xiang, J. Zhang, and W. Zhang, Nature 595, 239 (2021).
- Cheng et al. [2022] Y. Cheng, A. Zong, J. Li, W. Xia, S. Duan, W. Zhao, Y. Li, F. Qi, J. Wu, L. Zhao, P. Zhu, X. Zou, T. Jiang, Y. Guo, L. Yang, D. Qian, W. Zhang, A. Kogar, M. W. Zuerch, D. Xiang, and J. Zhang, Nature Communications 13, 10.1038/s41467-022-28309-5 (2022).
- Zhang et al. [2022] R. Zhang, W. Ruan, J. Yu, L. Gao, H. Berger, L. Forró, K. Watanabe, T. Taniguchi, A. Ranjbar, R. V. Belosludov, T. D. Kühne, M. S. Bahramy, and X. Xi, Phys. Rev. B 105, 085409 (2022).
- Yoshida and Motizuki [1980] Y. Yoshida and K. Motizuki, Journal of the Physical Society of Japan 49, 898 (1980).
- Rossnagel et al. [2002] K. Rossnagel, L. Kipp, and M. Skibowski, Phys. Rev. B 65, 235101 (2002).
- Calandra and Mauri [2011] M. Calandra and F. Mauri, Phys. Rev. Lett. 106, 196406 (2011).
- Karam et al. [2018] T. E. Karam, J. Hu, and G. A. Blake, ACS Photonics 5, 1228 (2018).
- Zhou et al. [2020] J. S. Zhou, L. Monacelli, R. Bianco, I. Errea, F. Mauri, and M. Calandra, Nano Letters 20, 4809 (2020).
- Wegner et al. [2020] A. Wegner, J. Zhao, J. Li, J. Yang, A. A. Anikin, G. Karapetrov, K. Esfarjani, D. Louca, and U. Chatterjee, Phys. Rev. B 101, 195145 (2020).
- Watson et al. [2020] M. D. Watson, A. Rajan, T. Antonelli, K. Underwood, I. Marković, F. Mazzola, O. J. Clark, G.-R. Siemann, D. Biswas, A. Hunter, S. Jandura, J. Reichstetter, M. McLaren, P. L. Fèvre, G. Vinai, and P. D. C. King, 2D Materials 8, 015004 (2020).
- Di Salvo et al. [1976] F. J. Di Salvo, D. E. Moncton, and J. V. Waszczak, Phys. Rev. B 14, 4321 (1976).
- Traum et al. [1978] M. M. Traum, G. Margaritondo, N. V. Smith, J. E. Rowe, and F. J. Di Salvo, Phys. Rev. B 17, 1836 (1978).
- Cercellier et al. [2007] H. Cercellier, C. Monney, F. Clerc, C. Battaglia, L. Despont, M. G. Garnier, H. Beck, P. Aebi, L. Patthey, H. Berger, and L. Forró, Phys. Rev. Lett. 99, 146403 (2007).
- Monney et al. [2009] C. Monney, H. Cercellier, F. Clerc, C. Battaglia, E. F. Schwier, C. Didiot, M. G. Garnier, H. Beck, P. Aebi, H. Berger, L. Forró, and L. Patthey, Phys. Rev. B 79, 045116 (2009).
- Rohwer et al. [2011] T. Rohwer, S. Hellmann, M. Wiesenmayer, C. Sohrt, A. Stange, B. Slomski, A. Carr, Y. Liu, L. M. Avila, M. Kalläne, S. Mathias, L. Kipp, K. Rossnagel, and M. Bauer, Nature 471, 490 (2011).
- Kogar et al. [2017a] A. Kogar, M. S. Rak, S. Vig, A. A. Husain, F. Flicker, Y. I. Joe, L. Venema, G. J. MacDougall, T. C. Chiang, E. Fradkin, J. van Wezel, and P. Abbamonte, Science 358, 1314 (2017a).
- Chen et al. [2018] C. Chen, B. Singh, H. Lin, and V. M. Pereira, Phys. Rev. Lett. 121, 226602 (2018).
- Lian et al. [2019] C. Lian, Z. A. Ali, and B. M. Wong, Phys. Rev. B 100, 205423 (2019).
- Hughes [1977] H. P. Hughes, Journal of Physics C: Solid State Physics 10, L319 (1977).
- Whangbo and Canadell [1992] M. H. Whangbo and E. Canadell, Journal of the American Chemical Society 114, 9587 (1992).
- Holt et al. [2001] M. Holt, P. Zschack, H. Hong, M. Y. Chou, and T.-C. Chiang, Phys. Rev. Lett. 86, 3799 (2001).
- Weber et al. [2011] F. Weber, S. Rosenkranz, J.-P. Castellan, R. Osborn, G. Karapetrov, R. Hott, R. Heid, K.-P. Bohnen, and A. Alatas, Phys. Rev. Lett. 107, 266401 (2011).
- Fang et al. [2017] X.-Y. Fang, H. Hong, P. Chen, and T.-C. Chiang, Phys. Rev. B 95, 201409 (2017).
- Knowles et al. [2020] P. Knowles, B. Yang, T. Muramatsu, O. Moulding, J. Buhot, C. J. Sayers, E. Da Como, and S. Friedemann, Phys. Rev. Lett. 124, 167602 (2020).
- Morosan et al. [2006] E. Morosan, H. W. Zandbergen, B. S. Dennis, J. W. G. Bos, Y. Onose, T. Klimczuk, A. P. Ramirez, N. P. Ong, and R. J. Cava, Nature Physics 2, 544 (2006).
- Qian et al. [2007] D. Qian, D. Hsieh, L. Wray, E. Morosan, N. L. Wang, Y. Xia, R. J. Cava, and M. Z. Hasan, Phys. Rev. Lett. 98, 117007 (2007).
- Zhao et al. [2007] J. F. Zhao, H. W. Ou, G. Wu, B. P. Xie, Y. Zhang, D. W. Shen, J. Wei, L. X. Yang, J. K. Dong, M. Arita, H. Namatame, M. Taniguchi, X. H. Chen, and D. L. Feng, Phys. Rev. Lett. 99, 146401 (2007).
- Kusmartseva et al. [2009] A. F. Kusmartseva, B. Sipos, H. Berger, L. Forró, and E. Tutiš, Phys. Rev. Lett. 103, 236401 (2009).
- Hellgren et al. [2017] M. Hellgren, J. Baima, R. Bianco, M. Calandra, F. Mauri, and L. Wirtz, Phys. Rev. Lett. 119, 176401 (2017).
- Duong et al. [2015] D. L. Duong, M. Burghard, and J. C. Schön, Phys. Rev. B 92, 245131 (2015).
- Fu et al. [2016] Z.-G. Fu, Z.-Y. Hu, Y. Yang, Y. Lu, F.-W. Zheng, and P. Zhang, RSC Adv. 6, 76972 (2016).
- Wei et al. [2017] M. J. Wei, W. J. Lu, R. C. Xiao, H. Y. Lv, P. Tong, W. H. Song, and Y. P. Sun, Phys. Rev. B 96, 165404 (2017).
- Singh et al. [2017] B. Singh, C.-H. Hsu, W.-F. Tsai, V. M. Pereira, and H. Lin, Phys. Rev. B 95, 245136 (2017).
- Guster et al. [2018] B. Guster, E. Canadell, M. Pruneda, and P. Ordejón, 2D Materials 5, 025024 (2018).
- Keldysh and Kopaev [1965] L. V. Keldysh and Y. V. Kopaev, Sov. Phys. Solid State 6, 2219 (1965).
- Jérome et al. [1967] D. Jérome, T. M. Rice, and W. Kohn, Phys. Rev. 158, 462 (1967).
- Watson et al. [2019a] M. D. Watson, O. J. Clark, F. Mazzola, I. Marković, V. Sunko, T. K. Kim, K. Rossnagel, and P. D. C. King, Phys. Rev. Lett. 122, 076404 (2019a).
- van Wezel et al. [2010] J. van Wezel, P. Nahai-Williamson, and S. S. Saxena, Phys. Rev. B 81, 165109 (2010).
- Watanabe et al. [2015] H. Watanabe, K. Seki, and S. Yunoki, Phys. Rev. B 91, 205135 (2015).
- Kaneko et al. [2018] T. Kaneko, Y. Ohta, and S. Yunoki, Phys. Rev. B 97, 155131 (2018).
- Lian et al. [2020] C. Lian, S.-J. Zhang, S.-Q. Hu, M.-X. Guan, and S. Meng, Nature Communications 11, 43 (2020).
- Mathias et al. [2016] S. Mathias, S. Eich, J. Urbancic, S. Michael, A. V. Carr, S. Emmerich, A. Stange, T. Popmintchev, T. Rohwer, M. Wiesenmayer, A. Ruffing, S. Jakobs, S. Hellmann, P. Matyba, C. Chen, L. Kipp, M. Bauer, H. C. Kapteyn, H. C. Schneider, K. Rossnagel, M. M. Murnane, and M. Aeschlimann, Nature Communications 7, 12902 (2016).
- Monney et al. [2016] C. Monney, M. Puppin, C. W. Nicholson, M. Hoesch, R. T. Chapman, E. Springate, H. Berger, A. Magrez, C. Cacho, R. Ernstorfer, and M. Wolf, Phys. Rev. B 94, 165165 (2016).
- Porer et al. [2014] M. Porer, U. Leierseder, J.-M. Ménard, H. Dachraoui, L. Mouchliadis, I. E. Perakis, U. Heinzmann, J. Demsar, K. Rossnagel, and R. Huber, Nature Materials 13, 857 (2014).
- Hedayat et al. [2019] H. Hedayat, C. J. Sayers, D. Bugini, C. Dallera, D. Wolverson, T. Batten, S. Karbassi, S. Friedemann, G. Cerullo, J. van Wezel, S. R. Clark, E. Carpene, and E. Da Como, Phys. Rev. Research 1, 023029 (2019).
- Burian et al. [2021] M. Burian, M. Porer, J. R. L. Mardegan, V. Esposito, S. Parchenko, B. Burganov, N. Gurung, M. Ramakrishnan, V. Scagnoli, H. Ueda, S. Francoual, F. Fabrizi, Y. Tanaka, T. Togashi, Y. Kubota, M. Yabashi, K. Rossnagel, S. L. Johnson, and U. Staub, Phys. Rev. Research 3, 013128 (2021).
- Johannes et al. [2006] M. D. Johannes, I. I. Mazin, and C. A. Howells, Phys. Rev. B 73, 205102 (2006).
- Calandra et al. [2009] M. Calandra, I. I. Mazin, and F. Mauri, Phys. Rev. B 80, 241108 (2009).
- Zhu et al. [2015] X. Zhu, Y. Cao, J. Zhang, E. W. Plummer, and J. Guo, Proceedings of the National Academy of Sciences 112, 2367 (2015).
- Baroni et al. [2001] S. Baroni, S. de Gironcoli, A. Dal Corso, and P. Giannozzi, Rev. Mod. Phys. 73, 515 (2001).
- Giannozzi et al. [2009] P. Giannozzi, S. Baroni, N. Bonini, M. Calandra, R. Car, C. Cavazzoni, D. Ceresoli, G. L. Chiarotti, M. Cococcioni, I. Dabo, and et al., Journal of Physics: Condensed Matter 21, 395502 (2009).
- Floris et al. [2011] A. Floris, S. de Gironcoli, E. K. U. Gross, and M. Cococcioni, Phys. Rev. B 84, 161102 (2011).
- Timrov et al. [2018] I. Timrov, N. Marzari, and M. Cococcioni, Phys. Rev. B 98, 085127 (2018).
- Floris et al. [2020] A. Floris, I. Timrov, B. Himmetoglu, N. Marzari, S. de Gironcoli, and M. Cococcioni, Phys. Rev. B 101, 064305 (2020).
- [58] See Supplemental Material at [URL], which additionally includes Refs. [93, 94, 95, 96, 97, 98, 99, 100, 101, 102, 103, 104, 105, 106, 107], for more details on numerical calculations, constrained density functional perturbation theory, electronic structure of and cells, 1D anharmonic model, periodic lattice distortions, incommensurate phonon instabilities, and structures of supported 1L TiSe2. The data underlying this study are available at dx.doi.org/10.6084/m9.figshare.21353883.
- Zhou et al. [2021] J.-J. Zhou, J. Park, I. Timrov, A. Floris, M. Cococcioni, N. Marzari, and M. Bernardi, Phys. Rev. Lett. 127, 126404 (2021).
- Sugai et al. [1980] S. Sugai, K. Murase, S. Uchida, and S. Tanaka, Solid State Communications 35, 433 (1980).
- Chen et al. [2015] P. Chen, Y. H. Chan, X. Y. Fang, Y. Zhang, M. Y. Chou, S. K. Mo, Z. Hussain, A. V. Fedorov, and T. C. Chiang, Nature Communications 6, 8943 (2015).
- Sugawara et al. [2016] K. Sugawara, Y. Nakata, R. Shimizu, P. Han, T. Hitosugi, T. Sato, and T. Takahashi, ACS Nano 10, 1341 (2016).
- Jia et al. [2018] T. Jia, S. N. Rebec, S. Tang, K. Xu, H. M. Sohail, M. Hashimoto, D. Lu, R. G. Moore, and Z.-X. Shen, 2D Materials 6, 011008 (2018).
- Ortenzi et al. [2009] L. Ortenzi, E. Cappelluti, L. Benfatto, and L. Pietronero, Phys. Rev. Lett. 103, 046404 (2009).
- Monney et al. [2015] G. Monney, C. Monney, B. Hildebrand, P. Aebi, and H. Beck, Phys. Rev. Lett. 114, 086402 (2015).
- Watson et al. [2019b] M. D. Watson, A. M. Beales, and P. D. C. King, Phys. Rev. B 99, 195142 (2019b).
- Bianco et al. [2015] R. Bianco, M. Calandra, and F. Mauri, Phys. Rev. B 92, 094107 (2015).
- Chen et al. [2016] P. Chen, Y.-H. Chan, M.-H. Wong, X.-Y. Fang, M. Y. Chou, S.-K. Mo, Z. Hussain, A.-V. Fedorov, and T.-C. Chiang, Nano Letters 16, 6331 (2016), pMID: 27648493.
- Peng et al. [2015] J.-P. Peng, J.-Q. Guan, H.-M. Zhang, C.-L. Song, L. Wang, K. He, Q.-K. Xue, and X.-C. Ma, Phys. Rev. B 91, 121113 (2015).
- Kolekar et al. [2018] S. Kolekar, M. Bonilla, H. C. Diaz, M. Hashimoto, D. Lu, and M. Batzill, Advanced Quantum Technologies 1, 1800070 (2018).
- Zunger and Freeman [1978] A. Zunger and A. J. Freeman, Phys. Rev. Lett. 40, 1155 (1978).
- Leroux et al. [2015] M. Leroux, I. Errea, M. Le Tacon, S.-M. Souliou, G. Garbarino, L. Cario, A. Bosak, F. Mauri, M. Calandra, and P. Rodière, Phys. Rev. B 92, 140303 (2015).
- Zheng et al. [2022] Y. Zheng, X. Jiang, X.-X. Xue, X. Yao, J. Zeng, K.-Q. Chen, E. Wang, and Y. Feng, Nano Letters 22, 1858 (2022).
- Li et al. [2007] G. Li, W. Z. Hu, D. Qian, D. Hsieh, M. Z. Hasan, E. Morosan, R. J. Cava, and N. L. Wang, Phys. Rev. Lett. 99, 027404 (2007).
- Monney et al. [2012] C. Monney, K. J. Zhou, H. Cercellier, Z. Vydrova, M. G. Garnier, G. Monney, V. N. Strocov, H. Berger, H. Beck, T. Schmitt, and P. Aebi, Phys. Rev. Lett. 109, 047401 (2012).
- Giustino [2017] F. Giustino, Rev. Mod. Phys. 89, 015003 (2017).
- Varma and Simons [1983] C. M. Varma and A. L. Simons, Phys. Rev. Lett. 51, 138 (1983).
- Novko [2020] D. Novko, Communications Physics 3, 1 (2020).
- Berges et al. [2020] J. Berges, E. G. C. P. van Loon, A. Schobert, M. Rösner, and T. O. Wehling, Phys. Rev. B 101, 155107 (2020).
- Nomura and Arita [2015] Y. Nomura and R. Arita, Phys. Rev. B 92, 245108 (2015).
- Kolekar et al. [2017] S. Kolekar, M. Bonilla, Y. Ma, H. C. Diaz, and M. Batzill, 2D Materials 5, 015006 (2017).
- Kogar et al. [2017b] A. Kogar, G. A. de la Pena, S. Lee, Y. Fang, S. X.-L. Sun, D. B. Lioi, G. Karapetrov, K. D. Finkelstein, J. P. C. Ruff, P. Abbamonte, and S. Rosenkranz, Phys. Rev. Lett. 118, 027002 (2017b).
- Jaouen et al. [2019] T. Jaouen, B. Hildebrand, M.-L. Mottas, M. Di Giovannantonio, P. Ruffieux, M. Rumo, C. W. Nicholson, E. Razzoli, C. Barreteau, A. Ubaldini, E. Giannini, F. Vanini, H. Beck, C. Monney, and P. Aebi, Phys. Rev. B 100, 075152 (2019).
- Despoja et al. [2019] V. Despoja, D. Novko, I. Lončarić, N. Golenić, L. Marušić, and V. M. Silkin, Phys. Rev. B 100, 195401 (2019).
- Barath et al. [2008] H. Barath, M. Kim, J. F. Karpus, S. L. Cooper, P. Abbamonte, E. Fradkin, E. Morosan, and R. J. Cava, Phys. Rev. Lett. 100, 106402 (2008).
- Joe et al. [2014] Y. I. Joe, X. M. Chen, P. Ghaemi, K. D. Finkelstein, G. A. de la Peña, Y. Gan, J. C. T. Lee, S. Yuan, J. Geck, G. J. MacDougall, T. C. Chiang, S. L. Cooper, E. Fradkin, and P. Abbamonte, Nature Physics 10, 421 (2014).
- Li et al. [2016] L. J. Li, E. C. T. O'Farrell, K. P. Loh, G. Eda, B. Özyilmaz, and A. H. C. Neto, Nature 534, 185 (2016).
- Chen et al. [2019] C. Chen, L. Su, A. H. Castro Neto, and V. M. Pereira, Phys. Rev. B 99, 121108 (2019).
- Li et al. [2019] L. Li, C. Chen, K. Watanabe, T. Taniguchi, Y. Zheng, Z. Xu, V. M. Pereira, K. P. Loh, and A. H. Castro Neto, Nano Letters 19, 4126 (2019).
- Chan and Heine [1973] S. K. Chan and V. Heine, Journal of Physics F: Metal Physics 3, 795 (1973).
- Yoshiyama et al. [1986] H. Yoshiyama, Y. Takaoka, N. Suzuki, and K. Motizuki, Journal of Physics C: Solid State Physics 19, 5591 (1986).
- Flicker and van Wezel [2015] F. Flicker and J. van Wezel, Nature Commun. 6, 7034 (2015).
- Heyd et al. [2003] J. Heyd, G. E. Scuseria, and M. Ernzerhof, The Journal of Chemical Physics 118, 8207 (2003).
- Novko et al. [2017] D. Novko, M. Blanco-Rey, and J. C. Tremblay, The Journal of Physical Chemistry Letters 8, 1053 (2017).
- Tremblay et al. [2012] J. C. Tremblay, G. Füchsel, and P. Saalfrank, Phys. Rev. B 86, 045438 (2012).
- Esswein and Spaldin [2022] T. Esswein and N. A. Spaldin, Phys. Rev. Research 4, 033020 (2022).
- McMillan [1977] W. L. McMillan, Phys. Rev. B 16, 643 (1977).
- Inglesfield [1980] J. E. Inglesfield, Journal of Physics C: Solid State Physics 13, 17 (1980).
- Hamann [2013] D. R. Hamann, Phys. Rev. B 88, 085117 (2013).
- Perdew et al. [1996] J. P. Perdew, K. Burke, and M. Ernzerhof, Phys. Rev. Lett. 77, 3865 (1996).
- Cococcioni and de Gironcoli [2005] M. Cococcioni and S. de Gironcoli, Phys. Rev. B 71, 035105 (2005).
- Timrov et al. [2021] I. Timrov, N. Marzari, and M. Cococcioni, Phys. Rev. B 103, 045141 (2021).
- Berland and Hyldgaard [2014] K. Berland and P. Hyldgaard, Phys. Rev. B 89, 035412 (2014).
- Giannozzi et al. [1991] P. Giannozzi, S. de Gironcoli, P. Pavone, and S. Baroni, Phys. Rev. B 43, 7231 (1991).
- Gonze and Lee [1997] X. Gonze and C. Lee, Phys. Rev. B 55, 10355 (1997).
- Wirtz et al. [2003] L. Wirtz, A. Rubio, R. A. de la Concha, and A. Loiseau, Phys. Rev. B 68, 045425 (2003).
- Sohier et al. [2017] T. Sohier, M. Gibertini, M. Calandra, F. Mauri, and N. Marzari, Nano Letters 17, 3758 (2017).