Macroscopic charge segregation in driven polyelectrolyte solutions
Abstract
Understanding the behavior of charged complex fluids is crucial for a plethora of important industrial, technological, and medical applications. Using coarse-grained molecular dynamics simulations, here we investigate the properties of a polyelectrolyte solution, with explicit counterions and implicit solvent, that is driven by a steady electric field. By properly tuning the interplay between interparticle electrostatics and the applied electric field, we uncover two nonequilibrium continuous phase transitions as a function of the driving field. The first transition occurs from a homogeneously mixed phase to a macroscopically charge segregated phase, in which the polyelectrolyte solution self-organizes to form two lanes of like-charges, parallel to the applied field. We show that the fundamental underlying factor responsible for the emergence of this charge segregation in the presence of electric field is the excluded volume interactions of the drifting polyelectrolyte chains. As the drive is increased further, a re-entrant transition is observed from a charge segregated phase to a homogeneous phase. The re-entrance is signaled by the decrease in mobility of the monomers and counterions, as the electric field is increased. Furthermore, with multivalent counterions, a counterintuitive regime of negative differential mobility is observed, in which the charges move progressively slower as the driving field is increased. We show that all these features can be consistently explained by an intuitive trapping mechanism that operates between the oppositely moving charges, and present numerical evidence to support our claims. Parameter dependencies and phase diagrams are studied to better understand charge segregation in such driven polyelectrolyte solutions.
1 Introduction
Polyelectrolytes are polymers whose monomers contain ionizable groups and are ubiquitous in biological and industrial systems 1, 2, 3, 4. Examples of naturally occurring polyelectrolytes are DNA, RNA, and proteins, but nowadays there are also widely used synthetic polyelectrolytes, such as polystyrene sulfonate and polyacrylic acid. When placed in a polar solvent, such as water, polyelectrolyte monomers ionize, thereby acquiring charge, and release oppositely charged counterions into the solvent. Due to the complex interplay among conformational entropic effects, excluded volume interactions, and electrostatics, polyelectrolytes often exhibit structural and dynamical properties that are drastically different from electrolytes, colloids, and neutral polymers. The unique properties of polyelectrolytes are governed by a multitude of nonlinearly coupled variables, making these systems notoriously difficult to study, both theoretically and in experiments. Needless to say, due to their novel features, polyelectrolyte systems have contributed immensely, both in understanding the fundamental physics of complex charged fluids, and for a wide range of real life applications, such as nano-filtration 5, energy storage 6, bioelectronics 7, fabrication of novel materials for biomedical use 8, and vaccines 9, to name a few.
In this work, we study the nonequilibrium aspects of an aqueous polyelectrolyte solution, driven by an electric field, using coarse-grained simulations. Electrokinetically driven polyelectrolytes have been actively investigated over the years in a variety of different contexts 10, 11, 12, 13, 14, 15, 16, 17, 18, 19. This also has important applications, such as in the electrophoretic separation of DNA and other polyelectrolytes 20 which constitute an useful way to probe and characterize their structure and properties. Another of our major motivations for investigating this problem stems from the previous studies of driven colloidal systems, mostly done in two dimensions (2D), and a few in three dimensions (3D). For 2D and 3D binary colloids driven by an external field, a nonequilibrium phase transition has been reported which is sometimes referred to as the laning transition 21, 22, 23, 24, 25, 26, 27. Molecular simulations show that, in the presence of an appreciably large electric field, a colloidal binary mixture spontaneously forms multiple lanes of like-charges. This phenomenon has been explained in terms of dynamical instability using density functional theory 28, 29, nonequilibrium correlation functions derived from many-body Smoluchowski equation 30, environment dependent diffusion rates and analogy with the Katz-Lebowitz-Spohn model 31, and superadiabatic demixing forces 32. Lane formation has also been verified in experiments with oppositely charged colloids 33, 34. For 2D systems, lane formation is believed to be a discontinuous transition, or possibly a smooth crossover. For 3D charged systems, it is expected to be a continuous transition. Nonetheless, the true nature of laning transition in binary colloids is still debated 26, 31, 35. This is mostly because, unlike equilibrium, it is often extremely nontrivial to identify and characterize nonequilibrium phase transitions in complex systems. This also makes nonequilibrium transitions exceedingly appealing to study and has important consequences, e.g., in understanding self-assembly processes in soft-matter systems 36.
To examine the generality of laning, it seems worthwhile to investigate if such a nonequilibrium phase transition occurs also in other classes of complex fluids, such as polyelectrolyte solutions. We speculate that, if laning transition exists for polyelectrolyte systems, then there should be considerable quantitative, as well as, qualitative differences in its features (compared to colloids), due to the complex interplay among excluded volume interactions of the spatially extended polyelectrolyte chains, entropic effects, and the electrostatic interactions. To the best of our knowledge, laning transition in driven polyelectrolyte solutions has not been studied yet, and we attempt to address this question in this article.
To this end, we perform nonequilibrium Langevin dynamics simulations of coarse-grained bead-spring polyelectrolytes, with explicit counterions in an implicit water-like solvent, that is driven by a steady external electric field. By judiciously controlling the strength of the electrostatic interaction between the charged species and its interplay with the electric field drive, our simulations unravel a macroscopic nonequilibrium charge segregation between the monomers and the oppositely charged counterions, a re-entrant phase transition at higher electric fields, and another associated transition between regimes of increasing and decreasing mobility with the electric field drive. We also find an anomalous regime of negative differential mobility, in which, remarkably, the terminal velocity of the charged particles decreases as the driving field strength is increased. In the following sections, we describe our model and methods in detail, present the results obtained from simulations, and provide simple physical arguments to elucidate the nonequilibrium behavior of driven polyelectrolytes.
2 Model and simulation method
Model.
We consider polyelectrolytes that are modeled as linear, fully flexible, bead-spring chains, with bead diameter and mass set to unity (for a recent review on coarse-grained molecular simulations of charged polymers, see Ref. 37). There are polyelectrolyte chains, each with monomers. Each monomer carries one unit of negative charge . To ensure global charge neutrality, there are counterions (diameter and unit mass), each carrying one unit of positive charge . Excluded volume interaction between the beads is modeled using the purely repulsive Lennard-Jones potential, also referred to as the Weeks-Chandler-Andersen (WCA) potential,
with a cutoff , such that . All quantities here are measured in reduced units, where and are the length and energy scales respectively. The consecutive monomers on a polyelectrolyte chain are connected by the finite extensible nonlinear elastic (FENE) potential,
where is the spring constant, and is the maximum extension of the bonds. Following the studies on colloidal systems, the charges in our system (monomers and counterions) interact via the screened Coulomb interaction (also known as the Yukawa or the Debye-Hückel potential). The screened Coulomb interaction, besides being computationally (and analytically) easier to handle than the full long-range Coulomb interaction, is usually found in many biologically and industrially relevant systems, due to the presence of dissolved salt ions in the aqueous solution 1, 2, 3, 4. It has the exponentially decaying form
and we choose the electrostatic cutoff at . Here is the inverse Debye screening length, and is the Bjerrum length. The solvent is implicit, and therefore, is assumed to be a continuum neutral background with no internal structure. We choose the solvent to be water which has a dielectric constant , and Bjerrum length nm . The solvent also provides dissipation and thermal noise, and is maintained at a temperature , with friction coefficient always set to . This gives us a simple coarse-grained model for polyelectrolytes, with explicit counterions in an implicit solvent, and screened Coulomb interactions between the charges.
The polyelectrolyte solution is placed in a 3D periodic cubic simulation box of volume , where is chosen according to the desired volume fraction , where is the total number of beads inside the simulation box. In this work we have considered both monovalent and multivalent (trivalent) counterions. For trivalent counterions, the charge on each counterion is increased to , whereas their number is reduced to , to maintain global charge neutrality. This polyelectrolyte solution is driven by a steady external electric field , directed toward to the direction. Thus, when the external field is switched on, the polyelectrolyte chains tend to move toward the and the counterions move in the direction.
Simulation method.
Starting from random positions and velocities for the monomers and the counterions, the polyelectrolyte solution is simulated using Langevin dynamics in LAMMPS 38. The update time-step is set at . First, the polyelectrolyte solution is equilibrated at temperature without the external drive, and thereafter, the electric field is turned on. In the presence of driving, the system is allowed to settle to a nonequilibrium steady state (NESS). At NESS, we compute average values of different observable (defined below), such as the order parameter and the transport coefficients i.e., the mobilities – the subscripts and stand for the polyelectrolytes and the counterions respectively.
Observables.
To characterize the phase transition a suitable order parameter needs to be defined. The order parameter is non-unique and can be defined in multiple ways. For this work we define an order parameter, well-suited for our purpose, in the following way. A relevant length scale that needs to be considered is the mean inter-particle distance . Since charge segregation happens perpendicular to the plane, we first compute the number of counterions that are at an arbitrarily chosen distance from a monomer on any of the polyelectrolyte chains 21. Here, and are the coordinates of the th counterion and the th monomer respectively. We then define the order parameter as , such that in the homogeneous state , and hence, , whereas, in the charge segregated phase, , and has a large value close to unity. The relevant transport coefficient in this problem is the mobility of the charges in the presence of external drive. The mobility is generally defined as the average drift velocity of a monomer/counterion in the NESS, normalized by the magnitude of the force due to the applied field (‘’ for counterions and ‘’ for monomers), i.e., , where implies average over all the beads of the same species and time.
3 Results and discussions
Macroscopic charge segregation.
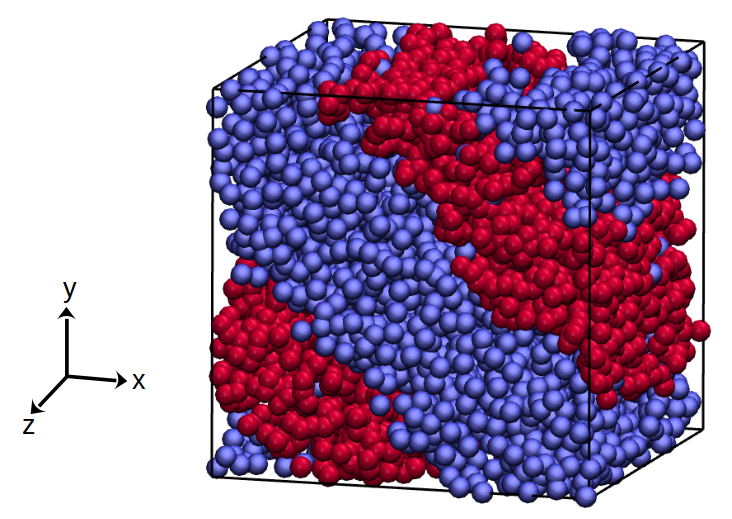
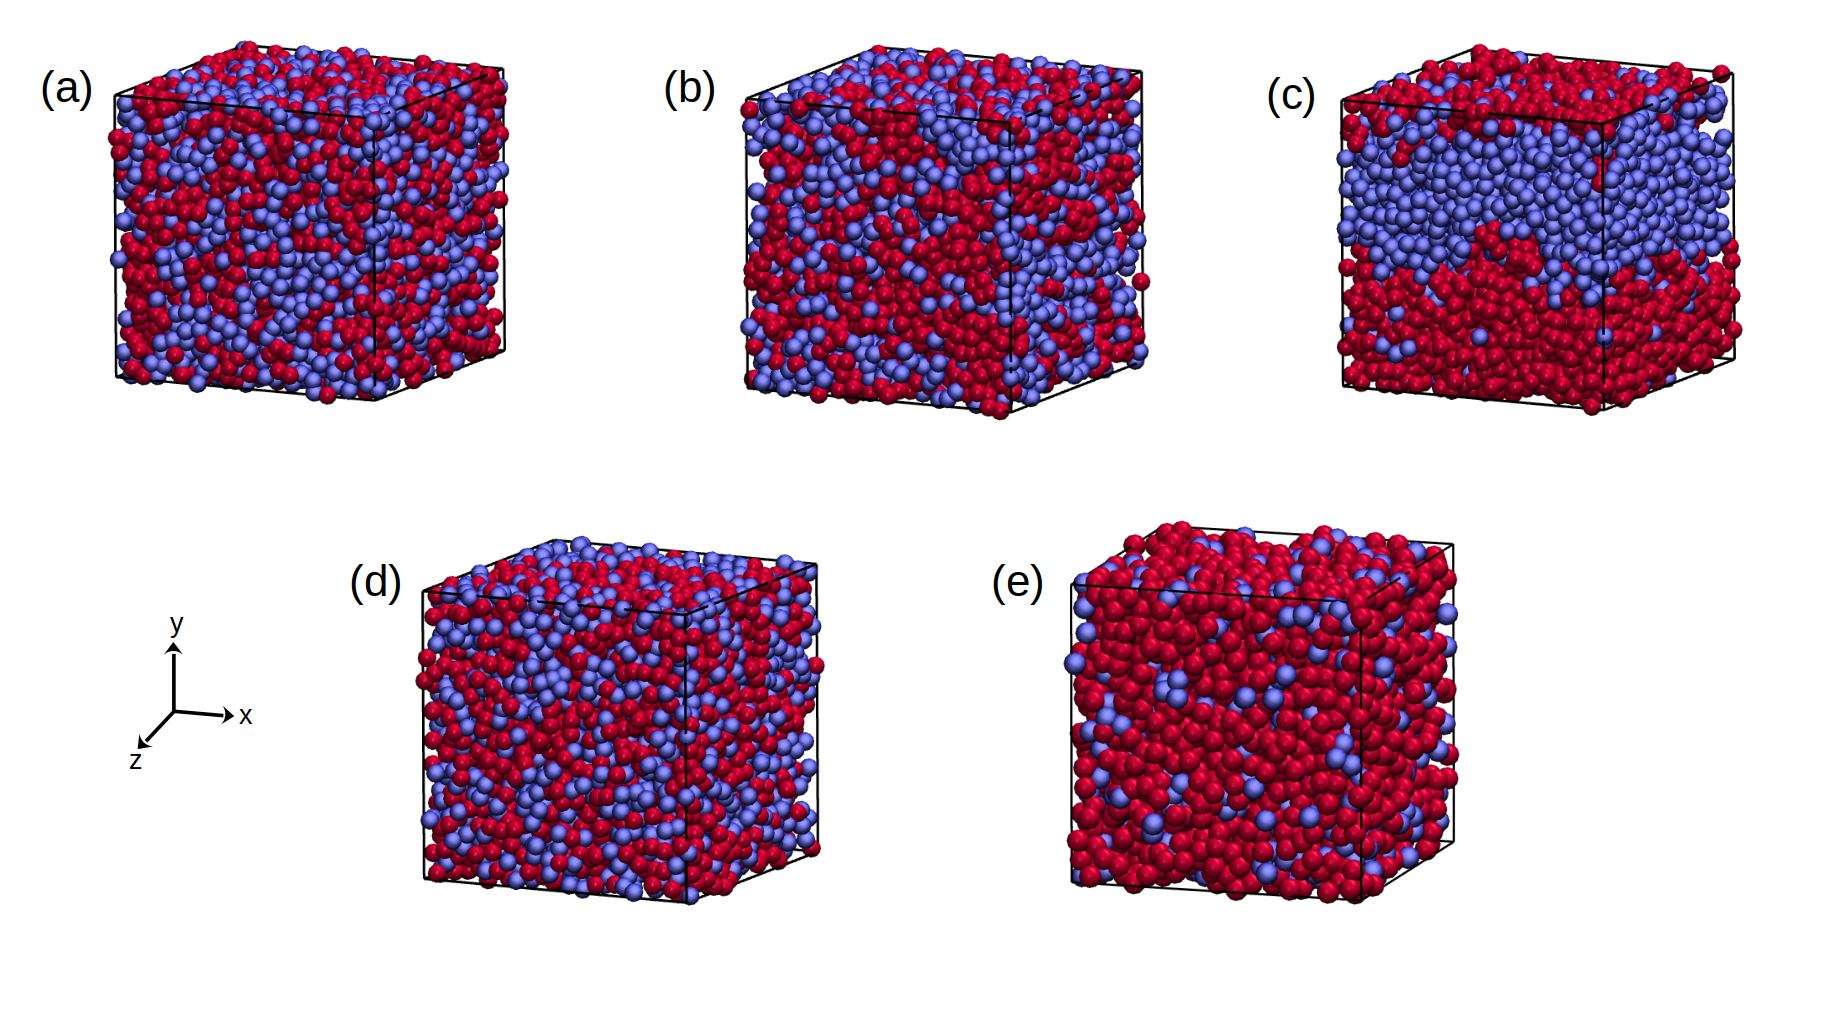
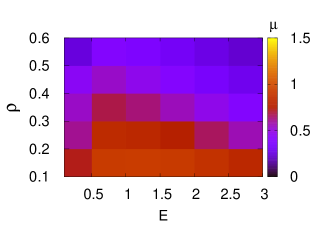
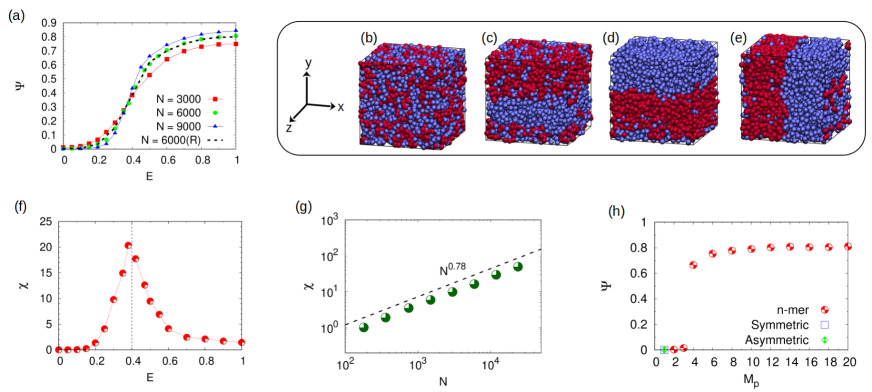
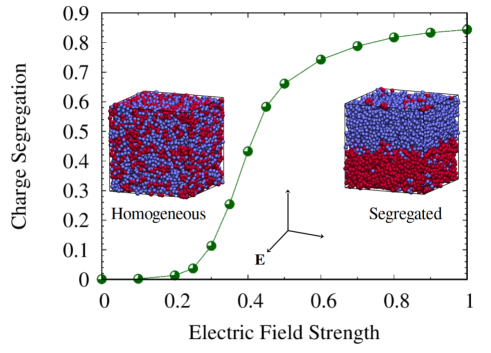
We first show that the polyelectrolyte solution undergoes a nonequilibrium phase transition, from a macroscopically homogeneous mixture of negatively charged monomers and positively charged counterions to a macroscopically charge segregated phase, in the presence of the applied electric field. This can be seen in Fig. 1a, where the order parameter is shown to increase smoothly from zero to a nonzero value (close to unity) as is increased, indicating charge segregation. Moreover, the phase transition becomes sharper as the number of charges, , is increased, suggesting that the transition persists in the thermodynamic limit. Thus, at large , quite counter-intuitively, the positively charged counterions and the negatively charged monomers diffuse uphill 39, and spontaneously organize to form two separate lanes of like-charges, despite the electrostatic repulsion between the charges in the same lane. If the driving field is turned off the polyelectrolyte solution becomes homogeneous again. A few representative simulation snapshots of the polyelectrolyte solution for different electric fields are shown in Figs. 1b-e clearly showing the phase segregation. The symmetry breaking can happen spontaneously along any of the two transverse directions, or , see Figs. 1d and 1e (depending on the density and external drive, other demixed configurations are also possible, see Fig. S1 in the Supporting Information).
Note that, unlike 2D and 3D colloidal systems 21, in our polyelectrolyte system (3D), we do not obtain multiple lanes, but only two macroscopic lanes. It has been speculated that, even for 2D colloids, eventually the multiple lanes (of the same charge) will merge, leading to two macroscopic lanes 21, just as in our case. However, starting from a completely random initial configuration of charges, it will take infinitely long to obtain two macroscopic lanes in 2D. This is because, unlike 3D systems where there is a third direction available, in 2D the individual lanes of like-charges have to pass through nearby lanes of opposite charges in order to merge. In fact, starting from two macroscopically segregated phases, it has been demonstrated that a 2D system maintains the two lanes in the NESS (see Fig. 9b in Ref. 31).
Hysteresis and susceptibility.
To understand the nature of the nonequilibrium phase transition, we look at the variation of as the external drive is gradually increased from to , and thereafter decreased back to zero. The order parameter along the forward path (marked ‘N = 6000’ in Fig. 1a) and the reverse path (dashed curve marked ‘N = 6000(R)’) does not exhibit any noticeable hysteresis, which can be taken as a signature of a continuous phase transition, in analogy with equilibrium critical phenomena. This is also the case for 3D colloidal systems, but not for 2D colloids 23, 34. We also compute the susceptibility (fluctuations of the order parameter), see Fig. 1f. Near the transition point, , has a relatively high value, implying that there are large critical fluctuations. Moreover, near the transition point, increases as a power-law with , , for roughly two decades (Fig. 1g), as is also expected in equilibrium critical phenomena.
Electrolytes and n–mers.
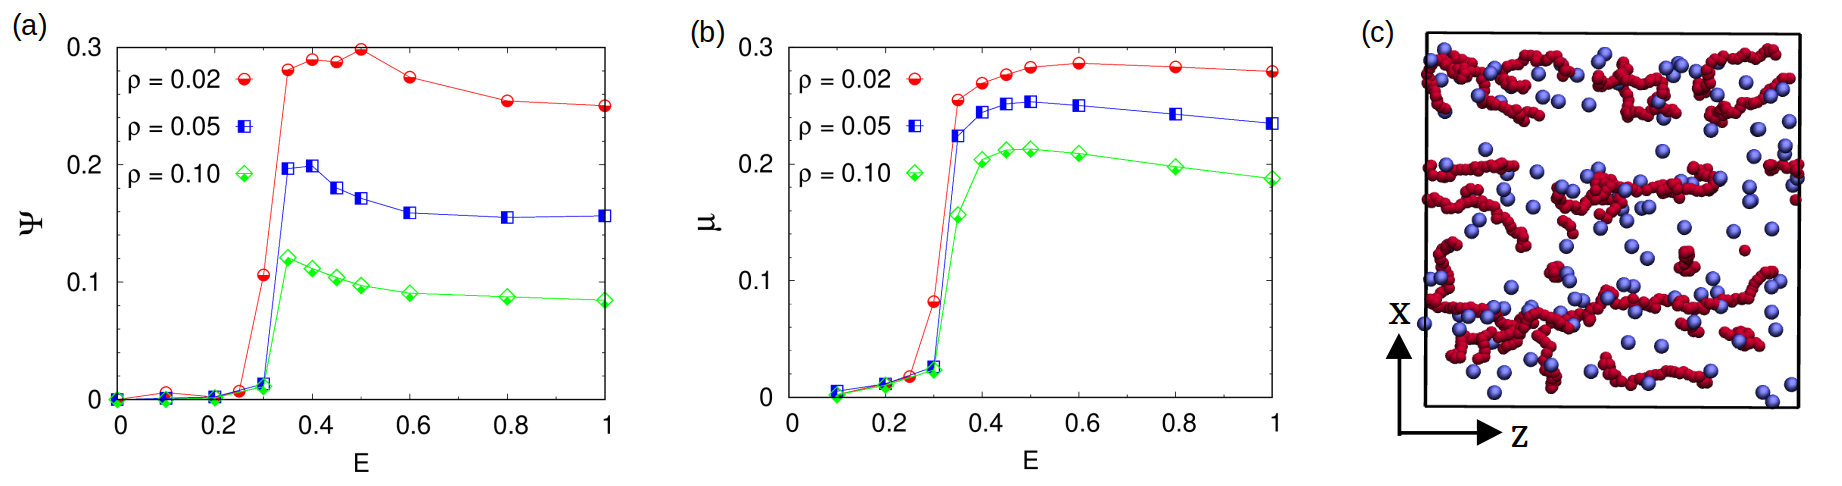
To demonstrate that this phase transition, for the chosen system parameters and external -field range, is unique to the polyelectrolyte system, we simulated an equivalent symmetric electrolyte solution. The equivalent electrolyte solution is identical to the polyelectrolyte solution, except that all the bond potentials are set to zero, i.e., . We fix the external electric field to which induces a strong segregation in the polyelectrolyte solution (Fig. 1e). It can be clearly seen in Fig. 1h that, at such a low external drive, the symmetric electrolyte solution, containing positive ions and negative ions, does not phase segregate (). (See Ref. 40 for lane formation in 2D electrolytes at very high -field.)
Building up from the symmetric electrolyte, and keeping and fixed, we increase the degree of polymerization of the chains, . Thus is a dimer, and is a trimer, and in general is an ‘n–mer’. For a fixed drive , we find that the order parameter , indicating phase segregation, increases with . For , has a large finite value, and it becomes almost constant for . Unless mentioned otherwise, we set for the simulation results presented in this article. For the same electric field range, we have also verified that such a phase transition is absent even in a charge asymmetric electrolyte solution, where the positive ions carry charge each, the negative ions carry charge each, and (Fig. 1h). Typical NESS snapshots for all these cases are provided in Fig. S2 in the Supporting Information.
Explanation of charge segregation.
Based on the results described above, we present a simple physical explanation for the emergence of charge segregation in the polyelectrolyte solution. In the presence of the external drive, the oppositely moving polyelectrolyte chains and counterions collide frequently with each other. As the electric field is increased, the two oppositely charged species start to move increasingly faster, producing more and more collisions between them. In order to avoid the energetically expensive collisions (friction) between the sliding charge fronts of polyelectrolytes and counterions, the colliding charges tend to diffuse away from each other along the transverse directions to the drive ( and in our case). Consequently, the polyelectrolyte solution self-organizes and segregates to form distinct lanes of like-charges, thereby enhancing transport. Moreover, since chains with show segregation but not the charge symmetric/asymmetric electrolytes with the same amount of total charge (Fig. 1h), this suggests that it is the excluded volume effects of the spatially extended flexible polyelectrolyte chains, and the resulting friction, that trigger charge segregation (lane formation) in the polyelectrolyte solution.
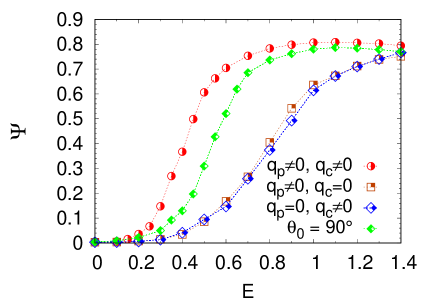
Our explanation can be made more convincing by studying a few instructive test cases. First, we make one of the species, either the counterions or the polyelectrolyte chains, charge neutral. Even for this somewhat pathological test case, a macroscopic segregation is observed in the presence of the electric field drive. This is shown in Fig. 2, where () denotes the charge on the polyelectrolyte chains (counterions). Note that phase segregation with only one charged species is less pronounced, since the relative motion between the charges is reduced, and therefore, the friction is lower, for a fixed drive. For the second test case, we intentionally suppress the excluded volume interactions of the polyelectrolyte chains. This can be achieved in simulations by using bond angle potentials of the form with equilibrium angle between the polyelectrolyte bonds. The bond angles restrict the polyelectrolyte chains to preferentially more collapsed configurations, and consequently, suppress excluded volume interactions. In Fig. 2, the comparison of for the fully flexible chain (half-shaded red circles) and the semi-flexible chain (labeled as ‘’) is shown. Phase segregation is found to be suppressed and shifted to higher -fields for polyelectrolyte chains with reduced excluded volume. Thus, these two additional test cases demonstrate convincingly that it is the relative motion, and not the electrostatic interactions between the two species, that is responsible for the emergence of charge segregation. The moving polyelectrolyte chains, due to their chain connectivity and the resulting excluded volume effects, ‘sweep away’ the oppositely moving counterions from their path in order to avoid the energetically costly collisions, and the system spontaneously reorganizes to form two separate lanes of like-charges. Electrostatic interactions only affect the segregation phenomenon quantitatively, such as the critical electric field magnitude and the degree of phase segregation. Also, in the NESS, instead of multiple lanes, only two macroscopic lanes form (as seen in the snapshots of Figs. 1d and 1e), since such a charge configuration leads to minimum number of collision events between the two species (hence lowest friction), and is therefore maximally favored.
Re-entrance phenomenon.
Strikingly enough, keeping all the parameters the same, if we increase the electric field beyond (in Fig. 1a), the order parameter and the mobilities start to decrease (see Fig. S3 for data beyond in the Supporting Information). This implies that the macroscopically charge segregated system begins to approach a homogeneously mixed state at larger external drives. It seems reasonable to expect that, for extremely large electric fields, one would observe a total re-entrant transition from a strongly demixed state to a fully mixed state again, indicated by . Since it is computationally difficult to access very large electric fields for a polyelectrolyte solution (due the presence of the FENE bonds), we speculate that the effects of strong nonlinearity would perhaps be more prominent and therefore easier to observe in the presence of multivalent counterions.
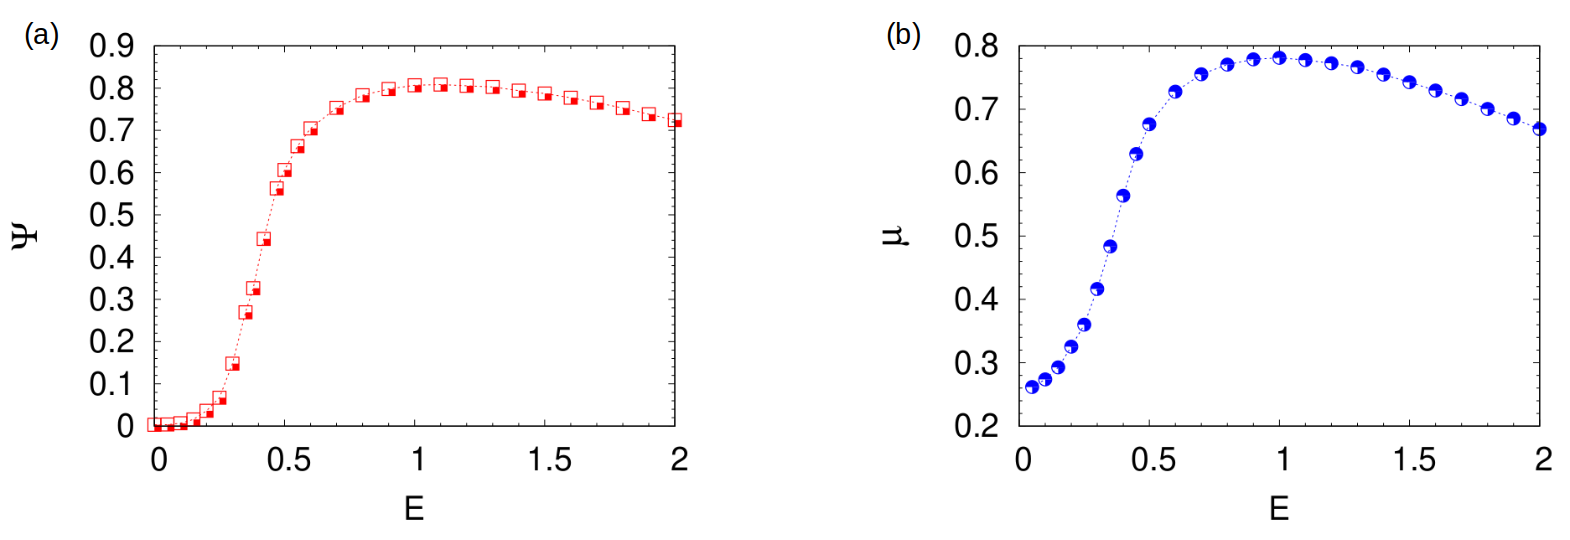
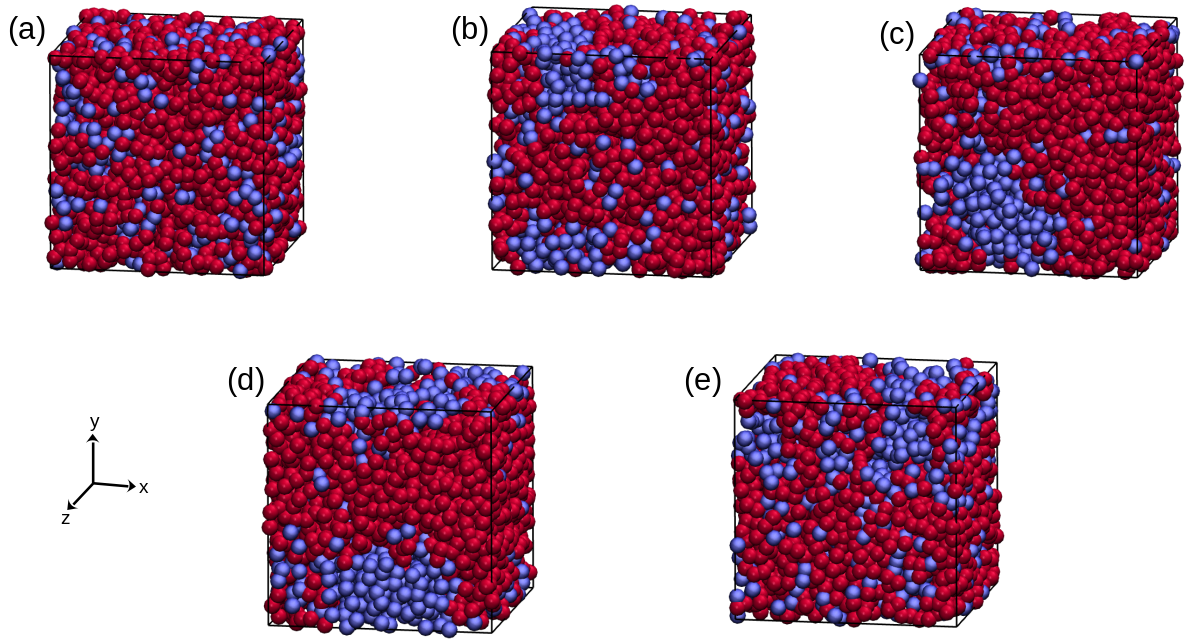
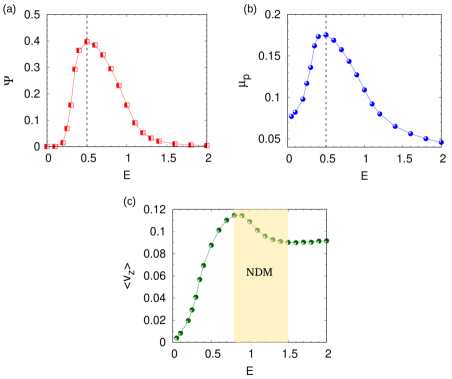
The segregation order parameter of the polyelectrolyte solution with trivalent counterions is shown in Fig. 3a. For this case, the re-entrance from a phase segregated to a mixed phase () can be clearly seen. Compared to monovalent counterions, the phase segregation with trivalent counterions is much less pronounced due to the stronger electrostatic correlations in the latter, and total re-entrance () happens at a much lower drive, . Thus, for very small () and large () external drives, we obtain , whereas for , we find charge segregation (). We believe that the behavior for the monovalent counterion case will be qualitatively similar, but it will require much higher electric fields to observe the complete re-entrance. To the best of our knowledge, a re-entrance of this type has not been reported in the studies of driven binary colloids so far, and therefore, it remains to be seen, if such a phenomenon occurs there as well, for extremely large external drives. For 2D athermal disks with additional friction built into the model, a similar re-entrance behavior has been recently observed 41. For 2D colloids, a different kind of re-entrance has been reported in the past 29, that happens for a fixed as the volume fraction is increased. Representative snapshots of the multivalent polyelectrolyte solution for different -fields are provided in Fig. S4 of the Supporting Information.
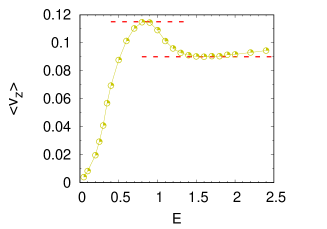
Mobilities.
The signature of the phase segregation and re-entrance phenomena can also be clearly observed by computing the mobilities and . The two mobilities show identical behavior in the NESS, and therefore, we drop the subscripts: . As the external drive in increased from zero, the polyelectrolyte solution starts to phase segregate, and gradually increases. Remarkably, beyond (Fig. 3a), when the electric field is increased further, , instead of increasing, decreases sharply, see Fig. 3b. In other words, as the electric field is increased from zero, the mobility exhibits a transition from a positive slope () to a negative slope (), which coincides perfectly with the emergence of the re-entrance phase. This reduction in mobility for reduces the friction between the oppositely moving charges and allows the system to again get mixed, leading to the re-entrance.
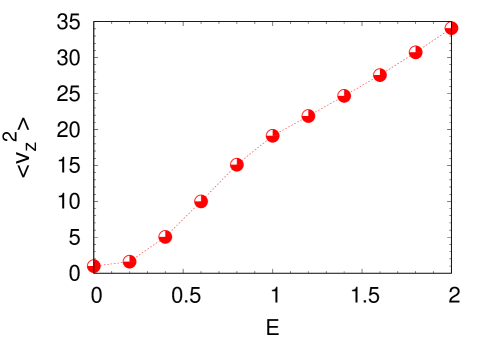
Furthermore, along the negative slope of the curve, for , quite counter-intuitively, we find a regime where the average drift velocity of the charges, , decreases as the external drive is increased. This anomalous phenomenon is known as the negative differential mobility (NDM), defined as (shaded portion in Fig. 3c). Here again, we have omitted the subscripts, and normalized the drift velocities, and , by their respective charges: . It is to be noted that NDM () is not the same as absolute negative mobility, , which has also been observed in some systems 42, 43, 44, 45.
The puzzling NDM regime, and negative response functions in general, have been observed and extensively studied in a variety of systems relevant to statistical physics, soft matter physics, and condensed matter physics. This includes minimalistic toy models of random walkers, exclusion processes, and conserved lattice gas models 46, 47, 48, 49, 50, to more complicated and realistic physical systems, such as, colloidal particles 51, glass formers 52, laminar flows 53, ring polymers in gel electrophoresis 54, 55, active matter systems 56, and superconductors 57, to name a few. Other transport coefficients have also been known to show similar negative differential response far away from equilibrium, e.g., heat conductivity in the presence of a thermal bias 58, 59, 60, 61. Thus, negative responses, described aptly by the phrase ‘getting more from pushing less’ 46, can be expected to appear quite generally under nonequilibrium conditions. Here we present another many-body interacting system, namely, linear polyelectrolytes with multivalent counterions, that exhibits NDM in the presence of an electric field drive.
Based on the ideas behind the formulation of generalized fluctuation-response relation in nonequilibrium 46, 62, 63, 47, we describe below an intuitive trapping mechanism to explain the re-entrance, the emergence of the negative slope in the curve, and the NDM regime. The explanation relies on the fact that at lower electric fields, , when polyelectrolyte chains encounter the oppositely moving counterions, the two species can easily diffuse along the transverse directions (), and glide past each other without getting strongly trapped (or stuck) for very long. However, as the electric field is increased to values beyond , the probability to escape the trap becomes smaller. The polyelectrolyte chains and the counterions get strongly trapped with one another more frequently, and each tries to drag the opposite species along with them toward the wrong direction. Thus the polyelectrolyte chains are trapped and dragged by the counterions in the direction, and vice-versa. This trapping mechanism creates hindrance to the unidirectional motion of the charges, thus slowing them down and leading to the decrease of the mobility with , as seen in Fig. 3b for large . For some values of the electric field, the effect of this trap-and-drag mechanism can become larger than electrokinetic push of the external drive, leading to the emergence of the counterintuitive NDM regime observed in Fig. 3c.
A subtle point to note here is that, unlike , is always monotonic, and hence the existence of NDM is not apparent from the variation of with (see Fig. S5 in the Supporting Information). However decreases in the NDM regime due to the rapid (undirected) back and forth motion of the charged particles along the direction, often described by terms such as ‘nervosity’ 47, ‘jitteriness’ 53 and ‘frenzy/frantic’ 64 etc., due to the trap-and-drag effect produced by the charges moving in the opposite direction. The nonequilibrium fluctuation-response formula 62, 63 predicts that NDM may arise in general when this frenetic term becomes sufficiently negative compared to the usual entropic term of the generalized Green-Kubo formula.
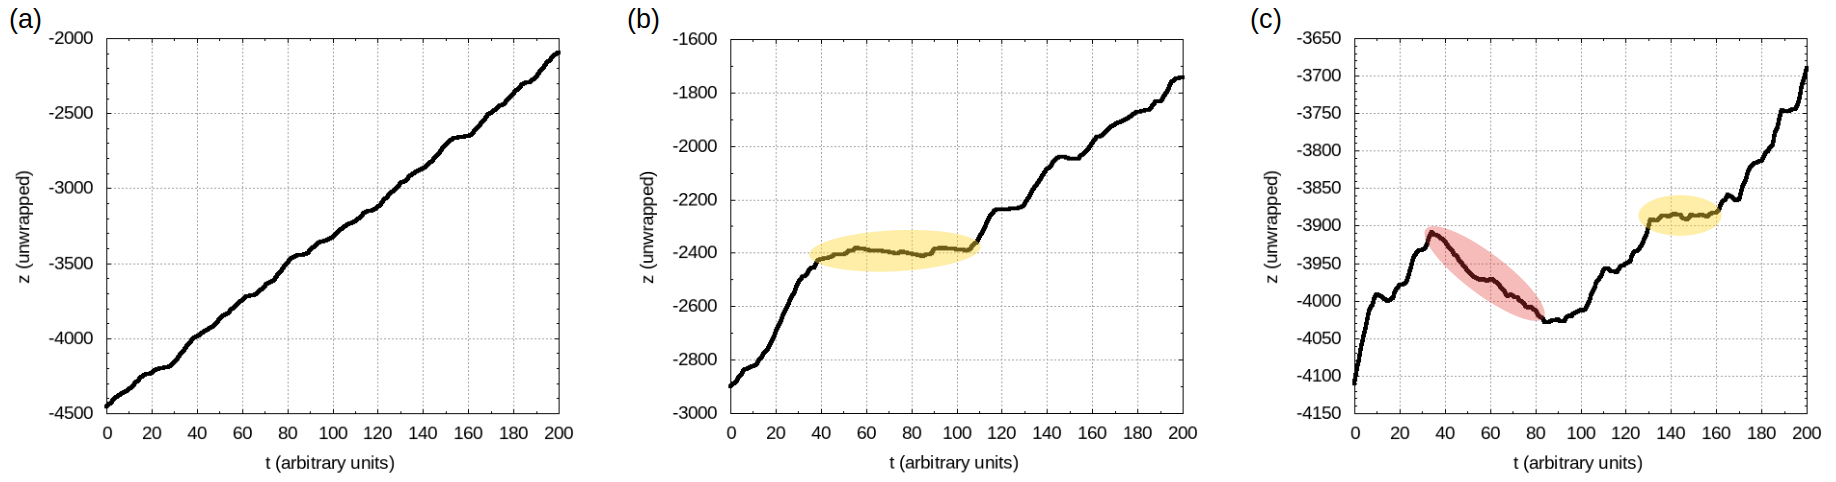
In the following, we demonstrate numerically that the trapping mechanism described above, leads to the observed features: re-entrance, nonmonotonic dependence, and the anomalous NDM regime. Here we treat the monomer as a ‘test particle’ (or a ‘tracer’/‘tagged’ particle) which is drifting through an environment of oppositely moving counterions that act as traps/obstacles. The motion of the counterions can be described and analyzed identically by considering them as the test particle and the monomers as traps.
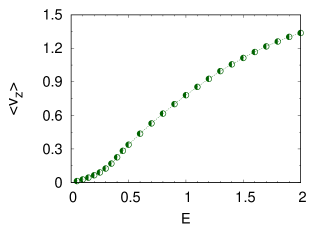
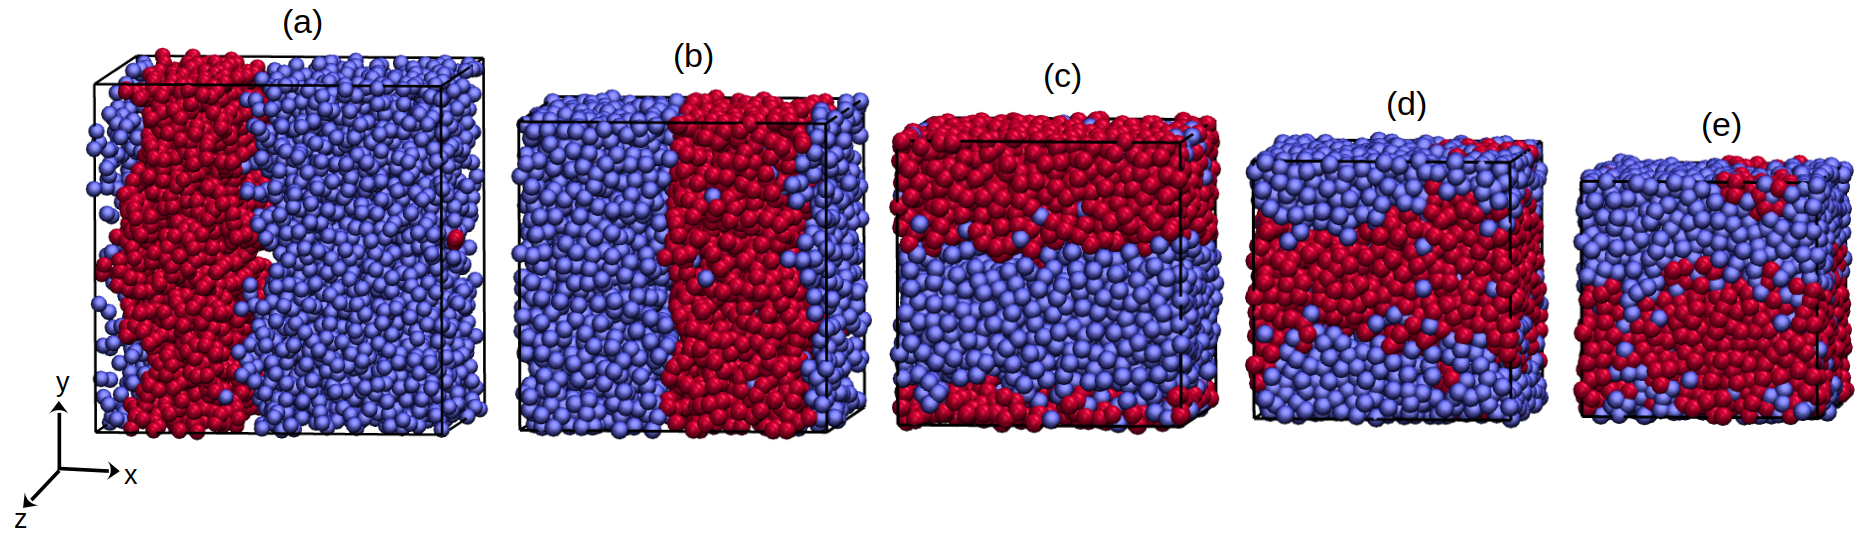
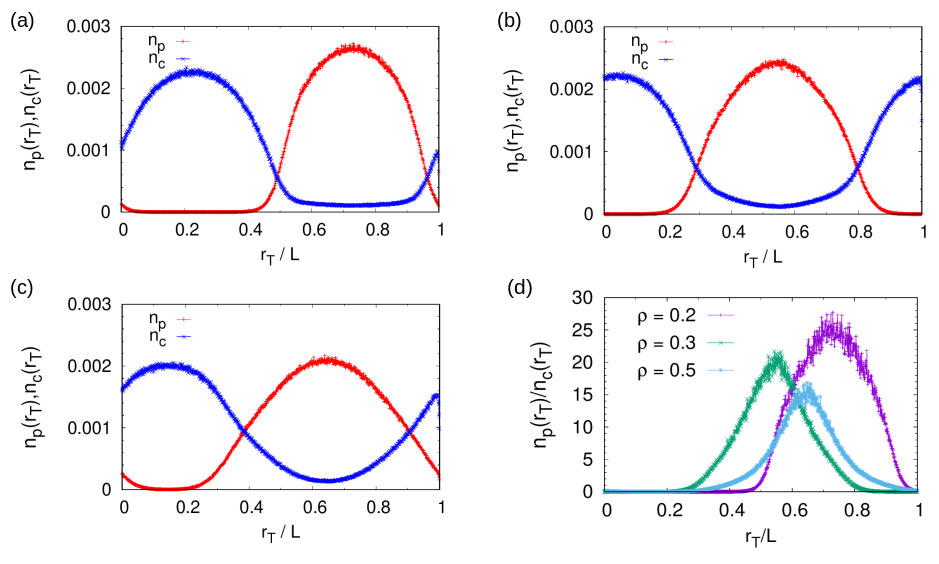
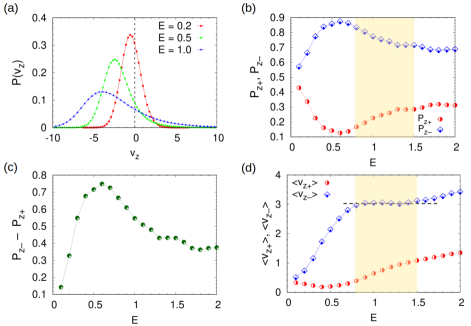
First, we compute the distribution of the drift velocity of all the monomers, denoted by and normalized to unity, for different values of the external drive. Three distributions for external drives , , and are shown in Fig. 4a. From this distribution we compute the fraction of monomers that are moving along the and the directions, denoted by and respectively. We also numerically compute the average drift velocities of these two groups, denoted by and respectively. From Fig. 4b, we find that both and are non-monotonic functions of the external drive , and their difference is shown in Fig. 4c. Below , as we increase the external drive, increases, implying that more and more monomers are moving along the direction in response to the external drive, as expected. However above , the scenario reverses. In this case, more and more monomers start to move toward the wrong direction (), being trapped and dragged along by the on-coming counterions, causing to decrease (Fig. 4c). The nonmonotonicity of with , at , gets directly reflected in the nonmonotonic behavior of mobility with (Fig. 3b).
Furthermore, in the shaded region of Figs. 4b and 4d, for , as the drive is increased, the fraction of monomers moving toward the wrong direction and their drift velocity, and , are found to increase sharply, whereas, the other fraction decreases sharply and remains fairly constant (dashed horizontal line in Fig. 4d). This complicated, and somewhat anomalous, dependence of these four quantities on the external field is precisely what triggers the counterintuitive NDM regime for , as seen in Fig. 3c. In fact, the trapping and dragging events mentioned here can be observed directly by visually inspecting the trajectories of individual beads in the solution, see Fig. S6 in Supporting Information.
For even larger drives, , and become fairly constant, and their drift velocities and again increase roughly at the same rate. The system comes out of the NDM regime, and for we obtain (zero differential mobility), see Fig. 3c. At even higher drive , the drift velocity shows a tendency to increase feebly, and one obtains a PDM regime again (see Fig. S7 in the Supporting Information). Thus, NDM is triggered due to a delicate competition between the trap-and-drag mechanism and the electrokinetic motion of the charges. The electric field plays two antagonistic roles simultaneously, albeit with varying degrees of effectiveness depending on the field strength: one one hand, it pushes the charges to move faster, and on the other, it increases trapping probability that slows them down. All the features discussed above are a consequence of the complex interplay between these two mutually conflicting traits of the external drive.
Note that the re-entrance regime starts at lower for the trivalent counterions due to their enhanced electrostatic interactions that make the trap-and-drag mechanism much more effective compared to monovalent counterions. Furthermore, for the range of the external drive simulated here, NDM can be seen in the polyelectrolyte solution with trivalent counterions, but is absent in the monovalent case (see Fig. S8 in the Supporting Information). In both cases we have the same density , and there are fewer particles in the trivalent case () compared to the monovalent case (). This clearly demonstrates that, it is the nature of interactions in a system, and not how ‘crowded’ the environment is, that determines whether or not NDM will be triggered, as has also been argued recently 49. However, it is possible that NDM also emerges for monovalent counterions at extremely large drives not easily accessible in our simulation.
Dependence on system parameters.
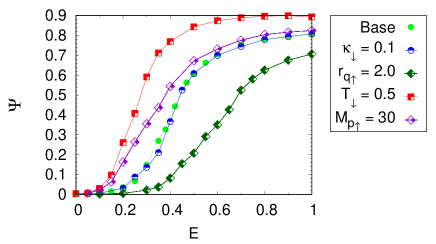
Finally, we systematically study the dependence of charge segregation on some of the important system parameters. The data are shown in Fig. 5 where the curve labeled ‘Base’ has the parameters , , , and . Each of the other curves has one of these parameters altered, keeping all the others the same. We find that, for the electrostatic interactions chosen here, decreasing the Debye screening factor to has very little impact on the order parameter. This also seems to be in agreement with the results of 3D binary colloids at lower densities 21. However, strengthening electrostatics by increasing the cutoff from to shifts the phase transition toward higher external drives, as is expected: the monomers and the counterions are more strongly correlated in the latter case, and therefore one needs a stronger external drive for charge segregation.
At a lower temperature, , thermal noise competes weakly with the external drive, and thereby enhances the electrokinetic motion of the charged particles. This increases the friction between the oppositely moving charged particle fronts, and triggers charge segregation at a lower external drive. Another way to think about this is in terms of the higher thermal diffusion of the charged particles at a higher , which tends to keep the system homogeneous, whereas the external drive induces lane formation (uphill diffusion). Consequently, at a lower temperature it is easier to charge segregate the polyelectrolyte solution, and therefore the order parameter has a higher value for the same -field.
For a higher degree of polymerization , we find that the segregation starts at a lower . When is higher, excluded volume interactions also become stronger, causing charge segregation at lower drives. Thus by changing these parameters as shown in Fig. 5, the threshold drive magnitude and the degree of phase segregation can be tuned as desired.
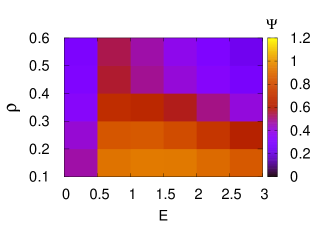
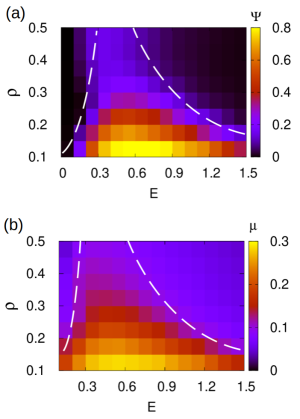
As is customary in studies of laning transition, we construct phase diagrams in the plane for the polyelectrolyte solution, indicating the charge segregation regime. The phase diagrams, showing the order parameter and the mobility , are presented in Fig. 6 for polyelectrolytes with trivalent counterions (again, because of the computational ease, compared to monovalent counterions). The complete phase diagrams with monovalent counterions are expected to be qualitatively similar (see discussions in Figs. S9 and S10 of the Supporting Information). It can be seen that the order parameter is tightly correlated with the mobility : the higher the mobility, the stronger is the phase segregation. From the phase diagrams, the segregation is found to be more pronounced for lower densities and is weaker for higher densities. This again can be explained from the fact that at high densities, electrokinetic motion of the charged particles is suppressed (see Fig. 6b), and consequently, the tendency toward phase segregation is lowered (Fig. 6a). Note that, even for high densities, there are distinct polyelectrolyte-rich and counterion-rich domains inside the simulation box in the presence of driving. However, for higher , the polyelectrolyte-rich region gets infiltrated by more counterions and charge segregation is less pronounced, see Fig. S11 in Supporting Information for related discussion. It is interesting to note that Fig. 6a is similar to the phase diagram for 2D rough disks under athermal conditions 41. This suggests that the properties for these driven soft-matter systems are quite generic, regardless of their specific details.
4 Summary and outlook
To summarize, we have studied a coarse-grained polyelectrolyte solution model with explicit counterions in an implicit water-like solvent, driven by a constant external electric field. The interparticle electrostatic interaction is deliberately chosen to be a weak screened Coulomb potential, such that it can compete with the drive that need not be too large (see Fig. S12 in the Supporting Information for some data and discussion with full long-range Coulomb interactions). In the absence of the drive, the charged monomers and counterions form a homogeneously mixed phase (). However, with the drive, the system spontaneously reorganizes, and forms two separate lanes of like-charges. This is a consequence of minimizing the energetically costly collisions (friction) between the oppositely moving monomers and counterions, thereby facilitating charge transport. Compared to charge symmetric and asymmetric electrolytes, the fully flexible polyelectrolyte chains have significantly stronger excluded volume interactions that lead to lane formation at rather low values of the external drive. This intriguing nonequilibrium phase transition exhibits no hysteresis and therefore has the signature of continuous equilibrium phase transition. At larger values of the external drive, we find that both the order parameter and the mobility decrease with the field, indicating a re-entrant transition. For the electric fields studied here, a complete re-entrance to a fully mixed phase is observed for the polyelectrolyte solution with trivalent counterions. The re-entrant phase is signaled by a sharp decrease of the mobility as the external drive is increased. Furthermore, we discover a regime where the differential mobility is negative in the presence of trivalent counterions, but such a regime is not observed for monovalent counterions under the same simulation conditions (for the -field range investigated here). The re-entrance phenomenon, the decrease of the mobility with electric field, and the negative differential mobility are inter-related, and can be explained consistently by an intuitive trapping mechanism between the two species of charges, drifting opposite to each other in response to the external drive. Thus, our coarse-grained simulations unravel a rich and complex nonequilibrium behavior of driven polyelectrolyte solutions. It is pertinent to mention here that spontaneous phase segregation in the presence of a nonequilibrium external drive shares a few similarities with segregation phenomena reported in other kinds of nonequilibria, such as in the presence of activity; see for example Refs. 65, 66, 67, 68 for phase separation in a mixture of active and passive (uncharged) particles.
We believe that the results presented above are the first steps toward a complete understanding of macroscopic charge segregation in driven polyelectrolytes. In the future, more detailed analyses can be performed to investigate various other aspects of charge segregation, re-entrance, negative differential mobility, and their dependencies on system parameters. Furthermore, these properties can be better understood by scrutinizing the conformations of the polyelectrolyte chains inside the lane, their velocity profiles perpendicular to the applied drive, the effects of geometric and dielectric confinement 69, 18, asymmetric interactions and bead sizes, solvent quality, polyelectrolyte backbone rigidity, oscillatory external drives, and so forth. Moreover, in this work, hydrodynamic effects have been completely ignored, and it will be interesting to find out the extent to which the results, in different regions of the phase diagram, get modified by hydrodynamic interactions. We plan to focus on some of these issues in future works. The coarse-grained polyelectrolyte model studied here can be thought of as a representation of flexible polyelectrolytes, such as single-stranded DNA/RNA and sodium polystyrene sulfonate (NaPSS). Since the phase segregation in polyelectrolytes happens at much lower electric field drives compared to electrolytes (or colloids), it seems feasible to perform relatively simple laboratory experiments to verify the results presented in this work. Hopefully, improved understanding of the self-organization phenomena in such driven complex fluids will allow us to fabricate, control, and manipulate soft-matter systems more efficiently in the future.
The author thanks S. Dutta and U. Basu for useful discussions. The support of the Department of Atomic Energy, Government of India, under project no. RTI4001 is also acknowledged. The numerical computations were performed on the Mario HPC at ICTS-TIFR, Bengaluru, India.
References
- Dobrynin and Rubinstein 2005 Dobrynin, A. V.; Rubinstein, M. Theory of polyelectrolytes in solutions and at surfaces. Progress in Polymer Science 2005, 30, 1049–1118
- Netz and Andelman 2007 Netz, R. R.; Andelman, D. Polyelectrolytes in Solution and at Surfaces. Encyclopedia of Electrochemistry: Online 2007,
- Rubinstein and Papoian 2012 Rubinstein, M.; Papoian, G. A. Polyelectrolytes in biology and soft matter. Soft Matter 2012, 8, 9265–9267
- Muthukumar 2017 Muthukumar, M. 50th anniversary perspective: A perspective on polyelectrolyte solutions. Macromolecules 2017, 50, 9528–9560
- Jin et al. 2003 Jin, W.; Toutianoush, A.; Tieke, B. Use of polyelectrolyte layer-by-layer assemblies as nanofiltration and reverse osmosis membranes. Langmuir 2003, 19, 2550–2553
- Wang and Wang 2011 Wang, D.; Wang, X. Self-assembled graphene/azo polyelectrolyte multilayer film and its application in electrochemical energy storage device. Langmuir 2011, 27, 2007–2013
- Kim et al. 2020 Kim, J. Y.; Nagamani, S.; Liu, L.; Elghazaly, A. H.; Solin, N.; Inganäs, O. A DNA and self-doped conjugated polyelectrolyte assembled for organic optoelectronics and bioelectronics. Biomacromolecules 2020, 21, 1214–1221
- Ishihara et al. 2019 Ishihara, M.; Kishimoto, S.; Nakamura, S.; Sato, Y.; Hattori, H. Polyelectrolyte complexes of natural polymers and their biomedical applications. Polymers 2019, 11, 672
- Mulligan et al. 2020 Mulligan, M. J.; Lyke, K. E.; Kitchin, N.; Absalon, J.; Gurtman, A.; Lockhart, S.; Neuzil, K.; Raabe, V.; Bailey, R.; Swanson, K. A., et al. Phase I/II study of COVID-19 RNA vaccine BNT162b1 in adults. Nature 2020, 586, 589–593
- Netz 2003 Netz, R. Nonequilibrium unfolding of polyelectrolyte condensates in electric fields. Physical review letters 2003, 90, 128104
- Netz 2003 Netz, R. Polyelectrolytes in electric fields. The Journal of Physical Chemistry B 2003, 107, 8208–8217
- Brun et al. 2008 Brun, L.; Pastoriza-Gallego, M.; Oukhaled, G.; Mathé, J.; Bacri, L.; Auvray, L.; Pelta, J. Dynamics of polyelectrolyte transport through a protein channel as a function of applied voltage. Physical review letters 2008, 100, 158302
- Wei and Hsiao 2009 Wei, Y.-F.; Hsiao, P.-Y. Unfolding polyelectrolytes in trivalent salt solutions using dc electric fields: A study by Langevin dynamics simulations. Biomicrofluidics 2009, 3, 022410
- Tang et al. 2011 Tang, J.; Du, N.; Doyle, P. S. Compression and self-entanglement of single DNA molecules under uniform electric field. Proceedings of the National Academy of Sciences 2011, 108, 16153–16158
- Klotz et al. 2017 Klotz, A. R.; Narsimhan, V.; Soh, B. W.; Doyle, P. S. Dynamics of DNA knots during chain relaxation. Macromolecules 2017, 50, 4074–4082
- Suma et al. 2018 Suma, A.; Di Stefano, M.; Micheletti, C. Electric-field-driven trapping of polyelectrolytes in needle-like backfolded states. Macromolecules 2018, 51, 4462–4470
- Mahinthichaichan et al. 2020 Mahinthichaichan, P.; Tsai, C.-C.; Payne, G. F.; Shen, J. Polyelectrolyte in Electric Field: Disparate Conformational Behavior along an Aminopolysaccharide Chain. ACS omega 2020, 5, 12016–12026
- Bagchi and Olvera de la Cruz 2020 Bagchi, D.; Olvera de la Cruz, M. Dynamics of a driven confined polyelectrolyte solution. The Journal of Chemical Physics 2020, 153, 184904
- Radhakrishnan and Singh 2021 Radhakrishnan, K.; Singh, S. P. Collapse of a Confined Polyelectrolyte Chain under an AC Electric Field. Macromolecules 2021, 54, 7998–8007
- Viovy 2000 Viovy, J.-L. Electrophoresis of DNA and other polyelectrolytes: Physical mechanisms. Reviews of Modern Physics 2000, 72, 813
- Dzubiella et al. 2002 Dzubiella, J.; Hoffmann, G.; Löwen, H. Lane formation in colloidal mixtures driven by an external field. Physical Review E 2002, 65, 021402
- Rex and Löwen 2007 Rex, M.; Löwen, H. Lane formation in oppositely charged colloids driven by an electric field: Chaining and two-dimensional crystallization. Physical review E 2007, 75, 051402
- Rex et al. 2008 Rex, M.; Royall, C. P.; van Blaaderen, A.; Löwen, H. Lane formation in driven colloidal mixtures: is it continuous or discontinuous? arXiv preprint arXiv:0812.0908 2008,
- Frank and Winkler 2009 Frank, S.; Winkler, R. G. Mesoscale hydrodynamic simulation of short polyelectrolytes in electric fields. The Journal of chemical physics 2009, 131, 234905
- Wysocki and Löwen 2009 Wysocki, A.; Löwen, H. Oscillatory driven colloidal binary mixtures: Axial segregation versus laning. Physical Review E 2009, 79, 041408
- Glanz and Löwen 2012 Glanz, T.; Löwen, H. The nature of the laning transition in two dimensions. Journal of Physics: Condensed Matter 2012, 24, 464114
- Li et al. 2021 Li, B.; Wang, Y.-L.; Shi, G.; Gao, Y.; Shi, X.; Woodward, C. E.; Forsman, J. Phase Transitions of Oppositely Charged Colloidal Particles Driven by Alternating Current Electric Field. ACS nano 2021, 15, 2363–2373
- Chakrabarti et al. 2003 Chakrabarti, J.; Dzubiella, J.; Löwen, H. Dynamical instability in driven colloids. EPL (Europhysics Letters) 2003, 61, 415
- Chakrabarti et al. 2004 Chakrabarti, J.; Dzubiella, J.; Löwen, H. Reentrance effect in the lane formation of driven colloids. Physical Review E 2004, 70, 012401
- Kohl et al. 2012 Kohl, M.; Ivlev, A. V.; Brandt, P.; Morfill, G. E.; Löwen, H. Microscopic theory for anisotropic pair correlations in driven binary mixtures. Journal of Physics: Condensed Matter 2012, 24, 464115
- Klymko et al. 2016 Klymko, K.; Geissler, P. L.; Whitelam, S. Microscopic origin and macroscopic implications of lane formation in mixtures of oppositely driven particles. Physical Review E 2016, 94, 022608
- Geigenfeind et al. 2020 Geigenfeind, T.; de las Heras, D.; Schmidt, M. Superadiabatic demixing in nonequilibrium colloids. Communications Physics 2020, 3, 1–13
- Leunissen et al. 2005 Leunissen, M. E.; Christova, C. G.; Hynninen, A.-P.; Royall, C. P.; Campbell, A. I.; Imhof, A.; Dijkstra, M.; Van Roij, R.; Van Blaaderen, A. Ionic colloidal crystals of oppositely charged particles. Nature 2005, 437, 235–240
- Vissers et al. 2011 Vissers, T.; Wysocki, A.; Rex, M.; Löwen, H.; Royall, C. P.; Imhof, A.; van Blaaderen, A. Lane formation in driven mixtures of oppositely charged colloids. Soft Matter 2011, 7, 2352–2356
- Poncet et al. 2017 Poncet, A.; Bénichou, O.; Démery, V.; Oshanin, G. Universal long ranged correlations in driven binary mixtures. Physical review letters 2017, 118, 118002
- Grünwald et al. 2016 Grünwald, M.; Tricard, S.; Whitesides, G. M.; Geissler, P. L. Exploiting non-equilibrium phase separation for self-assembly. Soft Matter 2016, 12, 1517–1524
- Shen et al. 2021 Shen, K.-H.; Fan, M.; Hall, L. M. Molecular Dynamics Simulations of Ion-Containing Polymers Using Generic Coarse-Grained Models. Macromolecules 2021, 54, 2031–2052
- Plimpton 1995 Plimpton, S. Fast parallel algorithms for short-range molecular dynamics. Journal of computational physics 1995, 117, 1–19
- Killer et al. 2016 Killer, C.; Bockwoldt, T.; Schütt, S.; Himpel, M.; Melzer, A.; Piel, A. Phase separation of binary charged particle systems with small size disparities using a dusty plasma. Physical review letters 2016, 116, 115002
- Netz 2003 Netz, R. Conduction and diffusion in two-dimensional electrolytes. EPL (Europhysics Letters) 2003, 63, 616
- Samsuzzaman et al. 2021 Samsuzzaman, M.; Sayeed, A.; Saha, A. Reentrant Melting of Lanes of Rough Circular Discs. arXiv preprint arXiv:2103.13589 2021,
- Eichhorn et al. 2002 Eichhorn, R.; Reimann, P.; Hänggi, P. Brownian motion exhibiting absolute negative mobility. Physical review letters 2002, 88, 190601
- Joanny et al. 2003 Joanny, J.-F.; Jülicher, F.; Prost, J. Motion of an adhesive gel in a swelling gradient: a mechanism for cell locomotion. Physical review letters 2003, 90, 168102
- Ros et al. 2005 Ros, A.; Eichhorn, R.; Regtmeier, J.; Duong, T. T.; Reimann, P.; Anselmetti, D. Absolute negative particle mobility. Nature 2005, 436, 928–928
- Machura et al. 2007 Machura, L.; Kostur, M.; Talkner, P.; Łuczka, J.; Hänggi, P. Absolute negative mobility induced by thermal equilibrium fluctuations. Physical review letters 2007, 98, 040601
- Zia et al. 2002 Zia, R.; Praestgaard, E.; Mouritsen, O. Getting more from pushing less: Negative specific heat and conductivity in nonequilibrium steady states. American Journal of Physics 2002, 70, 384–392
- Basu and Maes 2014 Basu, U.; Maes, C. Mobility transition in a dynamic environment. Journal of Physics A: Mathematical and Theoretical 2014, 47, 255003
- Bénichou et al. 2014 Bénichou, O.; Illien, P.; Oshanin, G.; Sarracino, A.; Voituriez, R. Microscopic theory for negative differential mobility in crowded environments. Physical Review Letters 2014, 113, 268002
- Baiesi et al. 2015 Baiesi, M.; Stella, A. L.; Vanderzande, C. Role of trapping and crowding as sources of negative differential mobility. Physical Review E 2015, 92, 042121
- Chatterjee et al. 2018 Chatterjee, A. K.; Basu, U.; Mohanty, P. Negative differential mobility in interacting particle systems. Physical Review E 2018, 97, 052137
- Eichhorn et al. 2010 Eichhorn, R.; Regtmeier, J.; Anselmetti, D.; Reimann, P. Negative mobility and sorting of colloidal particles. Soft Matter 2010, 6, 1858–1862
- Jack et al. 2008 Jack, R. L.; Kelsey, D.; Garrahan, J. P.; Chandler, D. Negative differential mobility of weakly driven particles in models of glass formers. Physical Review E 2008, 78, 011506
- Sarracino et al. 2016 Sarracino, A.; Cecconi, F.; Puglisi, A.; Vulpiani, A. Nonlinear response of inertial tracers in steady laminar flows: Differential and absolute negative mobility. Physical review letters 2016, 117, 174501
- Michieletto et al. 2015 Michieletto, D.; Baiesi, M.; Orlandini, E.; Turner, M. S. Rings in random environments: sensing disorder through topology. Soft Matter 2015, 11, 1100–1106
- Iubini et al. 2018 Iubini, S.; Orlandini, E.; Michieletto, D.; Baiesi, M. Topological sieving of rings according to their rigidity. ACS Macro Letters 2018, 7, 1408–1412
- Reichhardt and Reichhardt 2017 Reichhardt, C.; Reichhardt, C. O. Negative differential mobility and trapping in active matter systems. Journal of Physics: Condensed Matter 2017, 30, 015404
- Gutierrez et al. 2009 Gutierrez, J.; Silhanek, A.; Van de Vondel, J.; Gillijns, W.; Moshchalkov, V. Transition from turbulent to nearly laminar vortex flow in superconductors with periodic pinning. Physical Review B 2009, 80, 140514
- Li et al. 2006 Li, B.; Wang, L.; Casati, G. Negative differential thermal resistance and thermal transistor. Applied Physics Letters 2006, 88, 143501
- Yang et al. 2007 Yang, N.; Li, N.; Wang, L.; Li, B. Thermal rectification and negative differential thermal resistance in lattices with mass gradient. Physical Review B 2007, 76, 020301
- Bagchi 2013 Bagchi, D. Thermal rectification and negative differential thermal resistance in a driven two segment classical Heisenberg chain. Journal of Physics: Condensed Matter 2013, 25, 496006
- Bagchi 2015 Bagchi, D. Thermally driven classical Heisenberg chain with a spatially varying magnetic field: thermal rectification and negative differential thermal resistance. Journal of Statistical Mechanics: Theory and Experiment 2015, 2015, P02015
- Baiesi et al. 2009 Baiesi, M.; Maes, C.; Wynants, B. Fluctuations and response of nonequilibrium states. Physical review letters 2009, 103, 010602
- Baerts et al. 2013 Baerts, P.; Basu, U.; Maes, C.; Safaverdi, S. Frenetic origin of negative differential response. Physical Review E 2013, 88, 052109
- Maes 2020 Maes, C. Frenesy: Time-symmetric dynamical activity in nonequilibria. Physics Reports 2020, 850, 1–33
- McCandlish et al. 2012 McCandlish, S. R.; Baskaran, A.; Hagan, M. F. Spontaneous segregation of self-propelled particles with different motilities. Soft Matter 2012, 8, 2527–2534
- Stenhammar et al. 2015 Stenhammar, J.; Wittkowski, R.; Marenduzzo, D.; Cates, M. E. Activity-induced phase separation and self-assembly in mixtures of active and passive particles. Physical review letters 2015, 114, 018301
- Smrek and Kremer 2017 Smrek, J.; Kremer, K. Small activity differences drive phase separation in active-passive polymer mixtures. Physical review letters 2017, 118, 098002
- Dolai et al. 2018 Dolai, P.; Simha, A.; Mishra, S. Phase separation in binary mixtures of active and passive particles. Soft Matter 2018, 14, 6137–6145
- Bagchi et al. 2020 Bagchi, D.; Nguyen, T. D.; de la Cruz, M. O. Surface polarization effects in confined polyelectrolyte solutions. Proceedings of the National Academy of Sciences 2020, 117, 19677–19684
Graphical Table of Content Image
Macroscopic charge segregation in driven polyelectrolyte solutions (Supporting Information)
This document contains supporting figures and additional discussions to help develop a clearer understanding of the charge segregation phenomenon in driven polyelectrolyte solutions.