∎
Monash University
Wellington Rd, Clayton VIC 3800, Australia
22email: Chiranjibi.Sitaula@monash.edu 33institutetext: TB. Shahi 44institutetext: Central Department of Computer Science and Information Technology
Tribhuvan University
TU Rd, Kirtipur 44618, Kathmandu, Nepal
44email: tejshahi@cdcsit.edu.np
Multi-channel CNN to classify nepali covid-19 related tweets using hybrid features
Abstract
Because of the current COVID-19 pandemic with its increasing fears among people, it has triggered several health complications such as depression and anxiety. Such complications have not only affected the developed countries but also developing countries such as Nepal. These complications can be understood from peoples’ tweets/comments posted online after their proper analysis and sentiment classification. Nevertheless, owing to the limited number of tokens/words in each tweet, it is always crucial to capture multiple information associated with them for their better understanding. In this study, we, first, represent each tweet by combining both syntactic and semantic information, called hybrid features. The syntactic information is generated from the bag of words method, whereas the semantic information is generated from the combination of the fastText-based (ft) and domain-specific (ds) methods. Second, we design a novel multi-channel convolutional neural network (MCNN), which ensembles the multiple CNNs, to capture multi-scale information for better classification. Last, we evaluate the efficacy of both the proposed feature extraction method and the MCNN model classifying tweets into three sentiment classes (positive, neutral and negative) on NepCOV19Tweets dataset, which is the only public COVID-19 tweets dataset in Nepali language. The evaluation results show that the proposed hybrid features outperform individual feature extraction methods with the highest classification accuracy of 69.7% and the MCNN model outperforms the existing methods with the highest classification accuracy of 71.3% during classification.
Keywords:
SARS-Cov2 Sentiment analysis Deep learning Natural language processing Classification Machine learning1 Introduction
COVID-19, which is also called SARS-COV2, is one of the deadliest viruses that have killed millions of people around the globe and still threatening to the humanity. The reason of death is not only attributed to its severe infections but also mental and psychological disorders triggered by its fear. Such disorders could be understood from the social media contents (e.g., tweets, posts, comments, etc.) provided by the users during this pandemic. The analysis of such contents could identify their mental status, thereby preventing from further health deterioration.
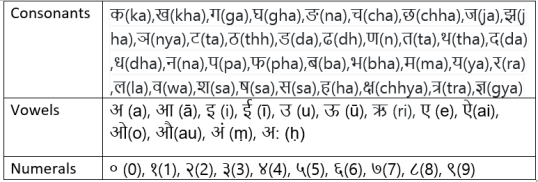
There are several works conducted to analyze the COVID-19 tweets in non-Nepali (Boon-Itt and Skunkan, 2020; De Melo and Figueiredo, 2021; Aljameel et al, 2021) and Nepali language (Sitaula et al, 2021; Shahi and Sitaula, 2021), which has a complex structure (Sitaula and Yadav, 2013; Sitaula, 2012). These research works in both Nepali and non-Nepali language utilize the basic feature extraction methods (e.g., term-frequency & inverse document frequency, bag of words, etc.) only, which limit other discriminating information related to them. Particularly, tweets, which are shorter in length, need multiple information to distinguish them more accurately into positive, neutral and negative classes. Also, the feature extraction methods and classification models employed in non-Nepali, which are mostly conducted in high-source language, might not be applicable to the low-resource languages such as Nepali language. Nepali language is based on Devanagari script, which contains 36 consonants. Among them, 33 are distinct consonants, whereas 3 are combined consonants), 13 vowels, and 10 numerals (see the details in Fig. 1).
To address the aforementioned limitations, we perform the following tasks. We propose to use both syntactic (bag of words) and semantic information (domain-specific (Sitaula et al, 2021) and fastText-based (Bojanowski et al, 2017)). The syntactic information help capture the token occurrence patterns within input tweet and tweets among other classes. Furthermore, the semantic information help capture contextual information. The combination of both syntactic and semantic information helps better understand the tweet in multiple ways and work complementary to each other. Furthermore, the discriminability of each tweet could further be improved by capturing the multi-scale features, which can be achieved by a multi-scale convolution neural network(MCNN). For this reason, we propose the novel MCNN model for the classification purpose.
Herein, our paper possesses the following contributions:
-
(i)
propose a novel multi-channel convolutional neural network, called the MCNN model, to train in an end-to-end manner for the classification of the Nepali COVID-19 related tweets into three different sentiment classes (positive, neutral, and negative);
-
(ii)
propose a novel hybrid feature extraction method combining both syntactic (bag of words) and semantic (domain-specific and fastText-based) in the Nepali language context; and
-
(iii)
demonstrate the superiority in terms of well-established metrics of our proposed feature extraction method and the MCNN model on NepCov19Tweets dataset.
The overall paper is organized as follows. Section 2 mentions the related works of our study, including both Nepali and non-Nepali language processing. Furthermore, Section 3 presents the required resources and the proposed methods, which is followed by the experimental results and their discussion in Section 4. Finally, the paper is concluded in Section 5.
2 Related works
We study the COVID-19 related tweets classification for sentiment analysis in terms of two different aspects: non-Nepali and Nepali. Although there are some more works carried out in non-Nepali language, very few works have been carried out in Nepali language.
Under non-Nepali language, COVID-19 tweets sentiment classification tasks were carried out in different languages (e.g., Arabic, English, etc.). For example, Boon-Itt and Skunkan (2020) released the public dataset of COVID-19 related tweets for the sentiment classification in English. At first, Chandrasekaran et al (2020) and Xue et al (2020) employed the topic modeling approach over the COVID-19 tweets to identify the tweets. However, Rustam et al (2021) used the traditional machine learning classifiers for the classification of tweets into three different classes, which achieves a classification accuracy of 93.00% with Extreme Tree classifier (ETC). At the same time, researchers in Kaur et al (2021) employed the hybrid heterogeneous support vector machine (HH-SVM) to classify the COVID-19 tweets, which outperforms the recurrent neural network classifier (RNN). Considering the efficacy of different machine learning classifiers, Naseem et al (2021) used different classifiers and found that fine-tuned BERT model imparts a classification accuracy of 92.90% during the classification of COVID-19 related tweets. Similarly, Basiri et al (2021) developed the ensemble deep learning model to classify the COVID-19 related tweets into different sentiment classes, which produce a classification accuracy of 85.80%. Furthermore, De Melo and Figueiredo (2021) utilized the sentiment classification on Brazilian tweets related to COVID-19, whereas Aljameel et al (2021) conducted the sentiment analysis on COVID-19 tweets collected in Arabic language, which provides a classification accuracy of 85% with the support vector machine classifier. For the classification of tweets into different sentiment classes (e.g., positive, neutral and negative), they used well-established popular classifiers such as eXtreme gradient boosting (XGBoost), Long short-term memory (LSTM) and Extra tree classier. For the feature extraction, they used popular feature extraction methods such as bag of words and word embedding.
Under Nepali language, there is only one work carried out recently to classify and represent the COVID-19 tweets into three different sentiment classes (positive, neutral and negative). For instance, Sitaula et al (2021) developed a novel approach to classify the Nepali COVID-19 related tweets into three sentiment classes (negative, positive and neutral). They used domain-specific (ds), domain-agnostic (da), and fastText (ft) based information for the representation of each tweet and trained individual CNNs for each of them. Finally, the ensemble model was designed to exploit all three kinds of information for the classification, which provides the classification accuracy of 68.7%. In addition, there are some closely related works carried out in Nepali language. For example, Shahi and Pant (2018) and Basnet and Timalsina (2018) represented the Nepali texts using bag of words and classified using the support vector machine classifier (classification accuracy: 74.65%) and LSTM (classification accuracy: 84.63%), respectively. Similarly, Subba et al (2019) employed bag of words approach to represent the Nepali text and classify them using deep neural network. More recently, Sitaula et al (2021) designed a supervised codebook approach to represent the Nepali texts and classified them using support vector machine classifier, which provides an accuracy of 89.58%. It is noticed that bag of words (BoW) and traditional machine learning (ML) classifiers have been preferred for the Nepali text representation and classification, respectively. However, there is still lacking in the use and adoption of contextual information to enrich the representational ability of Nepali texts to achieve an excellent classification performance.
3 Materials and methods
3.1 Dataset
We use the dataset, called NepCov19Tweets (Sitaula et al, 2021), in this study, which has three challenging classes–positive, neutral, and negative– having a higher inter-class similarity and intra-class dissimilarity problems. This dataset is the only publicly available dataset to perform the sentiment analysis of Nepali COVID-19 related tweets, which has 33,247 total tweets (positive class: 14,957 samples; neutral class: 4,744 samples; and negative class: 13,546 samples).
3.2 Evaluation metrics
We evaluate our method using widely-used performance metrics such as Precision (Eq. (1)), Recall (Eq. (2)), F1-score (Eq. (3)), and Accuracy (Eq. (4)).
| (1) |
| (2) |
| (3) |
| (4) |
where , , , and represent true positive, true negative, false positive, and false negative, respectively. Similarly, , , , and represent Precision, Recall, F1-score, and Accuracy, respectively.
3.3 Machine learning algorithms
In this study, we evaluate and compare eight popular machine learning baseline algorithms with our proposed multi-channel convolutional neural network classifier (MCNN). They are Support Vector Machine (SVM) (both linear and radial basis function) (Cristianini et al, 2000), Random Forest (RF) (Priyatikanto et al, 2020), eXtreme Gradient Boosting (XGBoost) (Chen and Guestrin, 2016), Naive Bayes (NB) (Pedregosa et al, 2011), Artificial Neural Network (ANN) (Dimililer, 2013), Logistic Regression (LR) (Fan et al, 2008), and K-Nearest Neighbors (K-NN) (Mucherino et al, 2009). The selection of these algorithms ranges from the traditional machine learning algorithms (e.g., SVM) to the latest algorithms (e.g., ANN, XGBoost, etc).
3.4 Proposed approach
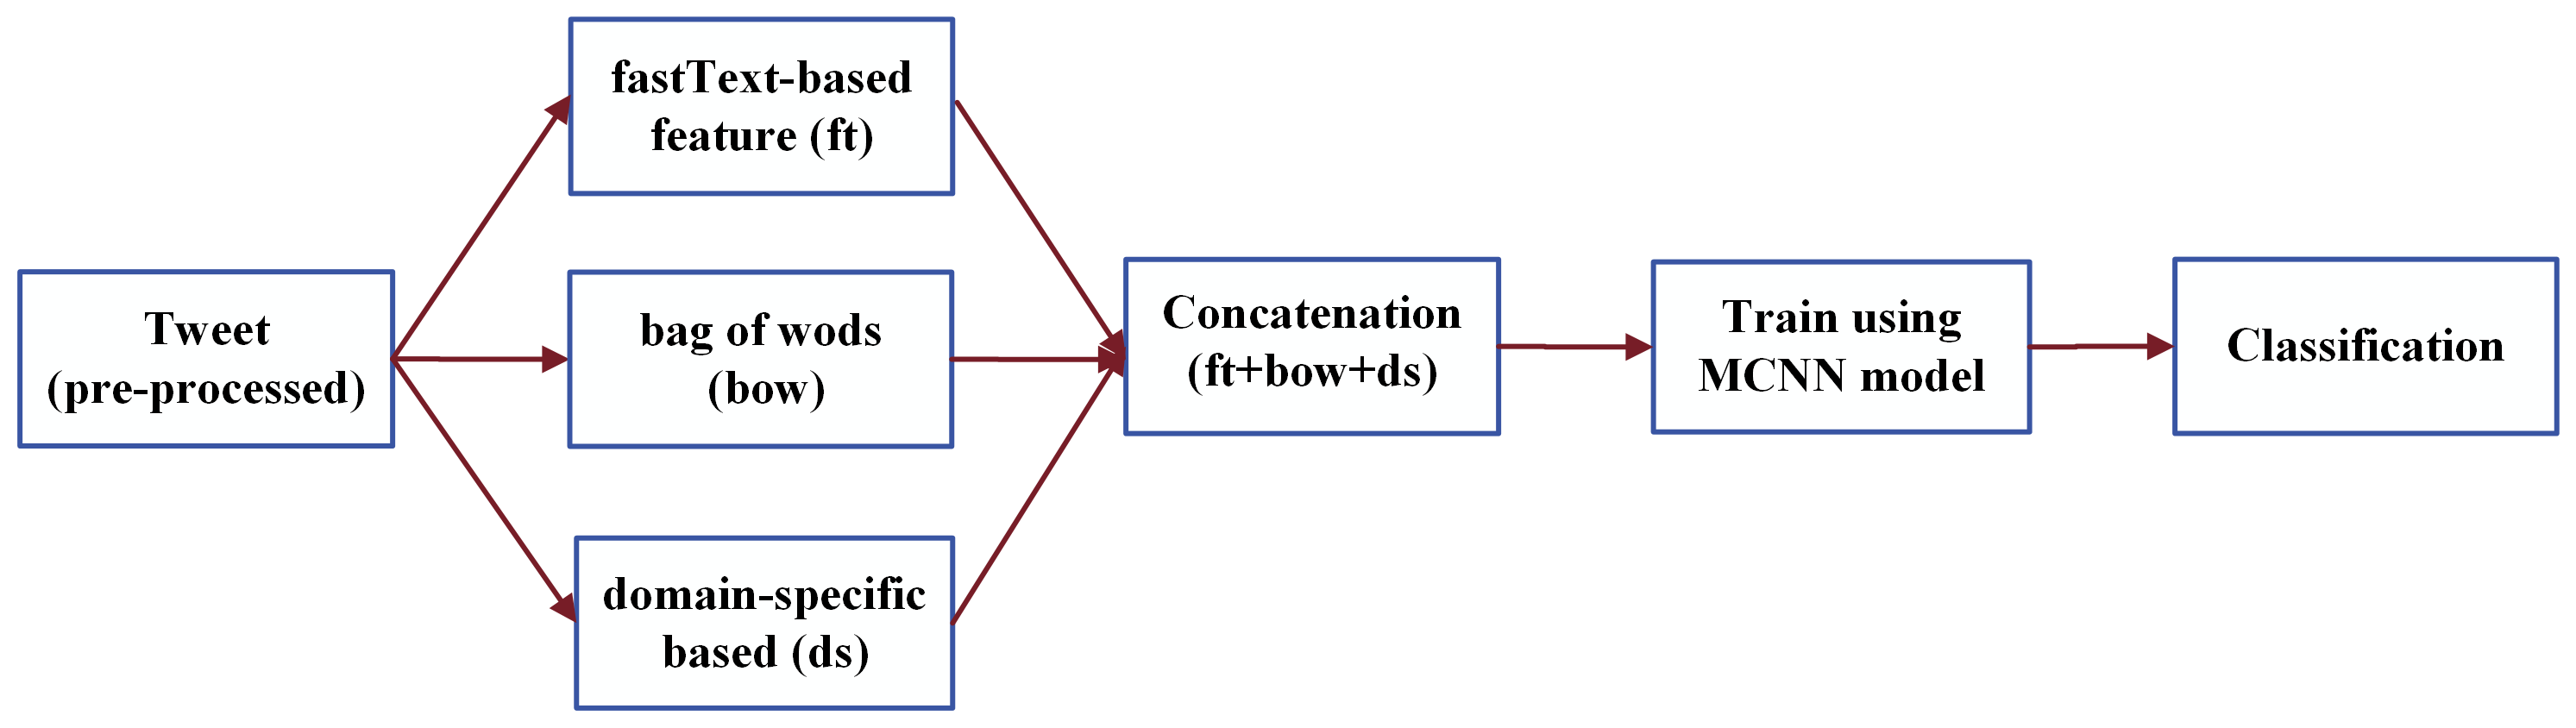
In our proposed method, we follow four steps: 3.4.1 Pre-processing; 3.4.2 Feature extraction; 3.4.3 Four CNNs design for fine-tuning; 3.4.4 Multi-channel CNN design for the classification. The high-level diagram of our overall pipeline is presented in Fig. 2.
3.4.1 Pre-processing
We use three different steps to pre-process each tweet. First, we remove the stop words, which are unimportant to capture the contextual information. Second, we remove the alphanumeric characters in the tweets. Third, we perform the stemming operation to extract the root word, which eliminates the redundant words.
3.4.2 Feature extraction
After the pre-processing operations, we extract four different features in this study. First, we extract fastText-based features (ft), which is 300-D size and domain-specific features (ds) Sitaula et al (2021), which is 3-D size. The ’ft’ based features are based on a pre-trained model, which has been pre-trained with textual data from diverse disciplines. Similarly, the ’ds’ based features are based on the probability of each token under three different sentiment classes (negative, neutral and positive). Here, based on the probability of each token among three different categories, we identify the importance of each token. In this study, we combine both ’ft’ and ’ds’ to exploit the semantic information. Furthermore, for the syntactic information, we exploit the popular algorithm, called bag of words (bow) approach, which employs the frequency and inverse document frequency technique (Shahi and Shakya, 2018). Finally, we combine all three different kinds of features to establish the hybrid features representing each tweet, which are used to train our CNNs in this study (refer to Eqs. (5),(6),(7), and (8) denote ’ft’, ’bow’, ’ds’, and ’hybrid’ features in this study, respectively).
| (5) |
| (6) |
| (7) |
| (8) |
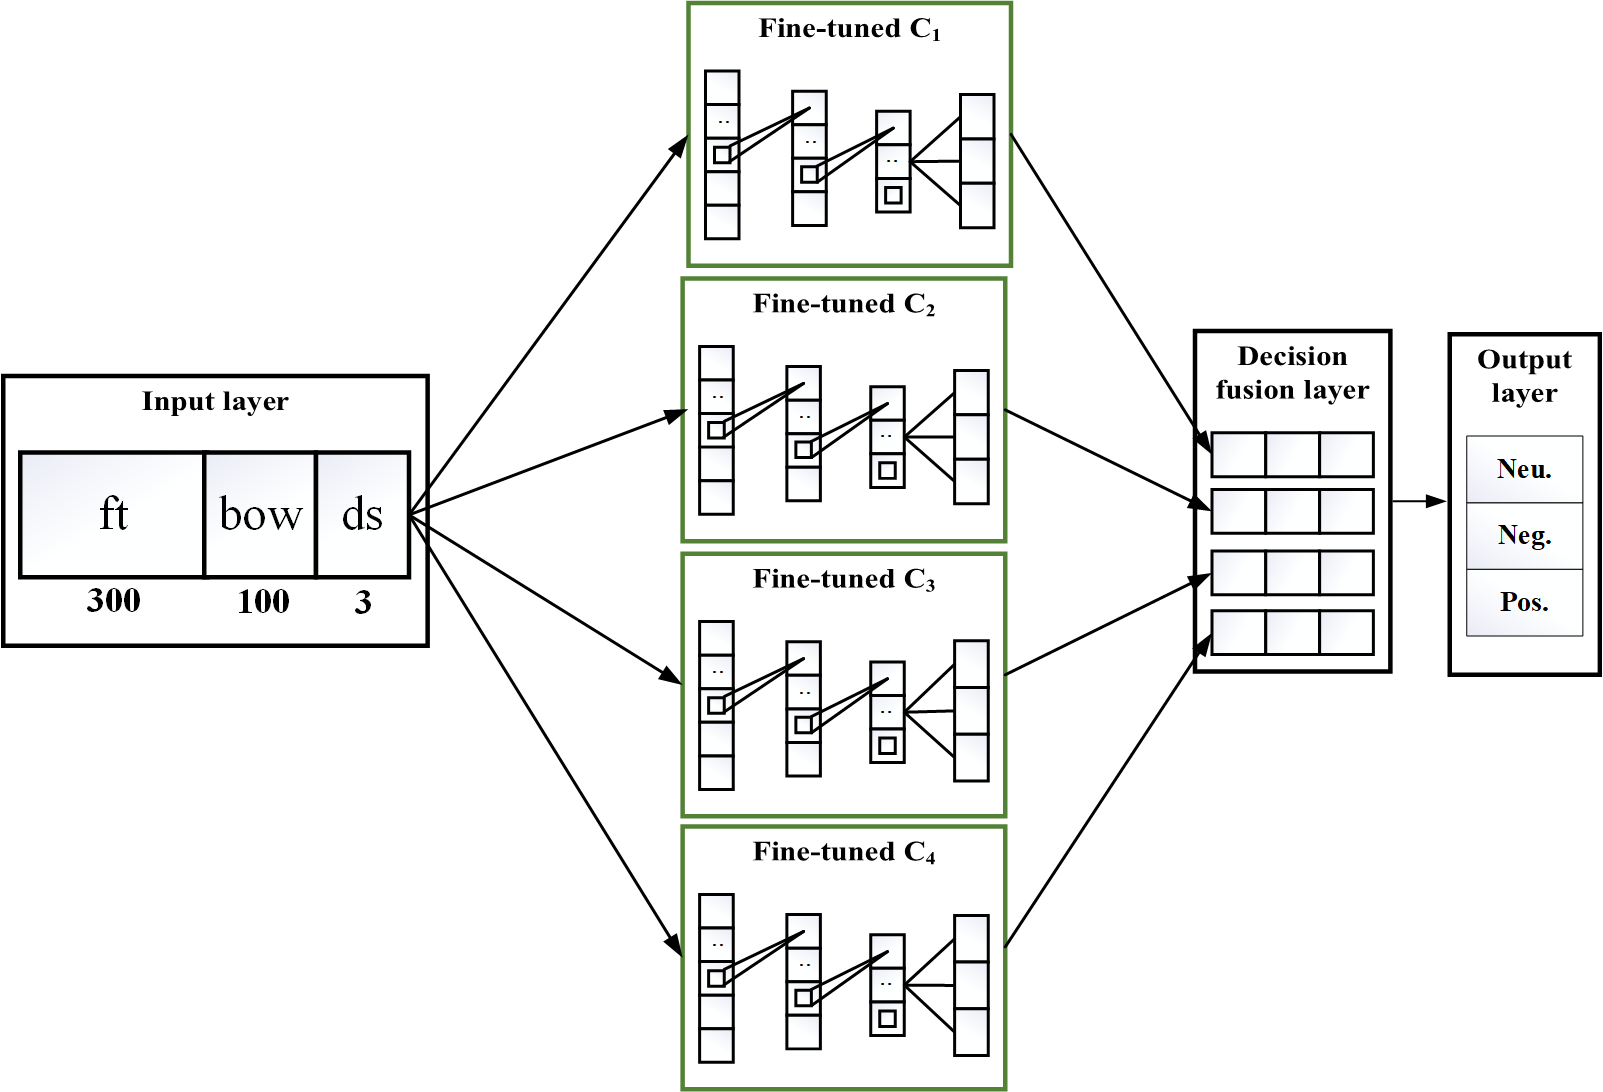
where and denote the input tweet and hybrid features (proposed), respectively. Also, fastText(.), BagOfWords(.), and DomainSpectific(.) denote the fastText-based (’ft’), bag of words-based method (’bow’), and domain-specific-based feature extraction (’ds’) methods to represent each tweet in this study. To achieve the ’ft’ features in this study, we extract the 300-D features for each token and average them to obtain the final representation for each tweet (). Similarly, we consider top-100 tokens to obtain the 100-D bag of words feature size, whereas for the ’ds’ feature, we extract 3-D feature size for each token and average them representing each tweet (). Finally, we concatenate all three of them to attain the hybrid features () of 403-D to train our CNNs.
3.4.3 Four CNNs design and fine-tuning
We design four different CNNs (, , , and with the kernel of 1, 2, 3, and 4, respectively) to capture the multi-scale information. We fine-tune each CNN before establishing our proposed multi-channel CNN in this study. The detailed architecture of the proposed CNNs are shown in Table 1.
| Layer | (f, k) | Output shape | (f, k) | Output shape | (f, k) | Output shape | (f, k) | Output shape |
|---|---|---|---|---|---|---|---|---|
| Input | - | (403,1) | - | (403,1) | - | (403,1) | - | (403,1) |
| Conv1D+Relu | (32,1) | (403,32) | (32,2) | (402,32) | (32,3) | (401,32) | (32,4) | (400,32) |
| Conv1D+Relu+Dropout (0.4) | (16,1) | (403,16) | (16,2) | (402,16) | (16,3) | (401,16) | (16,4) | (400,16) |
| MaxPooling1D (pool size=1) | - | (403,16) | - | (402,16) | - | (401,16) | - | (400,16) |
| Flatten+Dropout (0.5) | - | 6448 | - | 6432 | - | 6416 | - | 6400 |
| Dense+Dropout (0.5) | - | 128 | - | 128 | - | 128 | - | 128 |
| Dense+Dropout (0.5) | - | 64 | - | 64 | - | 64 | - | 64 |
| Softmax | - | 3 | - | 3 | - | 3 | - | 3 |
3.4.4 Multi-channel CNN design and classification
After fine-tuning each CNN model, we aggregate them using decision layer and train it in an end-to-end fashion for the classification. The aggregation in this approach not only helps reduce the number of trainable parameters but also improve the overall performance. The high-level diagram of our proposed MCNN is shown in Fig. 3. The mathematical representation of output of each channel CNN and their fusion is shown in Eqs. (9), (10), (11), (12), and (13) for each CNN , , , and and decision fusion, respectively.
| (9) |
| (10) |
| (11) |
| (12) |
| (13) |
where . Here, , ,, and is the multinomial output value for , , , and for index , respectively. For the decision fusion layer (), we employ an average voting approach, which has produced prominent accuracy than other methods in this study (see details in Section 4.2).
| ft | ds | bow | proposed | |||||||||||||
|---|---|---|---|---|---|---|---|---|---|---|---|---|---|---|---|---|
| Algorithms | P | R | F | A | P | R | F | A | P | R | F | A | P | R | F | A |
| NB | 51.3 | 49.9 | 49.3 | 60.9 | 43.8 | 38.0 | 33.9 | 49.9 | 51.3 | 49.4 | 48.7 | 54.5 | 53.7 | 51.2 | 51.2 | 61.7 |
| ANN | 57.0 | 56.9 | 56.9 | 63.7 | 58.9 | 49.5 | 48.1 | 62.0 | 52.1 | 50.7 | 50.8 | 59.5 | 58.1 | 57.9 | 57.9 | 64.8 |
| K-NN | 64.0 | 50.6 | 47.4 | 65.1 | 57.9 | 48.4 | 46.5 | 61.5 | 58.9 | 47.3 | 45.2 | 60.3 | 63.5 | 51.0 | 47.8 | 65.6 |
| SVM+Linear | 50.8 | 50.3 | 50.3 | 59.4 | 59.3 | 47.1 | 43.4 | 61.4 | 49.8 | 47.4 | 46.1 | 59.4 | 52.4 | 51.8 | 51.9 | 60.4 |
| LR | 60.7 | 55.0 | 54.6 | 67.3 | 61.5 | 48.5 | 46.4 | 61.8 | 59.1 | 49.7 | 47.8 | 63.0 | 62.3 | 57.7 | 58.2 | 68.6 |
| RF | 71.5 | 53.6 | 52.0 | 67.4 | 55.5 | 50.7 | 50.5 | 61.8 | 59.1 | 50.7 | 49.5 | 63.5 | 71.7 | 53.8 | 52.3 | 67.7 |
| SVM+RBF | 72.7 | 36.2 | 26.7 | 47.9 | 60.8 | 48.4 | 46.4 | 61.7 | 51.8 | 41.7 | 39.0 | 51.3 | 72.2 | 36.1 | 26.5 | 47.7 |
| XGBoost | 67.9 | 57.2 | 57.3 | 69.4 | 58.4 | 49.8 | 48.7 | 62.2 | 60.0 | 50.6 | 49.3 | 63.5 | 68.0 | 57.6 | 57.8 | 69.7 |
| Average | 61.9 | 51.2 | 49.3 | 62.6 | 57.0 | 47.5 | 45.4 | 60.2 | 55.2 | 48.4 | 47.0 | 59.3 | 62.7 | 52.1 | 50.4 | 63.2 |
3.5 Implementation
To implement the traditional machine learning classifiers and our proposed model, we employ Sklearn (Pedregosa et al, 2011), and Keras (Chollet et al, 2015), respectively implemented in Python (Rossum, 1995). For the experimental evaluations, we design 10 different train/test splits, each with the ratio of 70/30 per category and report the averaged performance. In the meantime, the optimal hyper-parameters of the traditional machine learning classifiers are taken from the recently published article using the NepCOV19Tweets dataset (Sitaula et al, 2021).
| Methods | Feature size | Accuracy |
|---|---|---|
| Shahi and Pant (2018), 2018 | 100-D | 62.1 |
| Basnet and Timalsina (2018), 2018 | 300-D | 62.9 |
| Sitaula et al (2021), 2021 | 17-D | 59.8 |
| Sitaula et al (2021)(ds), 2021 | 3-D | 61.5 |
| Sitaula et al (2021) (da), 2021 | 17-D | 59.5 |
| Sitaula et al (2021) (ft), 2021 | 300-D | 68.1 |
| Sitaula et al (2021) (ds+da+ft), 2021 | 320-D | 68.7 |
| Ours (avg) | 403-D | 71.3 |
| Ours (sum) | 403-D | 71.2 |
| Ours (max) | 403-D | 70.7 |
| Negative | Neutral | Positive | Overall Average | ||||||||||
| CNN | P | R | F | P | R | F | P | R | F | P | R | F | A |
| 72.1 | 76.5 | 74.1 | 58.9 | 20.4 | 27.0 | 68.8 | 81.9 | 74.8 | 66.6 | 57.2 | 56.9 | 69.9 | |
| 73.4 | 75.2 | 74.3 | 59.9 | 15.8 | 25.0 | 68.8 | 83.5 | 75.4 | 67.3 | 58.1 | 58.2 | 70.3 | |
| 73.2 | 75.7 | 74.5 | 59.9 | 16.4 | 25.6 | 69.0 | 83.1 | 75.4 | 67.4 | 58.3 | 58.4 | 70.5 | |
| 73.3 | 75.1 | 74.2 | 69.4 | 16.1 | 26.4 | 68.8 | 83.3 | 75.3 | 67.8 | 58.3 | 58.6 | 70.4 | |
| MCNN | 73.5 | 76.6 | 75.0 | 56.6 | 24.4 | 33.9 | 71.4 | 81.4 | 76.0 | 67.1 | 60.8 | 61.6 | 71.3 |
4 Results and discussion
4.1 Comparison of proposed feature extraction methods using well-established ML methods
We compare our proposed hybrid features using averaged classification performance (%) with each individual feature (’ft’, ’ds’, and ’bow’) against eight (including Linear and RBF SVM algorithms) well-established machine learning (ML) classifiers, which are presented in Table 2.
While looking at Table 2, the proposed features (hybrid) impart the most promising performances compared to ’ft’, ’ds’, and ’bow’ based features in most cases. In terms of averaged classification accuracy, the proposed features outperform the other three individual features under six different ML classifiers. As an example, our method yields 69.7% ( 0.3% higher than second-best method, ’ft’), 67.7% (0.3% higher than second-best method, ’ft’), 68.6% (1.3% higher than second-best, ’ft’), and 65.6% (0.5% higher than second-best method, ’ft’), 64.8% (1.1% higher than second-best method, ’ft’), and 61.7% (0.8% higher than second-best method,’ft’) from XGBoost, RF, LR, and, K-NN, ANN, NB, respectively. In terms of averaged precision, our proposed features outperform three remaining features against four different classifiers. For instance, it imparts 68.0% (0.1% higher than second-best method, ’ft’), 71.7% (0.2% higher than second-best method, ’ft’), 62.3% (0.8% higher than second-best method, ’ds’), and 53.7% (2.4% higher than second-best method, ’bow’) from XGBoost, RF, LR, and NB, respectively. Under the averaged recall, our proposed features outperform the remaining features for seven ML classifiers. For instance, it provides 57.6% (0.4% higher from second-best method, ’ft’) from XGBoost, 53.8% (0.2% higher than second-best method, ’ft’) from RF, 57.7% (2.7% higher than second-best method, ’ft’) from LR, 51.8% (1.5% higher than second-best method, ’ft’) from SVM+Linear, 51.0% (0.4% higher than second-best method, ’ft’) from K-NN, 57.9% (1.0% higher than second-best method, ’ft’) from ANN, and 51.2% (1.3% higher than second-best method, ’ft’) from NB classifiers. Finally, under the averaged F1-score, our proposed features surpass the remaining features while using seven ML classifiers. For example, it provides 57.8% (0.5% higher from second-best, ’ft’) from XGBoost, 52.3% (0.3% higher than second-best method, ’ft’) from RF, 58.2% (3.6% higher than second-best method, ’ft’) from LR, 51.9% (1.6% higher than second-best method, ’ft’) from SVM+Linear, 47.8% (0.4% higher than second-best method, ’ft’) from K-NN, 57.9% (1.0% higher than second-best method, ’ft’) from ANN, and 51.2% (1.9% higher than second-best method, ’ft’) from NB classifiers.
While analyzing the performance of the proposed feature extraction method using the averaged performance across all 8 classifiers, we notice that our method outperforms other individuals. Specifically, under precision, our method provides 62.7%, which is 0.8% higher that second-best method (’ft’) and 5.7% higher than least-performing method (’bow’). Similarly, our method imparts 52.1% recall, which is 0.9% higher than second-best method (’ft’) and 4.6% higher than least-performing method (’ds’). Furthermore, under average f1-score and accuracy, our method imparts 50.4% (1.1% higher than second-best method, ’ft’ and 2.9% higher than least-performing method, ’ds’) and 63.2% (0.6% higher than second-best method, ’ft’ and 3.9% higher than least-performing method, ’bow’), respectively.
From the discussions above, we suggest that the proposed method surpasses the remaining three individual features with stable performance in terms of four different evaluation measures. We also note that the main driving force to improve the performance in our proposed hybrid features is fastText-based features (’ft’) in our study. The reason for this is that it has been trained with a massive corpus from the diverse domains. In addition, we believe that our features are suitable for XGBoost classifier to attain the best performance compared to other remaining ML classifiers.
4.2 Comparison of proposed MCNN model with state-of-the-art methods
Here, we compare our proposed MCNN model with the existing state-of-the-art methods in terms of the averaged classification accuracy, which are presented in Table 3. Given that our MCNN model aggregates four different CNNs using three different methods–avg, sum, and max, we compare the classification accuracies of each of them with the state-of-the-art methods proposed in Nepali text classification.
While looking at Table 3, we observe that our proposed MCNN model with the ’avg’ decision fusion imparts an accuracy of 71.3%, which is 11.8% higher than least-performing method (da) and 2.6% higher than second-best method (ds+da+ft). Furthermore, our proposed model with ’sum’ and ’max’ provide an accuracy of 71.2% (11.7% higher than least-performing method (da) and 2.5% higher than second-best method (ds+da+ft) and 70.7% (11.2% higher than least-performing method (da) and 2.0% higher than second-best method (ds+da+ft)) respectively.
By and large, we believe that our proposed model has the ability to produce highly discriminant features during the classification of tweets into positive, neutral and negative classes. We find that ’avg’ based decision fusion outperforms ’sum’ and ’max’ based decision fusion. The reason of stable performance from ’avg’ is that it helps preserve both higher and lower probability values during decision fusion.
4.3 Ablative study of MCNN model
To show the efficacy of our method towards class-wise performance and contribution of each channel, we evaluate three different performance measures for three different classes for each channel and MCNN, which are presented in Table 4.
While looking at Table 4, we observe that our model imparts the highest precision (73.5%, and 71.4% for negative and positive, respectively), recall (76.6%, and 24.4% for negative and neutral, respectively), and f1-score (75.0%, 33.9%, and 76.0% for negative, neutral and positive, respectively). The performance improvement in our method is attributed to each channel that collected highly discriminating information. As an example, imparts precision, recall, and f1-score of 72.1%, 76.5%, and 74.1% for negative class; 58.9%, 20.4%, and 27.0% for neutral class; and 68.8%, 81.9%, and 74.8% for positive class, respectively. Furthermore, imparts precision, recall, and f1-score of 73.4%, 75.2%, and 74.3% for negative class; 59.9%, 15.8%, and 25.0% for neutral class; and 68.8%, 83.5%, and 75.4% for positive class, respectively. Furthermore, imparts precision, recall, and f1-score of 73.2%, 75.7%, and 74.5% for negative class; 59.9%, 16.4%, and 25.6% for neutral class; and 69.0%, 83.1%, and 75.4% for positive class, respectively. Finally, we achieve the precision, recall, and f1-score of 73.3%, 75.1%, and 74.2% for negative class; 69.4%, 16.1%, and 26.4% for neutral class; and 68.8%, 83.3% and 75.3% for positive class in , respectively. This result infers that our MCNN model outperforms its individual channel CNNs.
We also analyze the efficacy of each component used in our model in terms of overall averaged performance metrics (%) including classification accuracy, which also reveal that our model outperforms individual channel CNNs in terms of all metrics. For example, our model provides precision, recall, f1-score, and accuracy of 67.1%, 60.8%, 61.6%, and 71.3%, respectively, which are the highest measures except precision among all individual channel CNNs. These encouraging results support that our MCNN model is able to preserve the discriminating information from individual CNN, thereby improving the overall classification performance significantly.
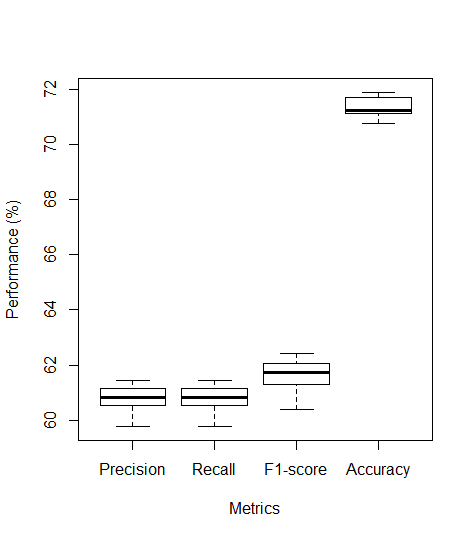
4.4 Statistical analysis
Here, we perform the statistical analysis of the evaluation results achieved from our proposed method across 10-fold splits. For this, we employ the confidence interval, p-value, and box plot visualization of the results presented using evaluation measures (precision, recall, f1-score, and accuracy). The box plot visualization is shown in Fig. 4. Furthermore, our method imparts the 95% confidence interval (CI) of precision, recall, f1-score and accuracy as [60.4,61.1], [60.4, 61.1], [61.2, 62.0], and [71.0,71.5], respectively. Also, it has p-value2.2e-16 for precision, recall, f1-score and accuracy results. Based on all of these statistical tests, we believe that our proposed method is robust towards classification.
5 Conclusion and future works
In this paper, we have proposed a multi-channel convolutional neural network (MCNN) to classify the Nepali COVID-19 related tweets into three different sentiment classes–positive, neutral and negative. Our experimental results on NepCOV19Tweets dataset show that MCNN is able to capture the discriminating information outperforming the state-of-the-art methods. To train the proposed MCNN model, we have proposed to use the hybrid feature extraction method (syntactic+semantic), which shows the robust performance against individual methods with the traditional machine learning algorithms.
Our method still has a limited contextual information due to the availability of low resources in Nepali natural language processing. Thus, it would be interesting to combine other kinds of semantic information (e.g., Nepali Wikipedia description) and re-train our model. In addition, the sequence of tokens present in each Nepali tweet could be interesting research to capture the temporal information for their better discrimination.
6 Data availability
The data used in this study are publicly available at https://www.kaggle.com/mathew11111/nepcov19tweets.
7 Conflict of interest
The authors declare that there is no conflict of interest.
References
- Boon-Itt and Skunkan (2020) Boon-Itt S, Skunkan Y (2020) Public perception of the covid-19 pandemic on twitter: Sentiment analysis and topic modeling study. JMIR Public Health and Surveillance 6(4):e21,978
- De Melo and Figueiredo (2021) De Melo T, Figueiredo C (2021) Comparing news articles and tweets about covid-19 in brazil: sentiment analysis and topic modeling approach. JMIR Public Health and Surveillance 7(2):e24,585
- Aljameel et al (2021) Aljameel S, Alabbad D, Alzahrani N, Alqarni S, Alamoudi F, Babili L, Aljaafary S, Alshamrani F (2021) A sentiment analysis approach to predict an individual’s awareness of the precautionary procedures to prevent covid-19 outbreaks in saudi arabia. International journal of environmental research and public health 18(1):218
- Sitaula et al (2021) Sitaula C, Basnet A, Mainali A, Shahi T (2021) Deep learning-based methods for sentiment analysis on nepali covid-19-related tweets. Computational Intelligence and Neuroscience 2021
- Shahi and Sitaula (2021) Shahi TB, Sitaula C (2021) Natural language processing for nepali text: a review. Artificial Intelligence Review pp 1–29
- Sitaula and Yadav (2013) Sitaula C, Yadav R (2013) Semantic sentence similarity using finite state machine. Intelligent Information Management 5(6):171
- Sitaula (2012) Sitaula C (2012) Semantic text clustering using enhanced vector space model using nepali language. Computer Sciences and Telecommunications (4):41–46
- Bojanowski et al (2017) Bojanowski P, Grave E, Joulin A, Mikolov T (2017) Enriching word vectors with subword information. Transactions of the Association for Computational Linguistics 5:135–146
- Chandrasekaran et al (2020) Chandrasekaran R, Mehta V, Valkunde T, Moustakas E (2020) Topics, trends, and sentiments of tweets about the covid-19 pandemic: Temporal infoveillance study. Journal of medical Internet research 22(10):e22,624
- Xue et al (2020) Xue J, Chen J, Chen C, Zheng C, Li S, Zhu T (2020) Public discourse and sentiment during the covid 19 pandemic: Using latent dirichlet allocation for topic modeling on twitter. PloS one 15(9):e0239,441
- Rustam et al (2021) Rustam F, Khalid M, Aslam W, Rupapara V, Mehmood A, Choi G (2021) A performance comparison of supervised machine learning models for covid-19 tweets sentiment analysis. Plos one 16(2):e0245,909
- Kaur et al (2021) Kaur H, Ahsaan S, Alankar B, Chang V (2021) A proposed sentiment analysis deep learning algorithm for analyzing covid-19 tweets. Information Systems Frontiers pp 1–13
- Naseem et al (2021) Naseem U, Razzak I, Khushi M, Eklund P, Kim J (2021) Covidsenti: A large-scale benchmark twitter data set for covid-19 sentiment analysis. IEEE Transactions on Computational Social Systems
- Basiri et al (2021) Basiri M, Nemati S, Abdar M, Asadi S, Acharrya U (2021) A novel fusion-based deep learning model for sentiment analysis of covid-19 tweets. Knowledge-Based Systems p 107242
- Shahi and Pant (2018) Shahi T, Pant A (2018) Nepali news classification using naïve bayes, support vector machines and neural networks. In: Proc. International Conference on Communication Information and Computing Technology (ICCICT), IEEE, pp 1–5
- Basnet and Timalsina (2018) Basnet A, Timalsina A (2018) Improving nepali news recommendation using classification based on lstm recurrent neural networks. In: Proc. IEEE 3rd International Conference on Computing, Communication and Security (ICCCS), IEEE, pp 138–142
- Subba et al (2019) Subba S, Paudel N, Shahi T (2019) Nepali text document classification using deep neural network. Tribhuvan University Journal 33(1):11–22
- Sitaula et al (2021) Sitaula C, Basnet A, Aryal S (2021) Vector representation based on a supervised codebook for nepali documents classification. PeerJ Computer Science 7:e412
- Cristianini et al (2000) Cristianini N, Shawe-Taylor J, et al (2000) An introduction to support vector machines and other kernel-based learning methods. Cambridge university press
- Priyatikanto et al (2020) Priyatikanto R, Mayangsari L, Prihandoko R, Admiranto A (2020) Classification of continuous sky brightness data using random forest. Advances in Astronomy 2020
- Chen and Guestrin (2016) Chen T, Guestrin C (2016) Xgboost: A scalable tree boosting system. In: Proceedings of the 22nd ACM SIGKDD International Conference on Knowledge Discovery and Data Mining, Association for Computing Machinery, New York, NY, USA, KDD ’16, p 785–794, DOI 10.1145/2939672.2939785, URL https://doi.org/10.1145/2939672.2939785
- Pedregosa et al (2011) Pedregosa F, Varoquaux G, Gramfort A, Michel V, Thirion B, Grisel O, Blondel M, Prettenhofer P, Weiss R, Dubourg V, et al (2011) Scikit-learn: Machine learning in python. Journal of machine learning research 12(Oct):2825–2830
- Dimililer (2013) Dimililer K (2013) Backpropagation neural network implementation for medical image compression. Journal of applied Mathematics 2013
- Fan et al (2008) Fan RE, Chang KW, Hsieh CJ, Wang XR, Lin CJ (2008) Liblinear: A library for large linear classification. the Journal of machine Learning research 9:1871–1874
- Mucherino et al (2009) Mucherino A, Papajorgji P, Pardalos P (2009) K-nearest neighbor classification. In: Data mining in agriculture, Springer, pp 83–106
- Shahi and Shakya (2018) Shahi TB, Shakya S (2018) Nepali sms filtering using decision trees, neural network and support vector machine. In: 2018 International Conference on Advances in Computing, Communication Control and Networking (ICACCCN), IEEE, pp 1038–1042
- Pedregosa et al (2011) Pedregosa F, Varoquaux G, Gramfort A, Michel V, Thirion B, Grisel O, Blondel M, Prettenhofer P, Weiss R, Dubourg V, Vanderplas J, Passos A, Cournapeau D, Brucher M, Perrot M, Duchesnay E (2011) Scikit-learn: Machine learning in Python. Journal of Machine Learning Research 12:2825–2830
- Chollet et al (2015) Chollet F, et al (2015) Keras. https://github.com/fchollet/keras
- Rossum (1995) Rossum G (1995) Python reference manual. Tech. rep., Amsterdam, The Netherlands