The Role of Disk Winds in the Evolution and Dispersal of Protoplanetary Disks
Abstract
The assembly and architecture of planetary systems strongly depend on the physical processes governing the evolution and dispersal of protoplanetary disks. Since Protostars and Planets VI, new observations and theoretical insights favor disk winds as being one of those key processes. This chapter provides a comprehensive review of recent observations probing outflowing gas launched over a range of disk radii for a wide range of evolutionary stages, enabling an empirical understanding of how winds evolve. In parallel, we review theoretical advancements in both magnetohydrodynamic and photoevaporative disk wind models and identify predictions that can be confronted with observations. By linking theory and observations we critically assess the role of disk winds in the evolution and dispersal of protoplanetary disks. Finally, we explore the impact of disk winds on planet formation and evolution and highlight theoretical work, observations, and critical tests for future progress.
1 INTRODUCTION
Circumstellar disks of gas and dust are a direct consequence of star formation and harbor the birth sites of planets. Therefore, understanding how these protoplanetary disks evolve and disperse is crucial to understanding the environment in which planets form, and how they are assembled and migrate. Since PPVI, theory and observations have challenged the notion that turbulence driven by magnetorotational instability (MRI, Balbus and Hawley, 1991) is the main enabler of accretion and disk evolution. Disk simulations with detailed microphysics find that MRI is suppressed in most of the planet-forming region ( au) and instead accretion is driven by radially extended magnetohydrodynamic (MHD) winds, i.e. outflowing gas from the disk atmosphere (e.g., Lesur, 2021, for a recent review). At the same time, new observations have revealed a plethora of wind diagnostics that can be used to test theoretical MHD disk wind scenarios as well as thermal photoevaporative (PE) disk winds (e.g., Ercolano and Pascucci, 2017) which will not influence accretion but may play an important role in disk clearing.
Motivated by these recent advancements, here we juxtapose observations and theory to critically assess the role of disk winds in the evolution and dispersal of protoplanetary disks. There is growing evidence since PPVI that, even within 10 au of the star, wind velocities decrease with increasing disk radius, as expected in radially extended disk winds, which will be a focus for the observational sections of this chapter.
Our attention is on low-mass ( M⊙) stars in low-mass star-forming regions. Hence, processes that may drive evolution and dispersal in higher-mass star-forming environments, e.g. external radiation driven PE winds, are not covered. Even in less complex environments, establishing evidence for disk winds is a challenging task due to the need for high spatial and spectral resolution, and interactions between the stellar magnetic field, the jet, the disk, and, at the earliest stages, an infalling envelope. Observationally, disk wind candidates are identified with gravitationally unbound/outflowing gas moving at moderate to low velocities ( km/s) and, when sufficient spatial resolution is available, opening at wide angles from the disk. These two properties distinguish them from jets, a common mass ejection phenomenon characterized by collimated fast ( kms) outflowing gas (e.g., Frank et al., 2014). Jets and large scale, swept up bipolar molecular outflows have historically dominated the discussion of mass ejection from young stars (e.g., Bally, 2016), while direct evidence for radially extended disk winds has been scant. Although our focus here is on evidence for disk winds, we will address some observations of jets on small scales, within a few hundred au, that are new since PPVI.
Our chapter is structured as follows. First, we present observations of outflowing gas for systems in different evolutionary stages and discuss how flows evolve while accretion subsides and disks disperse (§ 2). Next, we review the basic physics of MHD and PE winds with focus on predictions that can be tested via observations (§ 3). We interpret the observations in the context of theoretical models in § 4 and discuss the implications of disk winds for planet formation and migration in § 5. We conclude in § 6 by critically assessing the role of winds in the evolution and dispersal of protoplanetary disks and by highlighting theoretical developments and observations for future progress.
2 OBSERVATIONS CONSTRAINING DISK WIND MODELS
We begin with an observational overview of mass ejection from low-mass stars and their disks. With the goal of building a coherent picture, we cover all types of flows, from fast jets to winds launched from a large range of radial distances, at all stages of star and disk evolution (§ 2.1 and 2.2). An approximate age sequence for the three phases of star formation and envelope dispersal is assumed, where characteristic ages for Class 0 sources are on the order of yr, Class I yr and Class II yr. We mostly rely on traditional boundaries between the different classes. Class 0 are separated from Class I based on the ratio of submillimeter to bolometric luminosity, a proxy for the envelope-to-stellar mass ratio which is larger than 1 for Class 0 sources (Andre and Montmerle, 1994). The infrared spectral index probes the presence, or absence, of a residual infalling envelope around the disk, hence it is used to distinguish Class I from II (e.g., Wilking et al., 1989). However, because the spectral index depends on the viewing geometry, we also consider dynamical evidence of envelope infall or extended dust emission beyond the disk as an additional discriminant between the two later stages (hence, DG Tau B is classified here as Class I, see de Valon et al. 2020, while HH 30 as Class II, see Louvet et al. 2018). For the same reasons, flat-spectrum T Tauri stars (Adams et al., 1987; Furlan et al., 2016) are also included in the Class II category. Along with jets and wind properties, we also discuss stellar accretion rates and disk radii as they provide important constraints for disk wind models. We conclude with an empirical reconstruction of how flows evolve in time while accretion weakens and disks dissipate (§ 2.3).
2.1 Embedded Class 0 and Class I stages
Embedded protostars are known to drive powerful outflows on scales of 0.1-5 pc, in the form of collimated jets with velocities km/s and wider colder large scale molecular outflows at km/s, interpreted as swept up material. These outflows are associated with embedded shock fronts, caused by jet variability or interaction with the ambient medium, and seen in a variety of tracers (see e.g., Frank et al., 2014; Bally, 2016). Here, we focus solely on jet and flow properties at the innermost scales, au from the central source. These properties place relevant constraints on ejection processes from both the inner ( au) and outer disk and represent new advancements at high spatial and spectral resolution since PPVI.
2.1.1 Innermost regions of high-velocity jets
Both Class 0 and Class I jets are detected in atomic and H2 lines (see Frank et al., 2014; Bally, 2016, for reviews), but Class 0 jets are also traced by pure rotational lines of CO, SiO, and SO, where advances in sub-mm interferometers have brought great progress in the last few years (see Lee, 2020, for a recent review). Concerning statistical trends, proper motions and precession models have yielded deprojected Class 0 jet speeds of km/s (Lee et al., 2015; Jhan and Lee, 2016; Podio et al., 2016; Yoshida et al., 2021), slightly lower than in Class I sources.
Jets appear to be highly collimated. The first resolved measurements of Class 0 SiO jet widths within au from the source (Lee, 2020; Bjerkeli et al., 2019) show a mean semi-opening angle and a typical jet width of au. Although the base of high-velocity Class I jets was first probed in atomic lines of [O I], [Fe II], and sometimes in H2 (see Bally et al., 2007; Frank et al., 2014, for reviews), resolving their transverse structure within 1,000 au of the source has remained difficult due to residual nebulosity from scattered light in narrow-band HST images (e.g., the recent tens of au widths inferred for HH34 and HH46, Erkal et al. 2021b), lack of optical reference for Adaptive Optics (AO) correction from the ground, and limited resolution at mid- and far-infrared wavelengths. A notable exception is the optically visible, outbursting Class I source SVS13 where AO-corrected Integral Field Spectroscopy resolved the 200 km/s [Fe II] jet and measured a width of au ( mas) within 150 au of the source (Hodapp and Chini, 2014), similar to the SiO Class 0 jets.
Jet mass-fluxes could be also recently estimated for a dozen of Class 0 jets from CO millimeter data, assuming a standard CO ISM abundance ( of H) and the following expression with being the optically thin emitting mass inside a projected length and the projected jet speed in the plane of the sky. The CO jet mass-flux is found to correlate with the source bolometric luminosity (Podio et al., 2021), which is assumed to be dominated by accretion. In sources with a dynamical estimate of the stellar mass, the CO jet mass-flux is found to be on average of the mass-accretion rate onto the central protostar (Lee, 2020). A similar ejection to accretion ratio of was inferred for atomic Class 0/I jets from optical and infrared lines of [O I] and [Fe II] resolved along the jet axis (e.g., Hartigan et al., 1994; Nisini et al., 2015; Bally, 2016; Sperling et al., 2021).
Concerning jet chemistry, an important new result from a survey of 21 Class 0 sources is that the detection rate of SiO and SO jets increases with source luminosity, from below to above (Podio et al., 2021). Since the jet mass-flux also correlates with source luminosity in Class 0 sources (see above), the implication is that SiO and SO are detected preferentially at high jet mass-fluxes which is consistent with the non-detection of molecules other than H2 in the lower mass-fluxes Class I jets.
Finally, two additional impactful results on the structure of Class 0 jets, particularly relevant to the issue of disk winds, were recently achieved thanks to the unprecedented angular resolution and polarization capabilities of ALMA. One of them is the detection of consistent rotation in the same sense as the disk down to a 10 au scale in the bright SiO jet of HH 212 (Lee et al., 2017a) which establishes a disk origin for the jet. The specific angular momentum suggests an origin from the innermost disk at au, potentially inside the dust evaporation radius (see Lee et al., 2017a; Tabone et al., 2017, and § 4.1). The second result is the first detection of SiO linear polarization by the Goldreich-Kylafis effect inside the HH 211 jet. The inferred magnetic field intensity (from the dispersion of polarization angles) and morphology are consistent with magnetic jet collimation (Lee et al., 2018b). This represents the first direct, and so far only, probe of magnetic field inside a jet from a low-mass protostar.
2.1.2 Slow molecular “winds”
The first evidence for a slower and wider flow component surrounding the base of Class I jets was the ubiquitous detection in near-infrared spectra of a low-velocity component (LVC) blueshifted by km/s in rovibrational H2 emission (Davis et al., 2001). This component extends over a few hundred au along the jet (e.g., Garcia Lopez et al., 2010) and more recent spectro-imaging suggests that it broadens out with a semi-opening angle (Davis et al., 2011; Garcia Lopez et al., 2013). An extended LVC is also sometimes detected in atomic lines of [OI] and [SII], e.g. in DG Tau B (Podio et al., 2011). However, detailed studies of its transverse structure in the optical or near-infrared meet the same challenges as for the base of jets in Class I sources (see § 2.1.1). One exception is again SVS13, where AO-corrected observations resolved the slow H2 into a series of expanding bright-rimmed “bubbles”, attributed to short-lived pulses of jet activity (Hodapp and Chini, 2014). In parallel, CO ro-vibrational line profiles observed at high spectral resolution revealed broad blueshifted absorption features from -10 to -100 km/s in 6 out of 18 ( 33%) Class I targets, with increasing columns at low velocities and gas temperature 1200 K. Since the absorbed 4.6 \micron continuum is presumably dominated by emission from the inner disk, these features are suggestive of warm inner molecular disk winds with a broad range of flow speeds that produce detectable CO absorption at favorable viewing angles (e.g., Herczeg et al., 2011). However, flow structure and mass fluxes could not be derived due to lack of spatial information.
A key new result provided by submm interferometers is the discovery of small-scale ( 2000 au) molecular flows around a growing number of low-mass Class I/0 sources that rotate in the same sense as the disk and are rooted within the disk at radii au. (Class I: CB26, TMC1A, DGTauB; Class 0:HH212, HH211, NGC1333-IRAS4C; Launhardt et al., 2009; Bjerkeli et al., 2016; Zapata et al., 2015; de Valon et al., 2020; Tabone et al., 2017; Lee et al., 2018a; Zhang et al., 2018). This geometry hints at material directly ejected from the disk surface. In addition, in HH 212, the rotating flow is confined inside of the main swept-up outflow cavity walls delineated in CO and CS (Tabone et al., 2017), and inside the dense flattened rotating infalling envelope traced by HCO+ (Lee et al., 2021). Therefore, in the following, we will refer to these small-scale rotating flows as molecular “winds” to distinguish them from the classical bipolar molecular flows of swept-up ambient gas observed over much larger (parsec) scales around embedded sources (e.g., Arce et al., 2007; Frank et al., 2014).
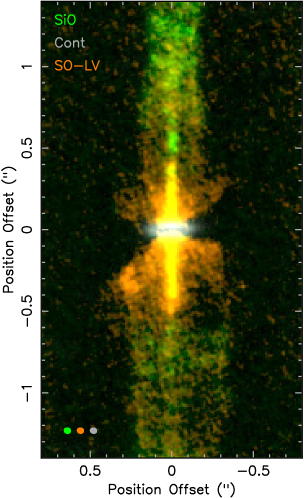
All small-scale rotating molecular winds display striking conical or parabolic shapes, with semi-opening angles 10\degr40\degrand an inner low-brightness “cavity” surrounding the jet beam. Figures 1 and 2 provide the illustrative cases of HH 212 (Class 0) and DG Tau B (Class I) as observed by ALMA at a projected resolution of au (Lee et al., 2021; de Valon et al., 2020). In the case of HH 212, a rotating wide-angle flow with semi-opening angle is detected in SO for velocities within a few km/s from systemic (orange). Toward DG Tau B, CO emission at a few km/s from systemic delineates a bright rotating cone of semi-opening angle (purple to yellow shades), anchored at 40 au in the disk, surrounded by a broader and fainter flow at lower velocities (red) that also shows clear signatures of rotation (de Valon et al., 2020). The collimated jet emission, traced via ALMA SiO for HH 212 and with the HST/WFPC2 F675W filter for DG Tau B, is also shown in the figures. Interestingly, the optical LVC of DG Tau B was found to have less refractory species (including Fe and Ni) than the HVC (Podio et al., 2011), implying that the LVC arises from beyond the dust evaporation radius where refractories are locked into dust grains. Considering all the spatially resolved flows to date, the distinction in morphology between co-existing jets and winds is striking, where the fast moving inner jets are highly collimated and precessing, with time variable knotty structure arising from moving bow shocks, while the surrounding slow moving winds are wide cones appearing quite smooth in structure and showing no signs of collimating, sometimes out to 1000 au.
The wind kinematics can be recovered from transverse position-velocity (PV) cuts in a quasi model-independent fashion, assuming only axisymmetry (with slight biases introduced by inclination and velocity gradients, cf. de- Valon et al. 2022, in press). Application to DG Tau B shows that the cone in Figure 2 harbors a nested velocity structure, often called “onion-like”, with a decreasing flow speed (from 20 to 6 km/s) and increasing specific angular momentum (from 40 to 100 au km/s) at wider opening angles. Assuming constant opening angles down to the disk midplane gives geometric base radii () of au for these nested cones, which, as discussed in § 4.1, set upper limits to the MHD wind-launching radii.
Published results for the six resolved rotating molecular winds from low-mass Class 0/I sources (3 in each stage, cf. list of objects above) shows that their properties are similar across the current sample, although the molecular tracers differ. Deprojected vertical flow speeds span from 1 to and lateral expansion speeds are km/s. Measured specific angular momenta are in the range au km/s and geometric radii range from to au (see Table 1). In addition, the other two winds that are laterally resolved (from TMC1A and HH212) also show a nested velocity structure with progressively lower speeds and larger specific angular momenta on the outside, similar to DG Tau B, hinting at the same physical process. In each case, the inner streamline rgeom lies well inside the gas disk radius, which is important to assess the flow origin (see § 4.1).
Assuming that the flows do trace steady ejection from the disk, the estimated mass-flux would be very significant. In the Class 0 source HH 212, it would be yr-1 (where the large range reflects the uncertainty in SO abundance), i.e. 1–10 times the jet mass-flux and 0.3–3 times the estimated mass-accretion rate onto the protostar (Tabone et al., 2020a). In the Class I source DG Tau B, the mass-flux would be yr-1, i.e. 40 times that in the fast axial atomic jet (Podio et al., 2011) and, assuming a standard ejection/accretion ratio in the jet of 10%, times the accretion rate onto the star (de Valon et al., 2020). Such massive disk winds would clearly play a major role in limiting the fraction of envelope mass that ends up on the star, in driving disk accretion if they are MHD-driven, and in dissipating the disk mass reservoir (§ 3.2, 3.4, and 4.1).
We note that the interpretation in terms of slow disk winds is still debated. An alternative interpretation is that these compact rotating flows might instead trace the base of entrained ambient material swept up by a fast wide-angle X-wind. We will discuss the X-wind scenario, and its main challenges in reproducing observations, in § 4.1.5.
2.2 Class II stage
Class II sources span a wide range of accretion and outflow properties, ranging from a handful of objects with accretion rates yr-1 and spatially resolved microjets (see Ray et al., 2007) to, more commonly, accretion rates from to yr-1 (Nisini et al., 2018). As we will discuss in § 2.2.2, outflows/winds from the majority of Class II sources are inferred solely from the kinematics of spatially unresolved, blueshifted forbidden emission including [O I], [S II], [N II], [Fe II], [Ne II] as well as P Cygni profiles in strong permitted emission lines, such as He I 10830 Å. The forbidden profiles often have two components, which were already early on interpreted as arising from a high velocity microjet (HVC: 50 to 300 km/s) and a low velocity disk wind (LVC: often with velocities less than 10 km/s), e.g., Hartigan et al. (1995), hereafter HEG, and Kwan and Tademaru (1995). Although the association of the HVC with microjets has been accepted for some time, firm evidence for a more radially extended disk wind is new since PPVI. The relation between the collimated jet and a possible extended disk wind, however, remains uncertain.
2.2.1 Spatially resolved outflows
Resolved Class II microjets, with velocities on the order of a few hundred km/s and vertically extended up to a few hundred au from the star, are observed with high resolution spectro-imaging in optical and near-IR forbidden lines in a handful of high accretion rate sources, as summarized in Ray et al. (2007). Although less extended, their structures and high velocities are reminiscent of Class I jets, with semi-opening angles and, in at least one source (DG Tau A), this tight collimation occurs as close as 10 au to the star (Maurri et al., 2014). The formation and proper motion of knots of shocked gas in Class II microjets has been tracked with high angular resolution imaging, with new knots appearing every few years (López-Martín et al., 2003; Pyo et al., 2003; Takami et al., 2020), attributed to episodic variations in the velocity of mass ejection (Purser et al., 2018). Small velocity shifts across jet widths hint at rotation but can also be attributed to jet wiggling and asymmetric shocks (e.g., Erkal et al., 2021b).
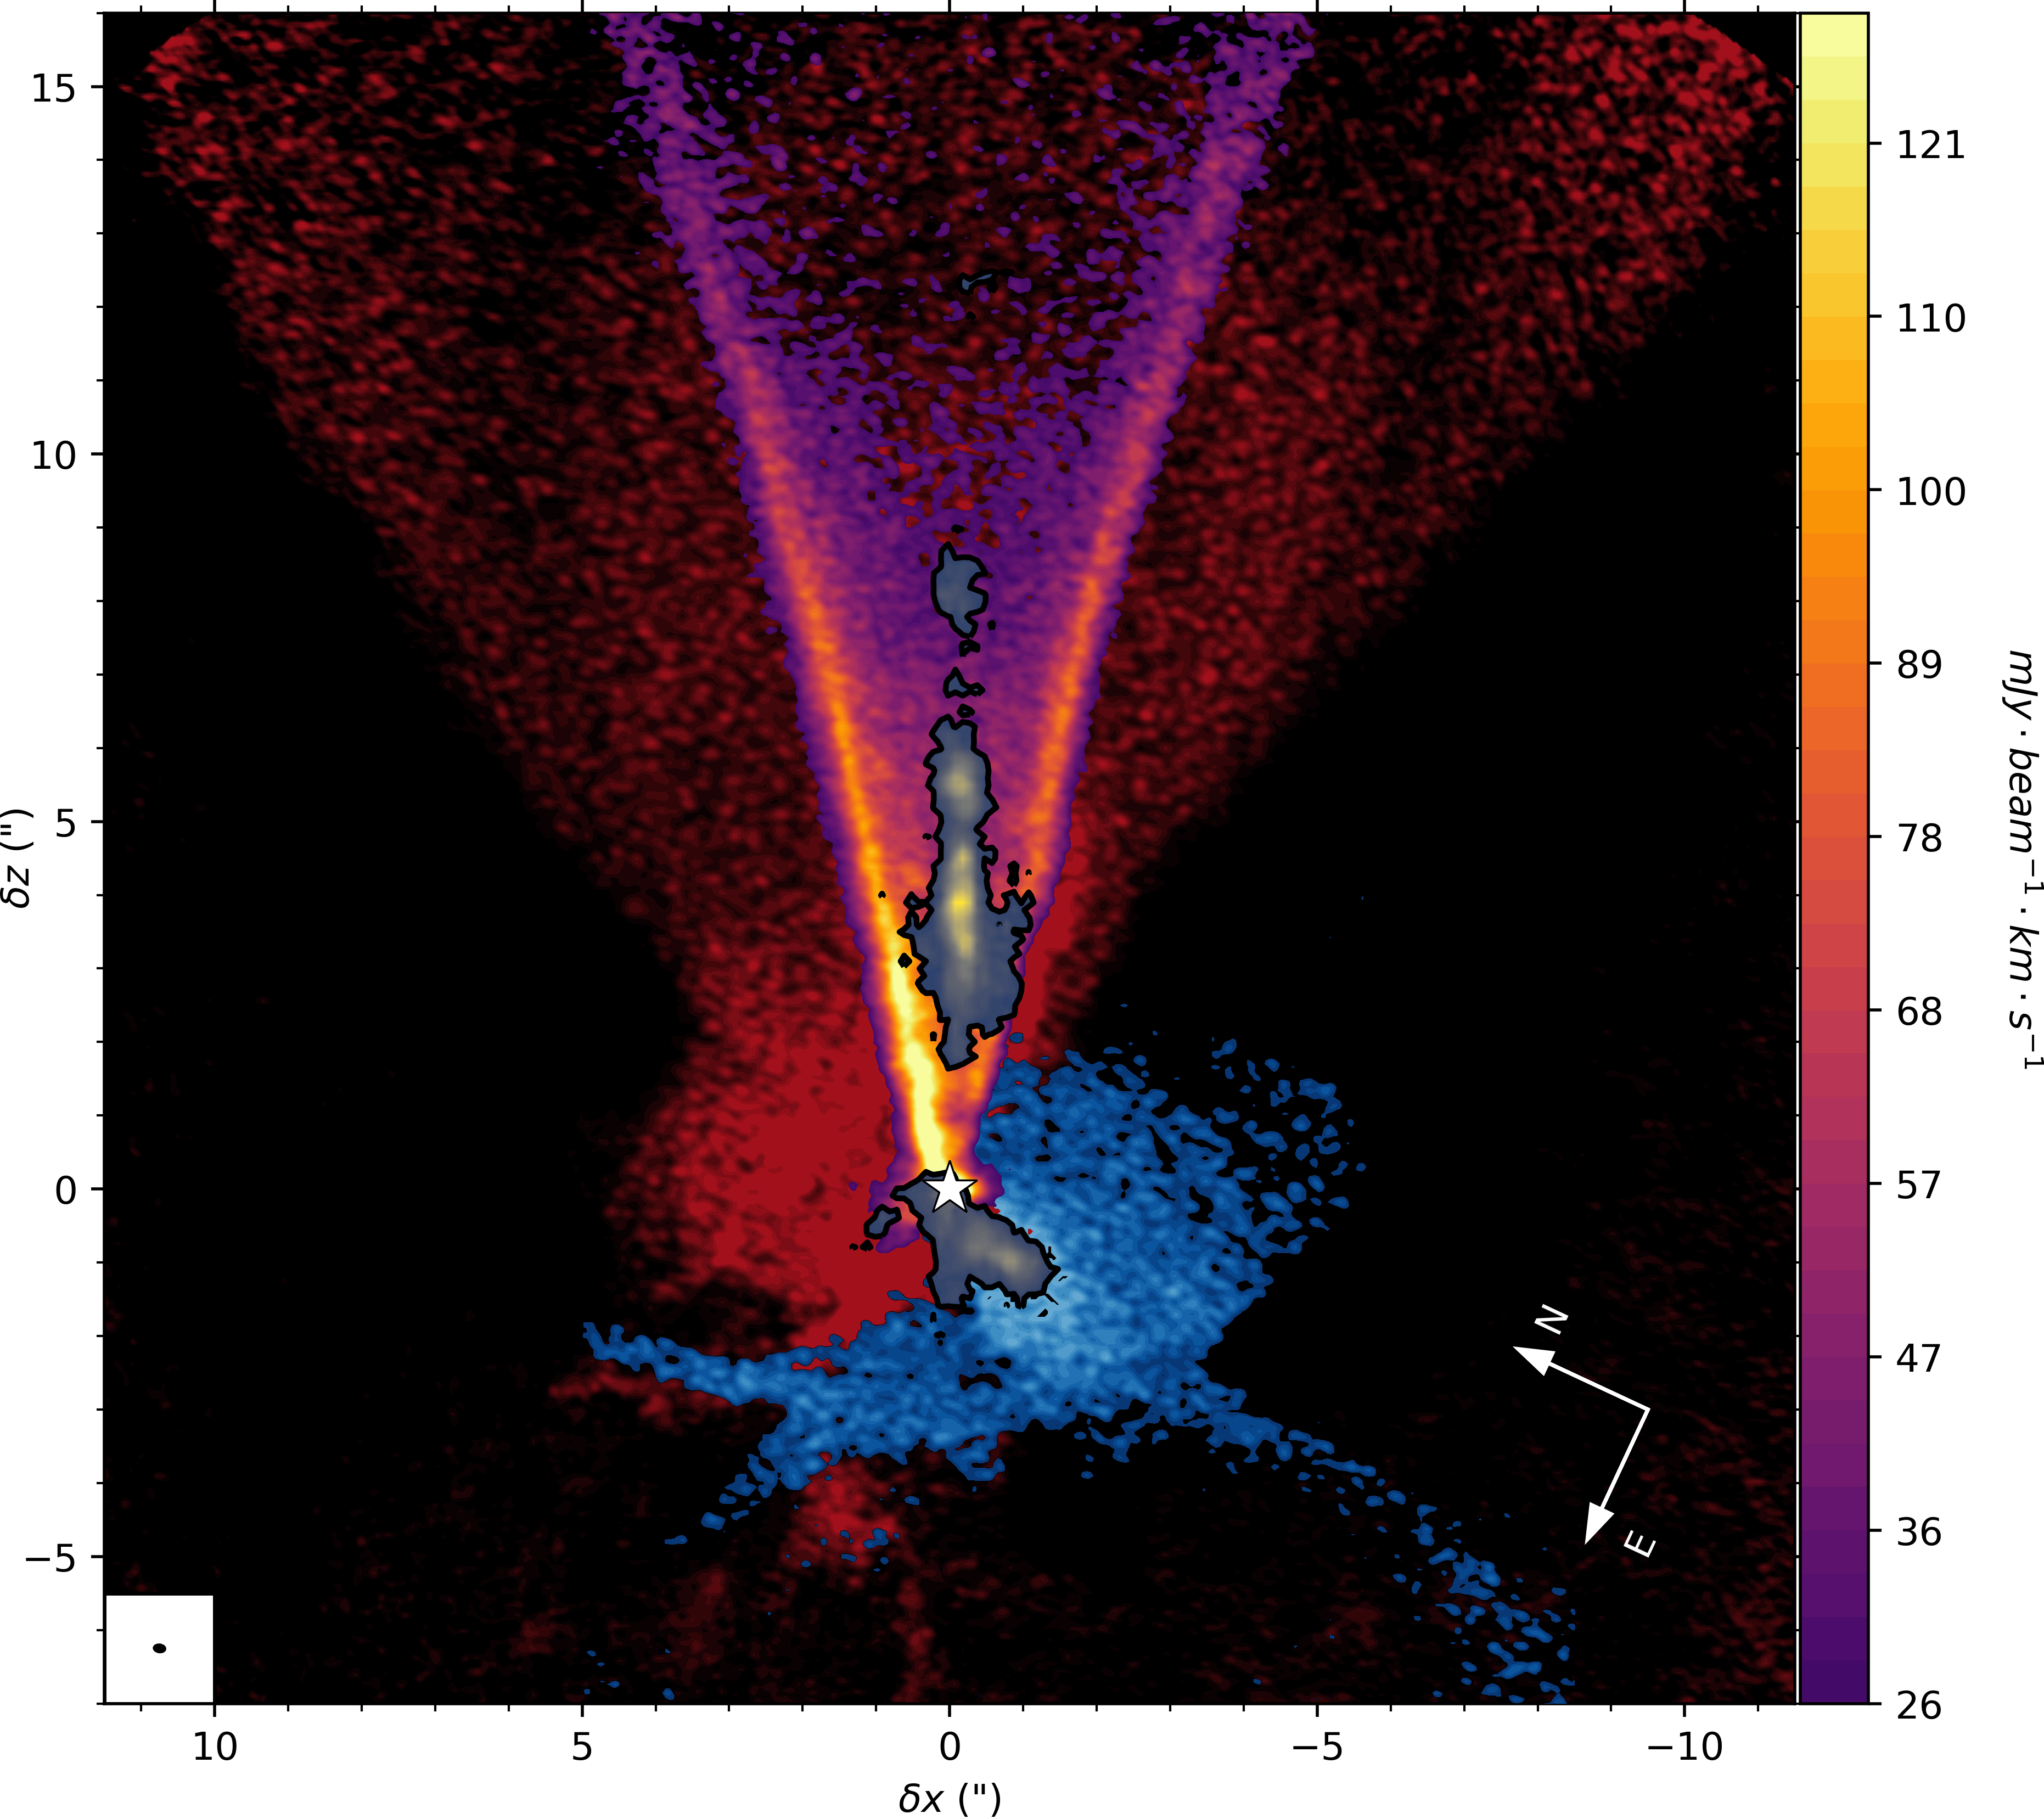
Since PPVI, it has become clearer that the fast, collimated, and knotty microjets are only the innermost region of flows that emerge from disk radii out to 100 au. The flows are characterized by a nested velocity structure, as first noted in optical forbidden lines of DG Tau A (Lavalley-Fouquet et al., 2000; Bacciotti et al., 2000; Coffey et al., 2008) where the lower blueshifted velocities ( 50 km/s) are spatially wider with larger opening angles than the jet. The spatial morphology of the different velocity regimes is illustrated in Fig. 3 for DG Tau A, superposing emission from [Fe II], H2 1–0 S(1) and 12CO (2-1). The [Fe II] emission shows the narrow jet ( km/s and km/s; solid green) with a semi-opening angle of nestled inside of a wider slower ( km/s; dashed green) cone of outflowing gas with a semi-opening angle of (Agra-Amboage et al., 2014). Interestingly, the faster jet is also more Fe-rich than the low-velocity ( km/s) sheath surrounding it, suggesting that the latter arises beyond the dust sublimation radius (Agra-Amboage et al., 2011). Both [Fe II] velocity components shown in Fig. 3 lie interior to a slower and more iron-depleted flow of semi-opening angle seen only in [O I] 6300 and [S II] 6731 (Maurri et al., 2014, not shown). This flow is itself surrounded by an even wider cone of H2 emission (purple contours) with deprojected semi-opening angle of mapped with near infrared AO IFU spectro-imaging at velocities of -15 km/s (Agra-Amboage et al., 2014). The outermost flow component in Fig. 3 is traced by low-velocity blueshifted CO emission in recent ALMA millimeter imaging (grayscale): in addition to the rotating disk contribution (asymmetric peak to the South), an arc-like structure is present from SE to NW. This is interpreted as a slow wind at km/s originating from close to the disk surface at a disk radius au, and with a deprojected semi-opening angle of (Güdel et al., 2018), similar to that inferred from the H2 near-infrared emission. Although not shown in Fig. 3, FUV fluorescent H2 emission pumped by Ly presents blueshifted emission with nearly identical morphology and velocity to the H2 2.12 \micron feature (Schneider et al., 2013; Agra-Amboage et al., 2014). Furthermore, there is evidence for rotation across the spatially broad, lowest velocity (from -75 to +50 km/s) atomic flow surrounding the jet, from transverse velocity shifts mapped in [O I] and [S II] lines (Bacciotti et al., 2002).
To date, there are a few other examples of ALMA millimeter CO imaging interpreted as a slow, wide molecular flow which encompasses a narrow jet and sometimes also wider atomic and outflows, extending 100s of au above the disk. In HH 30 the fast axial microjet seen in forbidden lines (Bacciotti et al., 1999), is enclosed within what appears as a hollow cavity defined by a cone-shaped CO molecular flow with semi-opening angle of and a transverse expansion velocity of 5 km/s, suggesting a full deprojected flow speed km/s (Louvet et al., 2018). The intersection of the CO cone with the HH 30 disk midplane defines a geometric radius of 10 au. Another example is HL Tau with a slow CO flow seen with ALMA (Garufi et al., 2020, Bacciotti, in prep.) surrounding both the high velocity jet seen in forbidden lines and a wide angle H2 cone (Takami et al., 2007; Beck et al., 2008). The more massive ( M⊙) star HD 163296 also has an optical jet surrounded by both a very slow molecular outflow (30 m/s) thought to originate beyond 300 au (Teague et al., 2019) and a much larger and faster ( km/s) molecular flow extending vertically out to 1000 au (Klaassen et al., 2013; Booth et al., 2021).
In HH 30, mass loss rates in the fast optical jet and slow CO wind can now be compared. The jet rate, at yr-1 (Bacciotti et al., 1999), is nearly 50 times lower than the yr-1 of the disk wind (Louvet et al., 2018). Assuming a typical jet-to-accretion mass flux of 10%, the wind mass loss rate is 5 times the accretion rate. Also in HH 30, ALMA data revealed small rotation velocities ( km/s) in the CO molecular wind in the same sense as the disk. The rotation is traced up to vertical extents of 250 au but accounting for wiggling of the flow axis is necessary to avoid spurious rotation signatures (Louvet et al., 2018). As will be addressed in § 4.1, interpreting this outflowing, rotating molecular cone as an MHD wind is favored over swept up gas because of the high inferred mass loss rate from radii 10 au.
We anticipate that outer slow moving cones of cold molecular winds will be found more frequently with ALMA in the coming years. Even with the current data, the evidence is compelling that in spatially resolved Class II outflows mass ejection occurs over a wide range of disk radii, with an inner fast axial jet surrounded by a wider, slower moving wind than can extend radially almost out to 100 au. These cone shaped molecular flows show no hints of recollimating into a jet, but maintain their opening angles up to 1,000 au above the disk surface.
2.2.2 Spatially Unresolved Flows
Spatially unresolved flows are widely traced by forbidden line profiles and surveys of nearby star-forming regions are based on the [O I] 6300, the brightest of the forbidden emission lines detected in 80-90% of the accreting T Tauri stars.
HVC / jet. Among sources with [O I] 6300 detections, 30% of the young ( Myr) and 10% of the old ( Myr) T Tauri stars show HVC emission (McGinnis et al. 2018; Nisini et al. 2018 and Fang et al. in prep.). This HVC emission is preferentially detected among sources with higher stellar mass accretion rate and mass. The HVC can be linked to the spatially and spectrally resolved forbidden line images where it is associated with the fast collimated jet (e.g., Bacciotti et al., 1999; Agra-Amboage et al., 2011). In agreement with past work, Nisini et al. (2018) find a strong correlation between the jet mass ejection rate () inferred from the HVC and the stellar mass accretion rate () with an average ratio of 0.07, a spread of more than an order of magnitude, and some examples of high accretion rate sources with no HVC. At least some of these outliers are likely sources where system inclination projects the HVC into the LVC velocity regime.
A surprising new finding on the HVC/jet kinematics as falls below yr-1 is reported by Banzatti et al. (2019). Unlike the resolved jets in higher accretion rate sources which have outflow velocities of several 100 km/s regardless of source luminosity, the centroid of the most blueshifted unresolved HVC component, after correction for inclination, correlates with the accretion luminosity. This suggests a continuum of HVC/jet terminal velocities from 300 km/s down to 50 km/s, decreasing systematically as the accretion luminosity falls by three orders of magnitude.
In addition to the forbidden line HVC, another indicator of outflowing gas with velocities up to several hundred km/s is blueshifted absorption in permitted lines, where the absorption occurs along the line of sight to the star. The blueshifts in strong lines such as He I 10830 or C II 1335 are inclination dependent, where deep and broad absorption, from 0 up to 400 km/s, is seen only in sources with low inclinations (Edwards et al., 2006; Xu et al., 2021). In contrast, at high inclinations the absorption changes to shallow and narrow, with blueshifted centroids km/s. The interpretation is that when viewed close to pole-on, the line of sight passes through a fast wind emerging from the star or its near environs, while when viewed closer to edge-on, the line of sight passes through a slower disk wind (Kwan et al., 2007). Although mass loss rates from the atomic wind seen in He I 10830 and C II 1335 are difficult to quantify, the strength of these features correlates with the mass accretion rate (Edwards et al., 2006).
LVC / wind. In contrast to the HVC, almost all stars with [O I] 6300 detections have LVC emission, covering the full range of T Tauri accretion luminosities (Natta et al., 2014; McGinnis et al., 2018; Nisini et al., 2018). As with the HVC there is a good correlation of the LVC luminosity with , with the majority of non-detections falling among lower accretion rate sources. The LVC component can be linked to spatially and spectrally resolved forbidden line images, corresponding to the slower, wider disk winds, e.g. DG Tau A (§ 2.2.1) and the recent result from CT Cha with VLT/MUSE (Haffert et al. in prep.).
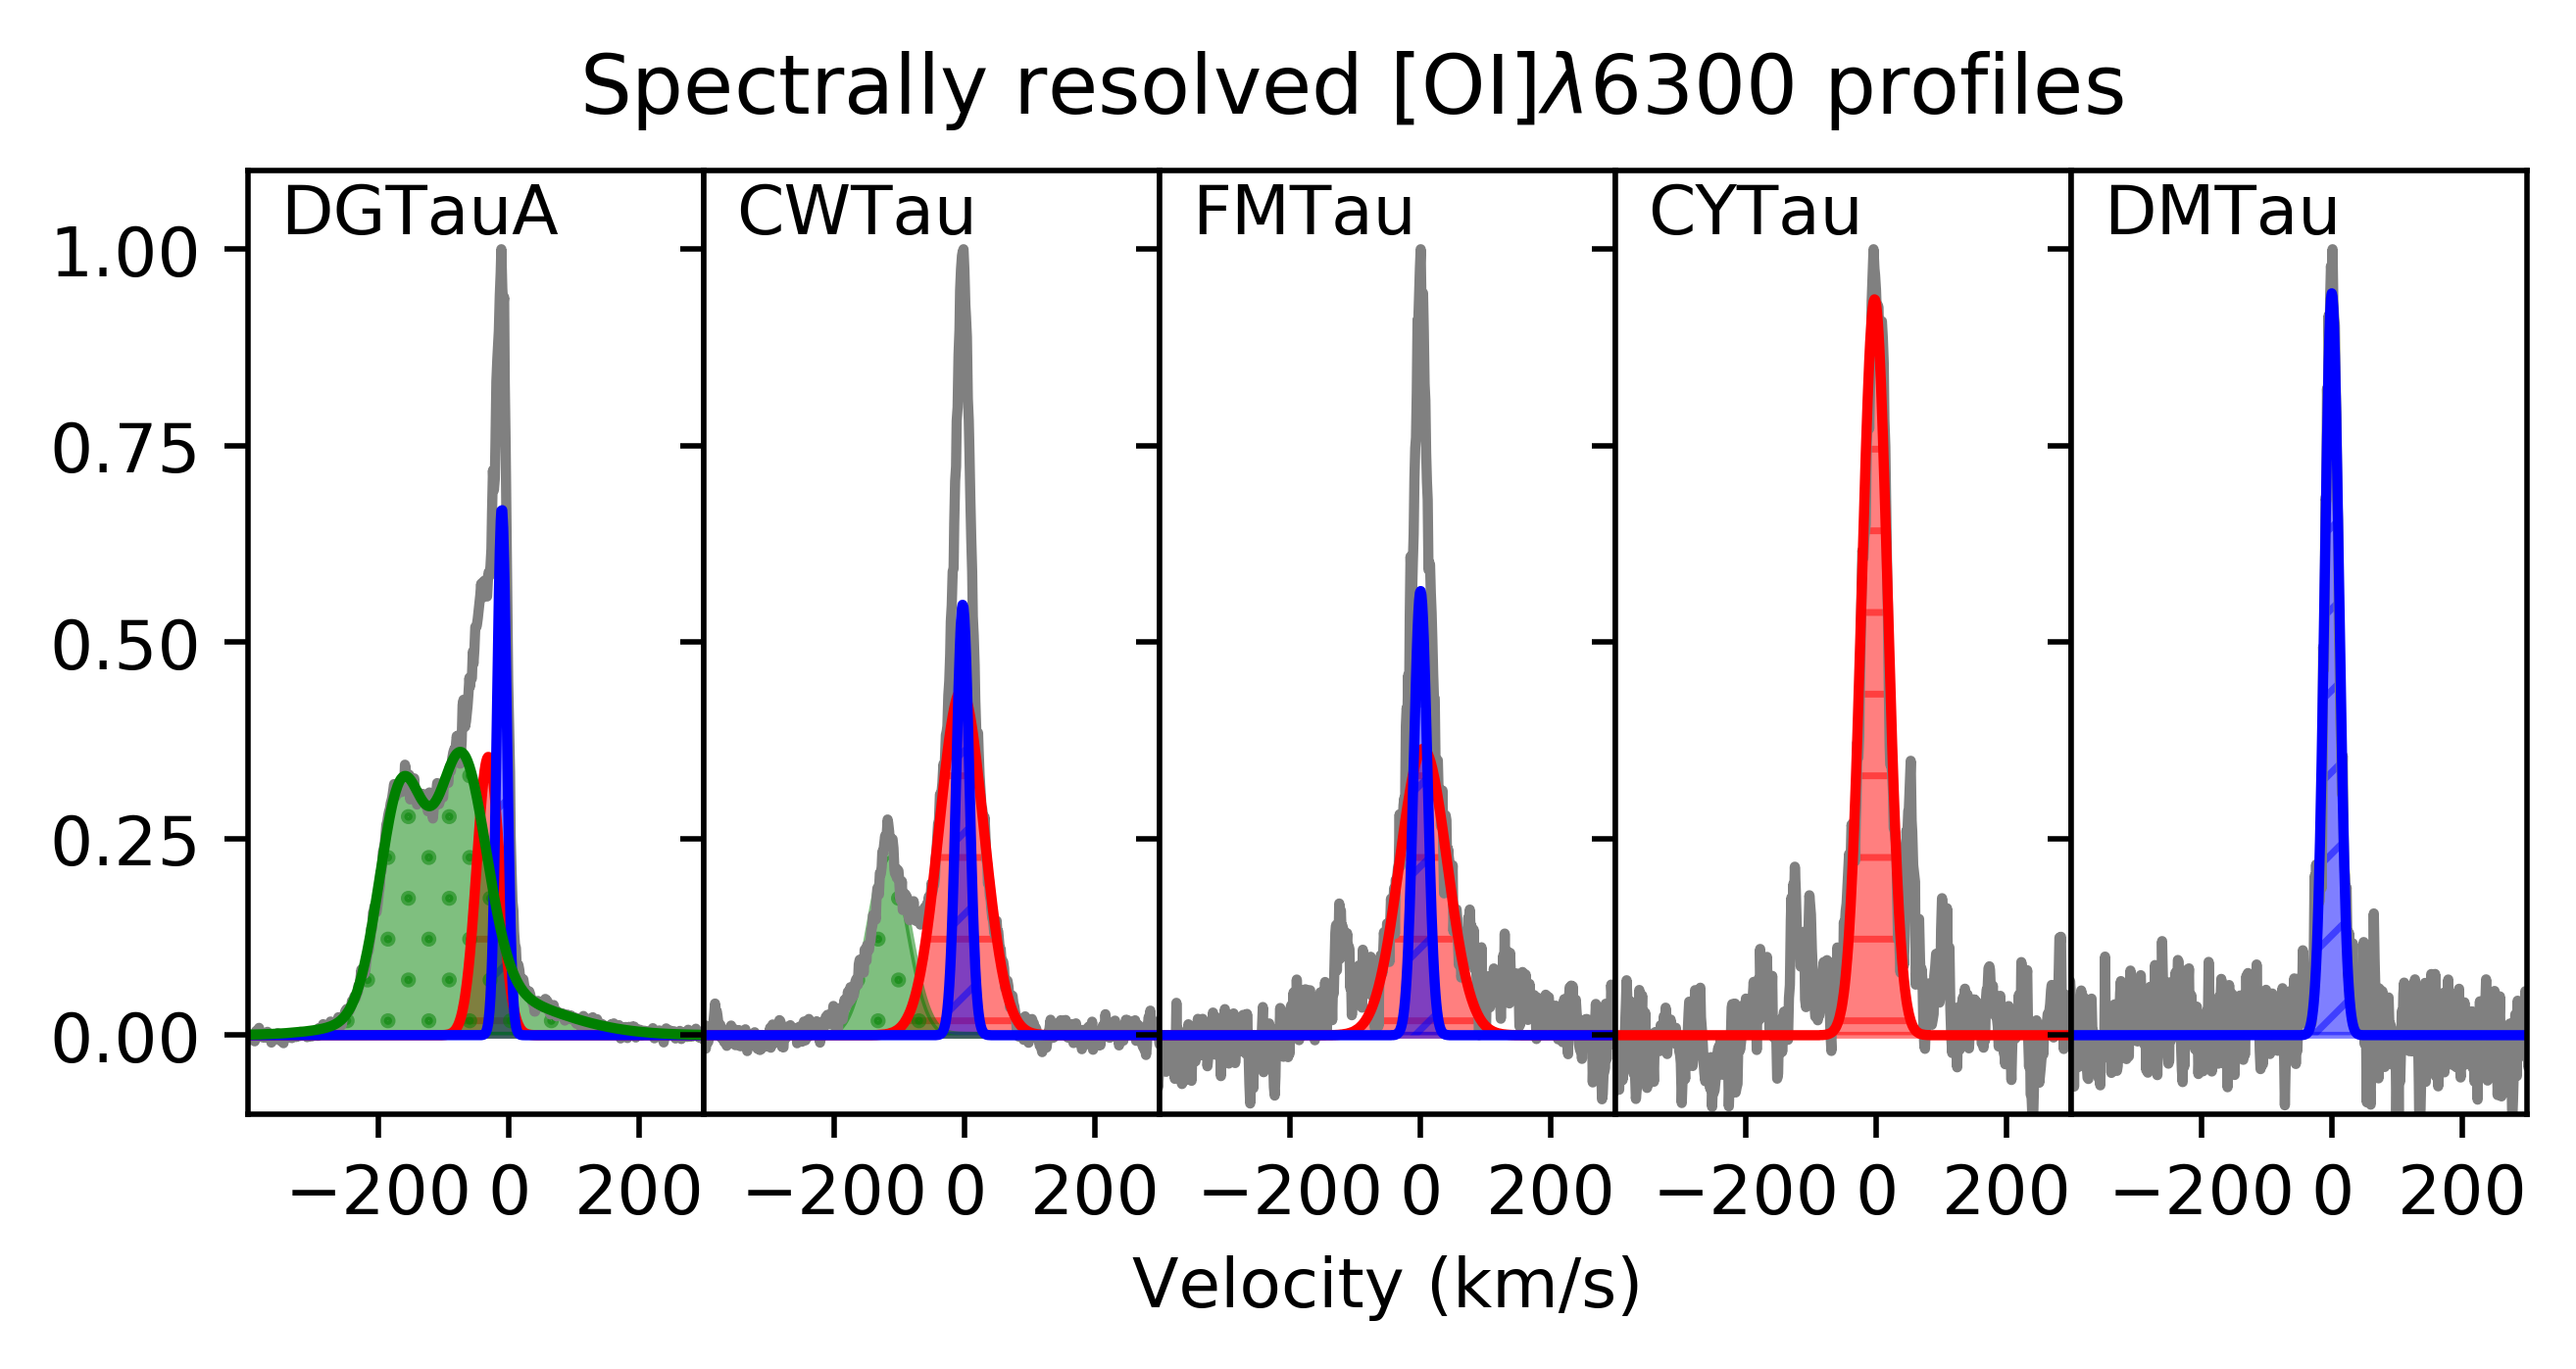
Since PPVI, high spectral resolution revealed that the [O I] 6300 LVC can either be decomposed via Gaussian fitting into two distinct kinematic components or is well described by a single Gaussian, see Fig. 4 for representative profiles. We note that this decomposition is a tool to empirically describe line profiles and the identification of different kinematic components does not necessarily imply different physical mechanisms as further discussed below. When two components are present, one is broader and more blueshifted (FWHM km/s and centroid velocity v km/s) than the other one (FWHM km/s and v km/s), hence the naming BC and NC (Rigliaco et al., 2013; Simon et al., 2016; McGinnis et al., 2018; Fang et al., 2018; Banzatti et al., 2019). In those sources where [O I] 6300 shows both a BC and NC, a similar kinematic distinction is also seen at [S II] 4068 and in the fainter [O I] 5577 line (Simon et al., 2016; Fang et al., 2018). However, not all LVC show this two component structure, which is preferentially found among stars with higher accretion rates (Banzatti et al., 2019). In a survey of forbidden lines in 108 T Tauri stars in NGC 2264, McGinnis et al. (2018) found all but one had LVCs, where 27% were BC+NC profiles, with the remaining single component profiles roughly evenly apportioned between those mimicking the properties of either the BC or the NC.
The tendency for the BC and NC to have small blueshifts indicates they are formed in slow winds. Importantly, when the [O I] 6300 LVC does show a two component structure, the BC and NC line widths, equivalent widths, and centroid velocities correlate, clearly indicating a strong connection between what appear as two distinct kinematic features (Banzatti et al., 2019). Disk inclination, as inferred from resolved ALMA continuum images, appears to influence the observed centroid velocities of the BC, where the highest velocities (30 to 40 km/s) are found in systems with disk inclinations around , consistent with the requisite semi-opening angle of early ideal MHD disk winds (e.g., Blandford and Payne, 1982, and § 3.2). The much lower NC centroid velocities hint at a similar relation, as might be expected from the good correlation between BC and NC centroid velocities.
The widths of both BC and NC are also found to correlate with disk inclination. When the widths are normalized by the square root of the stellar mass, as expected if they are broadened by Keplerian rotation in the disk, then the BC widths correspond to rotation in the inner disk ( 0.5 au) and the NC widths to the outer disk, between 0.5 to 5 au (McGinnis et al., 2018; Simon et al., 2016). The inner disk wind traced by the BC is somewhat faster than the NC, reminiscent of the velocity-radius progression seen in resolved outflows. These disk winds are closely tied to accretion, as the correlation between the [O I] 6300 LVC luminosity and the accretion luminosity and mass accretion rate extends to the individual NC and BC components as well (Simon et al., 2016; Fang et al., 2018). In contrast, there is only a weak correlation with the stellar luminosity and mass (e.g., McGinnis et al., 2018; Nisini et al., 2018) and no correlation with X-ray luminosity (Rigliaco et al., 2013; McGinnis et al., 2018; Fang et al., 2018).
Mass loss estimates can be made for the BC and NC from the optically thin [O I] 6300 line, where its luminosity is combined with the measured centroid velocity, gas temperature, and an estimate for wind height. The temperature can be recovered from comparing [O I] 6300 and [S II] 4068, which have similar profiles (Fang et al., 2018), indicating they come from the same physical region. Unlike [O I] 6300, which could be formed either via thermal excitation or by OH dissociation by UV photons, with very different implications for temperature, [S II] 4068 can only be thermally excited (e.g., Natta et al., 2014). Thus, ratios of these two lines, plus [O I] 5577, constrain the electron density and temperature of the thermally excited gas to cm-3 and 5,00010,000 K, respectively (Fang et al., 2018). Although the vertical heights are not constrained, assuming that they are the same as the radii inferred from the FWHM of the BC ( au) and NC ( au), the mass loss rate in the BC is more than an order of magnitude higher than in the NC (Fang et al., 2018). Importantly, unless the BC vertical extent is more than ten times the radius inferred from the FWHM, BC mass-loss rates are, on average, of the same order as mass accretion rates, hence significantly higher than the HVC/jet rates.
Evidence for a molecular component to the disk winds of the unresolved LVC sources, analogous to those seen in resolved outflows, comes from Gangi et al. (2020) who present the first high-resolution (7 km/s) survey at optical and near-infrared wavelengths. Out of their 36 T Tauri stars in Taurus they detect the [O I] 6300 line in all but one source and the H2 1-0 S(1) at 2.12 \micron in half of their sample. H2 profiles are found to be less complex than the [O I] 6300 profiles, and mostly single-peaked with only modest blueshifts ( km/s), see also Bary et al. (2003). Although the H2 and [O I] LVC-NC luminosities are not correlated, for sources where both lines are detected, their peak velocities are quite similar and their FWHMs correlate, pointing to a common origin. There is also a tendency for H2 to be narrower than [O I] LVC-NC, suggesting an origin at a larger disk radius. Of the 17 sources with H2 detection in Gangi et al. (2020), seven have previous IFU high-resolution (0.1′′) spectro-imaging in this line, of which 5 show a wide angle morphology suggestive of a wind (Beck and Bary, 2019, and references therein). CO fundamental emission at 4.67 \micron in T Tauri stars shares some properties in common to [O I] 6300: the transition from the main isotopologue is detected in all accreting stars, profiles are predominantly, but only modestly, blueshifted, and often show a BC plus NC structure. For CO it can be shown that these two components are formed at different excitation temperatures, where the BC dominates the flux of = 2-1 (vibrationally hotter) and the NC of = 1-0 (vibrationally cooler), in accordance with the BC arising at closer stellocentric distances. At high inclinations CO profiles not only broaden but, unlike forbidden lines, begin to show central absorptions, also with small blueshifts, attributed to the line of sight grazing a low velocity wind over the disk surface. In all, the majority of T Tauri CO profiles are interpreted as arising in a low velocity disk wind, although blueshifts above 5 km/s are limited to a handful of sources (Bast et al., 2011; Pontoppidan et al., 2011; Brown et al., 2013; Banzatti et al., 2022). For one source, RU Lup, this evidence is corroborated by similarly shaped spectro-astrometric signals in the LVC-NC optical forbidden lines (Whelan et al., 2021). Interestingly, the peak velocities and astrometric offsets increase as the critical density of the transition drops (from CO fundamental, to [O I] 6300, to [S II] 6731) suggestive of material lifting from the disk.
The disk wind probed by the [O I] 6300 profiles appears to evolve as the inner dust disk is depleted, with the latter traced by infrared spectral indices ( and , McGinnis et al. 2018; , Banzatti et al. 2019; , Fang et al. in prep.) which are often related to the accretion luminosity. The HVC and LVC with both BC + NC are only found in sources with optically thick inner disks. As the disk is depleted, McGinnis et al. (2018) find that the proportion of single component profiles shifts from a higher percentage of BC to a higher percentage of NC, with the NC persisting in optically thin disks with a dust cavity, the so-called transition disks (Ercolano and Pascucci, 2017; Banzatti et al., 2019, see also § 4.3). Additional evidence for an evolving disk wind comes from a recent high-resolution (10 km/s) survey carried out with the VLT/VISIR2 spectrograph covering the [Ne II] line at 12.8 \micron (Pascucci et al., 2020). This line shows an LVC similar to the optical forbidden lines in some sources (Pascucci et al., 2011; Alexander et al., 2014; Pascucci et al., 2020). However, this new survey finds that the [Ne II] LVC luminosity increases as the dust inner disk is depleted, which is opposite to the [O I] LVC. Moreover, the majority of full disks lack a [Ne II] LVC, in spite of having an [O I] LVC tracing an inner disk wind. These findings led Pascucci et al. (2020) to conclude that the 1 keV hard X-ray photons needed to ionize Ne atoms (§ 4.4.1) are somehow screened in full disks by inner MHD winds that are mostly molecular, except for a hot surface exposed to the star emitting in the [O I] LVC.
The nested velocity structure that is well documented in resolved outflows appears to persist when the spatial scale of the outflows has diminished and can only be traced spectroscopically. This conclusion is based on attributing forbidden line HVC to a fast axial jet and the forbidden line widths of the (faster) broad and (slower) narrow components of the LVC to the radii at which the disk winds arise. As in resolved jets and winds, the HVC is time variable in kinematic structure and luminosity, while the LVC is stable over decades (Simon et al., 2016). Several studies have examined whether the HVC and LVC have different excitation conditions, a question which is not yet resolved. A multi-line analysis of forbidden lines covering a large range in excitation and ionization conditions in 7 high accretion rate sources found physical parameters, such as temperature, electron density, and ionization fraction, to vary smoothly with velocity across the forbidden lines, spanning both the HVC and LVC, suggesting similar physical conditions (Giannini et al., 2019). In contrast, a study of 48 T Tauri stars covering a range of mass accretion rates suggests different excitation mechanisms for the HVC and LVC emission, where line ratios in the HVC indicate a shock origin in contrast to a thermal origin for the LVC (Fang et al., 2018). Furthermore, a recent spectro-astrometric study of one high accretion rate source, RU Lup, shows different spatial extents and opposing velocity gradients in the HVC and LVC (Whelan et al., 2021). It thus appears more likely that the LVC and HVC are dynamically separate flows.
| Property | Class 0 | Class I | Class II | Ref. |
|---|---|---|---|---|
| (M⊙/yr) | 1,2,3,4 | |||
| (au) | 5,6,7,8 | |||
| Jets (HVC) | ||||
| molecular tracers | CO, SiO, SO, H2 | H2 | H2 | 1,9 |
| atomic tracers | [S II], [Fe II] | H, [O I], [S II], [Fe II] | H, [O I], [S II], [Fe II] | 1,10 |
| semi-opening angle (∘) | 11,12,13,14,15 | |||
| (M⊙/yr) | 1,16,17,18,19 | |||
| / | 1,20,21,22 | |||
| Winds (LVC) | ||||
| molecular tracers | SO, SO2 | H2, CO | H2, CO | 1,23,24 |
| atomic tracers | unknown | [O I], [S II] | [O I], [S II] | 25,26,27 |
| semi-opening angle (∘) | 7,25,28,29,30,31 | |||
| (M⊙/yr) | 7,26,32 | |||
| / | 7,26,32 | |||
| Specific AM**The specific Angular Momentum (AM), and the geometric () and cold MHD wind launching radii () are further discussed in § 4.1.2 and are only available for a few spatially resolved winds, see § 2.1.2 for the Class 0/I and HH 30 and DG Tau A for the Class II. (au km/s) | 20-100 | 40-250 | 20-300 | 7,28,29,31,33,34,35,36 |
| **The specific Angular Momentum (AM), and the geometric () and cold MHD wind launching radii () are further discussed in § 4.1.2 and are only available for a few spatially resolved winds, see § 2.1.2 for the Class 0/I and HH 30 and DG Tau A for the Class II. (au) | 20-120 | 7-40 | 5-10 | 7,28,29,31,33,34,35,37 |
| **The specific Angular Momentum (AM), and the geometric () and cold MHD wind launching radii () are further discussed in § 4.1.2 and are only available for a few spatially resolved winds, see § 2.1.2 for the Class 0/I and HH 30 and DG Tau A for the Class II. (au) | 0.3-40 | 0.8-32 | 0.5-3 | 7,28,29,31,33,34,35,36 |
2.3 Empirical evolution
Spatially resolved outflows in Class 0, I, and II sources share many features in common, including both collimated jets and wider winds, implying that the accretion/ejection mechanisms are similar over a wide range of ages and accretion rates. We summarize the key outflow diagnostics and properties described in the previous two sections in Table 1, including primary tracers, jet and wind opening angles, ejection rates, and ejection to accretion ratios. We also include the range of mass accretion rates () and gas disk radii () as they are directly relevant to testing classic viscous disk models against wind-driven accretion models (§ 3.4 and 4.4.4). There is a trend for mass accretion rates to decline as the system evolves, both through Class 0 and Class I stages and also through the wide range of ages characterizing the Class II sources, yr. The Class II encompass at the high end those sources with full dust disks with robust spatially resolved outflows to, at the low end, sources where the disk is dissipating, the accretion rate is dropping, and evidence for a jet/HVC disappears; yet a blueshifted LVC indicates a disk wind persists.
The behavior of with evolutionary stage is less clear. A tendency for the maximum value of to increase going from Class I to Class II disks was reported by Najita and Bergin (2018) based on disk radii compiled from the literature. For the Class II statistics in Table 1, we relied solely on a recent ALMA study based on 12CO data, analyzed in a homogeneous way (Sanchis et al., 2021), and expanded the sample of Class 0 and I sources. With this compilation, there is instead a suggestion that the Class 0 sources have maximum smaller than both Class I and II. Thus at present, it is unclear if the maximum value of increases over time, as expected for viscous spreading, given the wide range of at all stages, the differing diagnostics and approaches for the Class0/I disks, and a number of unresolved disks that are not included in these statistics.
When jets are resolved, their morphology is strikingly similar throughout the three evolutionary stages, including opening angles and knots of shocked gas advancing along the flow with three characteristic periods, a few years, a few 10 years, and a few hundred years (Cabrit, 2002; Frank et al., 2014; Lee, 2020). Not only does the jet morphology persists over a wide range of ages and accretion rates, but the ratio / 0.1 appears to be constant as the system evolves, with the jet ejection rate dropping in tandem with the stellar mass accretion rate (see also Fig. 7 in Sperling et al. 2021).
What is new since PPVI is the growing evidence that a slow disk wind, not the jet, is the dominant source of mass outflow. Although the number of systems imaged with ALMA to date is limited, small scale, rotating cones of outflowing molecular gas are found to surround the narrow jet at all evolutionary stages. Their velocities are 10 km/s and their semi-opening angles of are significantly larger than those of jets and remain the same as the source evolves. Their base radii, when estimated from geometric projections, are of the order of tens of au (MHD launch radii are slightly smaller, see § 4.1). In a few cases, the CO cones appear to be entirely one-sided, although the disk is symmetric and the atomic high-velocity jet is bipolar, e.g. DG Tau B (Class I) and HH30 (Class II). When both jet and molecular wind ejection rates can be estimated, are 50x and / are on the order of unity. If this turns out to be typical, the conclusion is that there is significantly more mass ejected in the slow winds than in the jets and wind mass loss rates may be sufficient to drive disk evolution.
The behavior of disk winds in spatially unresolved outflows, which constitute the majority of Class II sources, is traced by LVC forbidden line emission. As described in § 2.2, mass loss rates can be estimated from these lines but strongly depend on the assumed gas temperature and wind geometry, especially the vertical extension of the emission (Natta et al., 2014; Fang et al., 2018). Even with these caveats, the mass loss rates for the LVC BC are higher than for the LVC NC and also higher than for the HVC (Fang et al., 2018). Pinning down the wind geometry in forbidden line emission is necessary to reduce the uncertainty of / () estimated from optical tracers in the Class II stage. In any case, if Class II winds are mostly molecular (e.g., Pascucci et al., 2020), these optically inferred values will be lower limits.
Evidence for a transformation in the character of jets and winds comes during the later Class II phase when the mass accretion rate falls below M⊙/yr and infrared spectral indices indicate disk dissipation. The general trend, although with a lot of scatter, is that first the terminal velocity in the [O I] 6300 HVC drops, then the HVC becomes undetectable but LVC BC and NC emission from the disk wind is still present (Simon et al., 2016; Banzatti et al., 2019). As the inner disk continues to thin out, the BC disappears but the NC persists, sometimes no longer showing a clear blueshift at [O I] (Ercolano and Pascucci, 2017; McGinnis et al., 2018). However, in the lowest accretors a narrow and blueshifted [Ne II] feature appears, with Ne atoms presumably ionized by hard X-rays no longer screened by a dense inner disk wind, and the luminosity of this feature increases as the inner disk is dissipated, in contrast to the [O I] LVC-NC (Pascucci et al., 2020). This latter phase includes transition disks with large inner dust holes such as T Cha and V4046 Sgr.
3 THE THEORY OF DISK WINDS
This section provides a thorough overview of MHD disk winds as well as PE winds. To bridge the gap between theorists and observers, we adopt a pedagogical approach and focus on the salient physics and assumptions that these models are built upon. We discuss model predictions that can be tested by observations in § 4.
The most significant theoretical insights since PPVI have been achieved by advanced computational methods. It has now become possible to couple gas dynamics with magnetic fields, thermal energy transport, and chemistry in global simulations of the entire disk thus moving toward a more complete view of disk evolution. Physical conditions in the outflowing gas, such as the density, temperature, and ionization fraction are central to the development of a comprehensive theory. Along with an understanding of the chemical state and abundances of tracer species, they are essential to interpreting and making inferences from the observations summarized in § 2.
We first begin with a basic overview of gas heating and ionization, especially as it pertains to observed line emission (§ 3.1). Next, we discuss MHD winds along with their launching and mass loading mechanisms, describe recent global disk simulations, and briefly summarize different wind types in the inner ( 0.5 au) disk, see § 3.2. This is followed by a summary of our current understanding of how disks evolve, covering a description of the evolution of the magnetic field (§ 3.2.5), PE winds and disk dispersal at the final epoch (§ 3.3), and the expected evolution of mass ejection and accretion (§ 3.4).
3.1 Thermal and ionization state of outflowing gas
The local flux of stellar high energy photons determines the chemical state in wind regions and, to some extent, the thermal energy balance. The flux is generally characterized as Far UltraViolet (FUV; eVeV), Extreme Ultraviolet (EUV; ), and X-ray (eV). Terms such as XEUV and XEFUV thus refer to a combination of flux bands, more specifically X-ray + EUV for the former and X-ray + EUV + FUV for the latter. Of these bands, hydrogen-ionizing EUV photons penetrate the least into the wind (or disk) material, up to column densities cm-2 before they are absorbed, and heat gas to temperatures K. For young, accreting, and chromospherically active stars, X-ray photons range in energy from keV. They have an absorption cross-section cm-2 (Wilms et al., 2000) and their penetration depth and heating ability via the Auger effect on metals depends on photon energy. Ionization determines heating; ejected primary photoelectrons have abundant kinetic energy which can lead to further (secondary) ionization and eventually convert the excess kinetic energy to gas thermal energy via collisions. Soft X-rays at the low end of the spectrum can ionize at levels of 10% and heat gas to K; however they are readily absorbed in atomic gas at column densities of cm-2. Harder 1 keV X-rays penetrate deeper to cm-2 and their ability to heat gas to high temperatures depends on the chemical state of the gas (Maloney et al., 1996). Atomic gas can attain a few thousand K, but molecular gas cools efficiently due to higher available degrees of freedom and leads to lower gas temperatures.
At column densities cm-2, FUV photons can dominate heating although FUV heated gas seldom exceeds K. FUV photons can ionize gas up to levels of ion abundances relative to H nuclei, depending on metallicity, but heating is not as strongly tied to ionization as in the case of EUV and X-rays. FUV heating can occur by several gas photoprocesses as well as photoelectric ejection of electrons from small dust grains, including polycyclic aromatic hydrocarbons (PAHs). Due to the latter, FUV heating is strongly coupled to the dust content in winds; high amounts of small dust can heat gas more efficiently but also severely attenuate the FUV flux and decrease its penetration depth into the wind. Depending on the dust absorption cross-section per H nucleus in the wind, determined by the dust/gas mass ratio, dust size distribution and material properties, FUV photons can penetrate up to column densities of cm-2, at which point gas opacity gains in significance. Lyman- excited H in the level, C, Fe, Si, S, Mg atoms, the common molecules H2, CO, OH and H2O, and many other abundant gaseous species have photoionization and photodissociation thresholds in the FUV energy range (eV) and excess energy from the photo-processes are a source of heating even in the absence of dust. FUV pumping, where H2 (or other species) absorbs a photon and collisionally de-excites in high density gas, can be an additional significant source of heating (Tielens and Hollenbach, 1985). In low density gas, pumping may lead to radiative de-excitation (see Nemer et al., 2020, for [O I] emission produced by UV pumping).
While order-of-magnitude estimates were introduced above, the gas temperature is a key thermodynamic variable that needs to be accurately determined when solving for pressure gradients and wind flow properties, or when interpreting line emission. The gas temperature is determined by a complex balance between various heating processes, and cooling mechanisms like collisions with dust grains and line emission from ions, atoms and molecules (whose abundances in turn depend on chemical processes). At the surface, where winds are launched, grain photoelectric heating by FUV photons, formation of molecular hydrogen whereby some of the binding energy is converted to heat, and excess electron energy from photo-dissociation (by FUV) and from photo-ionization (FUV, EUV and X-rays) all heat the gas. Gas in magnetized jets and winds can also be heated by dissipative non-ideal MHD processes: Ohmic heating due to electron collisions with neutrals and ions, and ambipolar diffusion heating due to ion-neutral drag, in particular, can be dominant in both atomic and molecular MHD disk winds, at altitudes where photo-heating is inefficient (e.g. Garcia et al., 2001; Panoglou et al., 2012; Wang et al., 2019). Adiabatic terms — expansion cooling in winds and compression heating in jet collimation regions — can become significant if dynamical timescales are short relative to heating and cooling timescales.
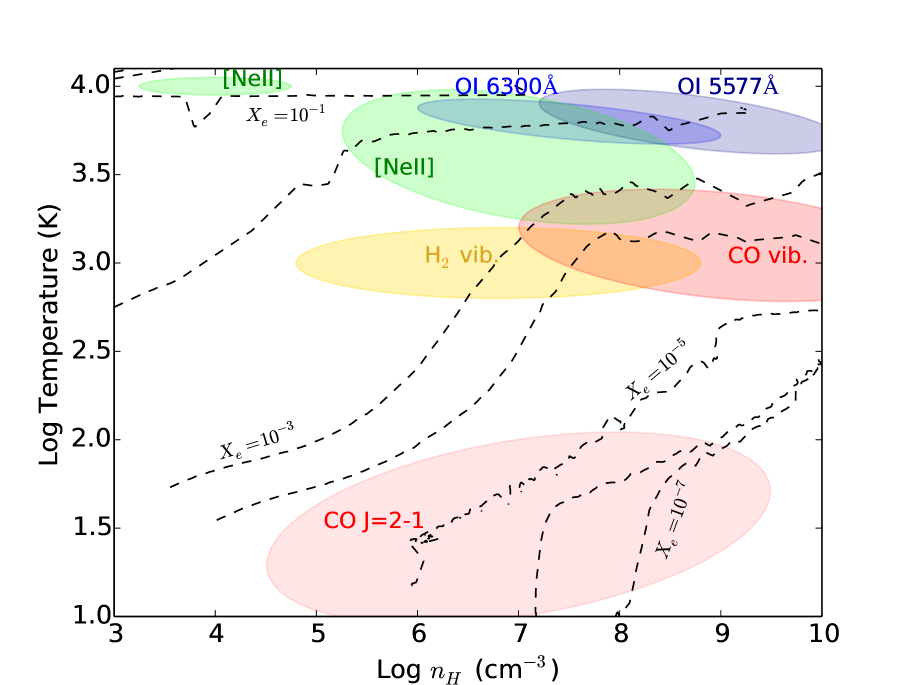
The chemical state of the gas— whether ionized, atomic or molecular—affects line cooling/emission and sets the gas temperature. Apart from the requirement that densities and temperatures be high enough for collisional excitation, photoionization/photodissociation constraints need to be met for an emission line to be observed. Fig. 5 delineates the emission regions of commonly observed wind diagnostic lines discussed in § 2 on a H nuclei number density temperature plot. The ellipses indicate approximate locations drawn from a large library of disk atmospheric thermochemical calculations (Gorti et al., 2009, 2015), and the electron abundance (often similar to the ionization fraction) is indicated for one such model. Note that the electron abundance contours can vary depending on the high energy radiation spectrum and other disk and stellar parameters. Magnetic dissipative heating is not considered in these models and heating is primarily radiative therefore low gas densities typically result in greater penetration of high-energy photons and temperatures tend to be high. The forbidden lines of [OI] need both hot and dense gas (see, e.g., Fang et al., 2018) for excitation. [NeII] can originate both from fully ionized gas (EUV-ionization) and from partially ionized gas (X-ray ionization), see Pascucci et al. (2014) and § 4.4.1 for an approach on how to distinguish between the two ionization mechanisms. There is a notable paucity of emission line diagnostics in low temperature and low density regions. This is because atomic gas in the few 100 – few 1,000 K temperature range can be quite unstable due the absence of strong coolants (except for the low energy [O I] and [C II] far-infrared fine structure lines) and even a marginal increase in heating can result in K gas where optical forbidden lines do most of the cooling. Lyman alpha and 2-photon cooling from H I prevent the gas from becoming hotter than K (see e.g., Draine, 2011).
Molecular cooling can result in gas temperatures of K provided adequate heating mechanisms operate at the high densities ( cm-3), and more importantly, provided molecules are retained. Advection and non-equilibrium chemistry can maintain significant fractions of H2 in dense, irradiated winds (Panoglou et al., 2012), while gas-phase chemical reactions (by H- for example) can form trace amounts of H2 in lower density, atomic winds where dust may not be efficiently entrained (e.g., Tabone et al., 2020b). Even low abundances of H2 open formation pathways to molecules such as CO which can survive in the wind (Glassgold et al., 2004; Tabone et al., 2020b). Both CO and H2 can get collisionally dissociated at high temperatures, which sets an upper limit of K on gas temperatures in predominantly molecular winds. Cooler molecular gas (K) is readily observed using pure rotational lines of CO and its isotopologues; the CO rotational ladder extends from sub-millimeter to infrared wavelengths and can probe a wide range of conditions.
3.2 From idealized to realistic MHD disk winds
The term ‘MHD disk wind’ originally refers to flows driven primarily by magneto-centrifugal processes (e.g., Blandford and Payne, 1982; Pelletier and Pudritz, 1992; Ferreira, 1997). In the simple “bead on a rigid wire” analogy (Henriksen and Rayburn, 1971), material forced to corotate with the poloidal field is flung out when the field inclination angle from the polar axis (see the effective gravitational + centrifugal potential surfaces in Fig. 1 of Blandford and Payne 1982). In reality, the field is not strictly rigid but wound up by disk rotation; a vertical gradient of the toroidal component arises, which exerts both a braking torque inside the disk, leading to accretion, and an accelerating torque at the disk surface, leading to ejection (see e.g., Wardle and Koenigl, 1993; Ferreira and Pelletier, 1995; Ferreira, 1997). The transfer of angular momentum from the disk to the wind, mediated by , is thus what ultimately powers the MHD disk wind. The toroidal component also produces a gradual wind recollimation (Blandford and Payne, 1982) with a jet-like density enhancement towards the polar axis on large scales (Shu et al., 1995; Cabrit et al., 1999).
Early global models solving for the disk vertical structure were very idealized (self-similar and steady), but allowed to explore a wide parameter space and establish key aspects of steady wind physics (e.g., Ferreira, 1997). The role of thermal effects was already investigated by Casse and Ferreira (2000) who showed that surface heating dramatically enhances the vertical mass flux and lowers the flow speed. Thus, warm winds are both denser and slower than cold winds, see § 3.2.2 for more details and recent results. A limitation of these early models was, however, the assumption of a strong magnetic field in the disk midplane, with the ratio of thermal to magnetic pressure obeying and the midplane taken as the global vertical field threading the disk (excluding any turbulent component). This induces midplane accretion at a sizable fraction of the sonic speed, and results in disk surface densities much smaller than the minimum mass solar nebula (MMSN) for typical accretion rates (Combet and Ferreira, 2008). Although it provides an attractive explanation for inner holes in accreting transition disks (§ 4.3), such a property appears inconsistent with planet formation and with disk lifetimes at larger radii if were to hold across the whole disk.
Since PPVI, a new generation of more realistic “low magnetization” models has emerged, considering denser disks comparable to the MMSN with . They reveal that an MHD wind is still ejected from the magnetically dominated upper layers where . Hence MHD disk winds are now established as a robust outcome of an organized poloidal field in the disk (e.g., Jacquemin-Ide et al., 2019; Lesur, 2021). We will review below the wind launching (§ 3.2.1) and mass-loading (§ 3.2.2) processes, with special emphasis on two families of models that have received particular attention since PPVI. The first type considers the “dead-zone” (typically around 1-50 au), where ionization is so low that MRI turbulence is quenched by non-ideal effects, and only a surface layer remains sufficiently ionized by stellar FUV irradiation to drive MHD ejection. Wind properties thus depend on thermo-chemistry as well as non-ideal diffusion coefficients. The second type considers well-ionized disk regions where ideal-MHD applies and MRI operates in the disk interior. Turbulent pressure forces then also contribute to wind launching, generate fluctuating ejection, and aid mass-loading. Both types predict slow disk winds, but with different ratios of ejection to accretion rates (§ 3.2.2).
A fundamental aspect of the physics of MHD disk winds is that the disk accretion rate they induce is mostly determined by the magnetic field strength threading the disk. This occurs because, ultimately, the accretion rate is regulated by the braking torque exerted on the disk by the wound up magnetic field lines. This fact can be expressed as a simple scaling, common to both early “high magnetization” and new ”low magnetization” models (e.g. Ferreira and Pelletier, 1995; Wardle, 2007; Bai, 2016; Hasegawa et al., 2017)
| (1) |
where is the mass accretion rate at the radial distance , which differs from the value onto the star, , used elsewhere in the chapter, and is the toroidal field at the wind base. From this equation we can obtain an order of magnitude value for the mean vertical magnetic field required to induce disk accretion solely via an MHD disk wind
| (2) |
this expression highlights that new “low magnetization” models in the dead zone have a dominant toroidal component at the wind base (typically ), hence they require a that is times lower than early “high magnetization” models where (see e.g., eq. 5 in Garcia et al., 2001). A more precise empirical scaling for disk winds ejected from the dead-zone can be found in eq. 18 of Lesur (2021). Direct measurements of the magnetic field strength in protoplanetary disks by Zeeman effect remain extremely challenging even with ALMA and only upper limits in one disk have been reported so far (Vlemmings et al., 2019) with values compatible with the above scaling. Nevertheless, non-ideal MHD simulations of protostellar collapse that include ambipolar diffusion suggest that values of order 100 mG can be easily advected in the disk at the Class 0 stage (Masson et al., 2016). Paleomagnetic measurements in solar system meteorites indicate organized magnetic fields of mG ( mG) at au until Myr from the formation of the first solids (Fu et al., 2014; Weiss et al., 2021) suggesting that, at least in the case of the Solar System, sufficient magnetic flux was retained at later stages. As shown in eq. 1, the accretion rate, and therefore the wind ejection rate, scales with the field strength. Hence, the long-term radial transport (inward by advection, and outward by diffusion) of the entrained is critical to how disks evolve (see § 3.2.5).
3.2.1 Launching Mechanisms
The detailed dynamics of the disk atmosphere leading to wind ejection depend on the level of MRI-induced turbulence which, in turn, depends on the ionization state of the gas, itself determined by the local disk temperature and surface density. In the inner disk, au, thermal ionization of alkali metals is expected to make the disk fully MRI active (Desch and Turner, 2015) while, beyond, X-ray and FUV ionization sufficiently ionize only the surface cm-2 layer (see §3.1). In typical disks, the surface density declines with radial distance and this can result in MRI-active outer disks because column densities are low enough for ambient radiation fields and cosmic rays to enhance the ionization fraction at the midplane. Importantly, in the planet-forming region, within au, the disk is expected to be only weakly turbulent due to insufficient ionization and non-ideal MHD effects such as Ohmic resistivity and ambipolar diffusion (see e.g., Turner et al., 2014, and Lesur et al. chapter for more details).
While disk accretion in the MRI-active regions has been traditionally attributed to radial outward transport of angular momentum (e.g., Hawley et al. 1995, Sorathia et al. 2010), recent work has shown that fluctuating winds can also develop in these regions. The local 3D ideal-MHD simulations by Suzuki and Inutsuka (2009) were the first to find both turbulence-induced radial transport and structured disk winds caused by the breakup of linear MRI “channel modes”, which are restricted to regions where ideal MHD is a good approximation (i.e., near the star and in sufficiently ionized layers). As noted in Lesur et al. (2013) and in the PPVI chapter by Turner et al. (2014), there is a continuity of behaviors between magnetocentrifugal winds (MCW alas e.g., Ogilvie, 2012) and stratified MRI channel modes which are near-exact non-linear solutions of the MHD equations in the limit of weak magnetic fields (Latter et al., 2010). The more recent global, ideal-MHD, and net-vertical-field accretion disk simulations of Zhu and Stone (2018) identify a turbulent accretion layer at high altitudes () causing an inward pinch of field lines which is responsible for launching these fluctuating winds. This effect should also be relevant in the surface layer of protoplanetary disks and has been recently confirmed in full 3D global MHD simulations by Jacquemin-Ide et al. (2021). The latter authors also find that, when fluctuations are averaged over several orbital timescales, the wind obeys steady characteristics.
It thus appears that the main launching mechanism of steady MCWs is largely agnostic to the basic laminar or turbulent state of the gas and only depends on the presence of suitably inclined magnetic field lines (cf., Lesur et al., 2013). Therefore, in principle, MCWs can be launched from all disk radii. For the centrifugal acceleration to work, magnetic field lines that have their footpoints anchored at some height in the disk can be somewhat compared to rigid wires. The specific angular momentum carried by the wind is increased from the disk specific angular momentum by a factor (see Blandford and Payne 1982) where is the footpoint radius and is the Alfvén point radius (where the flow poloidal speed reaches the propagation speed of Alfén waves in the poloidal plane). This is the same result as if the wind were forced to strictly corotate with a rigid wire anchored at up to radius . Hence the ratio acts like a mechanical “lever arm”, and is called the “magnetic lever arm parameter”. For a significant magnetic lever arm parameter (), magnetic tension forces drive the acceleration (as, e.g., found in Gressel et al., 2020), causing super-rotation with respect to the local Keplerian speed, and one speaks of a true MCW. In the opposite case of small , the flow is primarily driven by vertical gradients of the magnetic pressure (dominated by the strongly wound-up azimuthal component) and one speaks of a magnetic pressure–driven MHD wind (see Bai, 2017, where the term “magneto-thermal wind” was used). This type of wind, sometimes referred to as a magnetic “tower”, can even remain sub-Keplerian in its rotation. While this distinction at first glance may appear as a dichotomy, it really is a continuum with respect to the extent of the magnetic lever arm (Jacquemin-Ide et al., 2019; Lesur, 2021). We therefore subsume both these limiting cases (i.e., tension-force versus pressure dominated) under the common MCW class.
Beyond , magnetic forces gradually become negligible. If the contribution of thermal and turbulent pressure gradients to the total energy budget can be neglected (“cold wind” regime), the asymptotic flow speed is given by the Bernouilli invariant as (Blandford and Payne, 1982)
| (3) |
While early high magnetization models could only reach small values of with strong additional heating (Casse and Ferreira, 2000), new models of winds from weakly magnetized disks have intrinsically small values of even in the ‘cold’ regime, due to their strongly wound-up field (e.g., Jacquemin-Ide et al., 2021; Lesur, 2021). They are therefore slower than early cold wind models from strongly magnetized disks.
As we will discuss in the next subsection, the extent of the magnetic lever arm is intricately coupled to the loading of material onto the field lines, so as to remove a certain amount of angular momentum from the disk (eq. 9). This obviously has important implications for the overall mass budget of the disk’s accretion/ejection flow and potentially its dust content.
3.2.2 Mass loading mechanisms and wind mass-flux
The overall mass loss rate is primarily determined by the density, at a “wind base”, which is located around the slow magnetosonic point (Bai, 2016). The mass flux (per logarithmic radius) onto the wind is then given by
| (4) |
where is the vertical field, is the local radial component of the field (which defines the field-line inclination angle), and the sound speed (Lovelace et al., 1995; Königl and Salmeron, 2011). As discussed in Gressel et al. (2020), the bending of field-lines in non-ideal MHD simulations is at least partly due to ambipolar diffusion. As such, mass loading depends not only on the thermal (and turbulent) pressure gradient near the footpoint, but also on the disk ionization.
Because only charged species are subject to the Lorentz force, sufficient ionization is required at and above the wind base to drive MCWs. Although the ionization requirement for MCWs is in principle the same as that for driving MRI turbulence, the latter is active only in layers where . In contrast, MCWs are present where the gas dynamics is dominated by the coherent magnetic field (i.e., ), such that the two phenomena may, in a sense, appear mutually exclusive at a given altitude in the disk — but see §3.2.1 for the possibility of an MRI-turbulent layer at high altitude with when .
At typical disk radii that harbor dead zones in their interior, the altitude of the wind base is determined by FUV ionization, in a region where the density is sufficiently low to ensure . 2D global simulations covering from au to au show that the wind base is located at , where is the local pressure scale height (Bai, 2017; Béthune et al., 2017; Gressel et al., 2020). Since the density at the wind base is much lower than the density at the midplane, the magnetic pressure of the global field dominates over the gas pressure (), and consequently laminar MCWs are driven while MRI is quenched. The wind mass-loading is thus fully controlled by the thermal pressure gradient, without any local turbulent fluctuations.
In MRI-active regions where fluctuating winds can develop (§ 3.2.1) mass loading occurs differently. The break-up of MRI ’channel’ modes happens deeper in the disk where the gas pressure dominates over the magnetic pressure (). Upflows lift gas from the lower turbulent region to the upper B-field dominated laminar region. This uplift adds to the thermal pressure gradient discussed above and results in much higher mass being loaded into the wind than without the help of MRI-turbulence. The uplift of material also results in overall higher gas density than in hydrostatic disks. For instance, in the ideal-MHD limit, the density distribution deviates from the hydrostatic profile already above and it is two orders of magnitude higher at (Suzuki and Inutsuka, 2009, 2014). However, we should note that the specific density increase and launching height may be affected by the vertical upper boundary condition which is not sufficiently large in these early simulations. Recent global ideal-MHD simulations covering the entire polar angle show that the disk wind from the MRI-active region arises from higher altitudes () and therefore is not very massive (Jacquemin-Ide et al., 2021). Furthermore, it only removes a small fraction, about , of the angular momentum flux, the rest being extracted by turbulent stresses.
In disk regions where the mass accretion is induced solely by the removal of angular momentum via an MCW, the accretion rate and the wind mass loss rate have the following relation (Pelletier and Pudritz, 1992; Bai, 2016):
| (5) |
where can be usually approximated by the Keplerian rotation frequency at radius . The left term, , is the rate at which angular momentum is extracted to allow accretion across a disk annulus at , counted positive inward. The right term, , is the rate at which the MHD disk wind removes excess angular momentum from the underlying disk annulus. The wind magnetic torque thus imposes a minimum accretion rate through the underlying disk.
If all of the MHD disk wind is ejected from a small region at the footpoint radius , the derivative terms in eq. 5 may be replaced by local values to obtain an order-of-magnitude scaling (Pelletier and Pudritz, 1992)
| (6) |
When the disk wind is radially extended, however, the derivatives in eq. 5 may no longer be ignored, and the ejection to accretion ratio can be substantially larger than predicted by the above scaling. Mass conservation imposes that the integrated wind mass-flux ejected between radii and is given by
| (7) |
where is the “mass ejection efficiency” of the radially extended disk wind, defined as (Ferreira, 1997)
| (8) |
Inserting eq. 8 into eq. 5 and taking yields a fundamental relation between the magnetic lever arm parameter and the ejection efficiency when disk accretion is driven by an MHD disk wind (Ferreira, 1997):
| (9) |
Since the MHD wind is driven by angular momentum extraction from the disk, this ratio cannot exceed one. Hence, a more heavily mass-loaded MHD disk wind (larger ) will necessarily have a smaller magnetic lever arm parameter , i.e. a smaller angular momentum per unit mass, and vice-versa. This is indeed verified in all idealized self-similar solutions with a dominant wind torque, at both high and low magnetization (e.g., Casse and Ferreira, 2000; Lesur, 2021).
Assuming that is constant over radius and inserting eq. 9 in eq. 7 gives the predicted ejection to accretion ratio for a radially extended disk wind:
| (10) |
where is the fraction of angular momentum flux removed by the wind. Unlike in the case of a radially very narrow wind (eq. 6 ), the expression above shows that the integrated wind mass loss rate can easily exceed the accretion rate at the inner radius. As an example, if accretion through the disk dead-zone is 100% wind-driven (i.e., ) with and (as suggested by recent non-ideal MHD simulations) one expects an integrated wind mass-flux of more than twice the mass-accretion rate at the inner launch radius, instead of a half using the approximate local scaling in eq. 6. Inside the MRI-active region (0.05–0.5 au), instead, recent global simulations suggest and (Jacquemin-Ide et al., 2021). Here, eq. 10 predicts a disk wind mass-flux in this region of only 3% of the accretion rate. We will test these predictions against specific observations in § 4.1.
3.2.3 Global Non-ideal Disk Wind Simulations
The most important development since the PPVI review by Turner et al. (2014) is the advent of reasonably realistic global non-ideal MHD simulations in terms of the considered microphysical effects and thermodynamics. Local shearing box simulations of winds have been recognized as having fundamental limitations, primarily their inability to account for the net rate of magnetic field transport and to capture the dependence of the wind characteristics on global geometry. Hence, they have been abandoned since PPVI and their summary in Section 4.2 of Turner et al. (2014) remains comprehensive.
Besides efforts to combine local and global approaches (Nolan et al., 2017), new models include one-dimensional self-similar (Lesur, 2021), as well as two- and three-dimensional semi-global, and global simulations. Most of these properly include multiple non-ideal MHD effects, more precisely, i) Ohmic resistivity, ii) ambipolar diffusion (both considered in Gressel et al., 2015), and iii) Hall drift (e.g., Bai and Stone, 2017; Béthune et al., 2017), even though the assumptions on the underlying ionization model can vary rather significantly. While earlier semi-analytical calculations (e.g., Wardle and Koenigl, 1993; Ferreira, 1997) found the launching of winds to depend rather sensitively on assumptions, recent global non-ideal MHD simulations demonstrate that wind solutions are a robust outcome of the assumed initial conditions even when the disk midplane is not coupled to the ionized component.
We highlight the recent advancement to include disk thermodynamics in global non-ideal MHD simulations: from an ad hoc prescribed thermal structure (e.g., Bai, 2017; Béthune et al., 2017) to the addition of stellar irradiation and diffuse re-radiation (Gressel, 2017), thermochemical and ambipolar heating (e.g., Wang et al., 2019; Gressel et al., 2020) self-consistently. Because the wind base is typically found to coincide with the FUV-ionized upper disk layers, the thermochemistry is built around chemical processes (Perez-Becker and Chiang, 2011) driven by FUV irradiation from the central star (but see Rodenkirch et al. 2020 for an Ohmic-resistivity-only, i.e. lacking ambipolar diffusion, model with stellar EUV and X-rays instead of FUV). These simulations consider weak fields (), roughly consistent with meteoritic constraints on the solar nebula magnetic field (Fu et al., 2014), and the added external heating and thermal energy are found to contribute to wind energetics, unlike in the “cold” winds. Further, the addition of self-consistent chemistry allows identification of potential tracer species and simulations of synthetic observations for detecting and characterizing the outflows (Gressel et al., 2020), a predictive approach previously limited to idealized self-similar models (e.g., Yvart et al., 2016).
The inclusion of thermal effects, hence radial thermal pressure gradients, also results in wind opening angles that are closer to the 30∘ minimum of the early cold Blandford and Payne (1982) model. For instance, typical values of the field-line inclination angle at the wind base (at au) are, e.g., for the AD model ‘fid0‘ of Bai (2017) and for the ‘OA-b4‘ model of Gressel et al. (2020). Importantly, beyond the launching radius, the wrapping of field lines by wind inertia inevitably produces a gradual magnetic collimation (see e.g., Fig. 11 in Wang et al. 2019, and Fig. 2 in Gressel et al. 2020). Hence, when comparing models with data the scale probed by observations needs to be taken into account (§ 4.1).
A somewhat puzzling feature of global simulations without an enforced symmetry (i.e., with regards to reflection upon the disk midplane) is the emergence of one-sided outflows – or at least asymmetric wind strengths on the top and bottom half of the simulated disk. While these are predominantly seen when including the Hall effect (Béthune et al., 2017; Bai, 2017), asymmetric winds have also been found in simulations including Ohmic and ambipolar diffusion alone (Gressel et al., 2020). These asymmetries are related to the sporadic/stochastic transport of azimuthal flux into the highly diffusive midplane and ongoing work is testing the role of initial and/or boundary conditions on breaking the wind symmetry. At least observationally, there is some evidence for asymmetric winds (§ 2 and 4.1).
To illustrate just one central quantity that is obtained as an outcome of such comprehensive simulations, Fig. 6 showcases radial profiles of the mass loss rates obtained from 2D-axisymmetric MCW global simulations from Bai (2017), Wang et al. (2019), and Gressel et al. (2020). Compared to the latter, the former two models generally display smaller lever arms, hence a higher contribution from magnetic pressure rather than the tension force in driving the wind (see discussion in § 3.2.1). Some of the differences between the results of Bai (2017) and Gressel et al. (2020) may be due to differences in mass loading onto the field-line at the wind base, which is determined by thermal heating processes and can vary significantly depending on assumptions (see § 3.2.2). We caution the reader that the figure is meant to represent a compilation rather than a true comparison, as the individual models in fact cover a range of mass accretion rates. Yet, despite the considerable number of assumptions going into the various MHD models, they overall agree fairly well with respect to their inferred mass-loss rates. For further comparison, we also show a curve that includes the effect of fluctuating winds in the inner MRI-active region in the form of a 1D long-term model calculation by Suzuki et al. (2016). The considerable spread in the obtained levels of ejection of material illustrates that the mass loss is sensitive to the model inputs and assumptions, particularly the magnetic field strength. We note that the evolution of the disk mass and surface density is also very sensitive to the assumed evolution of the poloidal magnetic flux (see § 3.2.5).
3.2.4 Jets and Winds from the Inner Disk Region
Jets (HVC) and inner winds traced by the LVC BC are thought to originate within disk radii 0.5 au (see § 2.1). This is a complex region that will have multiple contributions to outflowing gas, including the star, the star-disk interaction region, and the disk itself (Ferreira et al., 2006) in a regime where the disk is likely MRI-active (e.g., Armitage, 2011; Flock et al., 2017).
The innermost component of the ejection is a wind from the central star. In addition to an ordinary stellar wind driven by coronal gas pressure, accretion energy coupled with a strong magnetic field and surface convection can drive powerful winds radially from polar regions along open field lines (Matt and Pudritz, 2005a; Matt and Pudritz, 2008; Cranmer, 2008). The velocity of an accretion-powered stellar wind is typically comparable to or exceeds the escape velocity from the central star, a few hundred km/s, and is likely the source of the deep and broad blueshifted absorption at He I and C II in sources with small disk inclinations (§ 2.2.2). These accretion powered stellar winds are invoked to spin down the accreting central star (e.g., Matt and Pudritz, 2005b; Pudritz and Matt, 2014).
In the star-disk interaction region, close to the co-rotation radius au, some stellar field lines remain closed and deliver disk material to the star while others are opened up and may launch a wind. Different configurations can lead to ejection and we refer the reader to Ferreira et al. (2006) for a summary of the main possibilities.
In the “X-wind” scenario, the disk hijacks opened stellar field lines in a narrow region near the co-rotation radius ( au), generating a steady MCW that is assumed to carry away sufficient angular momentum to spin down the accreting star (Shu et al., 1994). The fanning out of the field lines from this anchor point creates an MHD wind with the dual character of a dense axial jet surrounded by a wide angle wind, both moving at a fairly uniform velocity km/s (e.g., Shang et al., 1998, 2007). As will be addressed in § 4.1.5, the wide angle component of the X-wind is invoked as one possible means of sweeping up ambient gas into slow molecular outflows (e.g., López-Vázquez et al., 2019).
MHD simulations of the star-disk interaction favor a different ejection geometry, dominated by an unsteady “conical wind” launched at (e.g., Romanova et al., 2009; Zanni and Ferreira, 2013). Magnetic field lines anchored at the stellar surface and the disk are stretched by the differential rotation between the two footpoints, winding up the toroidal magnetic field and accelerating mass outward to km/s from au (Liffman et al., 2020). If the disk harbors a net vertical field aligned with the stellar dipole, its reconnection with closed stellar field lines near the magnetopause will also drive powerful unsteady ejections at intermediate latitudes (Hirose et al., 1997; Ferreira et al., 2000).
MCW disk winds launched from the co-rotation radius outward are also likely contributors to outflows within 0.5 au (§ 3.2.1). Such a centrifugal disk wind will result in a range of wind speeds, reflecting the underlying range of launch radii and creating a nested “onion-like” kinematic structure (e.g., Cabrit et al., 1999). The innermost part of such a disk wind is thought to be the origin of the slow, narrow blueshifted absorption at He I and C II seen in systems at high inclination, where the line of sight to the star passes through the disk wind. Also the [O I] LVC BC line width is interpreted as arising from a wind in the inner disk (§ 2.2.2).
Additionally, within several stellar radii, the possibility for failed winds may also occur. In this instance, some of the vertical upflows do not reach escape velocity and instead fall back and accrete onto the star (see the 3D global simulations by Takasao et al., 2018). When the strength of the stellar magnetic field is less than 1 kG, a magnetosphere does not develop well around the star (Takasao et al., 2018, 2019) and the failed winds accrete onto mid-latitude regions with high velocity due to stellar gravity & magnetic braking, at nearly the Keplerian velocity at the surface, km/s. A characteristic feature of this funnel–wall accretion is that the accretion column covers a wide belt around the latitude . This is in contrast to magnetospheric accretion that occurs in localized magnetic flux tubes connecting the star and the disk (e.g., Hartmann et al., 2016, for a review on accretion onto young stars). No observations have been associated with MRI failed winds to date, but they may be a contributor to some of the complex variability of emission lines formed in near-stellar regions.
It is likely that more than one of these outflow processes expected within 0.5 au, several of which will be variable due to changing accretion rates onto the star, together form and collimate the jet, and give rise to its variability. We do not pursue the formation of jets further, as the major focus for this chapter is new evidence supporting radially extended, slower disk winds that surround the jet, addressed in § 4.
3.2.5 Evolution of the Poloidal Magnetic Flux
As alluded to above, protoplanetary disks are believed to inherit a certain amount of magnetic flux aligned with the rotation axis from the pre-stellar core phase. The typical ‘hourglass’ morphology of a collapsing, rotating object can be explained by the fundamental effect of ‘magnetic braking’. It is furthermore believed that ambipolar diffusion (e.g., Masson et al., 2016; Xu and Kunz, 2021) as well as the Hall effect (e.g., Braiding and Wardle, 2012; Tsukamoto et al., 2015; Zhao et al., 2020) play a key role in mediating the amount of magnetic flux retained in forming the disk. An alternative explanation involves turbulent reorganisation of the flux (e.g Seifried et al., 2013; Küffmeier et al., 2017). Once a rotationally supported disk has formed, essentially the same agents continue to drive its secular evolution.
The standard model for this inward “dragging” of the flux (Lubow et al., 1994a), applying to fully turbulent accretion disks, has recently attracted new interest (Rothstein and Lovelace, 2008; Okuzumi et al., 2014; Takeuchi and Okuzumi, 2014; Guilet and Ogilvie, 2014). From the study of Okuzumi et al., the prediction for the maximum attainable field strength is about at 1 au, and about at 10 au from the central star for an external field B∞ of 10 G outside a disk of radius 100 au – which agrees broadly with what is needed for obtaining mass accretion rates of M⊙/yr from the MCW, or via net-vertical-field MRI. None of these approaches include the evolution of the poloidal flux by means of an effect dynamo – despite ample evidence (e.g., Flock et al., 2011; Gressel and Pessah, 2015; Dhang et al., 2020) from local and global MRI simulations. An important idea, first sketched-out in Rothstein and Lovelace (2008), pertains to the dragging-in of flux in the magnetically dominated surface layers, and this is indeed observed in ideal-MHD global disk simulations (Suzuki and Inutsuka, 2014; Zhu and Stone, 2018; Jacquemin-Ide et al., 2021).
In the case of non-ideal MHD (arguably more realistic for significant parts of the disk, between au), the outward transport of flux by means of turbulent eddies has to be replaced by the microphysical coefficients (Ohmic diffusion and ambipolar diffusion acting in the “dead zone”). The Hall-effect can, moreover, lead to a pronounced pinching of field lines in the disk midplane – a consequence of the escalating feedback of Hall rotation and background shear when the poloidal field is ’aligned’ with disk rotation (Bai and Stone, 2017). The resulting field configuration leads to fast inward transport partly counter-acted by outward drift through ambipolar diffusion. For the opposite case of ‘anti-aligned‘ flux, the combined Hall & ambipolar diffusion effects render the effective transport a factor of about two more efficient, and comparable to the Hall-free case. The magnitude of the flux transport generally scales with the overall magnetization, and is moreover found to be sensitive to the assumed microphysical coefficients. Simulations with realistic ionization models (Bai, 2017; Béthune et al., 2017; Gressel et al., 2020; Lesur, 2021) agree on the result that the vertical flux diffuses radially out of the disk on a secular timescale (i.e., a fraction of an au per century), but there is considerable scatter amongst the various results in terms of the precise diffusion rate measured.
If accretion torques from MCWs indeed dominate viscous redistribution of angular momentum and mass, the timescale of disk evolution and dispersal becomes primarily steered by the amount of magnetic flux threading the disk. In this case, the question of how rapidly the disk loses the flux (or whether it is able to retain substantial parts of it) becomes a crucial one. At the time of writing, the long-term impact of the flux evolution from global simulations remains an open question. Also, there are no simplified evolutionary models that self-consistently include the flux evolution. Existing models of Armitage et al. (2013), Bai (2016), Suzuki et al. (2016), and Tabone et al. (2021) include only the limiting cases for the evolution of the total magnetic flux: i) constant total magnetic flux (i.e., a fixed radial distribution of in time from the balance between inward drag due to accretion and outward drift/diffusion due to non-ideal MHD effects and turbulence); and ii) decreasing flux in accordance with surface density. In the constant flux scenario, disk accretion can possibly become “super-charged” in the presence of significant entrained flux, eventually overcoming any residual level of viscous disk spreading by disk turbulence. This may lead to a two-timescale behaviour for disk dispersal (see discussion in Armitage et al., 2013; Bai, 2016) and rapid dispersal (Tabone et al., 2021, see Manara et al. in this volume). In contrast, efficient loss of magnetic flux (e.g., from slippage of field lines mediated by ambipolar diffusion) would imply a stalled disk evolution, leading to massive old disks. One possible example is TW Hya where Vlemmings et al. (2019) found small vertical field strengths mG (1) at au that the authors interpret as faster diffusion over advection if the protostellar envelope had an initial B 1 mG. There is, in principle, no reason, why the entire disk should adhere to either of these extreme cases during its lifetime. For example, flux could be advected inwards in the inner MRI-active regions and diffuse outwards in the weakly ionized regions. This opens the possibility to construct evolutionary pathways (e.g., Bai, 2016; Jacquemin-Ide et al., 2021) that, for instance, lead to the formation of inner disk cavities with efficient accretion due to an MCW at high disk magnetization (Combet and Ferreira, 2008; Wang and Goodman, 2017b, and discussion in § 4.3).
3.3 Photoevaporative winds and disk dispersal
While MHD winds may presumably drive stellar accretion via mass loss at all epochs, thermal winds have been proposed to disperse protoplanetary disks. These so-called photoevaporative winds — which are purely thermally driven and play no role in angular momentum transport — were first invoked as a disk clearing mechanism to explain relatively short ( few Myr) disk lifetimes (Hollenbach et al., 1994). At a basic level, these are conceptually similar to the Parker solar wind. Gas at the surface is heated by photons and “evaporates” in a wind if the rotating gas has sufficient thermal energy to escape the stellar gravitational field—typically beyond a radius where the thermal speed is km/s for K fully ionized gas, km/s for K neutral gas, and km/s for K fully molecular gas. The thermal speed and the density to which photons penetrate, which depend on the column density (§3.1), determine the resulting mass loss rate where is the wind density at the sonic point. This has also been approximated by Gorti et al. (2009) as , with the flow velocity at the wind base typically some fraction of the thermal speed, of the order unity. Note that the flow speed reaches at the sonic radius with the density here determined by the flow characteristics from the base to , and there is a need for an accurate computation of both the thermochemistry and hydrodynamics. The driving agent (EUV, FUV or X-rays) plays a key role in determining how the spatial distribution of mass in the disk evolves with time. The critical radius within which gas remains bound is au for EUV-driven winds, au for X-ray driven winds, and au for FUV-driven winds. Gas temperatures resulting from EUV and X-ray heating can be more easily approximated to allow full hydrodynamical simulations (Owen et al., 2012; Rodenkirch et al., 2020); in contrast, the determination of the temperature for FUV-irradiated gas is considerably more complex and impacted by both dust evolution and chemistry (Gorti et al., 2015; Wang and Goodman, 2017a).
The most significant new developments in photoevaporation theory, relevant both for internal and external photoevaporation, are related to coupling hydrodynamics with chemistry (e.g., Wang and Goodman, 2017a; Nakatani et al., 2018a, b; Haworth et al., 2018) and to coupling dust dynamical evolution with FUV photoevaporation and disk dispersal (e.g., Gorti et al., 2015; Facchini et al., 2016; Carrera et al., 2017; Sellek et al., 2020). Prior to the PPVI review by Alexander et al. (2014), models considered either hydrodynamics or chemistry in detail but not both simultaneously; modest size chemical networks are now being incorporated into hydrodynamical models. Wang and Goodman (2017a) conducted hydrodynamical simulations with a ray tracing method for radiative transfer and were the first to include FUV heating and gas line cooling calculated consistently with chemistry. They found that mass loss-rates are sensitive to the incident radiation field (especially the EUV and Lyman-Werner FUV bands), thermochemistry and hydrodynamics. An additional complication is introduced by dust (Gorti et al., 2015; Wang and Goodman, 2017a), which simultaneously evolves in disks en route to planet formation. The decrease in abundance of small grains increases penetration depth of FUV photons and hence the mass loss rate, but also decreases photoelectric heating to lower the temperature and mass loss rate. Photoevaporation rates are tied to dust disk evolution, but Gorti et al. (2015) find that these competing effects offset each other to a large extent.
Related to dust evolution is the effect of varying metallicity. Using radiation hydrodynamical models, Nakatani et al. (2018c) find that FUV photevaporation rates dominate X-ray rates, and that FUV mass loss increases with decreasing metallicity due to reduced opacity. While X-rays do not drive strong flows in their models, they act to enhance mass loss rates by affecting the ionization degree in the gas which increases the FUV heating rate. Ercolano et al. (2018) and Wölfer et al. (2019) consider the effects of gas phase depletion of carbon on X-ray photoevaporation (carbon contributes to the opacity for the soft X-rays in their models), and find that heating is increased to drive greater mass loss, see § 4.3 for an application to transition disks.
There appears to be an emerging consensus from recent hydrodynamical models that include EUV, FUV and X-ray photoevaporation that FUV photons determine the base height from where flows are launched and that EUV and X-ray photons aid in the acceleration of the flow (Wang and Goodman, 2017a; Nakatani et al., 2018c; Komaki et al., 2021). Integrated mass loss rates range from a few to yr-1. While Nakatani et al. (2018a) find FUV mass loss rates comparable to results from XEFUV driven photoevaporation without hydrodynamics (Gorti et al., 2009), Wang and Goodman (2017a) conclude that the static models over-estimate mass loss rates by a factor of a few. Wang and Goodman (2017a) attribute the discrepancy to the difficulty in sustaining the thermal flow to the sonic radius where gas escapes, which was tacitly assumed by Gorti et al. (2009). Previous XEUV models with radiation hydrodynamics and simplified temperature profiles (Ercolano and Owen, 2010; Owen et al., 2012) were found to overestimate mass loss rates as well, new results indicating a minor role for X-rays and EUV in driving photoevaporation—these differences are attributed to the simplified temperature approximation used in the XEUV models and neglect of important cooling terms (molecular cooling and adiabatic expansion in atomic gas, see Wang and Goodman, 2017a). Improved models by Picogna et al. (2019), however, find results similar to their earlier work (Owen et al., 2012), and that adiabatic expansion cooling can be neglected as advection timescales always exceed recombination timescales in their models.
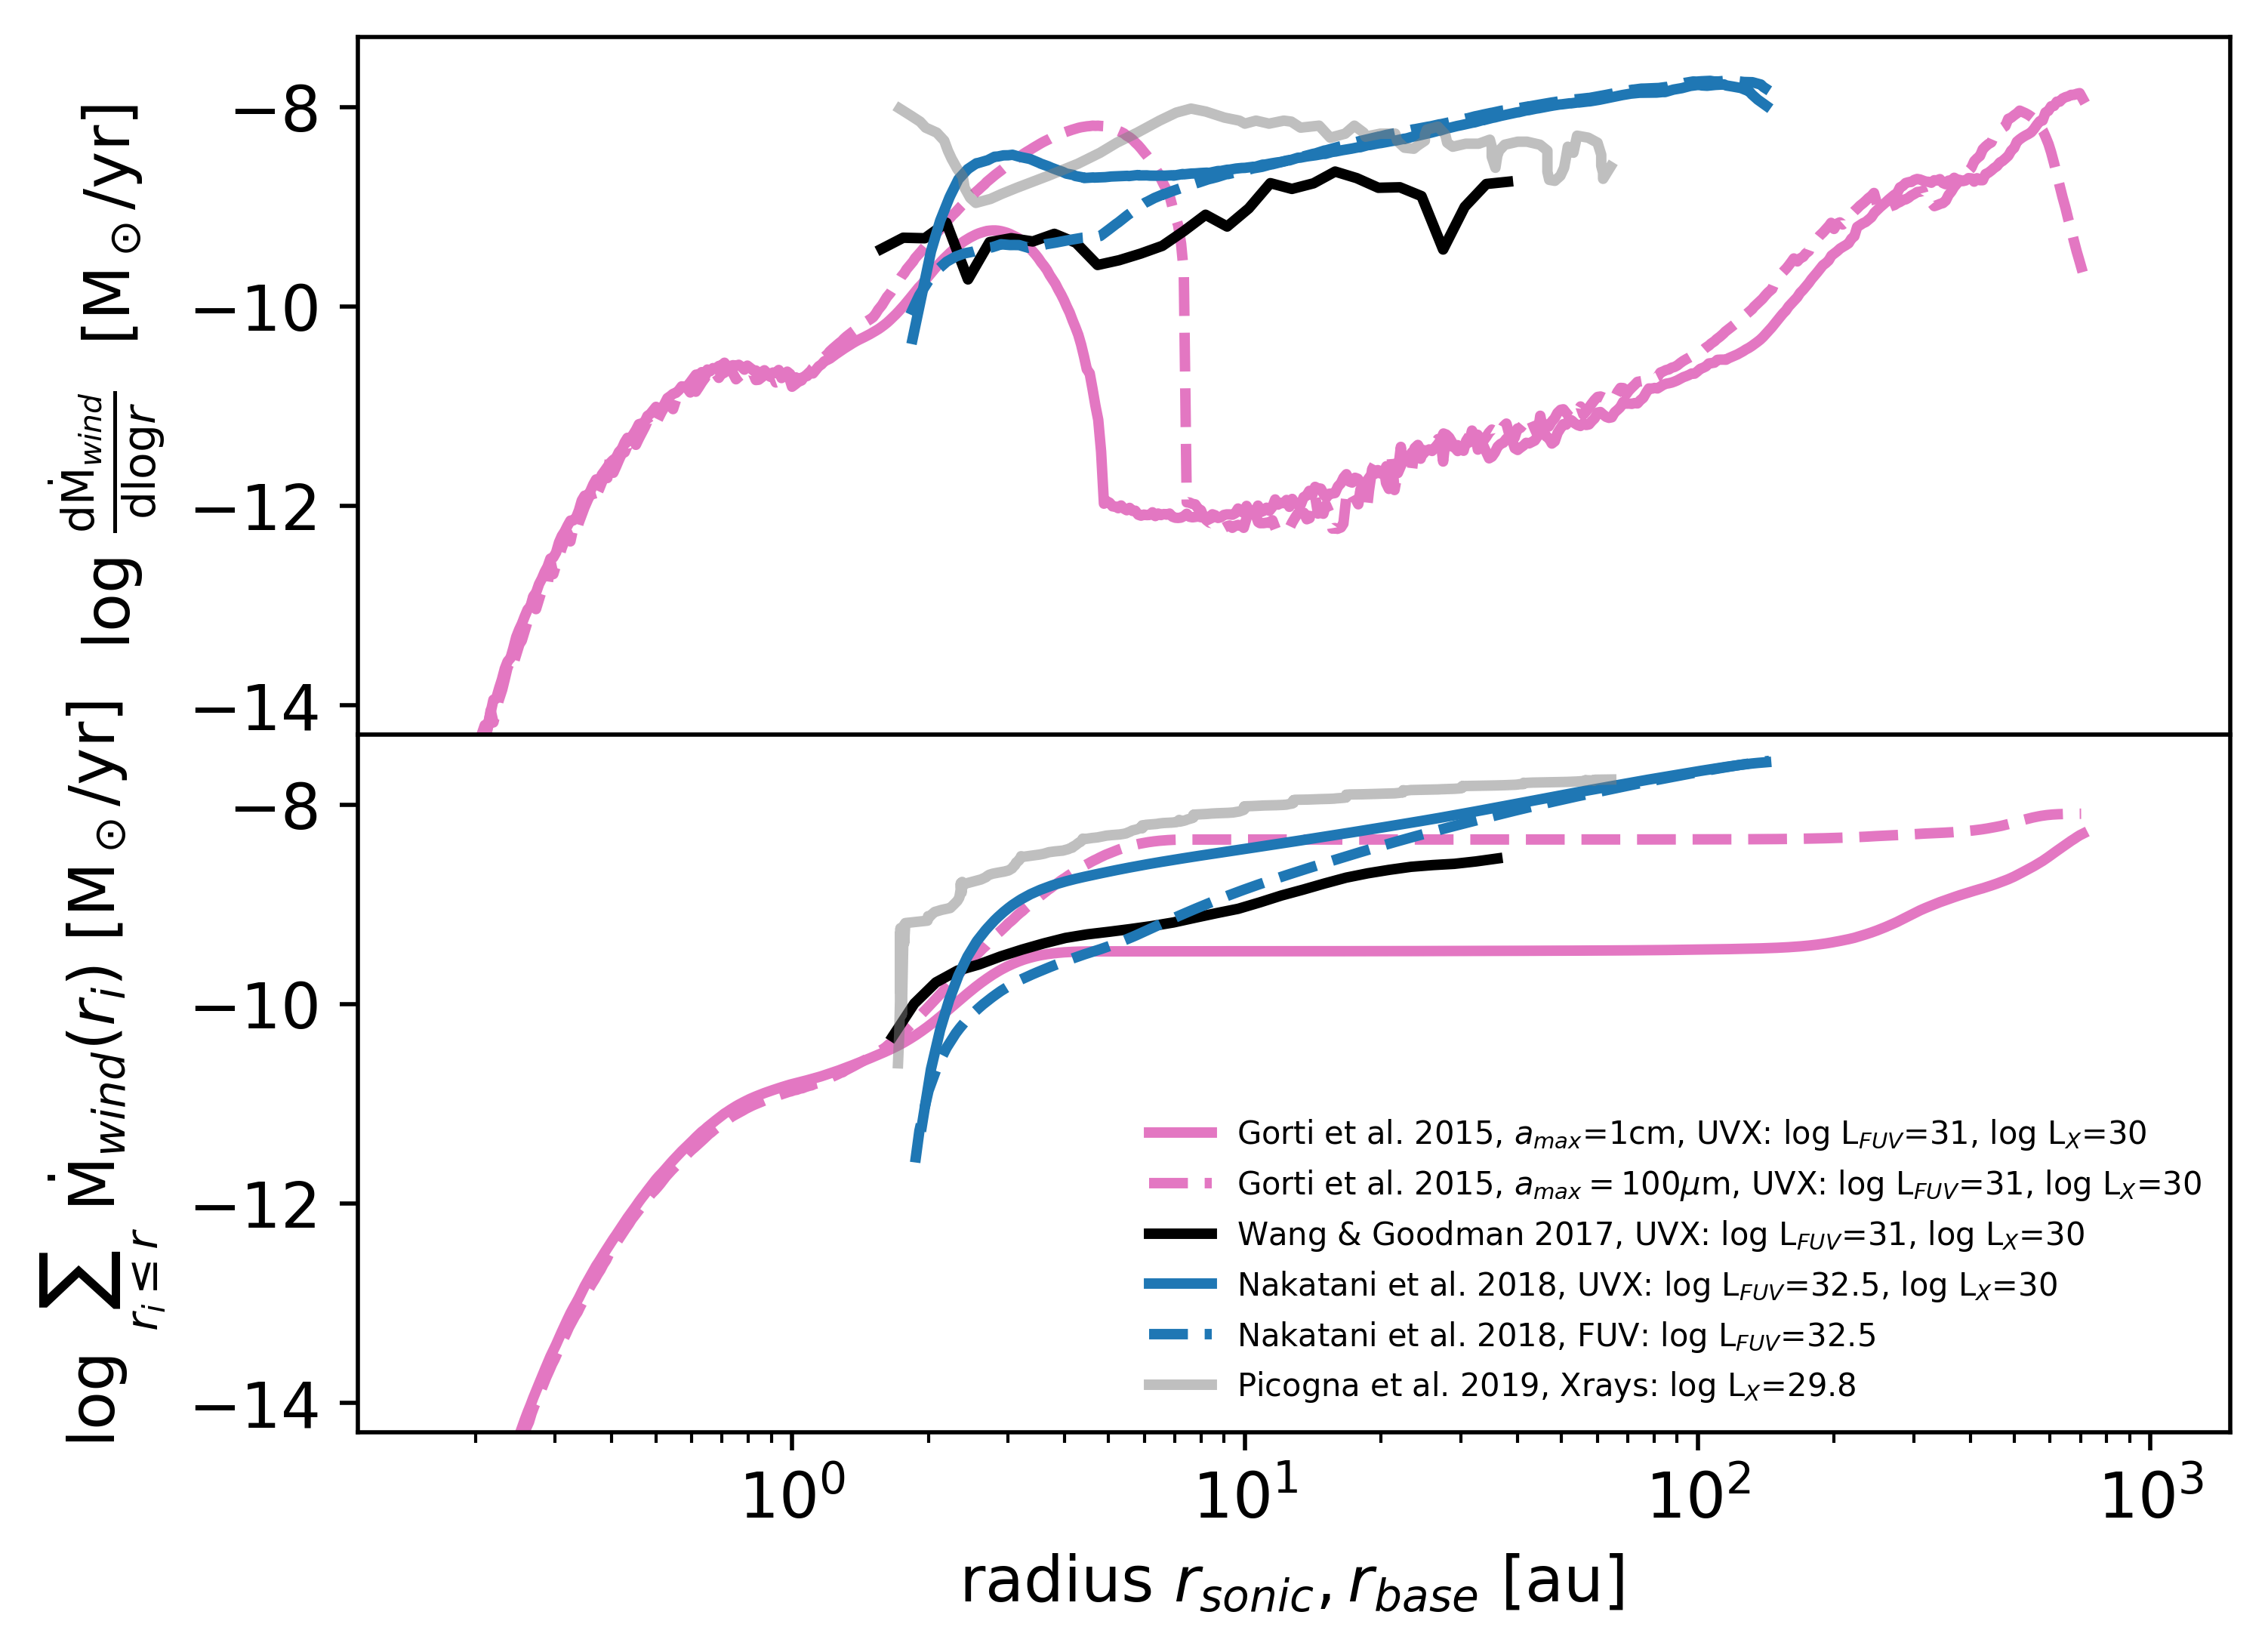
Fig. 7 shows a compilation of mass loss rates from pure PE models, analogous to the MHD results presented in Fig. 6. In contrast to the MHD disk winds, PE winds rely solely on the thermal pressure gradient and mass loss rates are consequently lower. Three representative classes of models are shown with the radial profile in the upper panel and the cumulative mass loss rate in the lower panel.
The reference model (with a fixed grain size distribution), and a model with an enhanced population of small grains (including PAHs) after 1 Myr of evolution are shown from Gorti et al. (2015). They use an analytical prescription for the mass loss rate and include EUV, FUV and X-rays with full thermochemistry; here erg s-1 and erg s-1. A similar model from Wang and Goodman (2017a), but advanced in that it includes full hydrodynamics along with some chemistry, is also shown. The mass loss rate in these models is calculated at the base of the flow () which is indicated along the axis. The XEUV model result from Picogna et al. (2019) has nearly the same X-ray and EUV luminosities but does not include FUV heating. Picogna et al. (2019) treat full radiation hydrodynamics with simplified ionization and thermochemistry, and the mass loss rate is computed at the sonic radius (). The models from Nakatani et al. (2018b) feature full radiation hydrodynamics, X-ray, EUV and FUV heating with thermochemistry and indicate that FUV heating mainly drives mass loss (gray solid and dotted lines are similar). However, note that the FUV luminosity for the gray curves is unrealistically high ( erg s-1) for low-mass stars (Yang et al., 2012).
It is evident from Fig. 7 that model assumptions can affect the mass loss rates by orders of magnitude, and the radial profile can differ significantly. Some of these differences could be due to the adopted abundances of small grains for FUV photoevaporation, chemical coolants included, and choice of UV and X-ray spectra that all affect the gas temperature and hence mass loss rate. Other differences are that the X-ray mass loss rate peaks at 10au (Picogna et al., 2019), while the models including FUV have mass loss rates that increase with radius; the Gorti et al. (2015) models are evolution models that follow the disk to dispersal with a mass loss rate that depends on time (see Fig. 9 and related discussion in §3.4), and employ a larger radial grid with most of the mass loss occurring beyond 100 au.
FUV heating additionally depends on the dust disk properties (compare dashed and solid magenta lines in Fig. 7) but may gain in significance over MHD processes if the disk is sufficiently extended. At large enough radii, the gas temperature, which roughly scales as , begins to exceed the escape temperature needed for thermal pressure to overcome gravity, which instead scales as , thus promoting PE wind launching.
The launching of purely thermal flows is moreover contingent on the ability of the XEFUV photons to penetrate the jet/winds that are observed from the inner disk and to heat the gas at the surface beyond . EUV and soft X-ray photons can heat gas to K but even then au which implies that photoevaporative flows can only be launched when the column density through the inner MHD winds (within 1 au) is low enough. Fig. 8 shows an illustrative model providing the column density to the star where the disk density structure and wind velocity are kept constant, while the density in the wind declines as for different . FUV photons, with their lower gas absorption cross-sections, may be able to penetrate the inner wind even when mass loss rates are high; however, dust is less evolved at early stages and introduces additional complications (see Gorti et al., 2015). Dusty MHD winds with small grains could absorb FUV photons (for e.g., see Panoglou et al., 2012) and thwart photoevaporation beyond . It is therefore likely that photoevaporative winds are not very effective in early Class 0 and Class I stages of disk evolution, and become significant only at later stages.
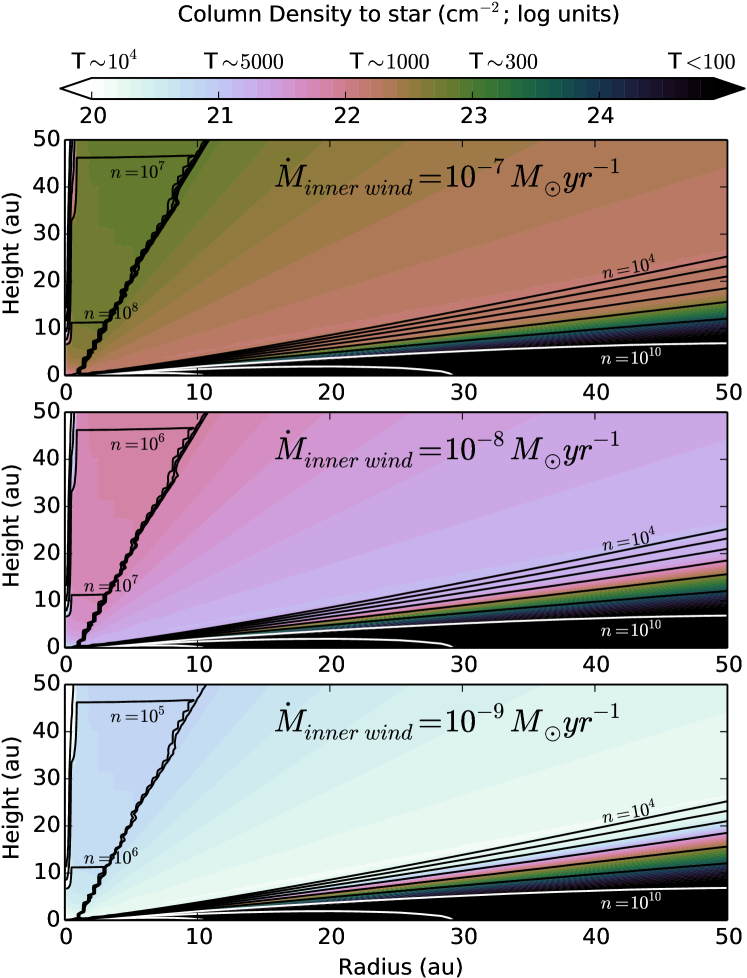
3.4 Evolution of Mass Ejection and Accretion
The relation between disk mass accretion rates and wind ejection rates has been followed in some 1D evolutionary models. In Fig. 9 we compare predictions for two such models, one where disk accretion is driven largely by the removal of angular momentum through MCWs with a small contribution from turbulent viscosity, (Kunitomo et al., 2020) and another with a disk evolving viscously (Carrera et al., 2017). Both models assume a similar initial disk mass (0.118 M⊙ in Kunitomo et al. 2020 and 0.1 M⊙ in Carrera et al. 2017) and obtain a similar dispersal timescale Myr but the initial conditions and input physics are quite different.
The curves in Fig. 9 for the Kunitomo et al. (2020) model include a small turbulent viscosity, (their Fig. 2) and show the evolution of disk mass accretion rate, and mass ejection from MCW and from PE, both from X-rays (Owen et al., 2012) and EUV photons (Alexander and Armitage, 2007). One can see a tight correlation between the mass accretion rate, , measured at the inner boundary of 0.01 au of the calculation, and the radially integrated mass loss rate, , with throughout the evolution. Note that in this model the large is driven by a small lever arm and a large ratio of (eq. 10). The wind mass loss rate is also overestimated since, inside of the MRI-active region ( au), a significant fraction of the gas will accrete onto the star (Takasao et al., 2018; Jacquemin-Ide et al., 2021, § 3.2.2 and 3.2.4).
Importantly, the tight correlation between and results from the mutual coupling between the accretion and the wind; the removal of the angular momentum via the MCW induces mass accretion, and the portion of the accretional energy that is converted into kinetic energy drives the MCW wind. Apart from its obvious dependence on the amount of magnetic flux entrained in the disk, generally has a positive correlation with the disk surface density. Since is directly linked to the surface density, and show similar declining trends with time, which can be directly compared to the observed trends in Table 1 of § 2. On the other hand, the mass loss rate of the PE winds included in this model is determined by the XEUV luminosity of the central star (see § 3.3 for details) which is kept constant with time. At early times when the disk surface density is high, dominates PE mass loss rates while, beyond 2 Myr, exceeds . An inner cavity is formed after 3 Myr so that the contribution from EUV PE becomes also gradually important. The gas in the outer region is finally dispersed by X-ray and EUV photoevaporation at 6 Myr.
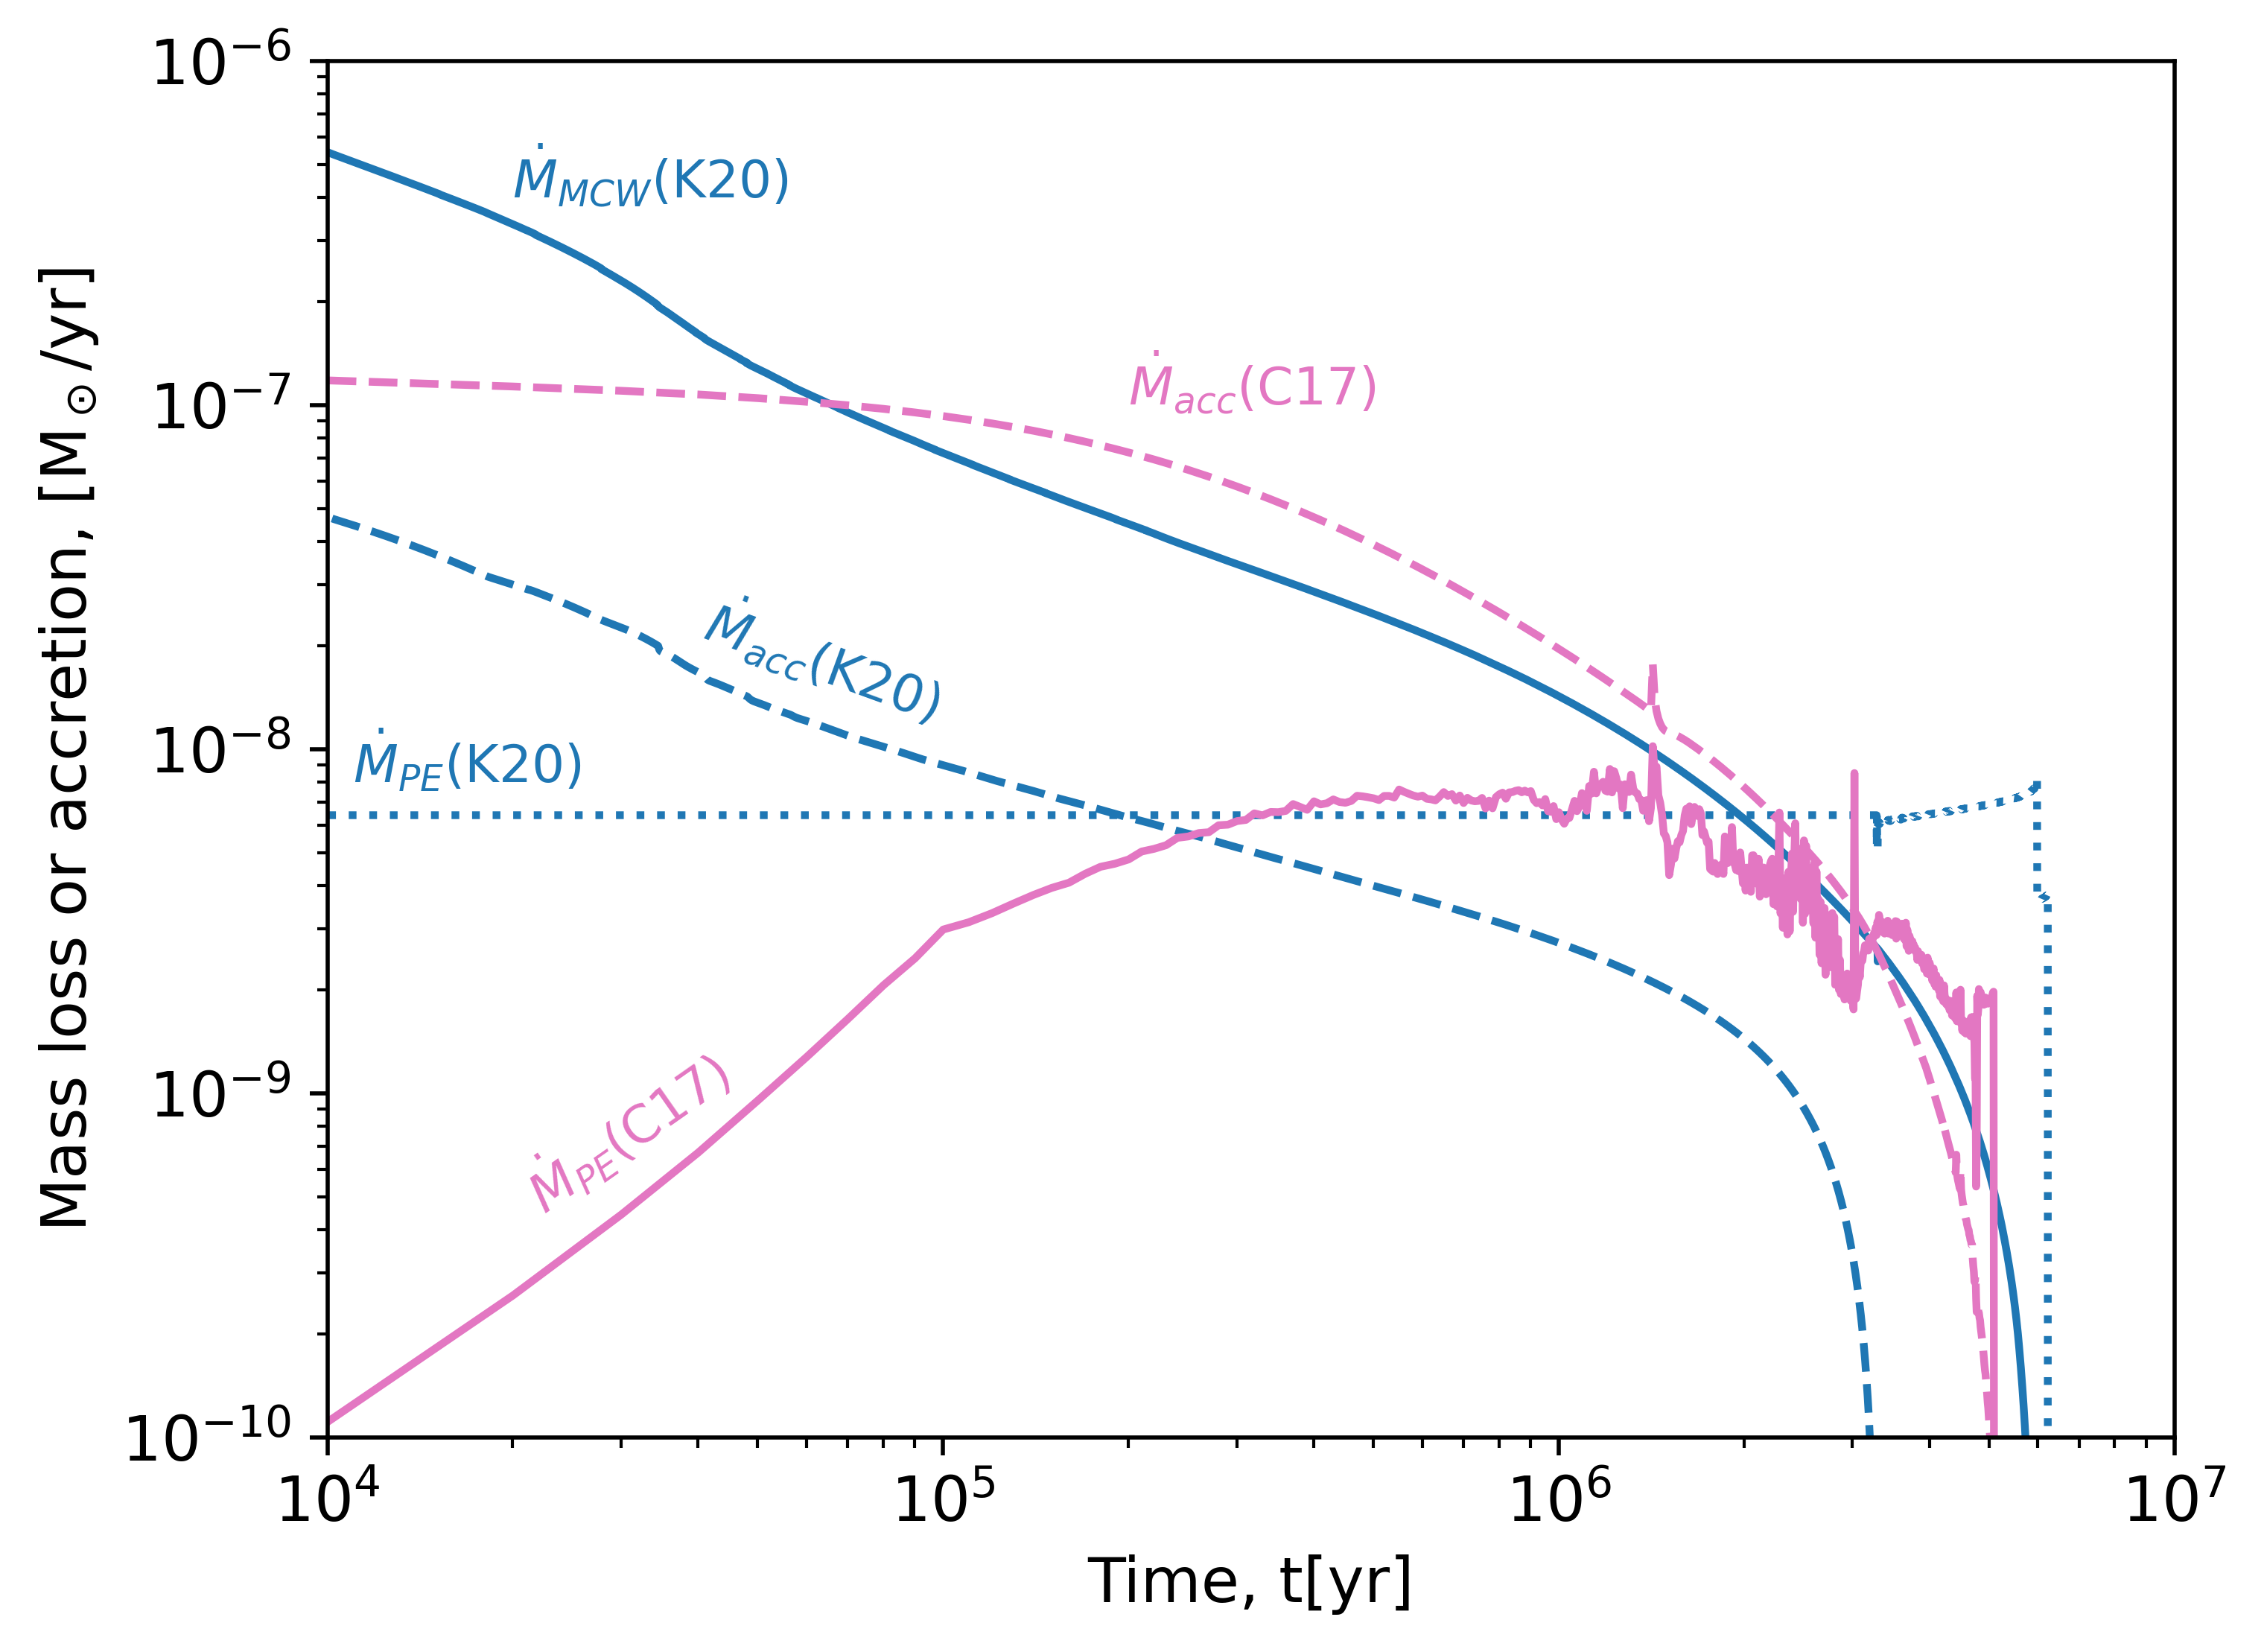
In contrast, mass ejection in Carrera et al. (2017) is purely from PE and take into account all the radiation components (X-ray, EUV, and FUV) and dust evolution with a detailed grain size distribution, based on earlier models by Gorti et al. (2015). Dust coagulation/fragmentation, wind entrainment, radial drift and criteria for planetesimal formation via the streaming instability are all considered, but they do not include MHD winds. They instead consider a layered accretion model where the midplane has a low while the disk still accretes onto the star with a relatively large . The curves presented in Fig. 9 are from their standard model and show that declines in time, in proportion to the declining surface density as the disk evolves. At early times there is very little penetration of XEFUV photons through an assumed inner MHD wind (see Fig. 8, and Gorti et al. 2009) and minimal mass loss occurs, while beyond Myr becomes comparable to and they decline together. This is because mass loss is mainly driven by the FUV component that is, in turn, determined by the accretion rate. An important distinction to note is that while determines in the MHD evolutionary model, here the situation is reversed— determines the FUV accretion luminosity in these disk models which subsequently determines . Therefore, the disk lifetime and surface density evolution are quite sensitive to the choice of (see also Gorti et al. 2015). In the model of Carrera et al. (2017), viscous accretion spreads material to the outer disk where it is removed by FUV photoevaporation (see also § 4.4.4 in relation to the evolution of the outer radius). We note that disk dispersal is not contingent on gap opening as in the case of X-ray and EUV driven photoevaporative winds.
4 COMPARISON OF WIND MODELS TO OBSERVATIONS
Here, we will interpret the observations presented in § 2 in the context of the disk wind models summarized in § 3. The central questions to be addressed are whether MHD disk winds are present and strong enough to be the prime enabler of disk accretion via the extraction of angular momentum, whether MHD disk winds are radially extended and can affect the spatial distribution of mass and its evolution in the disk, and whether PE winds are present and are the primary agent of disk dissipation. We further seek to understand the relative balance between these two genres of winds as disks evolve.
4.1 Spatially Resolved Disk Wind Diagnostics Towards the Highest Accretors
As we discuss in detail below, we find that radially extended disk winds provide the most likely origin for the spatially resolved wind diagnostics outlined in § 2. While photoevaporative flows are sometimes invoked in the literature (e.g., the CO emission from DG Tau A, Güdel et al. 2018), there are drawbacks in extending such an interpretation to all spatially resolved winds. First, PE winds are predicted to turn mostly atomic as soon as they leave the disk surface, due to their high temperature and irradiation (e.g., Wang and Goodman, 2017a), while outflowing molecular cones are found to extend up to several thousands of au. The second issue is screening by an inner jet+wind (see Fig. 8): XEUV photons from Class 0 and I sources, which have jet mass loss rates in the range M⊙/yr (Table 1), will not reach the disk surface. A vertically offset lamppost-like illumination such as that provided from X-rays produced in jets has been suggested to reduce this inner screening (Weber et al., 2020). However, at the time of writing, there are only two sources which are known to have stationary shocks producing X-ray emission offset from the central star (L1551, Class I: Schneider et al. 2011 and DG Tau A, Class II: Güdel et al. 2008) and for the less obscured one, DG Tau A, the jet X-ray luminosity is an order of magnitude lower than the stellar X-ray luminosity. Even if XEFUV photons would make it to the disk, predicted PE mass-loss rates are much lower than observationally inferred mass fluxes from spatially resolved winds in Class 0 and I sources (compare values in Table 1 and Fig. 7). Therefore, it appears that PE winds can play a role only in the latest Class II evolutionary stage.
Radially extended MHD disk winds do not have these limitations and, instead, can reproduce most of the properties of the spatially resolved outflows: nested velocity structure and associated opening angles, persistence of molecular gas over large vertical extents, consistent rotation and geometrical radii, and large mass fluxes. We address each of these in turn below.
4.1.1 Velocity structure and molecular content
The resolved outflows discussed in § 2.1 and 2.2 clearly show a large velocity gradient with polar angle: from km/s at angles of 4∘ down to a few km/s at 30∘ from the jet axis (see also Fig. 3). As discussed in § 3.2.4, this “onion-like” kinematic structure, in combination with the large range of speeds, is a characteristic feature of radially extended MCWs launched from the co-rotation radius outward (see eq. 3).
MHD winds can remain molecular to large distances due to a combination of factors: gas and dust grains carried in the wind partly screen stellar high-energy photons, and ion-neutral drift heating increases only gradually with height (see Panoglou et al., 2012; Wang et al., 2019; Gressel et al., 2020, and § 3.1). As the wind mass-flux drops with time, self-screening and radiative cooling are less efficient, the wind is globally hotter, and the CO-rich wind region moves to larger launch radii, from 0.2 au in Class 0 to a few au in Class II sources (e.g., Panoglou et al., 2012; Wang et al., 2019). In addition, within a given wind, outer streamlines are cooler than inner ones, hence they will be highlighted in low-excitation CO lines. The predicted “onion-like” gradient in chemistry and temperature will naturally produce a hollow appearance for slow CO molecular winds resolved with ALMA, with a rotating atomic flow at intermediate velocities nested inside the molecular “cavity”, as observed in DG Tau A (Agra-Amboage et al., 2014). Ambipolar diffusion heating also predicts a “warm” irradiated wind chemistry with enhanced abundances of SO & SO2 (Panoglou et al., 2012, in agreement with the extended wind seen in Fig. 1 for HH 212), H2O (Yvart et al., 2016, in agreement with Herschel line profiles), and HCN (Gressel et al., 2020).
4.1.2 Consistent rotation and launch radii
Observations provide two independent constraints on the launch radius of an MHD disk wind candidate. In a first, model-independent approach, one can extrapolate the observed cones at constant opening angle down to the disk midplane to obtain a “geometrical” radius (Bjerkeli et al., 2016). Since the opening angle of an MCW should decrease with height (at least initially) due to magnetic recollimation (see § 3.2), sets an upper limit to the true MCW launch radius.
In a second, independent approach, the launch radius is derived from the observed wind rotation in the “cold” MHD approximation of negligible enthalpy and pressure gradients (§ 3.2). Assuming the disk wind is axisymmetric and steady, is inferred by solving for the following ideal-MHD invariant (Anderson et al., 2003):
| (11) |
where and are the (observed) wind poloidal and rotational velocity, the specific angular momentum in the form of matter rotation, the local gravitational potential, and is the Keplerian angular frequency at the footpoint that one wishes to determine. When , the right-hand side term can be neglected, yielding a simpler expression (see eq. 5 in Anderson et al., 2003). However, at the low speeds km/s of small-scale rotating molecular flows detected e.g. with ALMA, this approximation does not apply and the exact form of eq. 11 has to be used. For example, in CB26 the inferred is 32 au with the approximate expression, and 12 au when the right-hand side term of eq. 11 is taken into account.
When the wind is under-resolved (e.g., DG Tau A) or edge-on (e.g., HH 212), and can be significantly underestimated (Tabone et al., 2020a). Therefore, synthetic observations are necessary to properly account for observational biases (e.g., Pesenti et al., 2004; Agra-Amboage et al., 2014, for the rotating atomic and flow in DG Tau A with inferred launch radii au). For HH 212 a proper model of different flow surfaces along the line of sight gives an outermost launch radius of 40 au instead of 1 au (when neglecting flow stratification) for the rotating SO wind and 0.2 au instead of 0.05 au for the SiO jet (Tabone et al., 2017; Tabone et al., 2020a). Modeling of Position-Velocity (PV) cuts at several heights suggests (Lee et al., 2021).
Table 1 gives the full range of geometric and inferred launch radii in the cold MHD approximation among current disk wind candidates. In each individual source, one verifies that . This is also verified streamline by streamline in two Class I sources, TMC1A and DG Tau B (Bjerkeli et al. 2016, de Valon et al. 2022 in press). Therefore the observed geometrical radii and specific angular momenta are both consistent with an origin in an MCW.
Interestingly, the inferred outermost wind launch radii are substantially smaller than the full disk extent in Class I and Class II sources. he apparent limited radial extent of these winds may result from an observational bias (e.g., filtering out of extended faint emission by ALMA, see the case of DG Tau B from de Valon et al. 2022, in press.) or partial dissociation of the outer wind by the ambient UV field. Complementary tracers should be explored to determine the full radial extent of rotating outflows from Class I/II disks.
4.1.3 Wind mass fluxes
An important question is whether the large mass fluxes estimated in spatially resolved MHD disk wind candidates could extract enough angular momentum to drive accretion. As discussed in § 3.2.2, this condition is fulfilled if the wind mass-flux verifies eq. 10 with =1 at disk radii with a dead-zone interior.
The inner () and outer () launch radii of the emitting wind zone under study can be estimated from observations using cold MHD theory (see previous section). The wind magnetic lever arm parameter can be also inferred, once rMCW is calculated from eq. 11, as , assuming has reached its maximum asymptotic value (i.e., all angular momentum extracted in the form of magnetic torsion has been converted into matter rotation). In most molecular wind candidates (e.g., HH30, DG Tau B, Louvet et al. 2018, de Valon et al. 2022 in press), the inferred is close to the minimum value of 1.5 for magnetic acceleration, consistent with current models of winds from the dead zone in weakly ionized disks (e.g., Wang et al., 2019; Gressel et al., 2020; Lesur, 2021). Note that in eq. 10 is the mass accretion rate at the inner launch radius, which is approximated by the mass accretion rate onto the star (or by ten times the jet accretion rate if the star is too embedded).
In all cases where values for , , , and are sufficiently well determined to carry out the above test (DG Tau A, HH 30, HH 212, DG Tau B), the test is conclusive. The estimated angular momentum flux carried by the rotating wind appears sufficient (within a factor 2-3) to drive steady accretion across the wind launching zone at the requested rate (Bacciotti et al., 2002; Agra-Amboage et al., 2011; Maurri et al., 2014; Louvet et al., 2018; Tabone et al., 2020b; de Valon et al., 2020).
4.1.4 Disk wind-jet connection
Previous Protostars and Planets chapters on high-velocity jets (Ray et al., 2007; Frank et al., 2014) considered the tentative rotation signatures identified across a few atomic jets to infer HVC launching radii 0.5-1 au, thus preferring an extended MHD wind to the other jet launching mechanisms discussed in § 3.2.4. However, these estimates were based on transverse velocity shifts in atomic jets, which can be contaminated by asymmetric shocks or jet wiggles (e.g., Coffey et al., 2015; Louvet et al., 2016; Erkal et al., 2021a) so that the previously inferred jet launching radii are only upper limits. Much smaller values are inferred from recent rotation measurements at higher angular and spectral resolution with ALMA across the SiO jet in HH212: 0.05 au for a single emitting ring (Lee et al., 2017b) and 0.05-0.3 au for a radially extended MCW (Tabone et al., 2017). A jet origin within the dust sublimation radius would be consistent with the short dynamical age of SiO knots in HH212, and the sharp increase of SiO detection rate with jet mass-flux (§ 2.1), both predicted by dust-poor chemistry (Tabone et al., 2020b; Lee, 2020). Thus, while it remains unclear whether HVC jets are the manifestation of one or more of the MHD ejection processes discussed in § 3.2.4, they most certainly are launched within 0.3 au.
An open question is then whether the same wind responsible for the slow cones of H2 & CO and the atomic/ionic emission at medium- and low-velocity extends continuously inward to produce the HVC jets, or whether there are “gaps” of low mass-flux due to e.g., magnetic instabilities gathering the flux in some disk regions (cf. chapter by Lesur et al.). This opens the possibility of a scenario where the inner time variable jet could be disconnected from the outer disk wind, but interact with it through bowshocks.
The interaction of a time-variable jet with an outer disk wind was predicted and first modeled in Tabone et al. (2018). The jet drives large bow shocks that sweep up a thin conical shell inside the disk wind, except at small heights where the disk wind has time to partly “refill” the cavity. Recent ALMA observations of HH 212 (Lee et al., 2021) compare favorably with the key predictions of the model. Above au, the flow morphology and kinematics at different heights can be globally reproduced assuming that MHD disk wind streamlines launched from au were swept-out by a large jet bowshock (seen in SiO) into a thin radially expanding “shell”, while outer MHD disk wind streamlines, launched from 8 to 40 au, remain unaffected. Such a jet-disk wind interaction might contribute to the hollow geometry and constant opening angles (up to a thousand times the launch radius) of resolved rotating CO cones in Class I/II sources. Below 40 au, the signs of perturbation are more ambiguous, with PV cuts consistent with replenished, unperturbed MHD disk wind down to ALMA resolution (Tabone et al., 2020b). Numerical simulations of the jet interaction with a more realistic MHD disk wind would be important to further test this scenario and compare with observations of both resolved CO flows and unresolved LVC components, which would trace replenished wind regions near the disk surface at radii au.
4.1.5 An alternative scenario of entrained material
Although we have interpreted the small scale (500 au) nested atomic and molecular cones of outflowing gas that surround the jet as evidence for winds emerging from the disk over radii out to 50 au, an alternate interpretation merits discussion: whether they might instead trace the base of the entrainment of ambient material swept up by a fast wide angle X-wind (see § 3.2.4).
This possibility has been invoked in the literature as the source of some slow au scale resolved H2 and CO flows observed in Class 0/I/II sources (e.g., Pyo et al., 2003; Takami et al., 2006; Beck et al., 2008; Zapata et al., 2015; Lee et al., 2018a; Bjerkeli et al., 2019). However, on such small scales the ambient environment will no longer be a static self-gravitating core, as for large scale entrained flows (Shang et al., 2007, 2020, and references therein), but rather an infalling rotating envelope, where centrifugal deflection and gravity of the central star become dominant. Wind-swept shells in such small scale environments have been modeled both analytically for the ballistic infall solution of Ulrich (1976), see López-Vázquez et al. (2019, 2020); Liang et al. (2020), and numerically for the infalling sheet solution of Hartmann et al. (1994), see Delamarter et al. (2000); Cunningham et al. (2005). When the ambient material being impacted by a fast wide angle wind is an infalling rotating envelope, several observed characteristics of small-scale molecular cones (§ 2) appear difficult to explain. We discuss the main ones below:
– Base radius: The predicted radius at the base of the swept-up shell is close to the disk centrifugal radius, as a consequence of the high equatorial speed of the X-wind (e.g., Fig. 1 in Cunningham et al. 2005, Fig. 9 in López-Vázquez et al. 2019, Fig.2 in Liang et al. 2020). In contrast, resolved molecular cones in Class I/II appear anchored at radii au generally much smaller than the gas disk radius (see § 2). Having smaller shell base radii would require a strong obstacle to the X-wind e.g., a vertical magnetic field in the disk. However, a magnetic field able to stall an X-wind at 10 au would inevitably drive a powerful MHD wind which would induce accretion at 300 times the X-wind mass flux and largely dominate over any entrained material (compare eq. 8 in Cabrit 2007 with eq. 2).
– Kinematics and rotation: Semi-analytical models of expanding shells driven by a fast wide-angle wind into the rotating infalling envelope of Ulrich (1976) could reproduce the observed mass and poloidal speeds in the low-mass Class I rotating flow of CB26, but the rotation speeds are too low by an order of magnitude from the observed ones (López-Vázquez et al., 2019). In the case of DG Tau B, observed at 15 au resolution, there has been a detailed comparison of the observed CO conical shell with models from Lee et al. (2001) and López-Vázquez et al. (2019), showing that the predicted radial expansion does not reproduce the kinematics, and the specific angular momentum is again smaller than observed (de Valon et al. 2022, in press).
– Fast replenishment: the inferred age of a wind-driven shell, , is much shorter than the source age in many cases: e.g. 15 yr in DG Tau A, 45 yr in HH212 and DG Tau B, 1,000 yr in CB26 (Agra-Amboage et al., 2014; Lee et al., 2018a; López-Vázquez et al., 2019). This implies that new shells need to be periodically generated by wind outbursts, with a typical recurrence timescale of 20-1,000 yrs. Once the infalling envelope is cleared out by previous shells, however, replenishing on such short timescales will be challenging, and eventually no ambient material would remain to be entrained on small scales. Replenishment “from below” by a PE wind can be ruled out, as the rate of mass to be entrained in the CO shells (a few /yr in the Class 0 HH212 and a few /yr in Class I/II) largely exceeds the expected mass-outflow rate in a PE wind for realistic irradiation conditions (§ 3.3 and 4.1). The envelope replenishment issue could be avoided if the swept-up shell is stationary instead of expanding, and infalling material is entrained in a mixing-layer parallel to the shell walls (Liang et al., 2020). However, the predicted shell base radius is still close to the disk radius, hence much too large to explain Class I/II observations (see above).
We conclude that the MHD radial disk wind scenario is better able to reproduce all of the observed properties of slow rotating flows on scales au, while the scenario of entrainment by a fast wide-angle X-wind has several drawbacks.
4.2 Spatially Unresolved Wind Diagnostics Through to the Lowest Accretors
Since PPVI, a growing number of atomic and molecular transitions with line profiles indicative of slow winds have been identified (§ 2.1 and 2.2). They include: the LVC of optical forbidden lines like the [O I] 6300; near-infrared CO and H2 transitions; infrared forbidden lines like the [Ne II] at 12.8 \micron; and CO rotational lines at millimeter wavelengths. At the same time, both MHD and PE wind models have incorporated rather detailed heating and cooling mechanisms (§ 3.2.3 and 3.3) and have published line luminosities and profiles that can be confronted with observations. Our goal here is to summarize such comparisons, assess which transitions are most likely to trace MHD or PE winds, and discuss new theoretical predictions that can be tested with further observations.
The LVCs of oxygen forbidden lines in Class II sources have recently seen a renewed interest as disk wind tracers as they are bright, blueshifted, and require high temperature for excitation (see also Fig. 5). They also allow us to probe the relative contributions of both MHD and photoevaporative winds, as many Class II sources have low enough column densities through the wind that high energy radiation may penetrate to the disk beyond the critical radius for thermal ejection. Indeed, Ercolano and Owen (2010) were among the first to predict line emission signatures due to X-ray photoevaporation as X-rays can heat neutral gas to high temperatures and naturally excite the forbidden transitions.
The behavior of the LVC is sufficently complex, however, with both broad and narrow kinematic components, that neither MHD nor PE winds have yet been able to fully account for their structure. The sources with composite BC+NC profiles are of particular interest. Photoevaporative winds cannot be invoked for the BC, as the large FWHMs and shifts trace gas within the gravitational potential well of the star, requiring an MHD rather than a thermal flow (e.g., Simon et al., 2016; Picogna et al., 2019). The empirical correlations between the BC and NC described in § 2.2, led Banzatti et al. (2019) to argue for a common origin of both components in different parts of the same MHD wind. While this argument is compelling there is as yet no explanation for why distinct BC and NC profiles would arise in a radially continuous MHD wind. Weber et al. (2020) suggest a combination of MHD and PE winds to explain the composite BC+NC profiles, combining an analytic MHD inner wind model with the Picogna et al. (2019) photoevaporative model where an inner MHD wind produces the BC while a PE wind produces the NC. The correlations reported in Banzatti et al. (2019) are accounted for in this dual wind scenario by a single common correlation between line luminosity and accretion luminosity which is modelled as an extra EUV component heating the line-emitting region in both winds.
One example is now documented where the NC cannot be attributed to a PE wind. In a spectroastrometric study of the high accretion rate Class II source RU Lup, Whelan et al. (2021) measure the centroid of the NC emission out to a de-projected distance of 8 au in [O I] 6300 and 40 au in [S II] 6731 and show a smoothly decreasing velocity with increasing vertical offset, as expected in a disk wind (see their Fig. 8). The observed NC blueshifts of 30 km/s at 2 au from the disk midplane are too fast and too deep within the potential gravitational well of the star for thermal winds (e.g., Ballabio et al., 2020). A similar spectro-astrometric signal was detected in the CO fundamental for this source (Pontoppidan et al., 2011), where the molecular gas traces the slower portion of the wind closer to the disk surface (see Fig. 9 in Whelan et al. 2021).
Furthermore, LVC with composite BC+NC features are most common among the higher accretion rate Class II sources, but as the accretion rate falls, the LVC profiles simplify to single Gaussians, with a range of FWHM (100 to 10 km/s) that encompass the widths attributed to BC and NC. There is as yet no explanation for why some sources would have BC, and others NC, characteristics. Importantly, however, the NC becomes the most common feature as the accretion rate continues dropping and the inner disk is dissipating (§ 2.2). This is where the [Ne II] 12.8 \micron LVC, with small blueshifts (by a few up to several km/s) and FWHMs (), appears. The new VLT/VISIR2 survey discussed in § 2.2 has shown that [Ne II] LVC luminosities display an opposite behaviour to the [O I] 6300 LVC in that they increase in systems with depleted inner dust and typically lower mass accretion rates (Pascucci et al., 2020). The [Ne II] LVC is well reproduced by photoevaporative models (e.g., Alexander et al., 2014; Ballabio et al., 2020) and the persistent blueshifts in their centroids point to a wind beyond the dust cavity while the weaker [O I] emission, which is often centered at the stellar velocity in these evolved sources, arises within. These new findings suggest an evolution in disk winds: MHD winds appear to dominate in high-accreting, radially continuous disks while PE winds begin to emerge in disks with an inner dust cavity, lower accretion, and weaker inner wind (see Fig. 9 in Pascucci et al. 2020). MIRI MRS observations with JWST should be able to spatially resolve the [Ne II] emission from the disks with the largest dust cavities and thus test whether this line truly traces a PE wind.
Moving to longer wavelengths, Yvart et al. (2016) have carried out a detailed comparison between predicted and spectrally resolved H2O profiles observed with Herschel/HIFI toward Class 0 and I sources. The authors adopted an analytic MHD disk wind model used to explain jet rotation in T Tauri stars and upgraded the thermo-chemistry developed in Panoglou et al. (2012) along dusty streamlines. By varying only four parameters (stellar mass, mass accretion rate, the outermost launch radius, and viewing angle), they show that this typical dusty MHD disk wind can reproduce the variety of broad wing emission profiles beyond from systemic velocity. An interesting prediction of these models is that the launch radius beyond which most of the molecular (H2) content survives moves radially outward with evolutionary stage. This is because as the wind density drops going from Class 0 through to Class II, stellar X-rays and FUV photons penetrate deeper in the wind dissociating more molecular hydrogen (e.g., Figs. 6 and 7 in Panoglou et al., 2012). Observations with JWST/NIRSpec that could spatially resolve winds in H2 ro-vibrational transitions might be able to test this prediction.
Photoevaporative winds also have a layer in between the cold (T K) midplane and the mostly ionized hot ( K) surface where H2 and other molecules survive and could leave the system at moderate radial velocities (), see e.g. Fig. 1 in Wang and Goodman (2017a). Gressel et al. (2020) have recently computed synthetic line profiles (and moment 1 maps) of selected atomic and molecular transitions, e.g., [O I] 63.2 \micron and HCN (3-2) through to (8-7), to distinguish a PE from an MHD disk wind. While the far-infrared lines are too faint to be reliably detected with SOFIA, the millimeter transitions are detectable with ALMA. Because the main difference between their PE and MHD wind models is the presence of a more collimated closer-in outflow in the latter case, predicted line profiles are significantly more asymmetric and blueshifted in the MHD than in the PE wind at most disk inclinations (e.g., their Fig. 16), an asymmetry that is even more evident in moment 1 maps (e.g., their Fig. 17).
4.3 Winds in Transition Disks
Disks with dust inner cavities inferred from their spectral energy distributions, also known as transition disks (Strom et al., 1989), have been commonly assumed to experience a global (dust and gas) inside-out clearing and their properties and frequencies have been used to constrain disk dispersal mechanisms (e.g., Alexander et al., 2014). Since PPVI (Espaillat et al., 2014), an unbiased search and characterization of these disks (van der Marel et al., 2016b), together with improved and expanded measurements (e.g., Manara et al., 2014), has revealed that transition disks are in fact a diverse class of objects.
PE models that assume solar metallicity disks can only explain half of the transition disk population, i.e. those with M⊙/yr and cavities up to au (Ercolano and Pascucci, 2017; Picogna et al., 2019). As a cavity is only opened when the disk accretion rate falls below the PE mass loss rate, a way to explain higher accreting TDs is to further enhance photoevaporation which can be obtained in carbon-depleted disks (Ercolano et al., 2018; Wölfer et al., 2019, and § 3.3). Alternatively, Wang and Goodman (2017b) have suggested that magnetized winds are driving inner disk accretion at transonic radial speeds, which are much larger than those obtained via typical viscous torques (see also Combet et al., 2010). When the ambipolar diffusion parameter is in the right range for neutral midplane gas to be moderately coupled to the magnetic field, the gas surface density inside the cavity can be relatively low ( g cm-2) but still result in significant accretion ( M).
Gas in the cavity of transition disks has been detected via several diagnostics, including H2 fluorescent (e.g., Hoadley et al., 2015), [O I] 6300 (e.g., Fang et al., 2018), and CO fundamental emission (e.g., Pontoppidan et al., 2011). The [O I] 6300 profile, which is a good tracer of inner winds in accreting T Tauri stars with full disks (§ 2.2), here lacks an HVC, is typically fit by just one Gaussian NC centered on the stellar velocity, and is consistent with bound gas inside the dust cavity (Simon et al., 2016; Pascucci et al., 2020). However, the [O I] 6300 could still form in an inner wind, as both approaching and receding material contribute to the profile (e.g., Ercolano and Owen, 2016). In a few cases, a wind is certainly present but detected beyond the cavity via blueshifts in the [Ne II] line centroids (Pascucci et al., 2020). Unfortunately, these UV to IR tracers are beset with uncertain abundances and excitation conditions, hence are not ideal to constrain the gas surface density within the cavity. Significant improvements could be achieved with ALMA by selecting nearly optically thin lines and spatially resolving the cavities. By simultaneously modeling the source SED, continuum visibilities, and 13CO spectra and visibilities, van der Marel et al. (2016a, 2018) and Dong et al. (2017) find that the gas surface density within the dust cavity is depleted by more than two orders of magnitude than outside (except in RY Lup, where modeling could be complicated by a likely warped inner disk). These upper limits are encouraging but, in most cases, not stringent enough to test Wang & Goodman’s accretion scenario. As such, dynamical clearing by giant planets remains the favored mechanism for explaining high accretors with large dust cavities (e.g., van der Marel et al., 2018). At least in the case of PDS 70, two accreting giant planets have been detected (Keppler et al., 2018; Wagner et al., 2018; Haffert et al., 2019; Wang et al., 2021) within the large ( au) millimeter dust gap (Keppler et al., 2019). Although PDS 70 accretes at low levels ( M⊙/yr, Thanathibodee et al. 2020), the inferred depletion of gas surface density at the location of one the planets (Keppler et al., 2019) lends strong support to dynamical clearing.
A more direct way to test the scenario proposed by Wang & Goodman would be to detect gas accreting at transonic speeds within the large dust cavities of high accreting stars. Rosenfeld et al. (2014) have shown that fast radial inflow should be detectable in channel maps of optically thick lines via isovelocity contours that are rotated with respect to the disk axes and twisted isophotes in maps covering velocities close to systemic. However, they also caution that similar observational diagnostics are produced by a warped inner disk as e.g. in HD 142527 (Casassus et al., 2015). For more details on kinematic signatures from fast accreting gas inside dust cavities we refer the reader to the chapter by Pinte et al. in this volume.
4.4 Tentative and Indirect Disk Wind Diagnostics
In addition to direct evidence for disk winds, there are several indirect ways to establish their presence or absence. Demographic studies of global gas and dust disk properties are one such approach and covered in the chapter by Manara et al. in this volume. Here, we focus on a few complementary indirect disk wind diagnostics that have been further investigated since PPVI.
4.4.1 Free-free Emission
A fully or partially ionized disk wind should produce free-free thermal emission as well as H recombination lines at radio wavelengths (Pascucci et al., 2012; Owen et al., 2013). While the line emission is probably too weak to be detected even with the ngVLA (Pascucci et al., 2018), the number of candidate disk wind sources identified from cm emission in excess of the dust thermal emission has grown since PPVI (e.g., Pascucci et al., 2014; Coutens et al., 2019). When available, multi-wavelength cm observations have been used to exclude other possible sources of excess emission, such as gyro-synchrotron non-thermal radiation and emission from very large cm-size or very small nanometer-size grains, but it is clear that higher sensitivity and spatial resolution are needed to turn this diagnostic into a direct tracer of disk winds. At the time of writing there exist only two tentative morphological detections of wide angle cm emission compatible with disk winds: DG Tau A (eMERLIN, Ainsworth et al., 2013) and GM Aur (VLA, Macías et al., 2016). Recently, Ricci et al. (2021) used the X-ray PE model by Picogna et al. (2019) and the analytic MHD disk model from Weber et al. (2020) to simulate ngVLA observations at milliarcsecond angular resolution for the nearby disk of TW Hya. They showed that such observations can spatially resolve the wind and further distinguish between the two models as the PE disk would present two spatially distinct emission regions, with only the one further away tracing unbound gas, while the MHD disk would have a smoother more compact free-free emission.
Along with possibly tracing a wind, sensitive observations at cm wavelengths have been also used to set useful upper limits on the EUV photon luminosity () impinging on the disk surface. This is because the free-free luminosity from an ionized disk surface is linearly proportional to (Pascucci et al., 2012), yet other sources of cm emission discussed above cannot be disentangled. This simple approach led to the identification of a significant number () of disks receiving EUV photons per second (Pascucci et al., 2014; Galván-Madrid et al., 2014; Macías et al., 2016; Coutens et al., 2019), a too low for EUV-driven photoevaporation alone to disperse protoplanetary disks. In addition, for the subset of disks having a [Ne II] 12.8 \micron detection, the inferred are too low to efficiently ionize Ne atoms and reproduce the observed line luminosities (Pascucci et al., 2014). This points to Ne atoms being primarily ionized by 1 keV X-ray photons. Importantly, because these [Ne II] profiles are also blueshifted, the outflowing gas is located deeper in the disk than what predicted by EUV-only PE models, implying higher mass loss rates.
4.4.2 Dust Entrained in Winds
Aerodynamically well coupled dust grains can be stirred upward by the vertical upflows accompanying MHD or PE disk winds (e.g., Owen et al., 2011; Miyake et al., 2016, see also §5). Unless turbulence is very strong in the disk (), the mechanism through which dust is delivered to the wind is vertical advection rather than diffusion and results in \micron grains efficiently removed from the disk (Booth and Clarke, 2021).
These uplifted grains produce near-infrared emission, and hence can increase the excess emission above the stellar photosphere and affect the vertical height of disks measured in scattered light (e.g., Bans and Königl, 2012; Riols and Lesur, 2018; Franz et al., 2020). In addition, McJunkin et al. (2014) suggest that they could contribute to extinguish stellar photons and thus explain the discrepancy between the higher obtained from optical and IR observations versus the lower interstellar extinction calculated from Ly- absorption. In the case of MHD winds, the large variability of magnetic activity within au is expected to drive time-variable upflows (Flock et al., 2017). Dust grains dragged upward in a time-dependent manner would form local dust concentrations which, depending on the viewing angle, could temporally obscure the central star and lead to time-dependent optical fading and infrared brightening (e.g., Ellerbroek et al., 2014; Fernandes et al., 2018). This phenomenon might also explain some, but not all, of the so-called “dippers”, young stars that show day-long dimmings up to several tens of percent (e.g., Ansdell et al., 2020). The deep irregular dimming of RW Aur A from the U through to the M band have been also interpreted as obscuration from a dusty wind launched beyond au (Dodin et al., 2019).
Finally, crystalline grains detected in the outer disk, beyond au (e.g., Sturm et al., 2013), may also serve as an indirect diagnostic of disk winds. These grains are thought to have undergone thermal annealing at temperatures K (Yamamoto and Tachibana, 2018; Hallenbeck et al., 2000), much larger than those in the outer disk. Giacalone et al. (2019) recently adopted a self-similar solution for a cold MHD disk wind and showed that grains beyond the dust sublimation radius can be efficiently uplifted from the disk surface, thermally annealed by stellar irradiation in the wind, and transported outward; intermediate size ( \micron) grains would thus re-enter and settle in the outer disk (see § 5). For their classic T Tauri disk model, the bulk of the re-entering mass would be crystalline if launched within au, that is, well inside the potential well of the star. The efficiency of the global circulation induced by the MHD disk wind may thus be measured by the observed ratio of crystalline to amorphous grains.
Synthetic observations of dusty winds are necessary to test theoretical models and establish how efficiently MHD and PE winds entrain dust grains. As pointed out in Franz et al. (2020), the different mass loss profiles of these winds should result in different size distributions and densities for the entrained dust versus radius (see also Rodenkirch and Dullemond 2022) – with the resulting dust emission likely being more concentrated toward the star for MHD than for PE winds. Scattered light images at near-infrared wavelengths should be most sensitive to the sub-micron- and micron-size grains expected to be entrained in the wind (e.g., Owen et al., 2011). However, recent synthetic observations of XEUV winds show that the disk height is only marginally affected by the wind and its unambiguous detection will be challenging even with JWST (Franz et al., 2022).
4.4.3 Local Gas and Dust Substructures
The formation of local substructures can also be an indirect diagnostic for the removal of angular momentum and disk mass via MCWs through relatively strong poloidal magnetic field with . An initial small perturbation of gas density leads to the radial advection of vertical magnetic flux. The excited perturbation of the magnetic field strength is anti-correlated with the initial density perturbation as a result of the viscous diffusion of magnetic flux from denser regions. If stronger mass loss is driven from the less dense stronger-field region and/or if faster accretion is induced by the more efficient removal of angular momentum there, the density of this gap region further decreases to reinforce the initial density perturbation (Lubow et al., 1994b; Riols and Lesur, 2019) – as a result, rings and gaps spontaneously form in disks with MHD winds. Suriano et al. (2017, 2018, 2019) demonstrated that rings and gaps are created by this instability in both 2D and 3D global non-ideal MHD simulations. In their 2D simulations, Riols et al. (2020) found a typical separation between rings of 2.5 and 5 times the local scale height at au for and , respectively. Thus, the separation between rings is found to be wider for stronger vertical fields () but the dependence is weak. While in principle such ring-gap features can be long lived, potential secondary non-axisymmetric instabilities, which may not be resolved by current simulations, might disrupt them. Dense rings are obviously a favorable site for the concentration and growth of dust particles, which will be discussed in § 5.
4.4.4 Evolution of the Gas Disk Outer Radius
When mass accretion is predominantly driven by the removal of angular momentum through MCWs, disk evolution is different from that governed by viscous accretion. First, the reduced turbulent dissipation suppresses viscous heating, resulting in lower temperatures in the disk midplane (Mori et al., 2019). Second, the disk outer radius does not expand much because of reduced viscous spreading (e.g., Shadmehri and Ghoreyshi, 2019; Chambers, 2019), which is important for planet formation models (see § 5) and can be tested observationally (e.g., Najita and Bergin, 2018).
Inferring gas disk sizes from observations requires proper treatments that account for the optical depth, freeze-out, and photo-dissociation of gas-phase tracers such as CO (e.g., Facchini et al., 2017; Trapman et al., 2020). Recently, Trapman et al. (2020) generated synthetic emission maps based on viscously evolving disk models and found that most observed CO gas disk sizes in Lupus can be reconciled with low levels of turbulence (i.e., to ). These low values compare well with those obtained in recent global simulations of weak MRI turbulence as a result of ambipolar diffusion (Cui and Bai, 2021). A potential caveat for the viscous disk scenario is that disks would have to start out small (radii au) which requires efficient removal of angular momentum during disk formation (e.g., Machida et al., 2011). The gas disk radii measured so far for the earliest Class 0 evolutionary stage are significantly larger than this and often comparable to those inferred in the later Class I and II stages (see Table 1) suggesting, if anything, only moderate viscous spreading over millions of years.
The radial extent of a viscously evolving disk is further affected by FUV photoevaporation (Gorti et al., 2009, 2015). Since the latter is more effective at larger radii, gas removal here halts the expansion of the outer gas disk, further complicating interpretations of observed disk radii in the context of viscous spreading. In fact, FUV PE models indicate a modest shrinking in the disk size over the final Myr even in disks with high of (see Fig. 8 in Gorti et al. 2015).
5 IMPLICATIONS FOR PLANET FORMATION AND MIGRATION
Disk winds also affect the evolution of the solid component of a protoplanetary disk and the subsequent formation, evolution, and migration of planets.
Both PE and MHD disk winds are primarily outflowing gas from the disk surface but small dust particles can be also entrained and uplifted (see § 4.4.2). There are no conclusive results on the amount of entrained dust. However, Hutchison et al. (2016) point out that it is the dust scale height, which is determined by turbulence, that controls the amount of grains brought into the launch regions. As such, the amount of entrained dust is likely linked to the wind launching region. Hutchison and Clarke (2021) find that EUV photoevaporation creates a vertical gas flow within the disk that assists turbulence in supplying dust to the ionization front and predict a maximum size \micron for the uplifted grains beyond au. The denser XEUV wind models by Franz et al. (2020) find instead that dust grains of m can be coupled to the gas and lifted from 15-30 au. Models of dust entrained in winds driven by all high-energy components, including FUV photons, are not available but efficient dust entrainment is also expected beyond au. In contrast to PE models, MHD disk winds can be stronger and denser closer in and dust entrainment is expected to be more efficient at smaller radii (see Hansen 2014 for an early work on this topic). A simple radial scaling based on the MMSN model suggests m (Miyake et al., 2016). Dust grains with size are expected to float at several scale heights from the midplane, which can be used as an indirect signature of MHD disk winds (§ 4.4.2). Recent 2D simulations further show the importance of radiation pressure in pushing out dust grains, particularly those within 1 au (Vinković and Čemeljić, 2021), thus assisting in the outward transport and reentering in the disk outer regions (see e.g., Giacalone et al., 2019, and § 4.4.2). This large-scale transport is not seen in PE models (e.g., Hutchison and Clarke, 2021).
5.1 Winds and planetesimal formation
A direct outcome of the preferential removal of gas by PE or MHD disk winds is the increase of the disk dust-to-gas ratio (e.g., Suzuki et al., 2010; Gorti et al., 2015), which promotes the growth of solid particles. Carrera et al. (2017) adopted the PE wind model from Gorti et al. (2015) and showed that the enhanced dust-to-gas ratio favors the formation of planetesimals by the streaming instability, whereas the amount of the planetesimals sensitively depends on the detailed treatment of the solid component. While earlier X-ray PE models did not succeed in finding such enhancements (Ercolano et al., 2017), recent work on dust dynamics in XEUV photoevaporative winds shows very rapid increase in the dust-to-gas ratio reaching unity in years (Franz et al., 2022).
PE and MHD disk winds also affect the radial drift of solid particles. In a standard protoplanetary disk with a MMSN surface density, boulder-sized ( m) objects suffer severe inward drift to the central star (e.g., Adachi et al., 1976), the so-called radial drift barrier against the formation of planets. However, the radial profile of the gas component is largely altered in the presence of disk winds. An inner cavity is often formed by the effect of PE at late stages of evolution. The radial drift of solid particles slows at the outer edge of the cavity, which enhances the local dust-to-gas ratio. Combined with the preferential removal of gas, the inner cavity is a suitable site for the formation of planetesimals (Carrera et al., 2017). MHD disk winds generally disperse the gas in an inside-out manner (Suzuki et al., 2010). As a result, the radial slope, , of the surface density () is reduced which slows down the inward drift of solid particles from small dust grains to planetesimals. Taki et al. (2021) used the wind-driven accretion models of Suzuki et al. (2016) and found that drifting dust grains pile up to form planetesimals in a region around au when , where is the dimensionless radial-pressure gradient force. If the inside-out dispersal is more drastic (Takahashi and Muto, 2018), could be negative so that dust particles drift outward, which could provide an alternative explanation for crystalline grains in the outer disk regions (Arakawa et al., 2021). However, we should note that is uncertain as it depends on the properties of advected poloidal magnetic field and detailed microphysical processes (Bai, 2016). Once planetesimals are concentrated within au, they can form rocky planets with properties similar to those in our Solar System (Ogihara et al., 2018b).
Local substructures such as rings and gaps created by the MHD disk winds (§4.4.3) also play a role in the growth of dust grains because dense gaseous rings accumulate solid particles (Riols and Lesur, 2018). 3D global MHD simulations by Riols et al. (2020) demonstrate that dust grains concentrate into pressure maxima of axisymmetric gaseous rings to eventually form dusty rings.
5.2 Winds and planetary migration
In a typical protoplanetary disk, low-mass planets migrate inward due to the gravitational interaction with the background gas disk (Ward, 1997; Tanaka et al., 2002; Paardekooper et al., 2011). Importantly, the altered gaseous radial profile of wind-driven accretion disks also affects the migration of (proto)planets in two ways. First, the decrease of the inner disk surface density by MHD disk winds slows down, halts, or can even reverse the inward migration of planetary embryos with and Earth-size planets (Ogihara et al., 2015). As a result, low-mass planets can survive in the inner region and their radial distribution can reproduce the observed distribution of close-in super-Earths in exoplanetary systems (Ogihara et al., 2018a). Second, when accretion is triggered by the removal of angular momentum in MHD disk winds (Bai, 2017; Gressel et al., 2020), the accretion flow is laminar, in contrast with the turbulent diffusivity of viscous accretion models. While in a viscous accretion flow gas diffuses between the corotation region and the surrounding regions at both the inner and outer edges, in a laminar case the librating flow in the corotation region is more asymmetric and induces a positive corotation torque on the planet (McNally et al., 2017; Ogihara et al., 2017). Therefore, the inward migration of low-mass planets tends again to be suppressed or even reversed in a wind-driven accreting disk, whereas the velocity of the migration also depend on other detailed conditions of the vertical profile of the radial velocity of the gas (Ogihara et al., 2017) and the initial relative motion between the gas and the planet (McNally et al., 2018).
Finally, wind-driven accretion also affects the migration of more massive planets that open a gap in the disk. Similarly to lower-mass planets, mass supply to the co-orbital gap region is largely altered from viscous accretion disks. 2D simulations by Kimmig et al. (2020) show that in cases of strong wind-driven accretion Jupiter- and Saturn-size planets rapidly migrate outward thanks to the positive corotation torque excited by the asymmetric librating flow structure. 3D simulations should be carried out to test the robustness of this phenomenon.
6 CONCLUSIONS AND OUTLOOK
Since PPVI, significant progress has been made in detecting and characterizing mass ejection from low-mass stars and in building more realistic models of disk evolution and dispersal. Through this review we find that, at each evolutionary stage, there is evidence of powerful collimated fast ( km/s) jets being surrounded by radially extended slow outflows with morphologies and velocities consistent with MHD disk winds. These winds arise from a large range of disk radii, from within the dust sublimation radius out to 100 au, with outflow velocity decreasing with radius. While still preliminary, best estimates are that the wind mass loss exceeds that in the jet and is comparable to the accretion rate onto the star. Such high mass loss rates are consistent with MHD winds as a primary driver of accretion in the planet formation region ( au). Unresolved outflow signatures in Class II sources further show that, as the accretion rate falls, disk winds persist after the jet is no longer detectable, and as the accretion rate continues to decline further, the wind appears to evolve, from MHD to PE dominated.
Alongside with observations, global disk simulations that couple gas dynamics with magnetic field, thermal energy transport, and chemistry find that radially extended disk winds are a common outcome and can drive accretion at the observed levels. More realistic photoevaporative wind models coupling hydrodynamics and chemistry have clarified that FUV photons play an important role in driving thermal flows and that mass loss rates may range from a few M⊙/yr up to M⊙/yr for typical low-mass stars, a factor of a few lower than those from MHD models. Thus, both observations and theory suggest that MHD disk winds drive the early evolution of protoplanetary disks while photoevaporative winds become critical at later stages.
There remain a number of open questions and controversies in this broad brush evolutionary picture which set future priorities for observations and theoretical investigations. For instance, it remains unclear whether jets and winds are the manifestation of the same physical process, as expected in MHD wind models, or rather constitute physically distinct mechanisms. In addition, the interpretation of observed, outer molecular cones as disk winds is still debated for the Class 0/I stage and the alternative scenario of entrained gas from fast inner winds is not completely ruled out. Further progress in these areas can be achieved with more sensitive high-resolution ALMA images testing e.g. whether jets are typically hollow and if warmer MHD disk wind streamlines are present at radial distances closer to the star than the cooler molecular cones.
In the Class II stage, where wind diagnostics remain mostly spatially unresolved, we do not know how different forbidden LVC components could arise from a radially continuous MHD wind, wind mass loss rates bear large uncertainties, and the transition from MHD to PE winds remains elusive. As discussed in this chapter, spectro-astrometry in the LVC holds the promise to constrain the vertical extent of the BC and NC and thus help to pin down wind mass loss rates. Sensitive IFU spectro-imaging, from the ground and soon from space with JWST/NIRSpec and MIRI, will expand the number of Class II sources with spatially resolved jets and winds. This sample will enable further testing of the “onion-like” kinematic structure expected from radially extended MHD disk winds and verify whether more mass is typically lost in the wind than in the jet as suggested by the few systems available so far. Additionally, when targeting transition disks with large dust cavities, IFU spectro-imaging could test if their winds arise just exterior to the cavity as expected in the photoevaporative scenario. While several ALMA surveys of Class II disks have been carried out so far, they are either too shallow or limited in spatial coverage due to high resolution to adequately resolve cool molecular winds. Sensitive multi-configuration ALMA observations such as those for DG Tau B and HH 30 are necessary to expand the sample of spatially resolved molecular winds and establish if the mass ejection is continuous or if more mass is removed in the outer vs the inner disk.
From the theoretical side, global MHD disk simulations have become reasonably realistic but are still confined to snapshots in time and remain mostly relevant to typical Class II accretors. It would be valuable to expand the set of simulations and explore different evolutionary stages that could be applicable to the earlier Class0/I stage as well as the later Class II stages when PE winds might start to dominate. As yet it remains unclear how the effective evolves radially and in time, whether it smoothly connects to MRI-active regions, and whether there are specific radial distances where mass is preferentially removed, which could drive gaps and structures in disks. One of the grand challenges is to conduct a long-time global simulation (including MRI-active and non MRI-active regions) from the Class-0 stage to the Class-II stage with appropriate microphysics. Along with tracking basic disk parameters, synthetic line observations at all evolutionary stages would be crucial to further test disk wind models as well as to constrain some of the critical input parameters such as the amount and evolution of the magnetic flux threading the disk. Current theoretical investigations have shown that wind-driven accretion significantly impacts the evolution of the solids in a disk as well as planet formation, evolution, and migration. Confronting disk wind observations and theory is crucial to building a comprehensive theory of disk evolution and dispersal and thus clarifying the role of disk winds in the assembly and final architecture of planetary systems.
Acknowledgments We thank C. F. Lee and A. deValon for creating the composite images of HH 212 and DG Tau B respectively, and K. Stapelfeldt and D. Padgett for providing the HST data tracing the DG Tau B jet. We are grateful to M. Güdel for providing the ALMA 12CO data of DG Tau A, to J. Tobin for inputs on the VANDAM survey, to T. Beck for comments on the H2 near-infrared resolved wind morphologies, and to J. Ferreira for insightful comments on the theory of MHD disk winds. I.P., U.G., and S.E. acknowledge support from a Collaborative NSF Astronomy & Astrophysics Research grant (ID: 1715022, ID:1713780, and ID:1714229). S.C. acknowledges support by the Programme National “Physique et Chimie du Milieu Interstellaire” (PCMI) of CNRS/INSU with INC/INP co- funded by CEA and CNES, and by the Conseil Scientifique of Observatoire de Paris. T.K.S. is supported by Grants-in-Aid for Scientific Research from the MEXT of Japan, 17H01105 and 21H00033. This material is based on work supported by the National Aeronautics and Space Administration under agreement No. NNX15AD94G for the program Earths in Other Solar Systems. The results reported herein benefited from collaborations and/or information exchange within NASA’s Nexus for Exoplanet System Science research coordination network sponsored by NASA’s Science Mission Directorate.
References
- Adachi et al. (1976) Adachi I. et al., 1976 Progress of Theoretical Physics, 56, 1756.
- Adams et al. (1987) Adams F. C. et al., 1987 ApJ, 312, 788.
- Agra-Amboage et al. (2011) Agra-Amboage V. et al., 2011 A&A, 532, A59.
- Agra-Amboage et al. (2014) Agra-Amboage V. et al., 2014 A&A, 564, A11.
- Ainsworth et al. (2013) Ainsworth R. E. et al., 2013 MNRAS, 436, 1, L64.
- Alcalá et al. (2014) Alcalá J. M. et al., 2014 A&A, 561, A2.
- Alcalá et al. (2017) Alcalá J. M. et al., 2017 A&A, 600, A20.
- Alexander et al. (2014) Alexander R. et al., 2014 Protostars and Planets VI (H. Beuther, R. S. Klessen, C. P. Dullemond, and T. Henning), p. 475.
- Alexander and Armitage (2007) Alexander R. D. and Armitage P. J., 2007 MNRAS, 375, 2, 500.
- Anderson et al. (2003) Anderson J. M. et al., 2003 ApJ, 590, 2, L107.
- Andre and Montmerle (1994) Andre P. and Montmerle T., 1994 ApJ, 420, 837.
- Ansdell et al. (2020) Ansdell M. et al., 2020 MNRAS, 492, 1, 572.
- Arakawa et al. (2021) Arakawa S. et al., 2021 ApJ, 920, 1, 27.
- Arce et al. (2007) Arce H. G. et al., 2007 Protostars and Planets V (B. Reipurth, D. Jewitt, and K. Keil), p. 245.
- Armitage (2011) Armitage P. J., 2011 ARA&A, 49, 1, 195.
- Armitage et al. (2013) Armitage P. J. et al., 2013 ApJ, 778, 1, L14.
- Aso et al. (2015) Aso Y. et al., 2015 ApJ, 812, 1, 27.
- Bacciotti et al. (1999) Bacciotti F. et al., 1999 A&A, 350, 917.
- Bacciotti et al. (2000) Bacciotti F. et al., 2000 ApJ, 537, 1, L49.
- Bacciotti et al. (2002) Bacciotti F. et al., 2002 ApJ, 576, 1, 222.
- Bai (2016) Bai X.-N., 2016 ApJ, 821, 2, 80.
- Bai (2017) Bai X.-N., 2017 ApJ, 845, 75.
- Bai and Stone (2017) Bai X.-N. and Stone J. M., 2017 ApJ, 836, 46.
- Balbus and Hawley (1991) Balbus S. A. and Hawley J. F., 1991 ApJ, 376, 214.
- Ballabio et al. (2020) Ballabio G. et al., 2020 MNRAS, 496, 3, 2932.
- Bally (2016) Bally J., 2016 ARA&A, 54, 491.
- Bally et al. (2007) Bally J. et al., 2007 Protostars and Planets V (B. Reipurth, D. Jewitt, and K. Keil), p. 215.
- Bans and Königl (2012) Bans A. and Königl A., 2012 ApJ, 758, 2, 100.
- Banzatti et al. (2019) Banzatti A. et al., 2019 ApJ, 870, 2, 76.
- Banzatti et al. (2022) Banzatti A. et al., 2022 arXiv e-prints, arXiv:2202.03438.
- Bary et al. (2003) Bary J. S. et al., 2003 ApJ, 586, 2, 1136.
- Bast et al. (2011) Bast J. E. et al., 2011 A&A, 527, A119.
- Beck and Bary (2019) Beck T. L. and Bary J. S., 2019 ApJ, 884, 2, 159.
- Beck et al. (2008) Beck T. L. et al., 2008 ApJ, 676, 1, 472.
- Béthune et al. (2017) Béthune W. et al., 2017 A&A, 600, A75.
- Bjerkeli et al. (2016) Bjerkeli P. et al., 2016 Nature, 540, 7633, 406.
- Bjerkeli et al. (2019) Bjerkeli P. et al., 2019 A&A, 631, A64.
- Blandford and Payne (1982) Blandford R. D. and Payne D. G., 1982 MNRAS, 199, 883.
- Booth et al. (2021) Booth A. S. et al., 2021 ApJS, 257, 1, 16.
- Booth and Clarke (2021) Booth R. A. and Clarke C. J., 2021 MNRAS, 502, 2, 1569.
- Braiding and Wardle (2012) Braiding C. R. and Wardle M., 2012 MNRAS, 422, 1, 261.
- Brown et al. (2013) Brown J. M. et al., 2013 ApJ, 770, 2, 94.
- Cabrit (2002) Cabrit S., 2002 EAS Publications Series, vol. 3 of EAS Publications Series (J. Bouvier and J.-P. Zahn), pp. 147–182.
- Cabrit (2007) Cabrit S., 2007 Jets from Young Stars: The Need for MHD Collimation and Acceleration Processes, vol. 723, p. 21.
- Cabrit et al. (1999) Cabrit S. et al., 1999 A&A, 343, L61.
- Carrera et al. (2017) Carrera D. et al., 2017 ApJ, 839, 1, 16.
- Casassus et al. (2015) Casassus S. et al., 2015 ApJ, 811, 2, 92.
- Casse and Ferreira (2000) Casse F. and Ferreira J., 2000 A&A, 361, 1178.
- Chambers (2019) Chambers J., 2019 ApJ, 879, 2, 98.
- Coffey et al. (2008) Coffey D. et al., 2008 ApJ, 689, 2, 1112.
- Coffey et al. (2015) Coffey D. et al., 2015 ApJ, 804, 1, 2.
- Combet and Ferreira (2008) Combet C. and Ferreira J., 2008 A&A, 479, 2, 481.
- Combet et al. (2010) Combet C. et al., 2010 A&A, 519, A108.
- Coutens et al. (2019) Coutens A. et al., 2019 A&A, 631, A58.
- Cranmer (2008) Cranmer S. R., 2008 ApJ, 689, 1, 316.
- Cui and Bai (2021) Cui C. and Bai X.-N., 2021 MNRAS, 507, 1, 1106.
- Cunningham et al. (2005) Cunningham A. et al., 2005 ApJ, 631, 2, 1010.
- Davis et al. (2001) Davis C. J. et al., 2001 MNRAS, 326, 2, 524.
- Davis et al. (2011) Davis C. J. et al., 2011 A&A, 528, A3.
- de Valon et al. (2020) de Valon A. et al., 2020 A&A, 634, L12.
- Delamarter et al. (2000) Delamarter G. et al., 2000 ApJ, 530, 2, 923.
- Desch and Turner (2015) Desch S. J. and Turner N. J., 2015 ApJ, 811, 2, 156.
- Dhang et al. (2020) Dhang P. et al., 2020 MNRAS, 494, 4, 4854.
- Dodin et al. (2019) Dodin A. et al., 2019 MNRAS, 482, 4, 5524.
- Dong et al. (2017) Dong R. et al., 2017 ApJ, 836, 2, 201.
- Draine (2011) Draine B. T., 2011 Physics of the Interstellar and Intergalactic Medium.
- Edwards et al. (2006) Edwards S. et al., 2006 ApJ, 646, 1, 319.
- Ellerbroek et al. (2013) Ellerbroek L. E. et al., 2013 A&A, 551, A5.
- Ellerbroek et al. (2014) Ellerbroek L. E. et al., 2014 A&A, 563, A87.
- Ercolano and Owen (2010) Ercolano B. and Owen J. E., 2010 MNRAS, 406, 3, 1553.
- Ercolano and Owen (2016) Ercolano B. and Owen J. E., 2016 MNRAS, 460, 4, 3472.
- Ercolano and Pascucci (2017) Ercolano B. and Pascucci I., 2017 Royal Society Open Science, 4, 4, 170114.
- Ercolano et al. (2017) Ercolano B. et al., 2017 MNRAS, 472, 4, 4117.
- Ercolano et al. (2018) Ercolano B. et al., 2018 MNRAS, 473, 1, L64.
- Erkal et al. (2021a) Erkal J. et al., 2021a A&A, 650, A46.
- Erkal et al. (2021b) Erkal J. et al., 2021b ApJ, 919, 1, 23.
- Espaillat et al. (2014) Espaillat C. et al., 2014 Protostars and Planets VI (H. Beuther, R. S. Klessen, C. P. Dullemond, and T. Henning), p. 497.
- Facchini et al. (2016) Facchini S. et al., 2016 MNRAS, 457, 4, 3593.
- Facchini et al. (2017) Facchini S. et al., 2017 A&A, 605, A16.
- Fang et al. (2018) Fang M. et al., 2018 ApJ, 868, 1, 28.
- Fernandes et al. (2018) Fernandes R. B. et al., 2018 ApJ, 856, 2, 103.
- Ferreira (1997) Ferreira J., 1997 A&A, 319, 340.
- Ferreira and Pelletier (1995) Ferreira J. and Pelletier G., 1995 A&A, 295, 807.
- Ferreira et al. (2000) Ferreira J. et al., 2000 MNRAS, 312, 2, 387.
- Ferreira et al. (2006) Ferreira J. et al., 2006 A&A, 453, 3, 785.
- Fiorellino et al. (2021) Fiorellino E. et al., 2021 A&A, 650, A43.
- Flock et al. (2011) Flock M. et al., 2011 ApJ, 735, 2, 122.
- Flock et al. (2017) Flock M. et al., 2017 ApJ, 835, 2, 230.
- Frank et al. (2014) Frank A. et al., 2014 Protostars and Planets VI (H. Beuther, R. S. Klessen, C. P. Dullemond, and T. Henning), p. 451.
- Franz et al. (2020) Franz R. et al., 2020 A&A, 635, A53.
- Franz et al. (2022) Franz R. et al., 2022 A&A, 657, A69.
- Fu et al. (2014) Fu R. R. et al., 2014 Science, 346, 1089.
- Furlan et al. (2016) Furlan E. et al., 2016 ApJS, 224, 1, 5.
- Galván-Madrid et al. (2014) Galván-Madrid R. et al., 2014 A&A, 570, L9.
- Gangi et al. (2020) Gangi M. et al., 2020 A&A, 643, A32.
- Garcia et al. (2001) Garcia P. J. V. et al., 2001 A&A, 377, 589.
- Garcia Lopez et al. (2010) Garcia Lopez R. et al., 2010 A&A, 511, A5.
- Garcia Lopez et al. (2013) Garcia Lopez R. et al., 2013 A&A, 552, L2.
- Garufi et al. (2020) Garufi A. et al., 2020 A&A, 636, A65.
- Giacalone et al. (2019) Giacalone S. et al., 2019 ApJ, 882, 1, 33.
- Giannini et al. (2019) Giannini T. et al., 2019 A&A, 631, A44.
- Glassgold et al. (2004) Glassgold A. E. et al., 2004 ApJ, 615, 2, 972.
- Gorti et al. (2009) Gorti U. et al., 2009 ApJ, 705, 2, 1237.
- Gorti et al. (2015) Gorti U. et al., 2015 ApJ, 804, 1, 29.
- Gressel (2017) Gressel O., 2017 , vol. 837 of J. Ph. Conf. Series, p. 012008.
- Gressel and Pessah (2015) Gressel O. and Pessah M. E., 2015 ApJ, 810, 1, 59.
- Gressel et al. (2015) Gressel O. et al., 2015 ApJ, 801, 2, 84.
- Gressel et al. (2020) Gressel O. et al., 2020 ApJ, 896, 2, 126.
- Güdel et al. (2008) Güdel M. et al., 2008 A&A, 478, 3, 797.
- Güdel et al. (2018) Güdel M. et al., 2018 A&A, 620, L1.
- Guilet and Ogilvie (2014) Guilet J. and Ogilvie G. I., 2014 MNRAS, 441, 1, 852.
- Haffert et al. (2019) Haffert S. Y. et al., 2019 Nature Astronomy, 3, 749.
- Hallenbeck et al. (2000) Hallenbeck S. L. et al., 2000 ApJ, 535, 1, 247.
- Hansen (2014) Hansen B. M. S., 2014 MNRAS, 440, 4, 3545.
- Hartigan et al. (1994) Hartigan P. et al., 1994 ApJ, 436, 125.
- Hartigan et al. (1995) Hartigan P. et al., 1995 ApJ, 452, 736.
- Hartmann et al. (1994) Hartmann L. et al., 1994 ApJ, 430, L49.
- Hartmann et al. (2016) Hartmann L. et al., 2016 ARA&A, 54, 135.
- Hasegawa et al. (2017) Hasegawa Y. et al., 2017 ApJ, 845, 1, 31.
- Haworth et al. (2018) Haworth T. J. et al., 2018 MNRAS, 481, 1, 452.
- Henriksen and Rayburn (1971) Henriksen R. N. and Rayburn D. R., 1971 MNRAS, 152, 323.
- Herczeg et al. (2011) Herczeg G. J. et al., 2011 A&A, 533, A112.
- Hirose et al. (1997) Hirose S. et al., 1997 PASJ, 49, 193.
- Hoadley et al. (2015) Hoadley K. et al., 2015 ApJ, 812, 1, 41.
- Hodapp and Chini (2014) Hodapp K. W. and Chini R., 2014 ApJ, 794, 2, 169.
- Hollenbach et al. (1994) Hollenbach D. et al., 1994 ApJ, 428, 654.
- Hutchison and Clarke (2021) Hutchison M. A. and Clarke C. J., 2021 MNRAS, 501, 1, 1127.
- Hutchison et al. (2016) Hutchison M. A. et al., 2016 MNRAS, 461, 1, 742.
- Jacquemin-Ide et al. (2019) Jacquemin-Ide J. et al., 2019 MNRAS, 490, 3, 3112.
- Jacquemin-Ide et al. (2021) Jacquemin-Ide J. et al., 2021 A&A, 647, A192.
- Jhan and Lee (2016) Jhan K.-S. and Lee C.-F., 2016 ApJ, 816, 1, 32.
- Keppler et al. (2018) Keppler M. et al., 2018 A&A, 617, A44.
- Keppler et al. (2019) Keppler M. et al., 2019 A&A, 625, A118.
- Kimmig et al. (2020) Kimmig C. N. et al., 2020 A&A, 633, A4.
- Klaassen et al. (2013) Klaassen P. D. et al., 2013 A&A, 555, A73.
- Komaki et al. (2021) Komaki A. et al., 2021 ApJ, 910, 1, 51.
- Königl and Salmeron (2011) Königl A. and Salmeron R., 2011 The Effects of Large-Scale Magnetic Fields on Disk Formation and Evolution, pp. 283–352, Chicago, IL: University of Chicago Press.
- Küffmeier et al. (2017) Küffmeier M. et al., 2017 ApJ, 846, 1, 7.
- Kunitomo et al. (2020) Kunitomo M. et al., 2020 MNRAS, 492, 3, 3849.
- Kwan and Tademaru (1995) Kwan J. and Tademaru E., 1995 ApJ, 454, 382.
- Kwan et al. (2007) Kwan J. et al., 2007 ApJ, 657, 2, 897.
- Latter et al. (2010) Latter H. N. et al., 2010 MNRAS, 406, 2, 848.
- Launhardt et al. (2009) Launhardt R. et al., 2009 A&A, 494, 1, 147.
- Lavalley-Fouquet et al. (2000) Lavalley-Fouquet C. et al., 2000 A&A, 356, L41.
- Lee (2020) Lee C.-F., 2020 A&A Rev., 28, 1, 1.
- Lee et al. (2001) Lee C.-F. et al., 2001 ApJ, 557, 1, 429.
- Lee et al. (2015) Lee C.-F. et al., 2015 ApJ, 805, 2, 186.
- Lee et al. (2017a) Lee C.-F. et al., 2017a Nature Astronomy, 1, 0152.
- Lee et al. (2017b) Lee C.-F. et al., 2017b Nature Astronomy, 1, 0152.
- Lee et al. (2018a) Lee C.-F. et al., 2018a ApJ, 863, 1, 94.
- Lee et al. (2018b) Lee C.-F. et al., 2018b Nature Communications, 9, 4636.
- Lee et al. (2018c) Lee C.-F. et al., 2018c Nature Communications, 9, 4636.
- Lee et al. (2021) Lee C.-F. et al., 2021 ApJ, 907, 2, L41.
- Lesur et al. (2013) Lesur G. et al., 2013 A&A, 550, A61.
- Lesur (2021) Lesur G. R. J., 2021 A&A, 650, A35.
- Liang et al. (2020) Liang L. et al., 2020 ApJ, 900, 1, 15.
- Liffman et al. (2020) Liffman K. et al., 2020 MNRAS, 493, 3, 4022.
- López-Martín et al. (2003) López-Martín L. et al., 2003 A&A, 405, L1.
- López-Vázquez et al. (2019) López-Vázquez J. A. et al., 2019 ApJ, 879, 1, 42.
- López-Vázquez et al. (2020) López-Vázquez J. A. et al., 2020 ApJ, 904, 2, 158.
- Louvet et al. (2016) Louvet F. et al., 2016 A&A, 596, A88.
- Louvet et al. (2018) Louvet F. et al., 2018 A&A, 618, A120.
- Lovelace et al. (1995) Lovelace R. V. E. et al., 1995 MNRAS, 275, 244.
- Lubow et al. (1994a) Lubow S. H. et al., 1994a MNRAS, 267, 2, 235.
- Lubow et al. (1994b) Lubow S. H. et al., 1994b MNRAS, 268, 1010.
- Machida et al. (2011) Machida M. N. et al., 2011 PASJ, 63, 555.
- Macías et al. (2016) Macías E. et al., 2016 ApJ, 829, 1, 1.
- Maloney et al. (1996) Maloney P. R. et al., 1996 ApJ, 466, 561.
- Manara et al. (2014) Manara C. F. et al., 2014 A&A, 568, A18.
- Manara et al. (2017) Manara C. F. et al., 2017 A&A, 604, A127.
- Masson et al. (2016) Masson J. et al., 2016 A&A, 587, A32.
- Matt and Pudritz (2005a) Matt S. and Pudritz R. E., 2005a ApJ, 632, 2, L135.
- Matt and Pudritz (2005b) Matt S. and Pudritz R. E., 2005b ApJ, 632, 2, L135.
- Matt and Pudritz (2008) Matt S. and Pudritz R. E., 2008 ApJ, 678, 2, 1109.
- Maurri et al. (2014) Maurri L. et al., 2014 A&A, 565, A110.
- McGinnis et al. (2018) McGinnis P. et al., 2018 A&A, 620, A87.
- McJunkin et al. (2014) McJunkin M. et al., 2014 ApJ, 780, 2, 150.
- McNally et al. (2017) McNally C. P. et al., 2017 MNRAS, 472, 2, 1565.
- McNally et al. (2018) McNally C. P. et al., 2018 MNRAS, 477, 4, 4596.
- Miyake et al. (2016) Miyake T. et al., 2016 ApJ, 821, 1, 3.
- Mori et al. (2019) Mori S. et al., 2019 ApJ, 872, 1, 98.
- Najita and Bergin (2018) Najita J. R. and Bergin E. A., 2018 ApJ, 864, 2, 168.
- Nakatani et al. (2018a) Nakatani R. et al., 2018a ApJ, 857, 1, 57.
- Nakatani et al. (2018b) Nakatani R. et al., 2018b ApJ, 865, 1, 75.
- Nakatani et al. (2018c) Nakatani R. et al., 2018c ApJ, 865, 1, 75.
- Natta et al. (2014) Natta A. et al., 2014 A&A, 569, A5.
- Nemer et al. (2020) Nemer A. et al., 2020 ApJ, 904, 2, L27.
- Nisini et al. (2015) Nisini B. et al., 2015 ApJ, 801, 2, 121.
- Nisini et al. (2018) Nisini B. et al., 2018 A&A, 609, A87.
- Nolan et al. (2017) Nolan C. A. et al., 2017 MNRAS, 471, 2, 1488.
- Ogihara et al. (2015) Ogihara M. et al., 2015 A&A, 579, A65.
- Ogihara et al. (2017) Ogihara M. et al., 2017 A&A, 608, A74.
- Ogihara et al. (2018a) Ogihara M. et al., 2018a A&A, 615, A63.
- Ogihara et al. (2018b) Ogihara M. et al., 2018b A&A, 612, L5.
- Ogilvie (2012) Ogilvie G. I., 2012 MNRAS, 423, 2, 1318.
- Okuzumi et al. (2014) Okuzumi S. et al., 2014 ApJ, 785, 2, 127.
- Owen et al. (2011) Owen J. E. et al., 2011 MNRAS, 411, 2, 1104.
- Owen et al. (2012) Owen J. E. et al., 2012 MNRAS, 422, 3, 1880.
- Owen et al. (2013) Owen J. E. et al., 2013 MNRAS, 434, 4, 3378.
- Paardekooper et al. (2011) Paardekooper S. J. et al., 2011 MNRAS, 410, 1, 293.
- Padgett et al. (1999) Padgett D. L. et al., 1999 AJ, 117, 3, 1490.
- Panoglou et al. (2012) Panoglou D. et al., 2012 A&A, 538, A2.
- Pascucci et al. (2011) Pascucci I. et al., 2011 ApJ, 736, 1, 13.
- Pascucci et al. (2012) Pascucci I. et al., 2012 ApJ, 751, 2, L42.
- Pascucci et al. (2014) Pascucci I. et al., 2014 ApJ, 795, 1, 1.
- Pascucci et al. (2018) Pascucci I. et al., 2018 Science with a Next Generation Very Large Array, vol. 517 of Astronomical Society of the Pacific Conference Series (E. Murphy), p. 155.
- Pascucci et al. (2020) Pascucci I. et al., 2020 ApJ, 903, 2, 78.
- Pelletier and Pudritz (1992) Pelletier G. and Pudritz R. E., 1992 ApJ, 394, 117.
- Perez-Becker and Chiang (2011) Perez-Becker D. and Chiang E., 2011 ApJ, 735, 1, 8.
- Pesenti et al. (2004) Pesenti N. et al., 2004 A&A, 416, L9.
- Picogna et al. (2019) Picogna G. et al., 2019 MNRAS, 487, 1, 691.
- Podio et al. (2011) Podio L. et al., 2011 A&A, 527, A13.
- Podio et al. (2016) Podio L. et al., 2016 A&A, 593, L4.
- Podio et al. (2021) Podio L. et al., 2021 A&A, 648, A45.
- Pontoppidan et al. (2011) Pontoppidan K. M. et al., 2011 ApJ, 733, 2, 84.
- Pudritz and Matt (2014) Pudritz R. E. and Matt S., 2014 European Physical Journal Web of Conferences, vol. 64 of European Physical Journal Web of Conferences, p. 04001.
- Purser et al. (2018) Purser S. J. D. et al., 2018 MNRAS, 481, 4, 5532.
- Pyo et al. (2003) Pyo T.-S. et al., 2003 ApJ, 590, 1, 340.
- Raga et al. (2001) Raga A. et al., 2001 A&A, 367, 959.
- Ray et al. (2007) Ray T. et al., 2007 Protostars and Planets V (B. Reipurth, D. Jewitt, and K. Keil), p. 231.
- Ricci et al. (2021) Ricci L. et al., 2021 ApJ, 913, 2, 122.
- Rigliaco et al. (2013) Rigliaco E. et al., 2013 ApJ, 772, 1, 60.
- Riols and Lesur (2018) Riols A. and Lesur G., 2018 A&A, 617, A117.
- Riols and Lesur (2019) Riols A. and Lesur G., 2019 A&A, 625, A108.
- Riols et al. (2020) Riols A. et al., 2020 A&A, 639, A95.
- Rodenkirch and Dullemond (2022) Rodenkirch P. J. and Dullemond C. P., 2022 arXiv e-prints, arXiv:2201.01478.
- Rodenkirch et al. (2020) Rodenkirch P. J. et al., 2020 A&A, 633, A21.
- Romanova et al. (2009) Romanova M. M. et al., 2009 MNRAS, 399, 4, 1802.
- Rosenfeld et al. (2014) Rosenfeld K. A. et al., 2014 ApJ, 782, 2, 62.
- Rothstein and Lovelace (2008) Rothstein D. M. and Lovelace R. V. E., 2008 ApJ, 677, 2, 1221.
- Sanchis et al. (2021) Sanchis E. et al., 2021 A&A, 649, A19.
- Schneider et al. (2011) Schneider P. C. et al., 2011 A&A, 530, A123.
- Schneider et al. (2013) Schneider P. C. et al., 2013 A&A, 557, A110.
- Seifried et al. (2013) Seifried D. et al., 2013 MNRAS, 432, 4, 3320.
- Sellek et al. (2020) Sellek A. D. et al., 2020 MNRAS, 498, 2, 2845.
- Shadmehri and Ghoreyshi (2019) Shadmehri M. and Ghoreyshi S. M., 2019 MNRAS, 488, 4, 4623.
- Shang et al. (1998) Shang H. et al., 1998 ApJ, 493, 2, L91.
- Shang et al. (2007) Shang H. et al., 2007 Protostars and Planets V (B. Reipurth, D. Jewitt, and K. Keil), p. 261.
- Shang et al. (2020) Shang H. et al., 2020 ApJ, 905, 2, 116.
- Shu et al. (1994) Shu F. et al., 1994 ApJ, 429, 781.
- Shu et al. (1995) Shu F. H. et al., 1995 ApJ, 455, L155.
- Simon et al. (2016) Simon M. N. et al., 2016 ApJ, 831, 2, 169.
- Sperling et al. (2020a) Sperling T. et al., 2020a A&A, 642, A216.
- Sperling et al. (2020b) Sperling T. et al., 2020b A&A, 642, A216.
- Sperling et al. (2021) Sperling T. et al., 2021 A&A, 650, A173.
- Stapelfeldt et al. (1997) Stapelfeldt K. et al., 1997 Herbig-Haro Flows and the Birth of Stars, vol. 182 (B. Reipurth and C. Bertout), pp. 355–364.
- Strom et al. (1989) Strom K. M. et al., 1989 AJ, 97, 1451.
- Sturm et al. (2013) Sturm B. et al., 2013 A&A, 553, A5.
- Suriano et al. (2017) Suriano S. S. et al., 2017 MNRAS, 468, 4, 3850.
- Suriano et al. (2018) Suriano S. S. et al., 2018 MNRAS, 477, 1, 1239.
- Suriano et al. (2019) Suriano S. S. et al., 2019 MNRAS, 484, 1, 107.
- Suzuki and Inutsuka (2009) Suzuki T. K. and Inutsuka S.-i., 2009 ApJ, 691, 1, L49.
- Suzuki and Inutsuka (2014) Suzuki T. K. and Inutsuka S.-i., 2014 ApJ, 784, 2, 121.
- Suzuki et al. (2010) Suzuki T. K. et al., 2010 ApJ, 718, 2, 1289.
- Suzuki et al. (2016) Suzuki T. K. et al., 2016 A&A, 596, A74.
- Tabone et al. (2017) Tabone B. et al., 2017 A&A, 607, L6.
- Tabone et al. (2018) Tabone B. et al., 2018 A&A, 614, A119.
- Tabone et al. (2020a) Tabone B. et al., 2020a A&A, 640, A82.
- Tabone et al. (2020b) Tabone B. et al., 2020b A&A, 636, A60.
- Tabone et al. (2021) Tabone B. et al., 2021 MNRAS.
- Takahashi and Muto (2018) Takahashi S. Z. and Muto T., 2018 ApJ, 865, 2, 102.
- Takami et al. (2006) Takami M. et al., 2006 ApJ, 641, 1, 357.
- Takami et al. (2007) Takami M. et al., 2007 ApJ, 670, 1, L33.
- Takami et al. (2020) Takami M. et al., 2020 ApJ, 901, 1, 24.
- Takasao et al. (2018) Takasao S. et al., 2018 ApJ, 857, 1, 4.
- Takasao et al. (2019) Takasao S. et al., 2019 ApJ, 878, 1, L10.
- Takeuchi and Okuzumi (2014) Takeuchi T. and Okuzumi S., 2014 ApJ, 797, 2, 132.
- Taki et al. (2021) Taki T. et al., 2021 ApJ, 909, 1, 75.
- Tanaka et al. (2002) Tanaka H. et al., 2002 ApJ, 565, 2, 1257.
- Teague et al. (2019) Teague R. et al., 2019 Nature, 574, 7778, 378.
- Thanathibodee et al. (2020) Thanathibodee T. et al., 2020 ApJ, 892, 2, 81.
- Tielens and Hollenbach (1985) Tielens A. G. G. M. and Hollenbach D., 1985 ApJ, 291, 722.
- Trapman et al. (2020) Trapman L. et al., 2020 A&A, 640, A5.
- Tsukamoto et al. (2015) Tsukamoto Y. et al., 2015 ApJ, 810, 2, L26.
- Turner et al. (2014) Turner N. J. et al., 2014 Protostars and Planets VI (H. Beuther, R. S. Klessen, C. P. Dullemond, and T. Henning), p. 411.
- Ulrich (1976) Ulrich R. K., 1976 ApJ, 210, 377.
- van der Marel et al. (2016a) van der Marel N. et al., 2016a A&A, 585, A58.
- van der Marel et al. (2016b) van der Marel N. et al., 2016b A&A, 592, A126.
- van der Marel et al. (2018) van der Marel N. et al., 2018 ApJ, 854, 2, 177.
- Vinković and Čemeljić (2021) Vinković D. and Čemeljić M., 2021 MNRAS, 500, 1, 506.
- Vlemmings et al. (2019) Vlemmings W. H. T. et al., 2019 A&A, 624, L7.
- Wagner et al. (2018) Wagner K. et al., 2018 ApJ, 863, 1, L8.
- Wang et al. (2021) Wang J. J. et al., 2021 AJ, 161, 3, 148.
- Wang and Goodman (2017a) Wang L. and Goodman J., 2017a ApJ, 847, 1, 11.
- Wang and Goodman (2017b) Wang L. and Goodman J. J., 2017b ApJ, 835, 1, 59.
- Wang et al. (2019) Wang L. et al., 2019 ApJ, 874, 90.
- Ward (1997) Ward W. R., 1997 Icarus, 126, 2, 261.
- Wardle (2007) Wardle M., 2007 Ap&SS, 311, 1-3, 35.
- Wardle and Koenigl (1993) Wardle M. and Koenigl A., 1993 ApJ, 410, 218.
- Weber et al. (2020) Weber M. L. et al., 2020 MNRAS, 496, 1, 223.
- Weiss et al. (2021) Weiss B. P. et al., 2021 Science Advances, 7, 1, eaba5967.
- Whelan et al. (2021) Whelan E. T. et al., 2021 ApJ, 913, 1, 43.
- Wilking et al. (1989) Wilking B. A. et al., 1989 ApJ, 340, 823.
- Wilms et al. (2000) Wilms J. et al., 2000 ApJ, 542, 2, 914.
- Wölfer et al. (2019) Wölfer L. et al., 2019 MNRAS, 490, 4, 5596.
- Xu and Kunz (2021) Xu W. and Kunz M. W., 2021 MNRAS, 502, 4, 4911.
- Xu et al. (2021) Xu Z. et al., 2021 ApJ, 921, 2, 181.
- Yamamoto and Tachibana (2018) Yamamoto D. and Tachibana S., 2018 ACS Earth and Space Chemistry, 2, 8, 778.
- Yang et al. (2012) Yang H. et al., 2012 ApJ, 744, 2, 121.
- Yoshida et al. (2021) Yoshida T. et al., 2021 ApJ, 906, 2, 112.
- Yvart et al. (2016) Yvart W. et al., 2016 A&A, 585, A74.
- Zanni and Ferreira (2013) Zanni C. and Ferreira J., 2013 A&A, 550, A99.
- Zapata et al. (2015) Zapata L. A. et al., 2015 ApJ, 798, 2, 131.
- Zhang et al. (2018) Zhang Y. et al., 2018 ApJ, 864, 1, 76.
- Zhao et al. (2020) Zhao B. et al., 2020 MNRAS, 492, 3, 3375.
- Zhu and Stone (2018) Zhu Z. and Stone J. M., 2018 ApJ, 857, 1, 34.