Designing a thermodynamically stable and intrinsically ductile refractory alloy
Contributing authors: sufyanshk@gmail.com; bsm@iith.ac.in)
Abstract
Developing ductile refractory BCC alloys has remained a challenge. The intrinsic ductility (D) of an alloy is the ratio of surface energy () and unstable stacking fault energy (). Lowering the valence electron concentration has been shown to improve the intrinsic ductility of refractory alloys. However, Re has been widely used to ductilize W, contrary to the low valency criteria suggested in the literature. Here we use density functional theory to calculate the enthalpy of formation, and of Group IV, V, VI elements and their 25 equiatomic binary alloys in BCC crystal structure. We found that positive enthalpy leads to a considerable reduction in compared to composition averaged value, resulting in improved intrinsic ductility. Enthalpy is maximum at the equiatomic concentrations indicating the highly repulsive interaction between the alloy constituents and vicer-versa. We found that the repulsive interaction between the alloy constituents leads to a reduction in , making alloys intrinsically ductile.
Keywords: stacking fault energy, ductility, high entropy alloys, special quasirandom structures
1 Introduction
The continued cost-pressures and ever stringent environmental norms have pushed aerospace and power generation industries to improve the overall efficiency of their jet-engines and gas-turbines [1]. Higher operating temperatures would lead to better thermodynamic efficiency in these propulsion and energy conversion systems [2, 3]. The Ni-based superalloys have ruled this application domain for the past more than six decades [4]. The melting point of the base metal Ni (Tm=1455C) limits the highest operating temperature of these Ni-based superalloys [1, 5]. Alloys based on refractory metals show great potential in this domain due to their high melting-points and their ability to maintain mechanical properties at temperatures higher than the current Ni-based superalloys [5]. Refractory alloys are based on Group IV, V, and VI metals [6, 7, 8]. These elements have very high melting-points (T1800C) and BCC crystal structure which limits their ductility at ambient temperatures.
The lack of deformability at lower temperatures makes refractory alloys difficult to manufacture, which creates a bottleneck in developing them for various applications. Mo has been ductilized by adding 25at.% of Ti/Zr/Hf indicating that alloying with HCP metals should ductilize Mo by reducing the Rice-Thompson parameter[9]. Addition of up to 25at.% of Ta/Re to W has been shown to ductilize it by reducing the overall of the alloy[10]. Re addition in 12.5at.% or 25at.% to W has been shown to decrease the shear resistance of {110}<111> and {112}<111> slip system which in turn improves the ductility of W [11]. Reducing the valence electron concentration (VEC) [6, 12] and reducing the lattice distortion in Nb-based equiatomic BCC alloys has been shown to decrease the Peierls stress which in turn makes alloy deformable[13]. These are few of the refractory alloy ductilizing studies reported in literature. There have been conflicting suggestions about alloying additions to make W deformable. Qian et al. [14] suggests Re addition to W leads to decreased generalized stacking fault energy () and increased ductility, whereas Ta addition has opposite effect. However, in Qian’s work the chemistry of the supercell was W47X (X=Ta or Re), which may not be a true representation of a concenterated alloy. On the contrary, Sheikh et al. [12] suggests alloying with Ti, Zr, Hf, and Re (HCP elements) should ductilize the refractory alloys as it reduces the valence electron concentration (VEC). Similarly, Yang et al.[10] suggests alloying W with Ta or Re should ductilize it by reducing the unstable stacking-fault energy (). None of the previous strategies discuss about the thermodynamic stability of these alloys. This calls for a comprehensive study on the role of various alloying elements on the deformability and thermodynamic stability of refractory alloys.
A general theme in the existing refractory alloy ductilizing studies has been to add low stacking-fault energy (SFE, ) elements to reduce the overall unstable-SFE () of the alloy, suggesting that the Rule-of-Mixtures (ROM) dictates the overall of the alloy. Most of the earlier studies selected alloying elements to get maximum decrease in the overall of the alloy, without considering the thermodynamic stability of the alloy. The of NiFe [15, 16] and CoCrFeNi [17, 18] calculated using first-principles density functional theory (DFT) matches with their respective experimental value. This shows that the can be accurately predicted using DFT. There is a need of a comprehensive study on the effect of alloying elements on the deformability and thermodynamic stability of refractory BCC alloys. Present work addresses these issues using first-principles density functional theory (DFT) simulations. The study gives a strategy to select alloying elements which give maximum ductilizing effect along with thermodynamic stability of the final alloy.
2 Results and Discussion
To better understand the factors affecting the intrinsic ductility in concentrated BCC alloys, refractory equiatomic binary alloys made from Group-IV (Ti, Zr, Hf), Group-V(V, Nb, Ta), Group-VI(Mo, W), and Group-VII(Re) elements are studied. Atomistic modeling based on DFT provides an accurate description of configurational and chemical space. Based on the binary phase diagrams, not all refractory element combination would be stable as a solid solution in BCC crystal structure. As a first step we take only those combinations which are likely to form a stable BCC solid solution. We show that the enthalpy of formation can be a good estimate of the stability of solid solutions (Section 2.1). Here we report for the first time the influence of enthalpy of formation on intrinsic ductility (D) of alloys. The D is a ratio of unstable stacking-fault energy () and surface energy (), which has been widely used to compare the intrinsic ductility of refractory alloys [10, 19, 20, 21]. However, it needs a reliable calculation of the and .
The calculation of solid solutions using DFT, is bound to have errors due to the change in local chemistry while the interface is being sheared and due to the stoichiometry of the shearing interface. The magnitude of this error could alter conclusions, hence an estimate of this error is important while making comparison across alloys. Here we have estimated the maximum error that gets introduced, and discuss ways to minimize it, making our conclusions reliable. The of an alloy is strongly influenced by its pure metal constituents. To better understand how pure metal’s value affect the of the alloy, the of similar slip systems should be taken into consideration. In present study some of the pure metals have HCP crystal structure and the alloys are considered in BCC structure. Therefore, for both the crystal structures, the of equivalent slip system should be considered.
To address these shortcomings which we found in the literature, a DFT-based workflow is developed to calculate lattice parameter (a,c), enthalpy of formation (), unstable stacking-fault energy (), and surface energy () (Figure 1). The workflow is elaborated further in the subsequent sections. The results are shown in the form of heat maps in Figure 2. Additional information can be found in the supplementary file.
2.1 Enthalpy of formation ()
The stability of an alloy (solid solution) is dictated by the Gibbs energy of its constituent phases as,
where is the enthalpy of formation at 0K, is the pressure-volume term, is the configurational entropy, is the vibrational entropy, is the magnetic entropy, is the electronic entropy. The term can be ignored [22]. Therefore the equation becomes,
For an equiatomic binary alloy AB, is calculated with the relation [23],
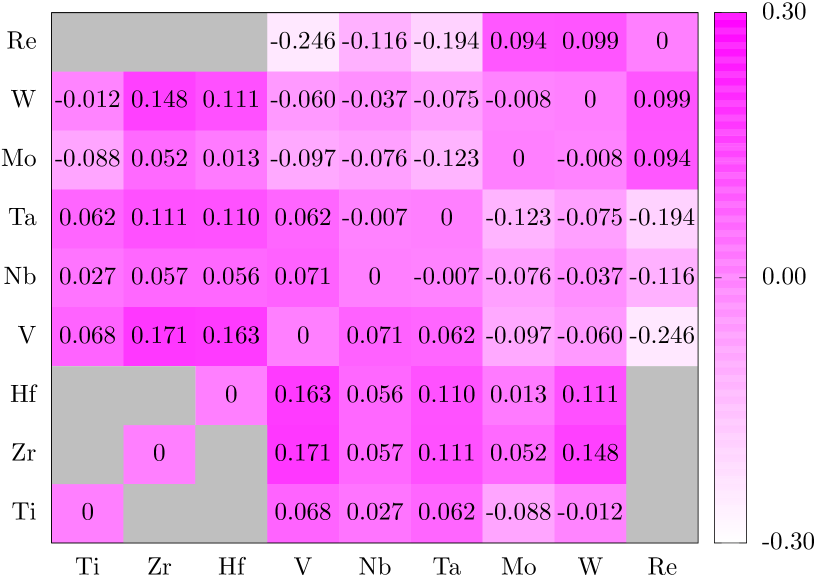
where EAB is the energy per atom of alloy AB in BCC symmetry, EA and EB, are the energy of constituents A and B in their most stable phase. All values are in the units of eV/Atom. The 9 alloying elements form a total of 36 equiatomic binary alloys. Out of these 36 alloys, 6 systems containing both the constituents being HCP, are not considered in the present study. Figure 2(a) shows the enthalpy of formation (, eV/Atom) values in the form of heat map. We have not considered VRe [24], TaRe [25], HfW [26], ZrW [27], VHf [28], VZr [29], having , -0.2456, -0.1942, 0.1114, 0.1477, 0.1631, 0.1710 meV/Atom respectively, for subsequent analysis as they can either form intermetallic (VRe, TaRe) due to very negative or they can segregate (HfW, ZrW, VHf, VZr) due to very positive . The values of alloy considered ranges from -0.1232eV/Atom (TaMo) to 0.0994eV/Atom (WRe).
The value of 0.0994meV/Atom appear very large for a solid solution to be stable. For an equiatomic binary alloy, the T term has value of about 18 meV/Atom at 300K. Since WRe forms a stable solid solution [30], we expect that the other entropic contributions would be sufficiently large (80meV/Atom) to overcome the 0.0994eV/Atom value. Although we take WRe as an extreme case of having the most positive (among the presently considered alloys), depending upon the and values, not all alloys may be stable.
2.2 Unstable stacking-fault energy ()
Within DFT, the is calculated using the relation given below,
where the Efaulted is the energy of supercell having a stacking fault and the Epristine is the energy of pristine supercell. The {110}<111> slip system of BCC metals/alloys has the lowest energy barrier for activation. Therefore, we have chosen the same slip system in present anaysis.
2.2.1 Slip system
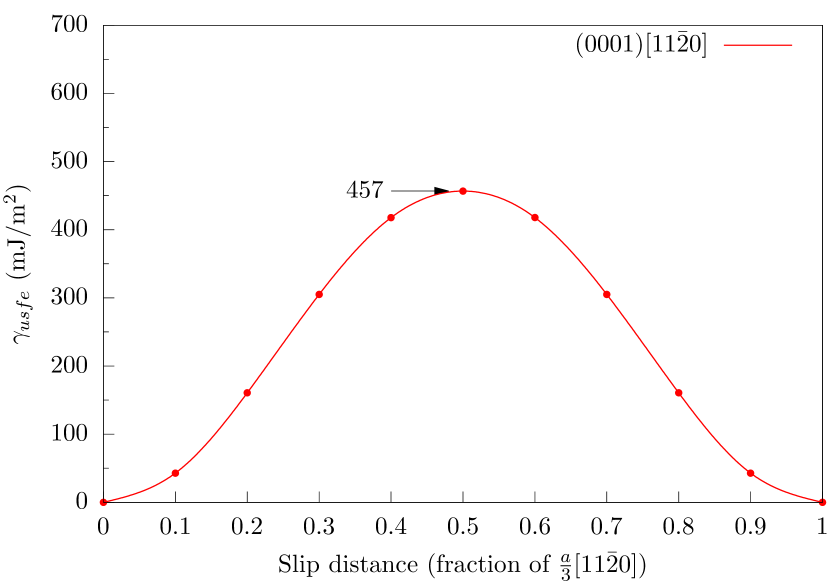
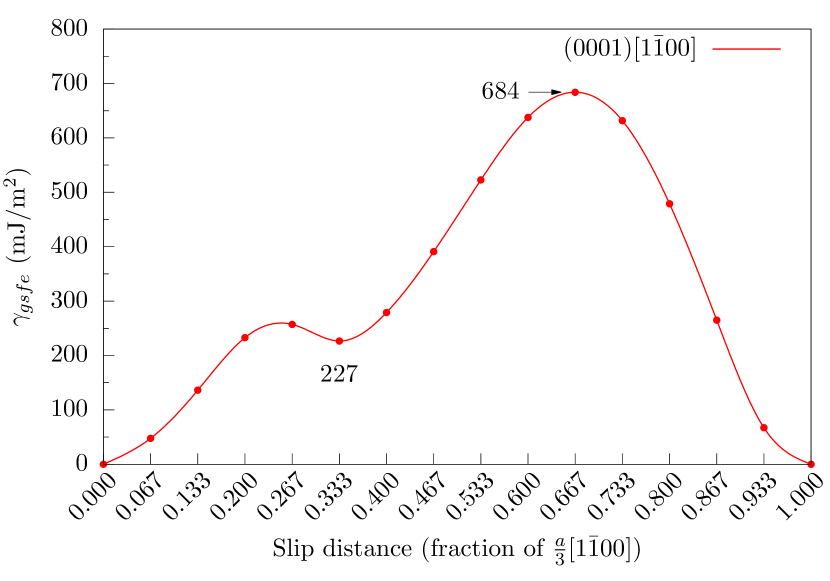
The of an alloy strongly depends on the of its constituent pure metals. In order to understand how the of pure elements affect the of an alloy, comparison of similar similar slip systems should be made. Since some of the pure metal constituents of alloy have HCP crystal structure, the {110}<111> slip system of BCC should be compared with an equivalent slip system in HCP crystal structure. The {0001} slip plane in HCP crystal structure have similar close-packed arrangement of atoms as that in {110} slip plane of BCC crystal structure. The {0001} slip plane SFE curves of Zr are shown in Figure 3(a) for <110> and in Figure 3(c) for <100> slip direction. Figure 3(e) shows the SFE curve of Nb for {110}<111> slip system. From Figures 3(b) and 3(f), it is observed that the atomic arrangements in BCC-{110} and HCP-{0001} slip planes is similar. Therefore, from Figure 3 it is clear that the {110}<111> of BCC crystal structure should be compared with the {0001}<110> of HCP crystal structure.
2.2.2 Shearing interface stoichiometry
Special quasirandom structures (SQS) have been extensively used to predict the SFE of alloys due to their simplicity in capturing the inherent chemical disorder present in the alloys [31]. In present work, the SQS supercell with in-plane dimensions equal to 4 and 3 times of the first nearest neighbor distance of the BCC symmetry are generated (Figure S1), considering the pair, triplet, and quadruplet with cut-off distance equal to the regular BCC unit cell lattice parameter (2nd nearest neighbor distance). The supercell have 10 planes of (110) type giving 9 shearing interfaces as shown in Figure S1. A vacuum of 10Å is added to the supercell to prevent the interactions due to the periodic boundary condition. To calculate the , the atoms in top two planes and bottom two planes are fixed in all directions, whereas, the remaining atoms from the middle six planes are fixed only in slip direction. There are four [111]-type slip directions available for every shearing interface, giving 4 different values. Therefore, the same supercell can gives 36 different values.
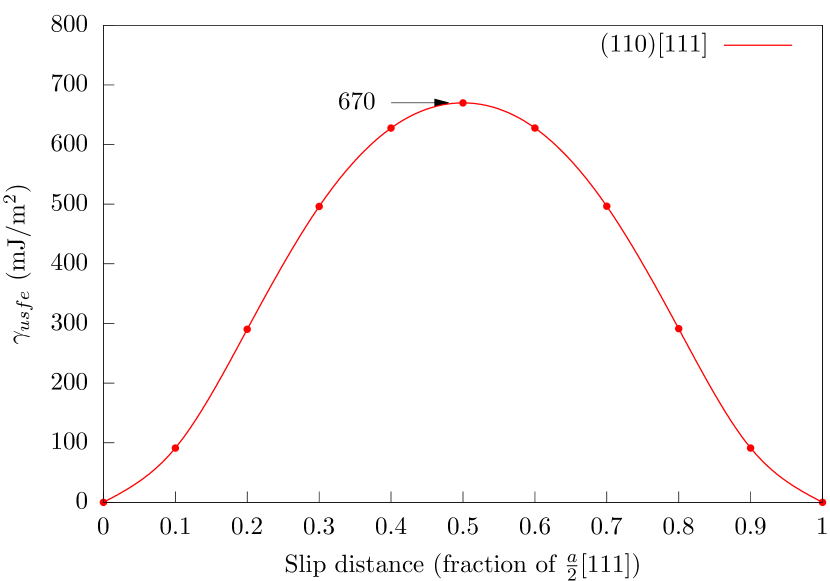
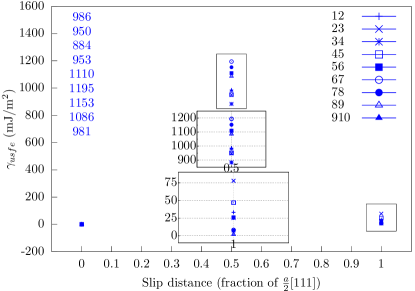
Using the above methodology, we calculated the for (110)[111] slip system of WRe alloy (Figure 4). For any shearing interface the energy change in the pristine and slipped supercell is due to the change in the local bonding environment. Out of the 4 possible , we choose the one with the minimum difference in energy of pristine and sheared slab as shown in Figure S2 and S3. Therefore there are 9 values shown in in Figure 4 instead of 36. As observed from Figure 4, the varies from 906 to 1199 mJ/m2. Similarly the energy difference between pristine and sheared supercell varies from 0.5 to 109 mJ/m2 (lower inset in Figure 4). There are two shearing interfaces in Figure 4 having the same stoichiometry as that of the overall supercell chemistry (WRe). These two shearing interfaces give 1110mJ/m2 and 1086mJ/m2 value. It indicates that the 2nd nearest neighbor also influences the . We have taken 1110mJ/m2 as the value of WRe in present study as this shearing interface was having the lowest energy difference of 1.6mJ/m2 between the pristine and sheared supercell.
Based on the above discussion, one should consider only the equiatomic shearing interface. Since the supercell has shearing interfaces that do not have equiatomic stoichiometry, it is assumed that all possible values of can exist. The strategy in the literature have been to report an average obtained from all shearing interfaces. Such approach does not assure a specific value of error that gets introduced. From WRe results (Figure 4), it clear that stoichiometry strongly affect the . That is because of nearest neighbor bond in the shearing interface. Since the intent is to calculate the for an equiatomic alloy, we choose the value corresponding to equiatomic shearing interface. Among the two interfaces that have same stoichiometry in Figure 4, there is a difference in value due to different set of second nearest neighbors. For the rest of the alloys, the obvious choice of will be from the shearing interface having the same stoichiometry as that of the supercell. We found that the maximum energy difference between the pristine and the sheared supercell is 60mJ/m2. This error is alloy dependent, whereas the lowest error is 0mJ/m2 in NbTa. Such error estimation which could affect the interpretation have not been discussed in the literature.
2.2.3 On the origin of of binary alloys
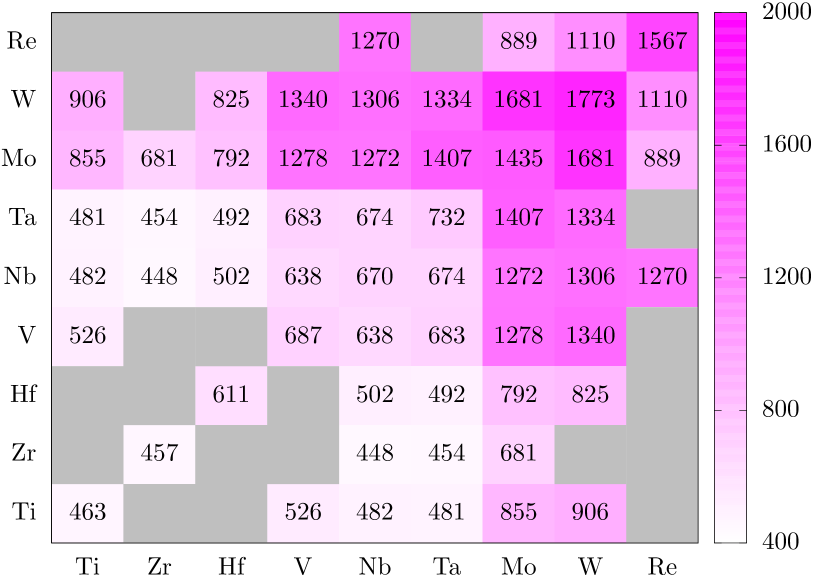
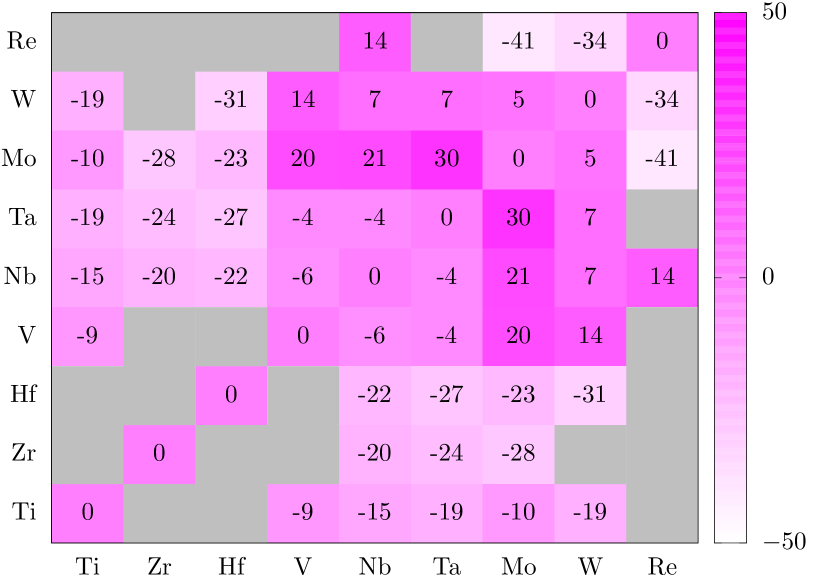
Figure 2(c) shows the calculated using First-principles DFT method, in the form of heat map for pure elements and the alloys under study. The HCP elements have the lowest except Re. For pure metals, the overall trend is of increasing as we move right in the periodic table from Group-IV to Group-VII. W (1773mJ/m3) has the highest whereas Zr (457mJ/m3) has the lowest . For alloys, the DFT-calculated ranges from 454mJ/m2 (TaZr) to 1681mJ/m2 (MoW). Figure 2(d) shows the change in of the alloys from their composition averaged value () as calculated below,
The ranges from -41% (MoRe) to +20% (MoV). As observed from Figures 2(c) and Figure 2(d), the ROM overestimates the for a number of alloys. For example, the DFT-calculated for WRe and MoRe is 1110mJ/m2 and 889mJ/m2 respectively. However the -34% (WRe) and -41% (MoRe) indicates that ROM overestimates the by a large margin and is not a reliable method to get the correct values. This also suggests that the of alloys is dictated by the nature of bonds between the constituent atoms.
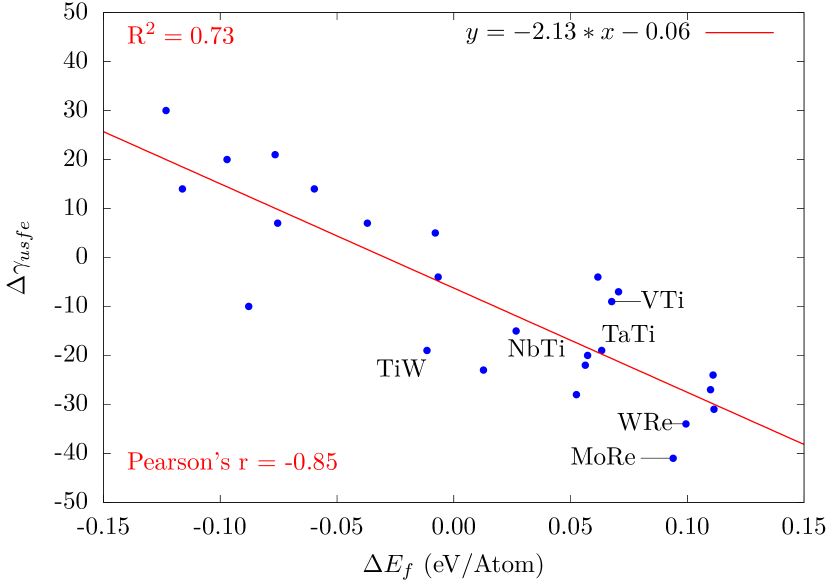
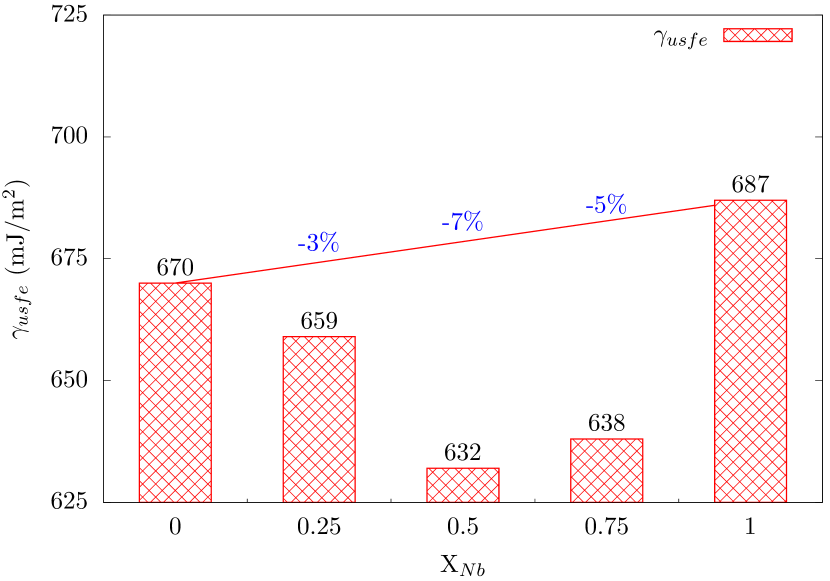
The positive and negative can be due to the repulsive or attractive interaction between the constituent atoms. One of the parameter to assess the nature of interaction is enthalpy of formation (). The of equiatomic alloy captures the attractive (negative ) or repulsive (positive ) interaction between atoms even if the crystal structure of metals that form the alloy are not the same. For example, W and Re have BCC and HCP crystal structure in their pure state, respectively. The of W25-Re75 alloy in BCC crystal structure will have contribution from change in crystal structure of Re from HCP to BCC, apart from the interaction between atoms. In non-equiatomic alloys with different crystal structure of constituents, the does not reflect attractive or repulsive interaction alone, but for alloy with constituent metals in the same crystal structure, of any alloy chemistry will reflect the nature of interaction. Figure 5(a) shows the vs. . A linear fit to the data in Figure 5(a) has a slope of -2.13 with Pearson’s r (correlation parameter) of -0.85. This indicates a strong inverse correlation between with . The is maximum at equiatomic composition as the number of A-B bonds in an AB alloy would be the highest at equiatomic composition. Inverse correlation between and suggests that maximum (positive or negative) would occur at equiatomic composition. Figure 5(b) shows the values for NbxV(1-x) (x [0,0.25,0.75,1]) alloy. The largest occurs at equiatomic concentration (Figure 5(b)). The present analysis shows many possible alloy combinations which can lead to reduced in refractory binary alloys from their average values.
2.3 Surface energy ()
Similar to calculation, the surface energy () is calculated for the interface having equiatomic stoichiometry/formula composition. The equiatomic shearing interface of the supercell is exposed to vacuum of 10Å. The is calculated using the relation given below,
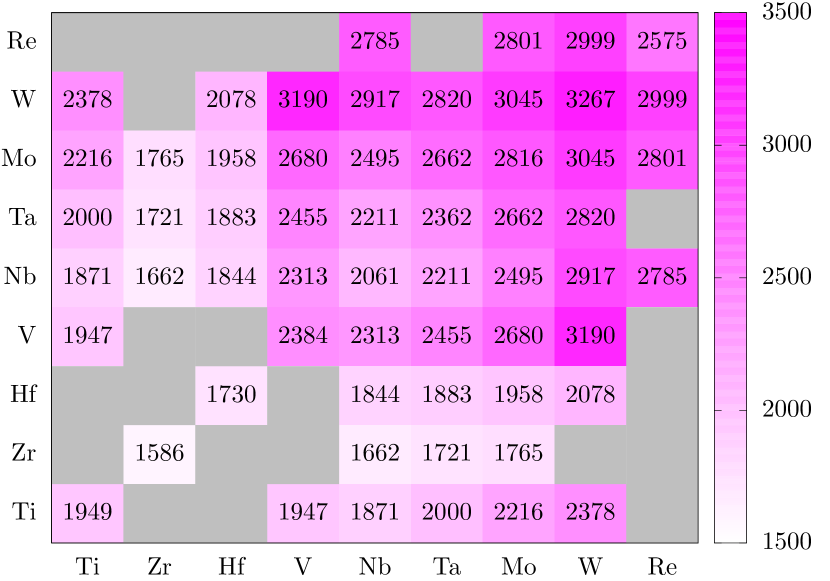
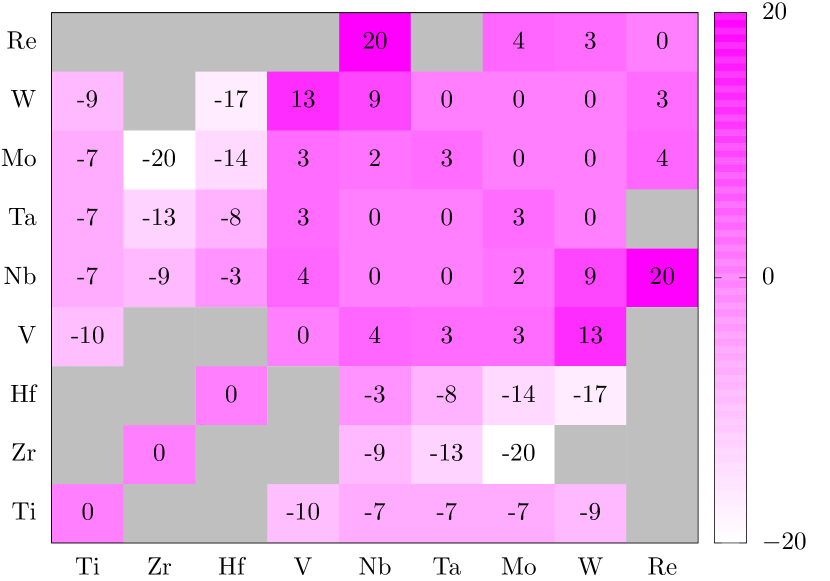
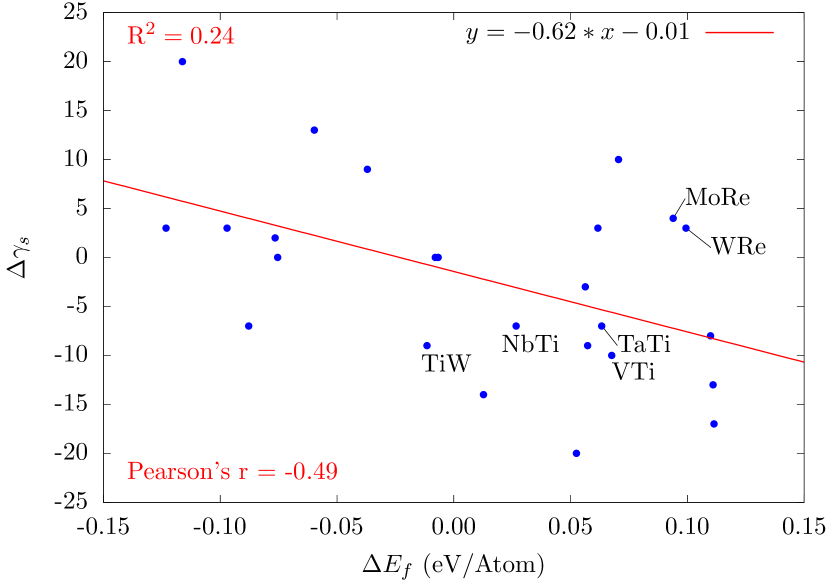
where the Ewith-vacuum is the energy per atom of the supercell with vacuum and Eno-vacuum is the energy per atom of the supercell without vacuum. Figure 2(e) shows the (110) calculated using First-principles DFT method, in the form of heat map for pure elements and the alloys under study. For Ti, Zr, Hf, and Re, the is reported for (0001) plane. The ranges from 3190mJ/m2 (VW) to 1662mJ/m2 (NbZr). Figure 2(f) shows the percentage change in values of the alloys from their composition averaged values (, calculated similar to ). The ranges from -20% (MoZr) to 20% (NbRe). Figure 6(a) shows the vs. the Ef. A linear fit to the data in Figure 6(b) has a slope of -0.62 with Pearson’s r (correlation parameter) of -0.49. This indicates that the does not strongly influences the .
2.4 Ductility parameter (D)
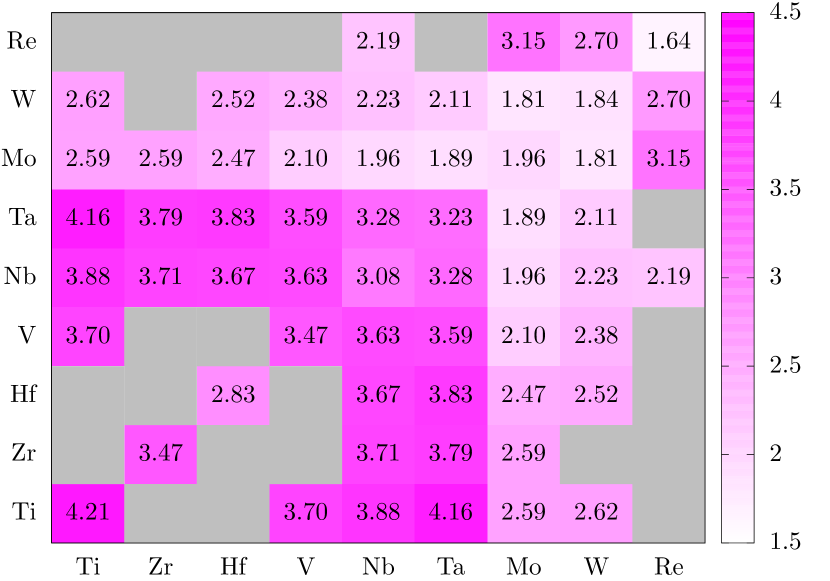
Ductility parameter is defined as the ratio of surface energy to unstable stacking fault energy [32, 33].
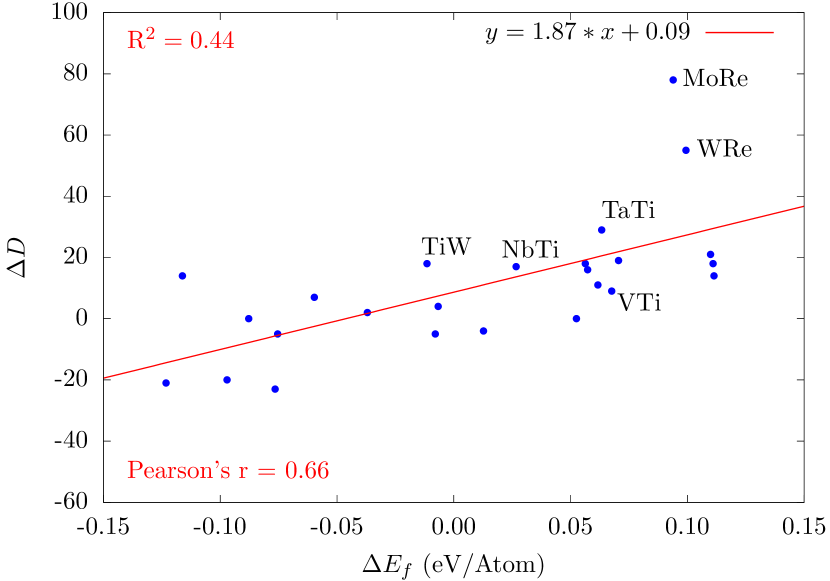
It quantifies the competition between the energy cost of creating a new crack surface and the energy cost of nucleating new dislocations in the stress field of the crack tip. Recent studies have relied on D to assess the intrinsic ductility of refractory alloys [10, 19, 20, 21]. Figure 2(b) shows the D calculated for pure metals and alloys in the form of heat map. The D ranges from 4.16 (TaTi) to 1.81 (MoW). As discussed in Section 2.2 and 2.3, the influences much more strongly than . Similarly, to understand the relation between and percentage change in D (, similar to ) from its composition averaged value, we plot vs. in Figure 6(b). A linear fit to the data in Figure 6(b) has a slope of 1.87 with Pearson’s r (correlation parameter) of 0.66. The does not show any specific relationship with Ef as discussed in Section 2.3. However, the shows a strong relationship with Ef as discussed in Section 2.2. This indicates a positive influence of on controlling the D of refractory binary alloys. There is a positive correlation between and , but it is not as strong as that of , since it has contribution from as well.
The WRe and MoRe has the largest positive as observed from Figure 6(b). Large positive of Re containing binary alloys is because of large negative (Figure 5(a)) primarily due to repulsive nature of bonds between Re-W and R-Mo atoms; and large negative (Figure 6(a)). A positive is observed for alloy containing Group-IV (Ti, Zr, Hf) elements. The positive explains large ductility reported in Al/Nb/Mo-Ta-Ti-Zr-Hf-V alloy, its sub-systems [12, 34, 35, 36, 37, 38] and NbTaTiZrHf [39, 40]. This could be due to large negative , although is not favoring to be positive. The ductility of alloys containing Ti, Zr, and Hf is attributed to the low VEC (<4.5) [12]. However, VEC criteria fails to explain the role of higher valency Re addition in improving ductility of W and Mo [11, 9, 41]. The present analysis shows that the enthalpy of formation of alloys gives a fairly reliable idea about deformability of refractory alloys apart from dictating their thermodynamic stability; which can be used as a criteria to design new alloy chemistries with desired ductility.
3 Equations
Not applicable.
4 Tables
Not applicable.
5 Figures
6 Algorithms, Program codes and Listings
Not applicable.
7 Methods
7.1 Special Quasirandom Structures, Supercell
Special quasirandom structures (SQS) are used to capture chemical disorder in the alloys. SQS are generated using MCSQS code from Alloy Theoretic Automatic Toolkit (ATAT) [42, 43] with pair, triplet, and quadruplet correlations with cut-off distance equal to the BCC unit cell lattice parameter (2nd nearest neighbor distance). The enthalpy of formation () and lattice parameter are calculated with 128 atoms SQS generated using a BCC unit cell repeated four times each in <100> directions. The experimental values of lattice parameters are taken from Ref.[44]. The reported lattice parameters were within 1% deviation of their experimental values. The supercells were visualized using VESTA software [45].
7.2 First-principles calculations
The first-principles density functional theory (DFT) calculations were performed using Vienna Ab-initio Simulation Package (VASP) with plane-wave basis and projector augmented wave (PAW) pseudopotentials [46, 47, 48]. For all calculations, a plane wave kinetic energy cutoff of at least 1.3 times the maximum given in the pseudopotential was used. The electronic exchange-correlation effects were calculated by Perdew-Burke-Erzernhoff generalized gradient approximation (PBE-GGA) [49, 50]. Methfessel-Paxton smearing method with 0.2 eV width was used [51]. Structural relaxation was terminated when the forces on atoms become less than 1 meV/Å. Tetrahedron method with Blöch correction was used for energy calculation [47]. The Brillouin zone sampling was performed using Monkhorst–Pack [52] scheme with automatically generated mesh with k-point spacing of less than Å-1.
8 Conclusion
Here we used DFT to calculate the enthalpy of formation (), unstable stacking-fault energy (), surface energy (), and intrinsic ductility (D) of concentrated alloys. We found that the first nearest neighbor has the strongest influence on the , hence the shearing interface with formula composition has been chosen for calculating the . The calculated had maximum error of 30mJ/m2. The Ef of the equiatomic binary alloys ranges from -0.25eV/Atom to 0.17eV/Atom. The negative Ef indicates attractive nature of the bonding between the constituents and vice-versa. Here we have shown that the positive shall lead to reduced (compared to the composition averaged value) due to the repulsive interaction between the alloy constituents.
Our results suggests that the maximum reduction in could be achieved for alloys having positive . Therefore while selecting the alloying elements one should ensure the positive enthalpy of formation is well compensated by the sufficiently large entropy. Our findings provide an explanation for the addition of low valency Ti, Zr, and Hf as well as high valency Re in improving the ductility of refractory alloys. Our findings also explain the failure of empirical rules for increased ductility of refractory BCC alloys where VEC type criterion can be contradictory to experimental observations (e.g. Re addition in W). Taking the effect of enthalpy of formation on the deformability of concentrated alloys is likely to open new directions in the design of refractory alloys for high temperature applications.
9 Declarations
9.1 Funding
We acknowledge the use of the computing resources at High Performance Computing Environment (HPCE), IIT Madras. This work was supported by Ministry of Education (formerly known as Ministry of Human Resource Development), Government of India (grant numbers: SB20210844MMMHRD008277, SB20210824PHMHRD008488, and SB20210993MMMHRD008470).
9.2 Competing interest
The authors declare no competing interests.
9.3 Ethics approval
Not applicable.
9.4 Consent to participate
Not applicable.
9.5 Consent for publication
Not applicable.
9.6 Availability of data and materials
All the data for the study is in the manuscript and in supplementary file.
9.7 Code availability
Not applicable.
9.8 Authors’ contributions
S.M.S. and S.K.Y. developed the initial hypothesis. S.M.S. performed the calculations and drafted the initial manuscript. S.M.S., S.K.Y., and B.S.M. together discussed the results. S.K.Y. and B.S.M. supervised the project. All authors contributed to the manuscript writing.
References
- [1] Matt Baker “Defining Pathways for Realizing the Revolutionary Potential of High Entropy Alloys: A TMS Accelerator Study”, 2021, pp. 116 DOI: 10.7449/HEApathways
- [2] Jien-Wei Yeh “Recent progress in high-entropy alloys” In Annales de Chimie Science des Matériaux 31.6, 2006, pp. 633–648 DOI: 10.3166/acsm.31.633-648
- [3] B S Murty, J W Yeh, S Ranganathan and P P Bhattacharjee “13 - Applications and future directions” In High-Entropy Alloys (Second Edition) Elsevier, 2019, pp. 247–257 DOI: https://doi.org/10.1016/B978-0-12-816067-1.00013-8
- [4] Roger C Reed “The Superalloys: Fundamentals and Applications (Google eBook)”, 2006, pp. 372 URL: http://books.google.com/books?id=SIUGcd4a-EkC&pgis=1
- [5] Oleg N. Senkov, Daniel B. Miracle, Kevin J. Chaput and Jean-Philippe Couzinie “Development and exploration of refractory high entropy alloys—A review” In Journal of Materials Research 33.19, 2018, pp. 3092–3128 DOI: 10.1557/jmr.2018.153
- [6] Sufyan M. Shaikh, V.S. Hariharan, Satyesh K. Yadav and B.S. Murty “CALPHAD and rule-of-mixtures: A comparative study for refractory high entropy alloys” In Intermetallics 127.May Elsevier Ltd, 2020, pp. 106926 DOI: 10.1016/j.intermet.2020.106926
- [7] D. B. Miracle “High entropy alloys as a bold step forward in alloy development” In Nature Communications 10.1 Springer US, 2019, pp. 1–3 DOI: 10.1038/s41467-019-09700-1
- [8] B S Murty, J W Yeh, S Ranganathan and P P Bhattacharjee “2 - High-entropy alloys: basic concepts” In High-Entropy Alloys (Second Edition) Elsevier, 2019, pp. 13–30 DOI: https://doi.org/10.1016/B978-0-12-816067-1.00002-3
- [9] Clint B. Geller et al. “A computational search for ductilizing additives to Mo” In Scripta Materialia 52.3, 2005, pp. 205–210 DOI: 10.1016/j.scriptamat.2004.09.034
- [10] Chaoming Yang and Liang Qi “Ab initio calculations of ideal strength and lattice instability in W-Ta and W-Re alloys” In Physical Review B 97.1 American Physical Society, 2018, pp. 014107 DOI: 10.1103/PhysRevB.97.014107
- [11] Yu-Hao Li et al. “Transition from ductilizing to hardening in tungsten: The dependence on rhenium distribution” In Acta Materialia 181 Elsevier Ltd, 2019, pp. 110–123 DOI: 10.1016/j.actamat.2019.09.035
- [12] Saad Sheikh et al. “Alloy design for intrinsically ductile refractory high-entropy alloys” In Journal of Applied Physics 120.16, 2016, pp. 164902 DOI: 10.1063/1.4966659
- [13] Y. Y. Zhao et al. “A simplified model connecting lattice distortion with friction stress of Nb-based equiatomic high-entropy alloys” In Materials Research Letters 7.8, 2019, pp. 340–346 DOI: 10.1080/21663831.2019.1610105
- [14] Jing Qian, C.Y. Wu, J.L. Fan and H.R. Gong “Effect of alloying elements on stacking fault energy and ductility of tungsten” In Journal of Alloys and Compounds 737, 2018, pp. 372–376 DOI: 10.1016/j.jallcom.2017.12.042
- [15] Shijun Zhao, Yuri Osetsky, G. Malcolm Stocks and Yanwen Zhang “Local-environment dependence of stacking fault energies in concentrated solid-solution alloys” In npj Computational Materials 5.1 Springer US, 2019, pp. 13 DOI: 10.1038/s41524-019-0150-y
- [16] A. J. Zaddach, C. Niu, C. C. Koch and D. L. Irving “Mechanical Properties and Stacking Fault Energies of NiFeCrCoMn High-Entropy Alloy” In JOM 65.12, 2013, pp. 1780–1789 DOI: 10.1007/s11837-013-0771-4
- [17] M. Beyramali Kivy and M. Asle Zaeem “Generalized stacking fault energies, ductilities, and twinnabilities of CoCrFeNi-based face-centered cubic high entropy alloys” In Scripta Materialia 139 Acta Materialia Inc., 2017, pp. 83–86 DOI: 10.1016/j.scriptamat.2017.06.014
- [18] S.F. Liu et al. “Stacking fault energy of face-centered-cubic high entropy alloys” In Intermetallics 93.August 2017, 2018, pp. 269–273 DOI: 10.1016/j.intermet.2017.10.004
- [19] Yong-Jie Hu, Aditya Sundar, Shigenobu Ogata and Liang Qi “Screening of generalized stacking fault energies, surface energies and intrinsic ductile potency of refractory multicomponent alloys” In Acta Materialia 210 Elsevier Ltd, 2021, pp. 116800 DOI: 10.1016/j.actamat.2021.116800
- [20] O. N. Senkov and D. B. Miracle “Generalization of intrinsic ductile-to-brittle criteria by Pugh and Pettifor for materials with a cubic crystal structure” In Scientific Reports 11.1 Nature Publishing Group UK, 2021, pp. 10–13 DOI: 10.1038/s41598-021-83953-z
- [21] Eleanor Mak, Binglun Yin and W. A. Curtin “A ductility criterion for bcc high entropy alloys” In Journal of the Mechanics and Physics of Solids 152.July 2020 Elsevier Ltd, 2021, pp. 104389 DOI: 10.1016/j.jmps.2021.104389
- [22] A. Walle and G. Ceder “The effect of lattice vibrations on substitutional alloy thermodynamics” In Reviews of Modern Physics 74.1, 2002, pp. 11–45 DOI: 10.1103/RevModPhys.74.11
- [23] Dongwon Shin, Axel Walle, Yi Wang and Zi-Kui Liu “First-principles study of ternary fcc solution phases from special quasirandom structures” In Physical Review B 76.14, 2007, pp. 144204 DOI: 10.1103/PhysRevB.76.144204
- [24] “Re-V Binary Phase Diagram 0-100 at.{\%} V: Datasheet from “PAULING FILE Multinaries Edition – 2012” in SpringerMaterials” Springer-Verlag Berlin Heidelberg {\&} Material Phases Data System (MPDS), Switzerland {\&} National Institute for Materials Science (NIMS), Japan DOI: https://materials.springer.com/isp/phase-diagram/docs/c˙0902814
- [25] “Re-Ta Binary Phase Diagram 0-100 at.{\%} Ta: Datasheet from “PAULING FILE Multinaries Edition – 2012” in SpringerMaterials” Springer-Verlag Berlin Heidelberg {\&} Material Phases Data System (MPDS), Switzerland {\&} National Institute for Materials Science (NIMS), Japan DOI: https://materials.springer.com/isp/phase-diagram/docs/c˙0100260
- [26] “Hf-W Binary Phase Diagram 0-100 at.{\%} W: Datasheet from “PAULING FILE Multinaries Edition – 2012” in SpringerMaterials” Springer-Verlag Berlin Heidelberg {\&} Material Phases Data System (MPDS), Switzerland {\&} National Institute for Materials Science (NIMS), Japan DOI: https://materials.springer.com/isp/phase-diagram/docs/c˙0907545
- [27] “W-Zr Binary Phase Diagram 0-100 at.{\%} Zr: Datasheet from “PAULING FILE Multinaries Edition – 2012” in SpringerMaterials” Springer-Verlag Berlin Heidelberg {\&} Material Phases Data System (MPDS), Switzerland {\&} National Institute for Materials Science (NIMS), Japan DOI: https://materials.springer.com/isp/phase-diagram/docs/c˙0904967
- [28] “Hf-V Binary Phase Diagram 0-100 at.{\%} V: Datasheet from “PAULING FILE Multinaries Edition – 2012” in SpringerMaterials” Springer-Verlag Berlin Heidelberg {\&} Material Phases Data System (MPDS), Switzerland {\&} National Institute for Materials Science (NIMS), Japan DOI: https://materials.springer.com/isp/phase-diagram/docs/c˙0100184
- [29] “V-Zr Binary Phase Diagram 0-100 at.{\%} Zr: Datasheet from “PAULING FILE Multinaries Edition – 2012” in SpringerMaterials” Springer-Verlag Berlin Heidelberg {\&} Material Phases Data System (MPDS), Switzerland {\&} National Institute for Materials Science (NIMS), Japan DOI: https://materials.springer.com/isp/phase-diagram/docs/c˙0905433
- [30] “Re-W Binary Phase Diagram 0-100 at.{\%} W: Datasheet from “PAULING FILE Multinaries Edition – 2012” in SpringerMaterials” Springer-Verlag Berlin Heidelberg {\&} Material Phases Data System (MPDS), Switzerland {\&} National Institute for Materials Science (NIMS), Japan DOI: https://materials.springer.com/isp/phase-diagram/docs/c˙0904355
- [31] Alex Zunger, S.-H. Wei, L. G. Ferreira and James E. Bernard “Special quasirandom structures” In Physical Review Letters 65.3, 1990, pp. 353–356 DOI: 10.1103/PhysRevLett.65.353
- [32] James R. Rice “Dislocation nucleation from a crack tip: An analysis based on the Peierls concept” In Journal of the Mechanics and Physics of Solids 40.2, 1992, pp. 239–271 DOI: 10.1016/S0022-5096(05)80012-2
- [33] U. V. Waghmare, Efthimios Kaxiras, V. V. Bulatov and M. S. Duesbery “Effects of alloying on the ductility of MoSi 2 single crystals from first-principles calculations” In Modelling and Simulation in Materials Science and Engineering 6.4, 1998, pp. 493–506 DOI: 10.1088/0965-0393/6/4/013
- [34] B. Schuh et al. “Thermodynamic instability of a nanocrystalline, single-phase TiZrNbHfTa alloy and its impact on the mechanical properties” In Acta Materialia 142, 2018, pp. 201–212 DOI: 10.1016/j.actamat.2017.09.035
- [35] Chien Chang Juan et al. “Simultaneously increasing the strength and ductility of a refractory high-entropy alloy via grain refining” In Materials Letters 184 Elsevier, 2016, pp. 200–203 DOI: 10.1016/j.matlet.2016.08.060
- [36] S. Y. Chen et al. “Peierls barrier characteristic and anomalous strain hardening provoked by dynamic-strain-aging strengthening in a body-centered-cubic high-entropy alloy” In Materials Research Letters DOI: 10.1080/21663831.2019.1658233
- [37] Luis Casillas-Trujillo et al. “Interstitial carbon in bcc HfNbTiVZr high-entropy alloy from first principles” In Physical Review Materials 4.12 American Physical Society, 2020, pp. 123601 DOI: 10.1103/PhysRevMaterials.4.123601
- [38] V. Soni et al. “Microstructural Design for Improving Ductility of An Initially Brittle Refractory High Entropy Alloy” In Scientific Reports 8.1 Springer US, 2018, pp. 1–10 DOI: 10.1038/s41598-018-27144-3
- [39] O.N. Senkov et al. “Microstructure and room temperature properties of a high-entropy TaNbHfZrTi alloy” In Journal of Alloys and Compounds 509.20, 2011, pp. 6043–6048 DOI: 10.1016/j.jallcom.2011.02.171
- [40] O. N. Senkov and S. L. Semiatin “Microstructure and properties of a refractory high-entropy alloy after cold working” In Journal of Alloys and Compounds 649 Elsevier, 2015, pp. 1110–1123 DOI: 10.1016/j.jallcom.2015.07.209
- [41] Chai Ren et al. “Methods for improving ductility of tungsten - A review” In International Journal of Refractory Metals and Hard Materials 75.January Elsevier, 2018, pp. 170–183 DOI: 10.1016/j.ijrmhm.2018.04.012
- [42] A. Walle, M Asta and G. Ceder “The Alloy Theoretic Automated Toolkit: A User Guide” In Calphad 26.4, 2002, pp. 539–553 DOI: 10.1016/S0364-5916(02)80006-2
- [43] A. Van De Walle et al. “Efficient stochastic generation of special quasirandom structures” In Calphad: Computer Coupling of Phase Diagrams and Thermochemistry 42 Elsevier, 2013, pp. 13–18 DOI: 10.1016/j.calphad.2013.06.006
- [44] Yibin Xu, Masayoshi Yamazaki and Pierre Villars “Inorganic materials database for exploring the nature of material” In Japanese Journal of Applied Physics 50.11 PART 2, 2011 DOI: 10.1143/JJAP.50.11RH02
- [45] Koichi Momma and Fujio Izumi “VESTA 3 for three-dimensional visualization of crystal, volumetric and morphology data” In Journal of Applied Crystallography 44.6, 2011, pp. 1272–1276 DOI: 10.1107/S0021889811038970
- [46] G. Kresse and J. Hafner “Ab initio molecular dynamics for liquid metals” In Physical Review B 47.1, 1993, pp. 558–561 DOI: 10.1103/PhysRevB.47.558
- [47] P. E. Blöchl “Projector augmented-wave method” In Physical Review B 50.24, 1994, pp. 17953–17979 DOI: 10.1103/PhysRevB.50.17953
- [48] G Kresse and J Furthmüller “Efficient iterative schemes for ab initio total-energy calculations using a plane-wave basis set” In Physical Review B 54.16 American Physical Society, 1996, pp. 11169–11186 DOI: 10.1103/PhysRevB.54.11169
- [49] John P. Perdew, Kieron Burke and Matthias Ernzerhof “Generalized gradient approximation made simple” In Physical Review Letters 77.18, 1996, pp. 3865–3868 DOI: 10.1103/PhysRevLett.77.3865
- [50] D. Joubert “From ultrasoft pseudopotentials to the projector augmented-wave method” In Physical Review B - Condensed Matter and Materials Physics 59.3, 1999, pp. 1758–1775 DOI: 10.1103/PhysRevB.59.1758
- [51] M. Methfessel and A. T. Paxton “High-precision sampling for Brillouin-zone integration in metals” In Physical Review B 40.6, 1989, pp. 3616–3621 DOI: 10.1103/PhysRevB.40.3616
- [52] Hendrik J. Monkhorst and James D. Pack “Special points for Brillouin-zone integrations” In Physical Review B 13.12, 1976, pp. 5188–5192 DOI: 10.1103/PhysRevB.13.5188