Runaway electron generation during tokamak start-up
Abstract
Tokamak start-up is characterized by low electron densities and strong electric fields, in order to quickly raise the plasma current and temperature, allowing the plasma to fully ionize and magnetic flux surfaces to form. Such conditions are ideal for the formation of superthermal electrons, which may reduce the efficiency of ohmic heating and prevent the formation of a healthy thermal fusion plasma. This is of particular concern in ITER where engineering limitations put restrictions on the allowable electric fields and limit the prefill densities during start-up. In this study, we present a new 0D burn-through simulation tool called Stream (STart-up Runaway Electron Analysis Model), which self-consistently evolves the plasma density, temperature and electric field, while accounting for the generation and loss of relativistic runaway electrons. After verifying the burn-through model, we investigate conditions under which runaway electrons can form during tokamak start-up as well as their effects on the plasma initiation. We find that Dreicer generation plays a crucial role in determining whether a discharge becomes runaway-dominated or not, and that a large number of runaway electrons could limit the ohmic heating of the plasma, thus preventing successful burn-through or further ramp-up of the plasma current. The runaway generation can be suppressed by raising the density via gas fuelling, but only if done sufficiently early. Otherwise a large runaway seed may have already been built up, which can avalanche even at relatively low electric fields and high densities.
1 Introduction
Operation in future fusion devices will have to ensure a start-up scenario that is reliable, reproducible and low-risk. To achieve that, a solid understanding of all aspects of plasma initiation is needed. If the operating parameters are not chosen with care, plasma initiation can sometimes lead to the formation of a beam of superthermal electrons, sometimes referred to as runaway electrons (Knoepfel & Spong, 1979).
Runaway beam formation is usually a significant concern in tokamak disruptions, when the temperature falls and induces a large electric field that accelerates electrons (Breizman et al., 2019). Runaway acceleration was frequently observed during plasma initiation in the early days of tokamak operation, but has received less attention lately, as most current tokamaks can tune the operational parameters so that runaway electron discharges are avoided. However, it is not clear how the parameters should be chosen for future reactor-scale tokamaks, like ITER. To avoid the risk of failed start-up and corresponding delays or possible damage to in-vessel components caused by runaway electrons, careful investigation of the plasma initiation is needed.
In future tokamaks, the electric field applied for ionization and to ramp up the plasma current is limited due to engineering constraints related to the superconducting magnetic coils. In ITER, the maximum electric field available for plasma breakdown is (Gribov et al., 2007). This is considerably lower than the typical value for the electric field available in current devices (). Tokamak start-up using a weak electric field requires a low prefill gas pressure (de Vries & Gribov, 2019). Due to the low collisionality at low prefill pressure electrons are more prone to accelerate to high energies. Therefore, plasma initiation using low prefill pressure is often associated with discharges dominated by runaway electrons.
Tokamak plasma initiation consists of the breakdown phase, the burn-through phase and the subsequent ramp-up of current. Plasma breakdown by electron avalanche is induced by an applied electric field (Lloyd et al., 1991). In the breakdown phase, losses are dominated by transport along magnetic field lines. After plasma breakdown, the next phase is the burn-through, when ionization continues, as long as the heating (that can consist of both ohmic and auxiliary heating) overcomes losses due to ionization and radiation from the fusion fuel and impurities (Kim et al., 2012).
Burn-through allows the plasma to reach full ionization, high temperature and low resistance. After this phase, the plasma current can be ramped-up efficiently by an applied electric field. As the plasma current increases closed flux-surfaces are formed. Burn-through is successful if the plasma reaches high enough ionization for the heating power provided to be greater than the power lost due to ionization, radiation and transport. The runaway electron content strongly affects the efficiency of the burn-through and the electron density development (de Vries et al., 2020). Runaway electrons may prevent further increase in temperature by impairing the ohmic coupling between the electric field and plasma, and thereby hinder the ramp-up of the plasma current.
Plasma initiation is an inherently dynamic situation in which many plasma parameters (temperature, density, current, electric field etc.) evolve simultaneously and depend on each other, and is often described using a set of coupled, non-linear differential equations. The situation is complicated by the fact that the presence of runaway electrons affects the plasma conductivity and the ionization rate of atoms, hence altering the evolution of the plasma parameters. It is therefore essential that start-up modelling tools include runaway electron physics. However, most of the previously available numerical solvers for the tokamak start-up problem do not include the effect of energetic electrons (Kim et al., 2020). The code currently used for ITER start-up development—the Scenplint code (Belyakov et al., 2003a, b)—does include effects of runaway electrons, but it uses simplified models for the runaway generation rates.
In this paper we investigate the effect of runaway electrons on plasma initiation. In Sec. 2 we present the theoretical model underlying the simulation tool Stream111The source code is available at https://github.com/chalmersplasmatheory/STREAM. (STart-up Runaway Electron Analysis Model) that includes the essential physical processes necessary for investigating start-up scenarios. Stream computes the runaway electron generation self-consistently with the plasma density, temperature, and ion charge-state evolution, as well as the electric field evolution, models for coupling to the conducting structures in the wall, and transport along magnetic field lines. In Sec. 3 we show that the burn-through model in Stream is in excellent agreement with the predictions of Dyon (Kim et al., 2012), both for ITER and JET parameters, when runaway electrons are not considered. In Sec. 4 we demonstrate the effect of runaway electrons on ITER burn-through scenarios. Finally, in Sec. 5 we summarize our conclusions.
2 Burn-through model
During the burn-through and ramp-up phases of tokamak start-up the applied electric field is responsible for driving an ohmic plasma current and thereby heating the plasma. As the temperature evolves, the resistivity changes, which impacts the plasma current. The atoms in the plasma chamber are initially primarily neutrals, but as the burn-through proceeds, they rapidly ionize and contribute to radiation loss processes, significantly affecting the temperature evolution. Superthermal electrons can be accelerated during many stages of the start-up, and their generation depends sensitively on background plasma parameters such as the electric field strength, electron temperature and density.
Building on the self-consistent disruption simulation tool Dream (Hoppe et al., 2021), a new tool Stream has been developed. The new tool introduces some physics essential to tokamak start-up which is not included in Dream, and implements a 0D plasma model similar to the Dyon code (Kim et al., 2012). Specifically, Stream evolves the quantities listed in Table 1, including the temperatures of electrons and an arbitrary number of ion species, the thermal-, runaway electron and ion charge state number densities, as well as the parallel electric field and the plasma current through the ohmic and runaway electron current densities. In the following section we describe the main elements of the model implemented in Stream.
| Quantity | Description |
|---|---|
| Parallel electric field in plasma | |
| Current in conducting structures surrounding the plasma | |
| Ohmic current density | |
| Runaway electron current density | |
| Electron density | |
| Density of ion species , charge state ( is neutral) | |
| Runaway electron density | |
| Electron temperature | |
| Ion temperature | |
| Voltage in conducting structures surrounding the plasma |
2.1 Ions and neutrals
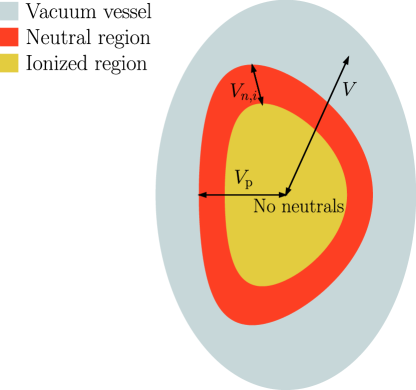
Stream allows for an arbitrary number of ion species to be considered in the simulation and evolves the density of each charge state separately. The fact that the ionization mean-free path of neutrals decreases as the plasma develops, so that neutrals can be screened out of the plasma core, is accounted for by using the two-volume model introduced by Lloyd et al. (1996). In the two-volume model, illustrated in figure 1, the plasma is assumed to occupy a volume , with neutrals of species only being able to penetrate a sub-volume of the plasma. In addition, neutrals are assumed to be homogeneously spread out in the volume consisting of and region outside of the plasma. This means that the total volume occupied by the neutrals of species is , where the neutral volume coefficient is given by
| (1) |
It is only the neutrals within the plasma which contribute to atomic processes.
The geometry of the plasma is specified using an analytic magnetic field model described in appendix A of Hoppe et al. (2021). The model includes the effects of elongation and triangularity on the plasma. From the shaping profiles prescribed, the plasma volume is computed numerically by
| (2) |
where is the (possibly time-evolving) plasma minor radius and
| (3) |
is the spatial Jacobian, is the minor radius coordinate and and are the toroidal and poloidal angles, respectively.
The volume occupied by the neutrals of species is determined from a formula accounting for the plasma elongation and triangularity by subtracting the ionization mean-free path for species from the plasma radius, so that
| (4) |
The ionization mean-free path for neutrals of species is determined by (Lloyd et al., 1996)
| (5) |
with the thermal ion speed, and the temperature and mass respectively for species , the electron density and the rate at which neutrals of species are ionized. The ionization rate is taken from the Atomic Data and Analysis Structure (ADAS) (Summers, 2004).
2.1.1 Particle balance
The density of ions of species in charge state evolves through ionization, recombination and charge exchange processes according to
| (6) | ||||
Here, is the rate of ionization of species from charge state to and the rate of recombination of species from charge state to 222With this notation, ., both of which are taken from ADAS. The total volume occupied by ions of species in charge state is given by
| (7) |
while the volume inside the plasma occupied by ions of species and charge state is
| (8) |
The interaction term , for charge exchange with neutrals of the main ion species (denoted with a star) and an impurity ion, is
| (9) |
with denoting the charge exchange rate, which is also taken from ADAS.
The external particle source/sink models the influx of neutrals from the wall, as well as the outflux of ions due to transport:
| (10) |
where is the confinement time for species . The neutral influx is generally given by
| (11) |
The sputter yield for species due to the bombardment of incident species is prescribed by the user. The value of depends on the underlying physical mechanism. The sputtering can be due to chemical sputtering (e.g. in the case of carbon wall (Kim et al., 2012)), in which case is approximately constant with a value based on plasma surface experiment data, or physical sputtering, when depends on the incident ion energy (i.e. ITER wall) (Kim et al., 2013).
The number of free electrons in the plasma is constrained via quasi-neutrality to
| (12) |
where denotes the net charge number of ion species in charge state , i.e. .
2.1.2 Particle confinement
The confinement time varies greatly during start-up and is determined by different mechanisms during different phases of the start-up. In the early stages, before closed flux surfaces have formed, the confinement is set by transport along magnetic field lines to the wall. With an effective connection length , the thermal particle confinement time can be estimated as (Kim et al., 2012)
| (13) |
where is the main ion sound speed. It was shown by Kim et al. (2012) that the same confinement time can also be used for impurities when they are trace.
At low plasma currents, the effective connection length will depend on the magnitude of stray magnetic fields. As the plasma current increases and gradually exceeds the eddy currents in surrounding conducting structures, the connection length increases and approaches infinity as closed flux surfaces form. We therefore model the effective connection length as in Dyon (Mineev et al., 2014; Kim et al., 2020):
| (14) |
where is the toroidal magnetic field strength, the total plasma current and denotes the plasma current where closed flux surfaces form and the effect of stray magnetic fields greatly reduces. The stray field is composed of the vertical magnetic field and a component resulting from eddy currents in conducting structures surrounding the plasma:
| (15) |
where is the permeability of free space and denotes the distance between the centre of the plasma and the conducting structure.
During later stages of the discharge, the thermal particle confinement is expected to be dominated by turbulent transport. We can therefore estimate the confinement time during the later stages using the Bohm scaling
| (16) |
where the Bohm diffusion coefficient . To allow the confinement time to smoothly transition from equation (13) to (16) during the start-up, we let the total confinement time satisfy
| (17) |
2.2 Heat
The temperature is evolved separately for each plasma species. The bulk electron temperature is related to the electron thermal energy density , and the thermal energy density is in turn evolved according to
| (18) |
The first term represents the ohmic heating provided by the electric field, and the second term represents energy losses via inelastic atomic processes with
| (19) |
where is the radiated power by line radiation, by recombination radiation and bremsstrahlung, and the other terms represent the change in potential energy due to excitation and recombination, with the same rate coefficients as in equation (6). Note that and vanish for , while vanishes for . The ionization threshold is retrieved from the NIST database (Kramida et al., 2020) while the other rate coefficients are taken from ADAS. The collisional heat transfer , which appears in the term for heat exchange with ions in equation (18), is generally given for two arbitrary plasma species and by
| (20) |
with the weighted charge . Finally, the electron confinement time is taken to be the same as that of the main ions, given in equation (17), due to the requirement of ambipolarity. The Coulomb logarithms are modelled using (Wesson, 1997)
| (21a) | ||||
| (21b) | ||||
for electron-ion and ion-ion collisions, respectively. The thermal energy density for each ion species evolves according to
| (22) |
where is the temperature of the main species neutrals, is given by equation (17), and the sum in the first term runs over all particle species, including electrons.
2.3 Electric field
The toroidal electric field inside the plasma depends on the externally applied loop voltage as well as the time rate of change of the plasma current. If the plasma is surrounded by conducting structures, such as a metallic wall, the plasma will be inductively coupled to these structures and the electric field and current dynamics will be correspondingly affected. In Stream, we use the same model for the electric field and current dynamics as in Dyon (Kim et al., 2012), described by one circuit equation for the plasma and one for the conducting structure surrounding it:
| (23a) | ||||
| (23b) | ||||
where is the externally applied loop voltage, is the tokamak major radius, the parallel electric field inside the plasma, the total plasma current, the current in the conducting structure and is the loop voltage in the conducting structure. The inductances (plasma inductance), (wall inductance) and (plasma-wall mutual inductance), and the wall resistance , are free parameters in the model.
Due to Stream’s heritage from Dream, the total plasma current is obtained from the total current density in the system by multiplying with the plasma cross-sectional area. An important difference between Stream and Dyon is that in Stream the current density in turn consists of an ohmic component , where is the conductivity of the plasma as determined by Redl et al. (2021), and a runaway electron component , with the elementary charge, the speed of light, and the runaway electron density. The calculation of the runaway electron density is described in detail in section 2.4.
2.4 Runaway electrons
Electrons are said to “run away” when the collisional friction acting on them is weaker than other accelerating forces. In most cases, the accelerating force is an electric field, and in order for it to provide net acceleration to electrons it must exceed the Connor-Hastie threshold (Connor & Hastie, 1975)
| (24) |
where is the vacuum permittivity and the electron rest mass. Above this threshold, all electrons with relativistic momentum will be freely accelerated and run away. Electrons can find themselves above , in the so-called runaway region, in a number of ways. For example, they can enter this region in momentum space through the collisionally diffusive leak from the thermal population at a steady rate—the so-called Dreicer generation (Dreicer, 1959), that is exponentially sensitive to the electric field normalized to the Dreicer field
| (25) |
When , the electric field acceleration exceeds the collisional friction for all electrons, leading to slide-away and a distribution that is far from thermal. Slide-away can also occur at lower values of since the Dreicer generation mechanism will gradually drain the thermal bulk of particles and pull the electrons into the runaway region.
Existing runaway electrons can also create new ones through close collisions with thermal electrons (Jayakumar et al., 1993). This leads to an exponential growth of the number of runaway electrons—an avalanche. The avalanche mechanism has caused much concern for the potentially highly aggressive growth of the number of runaway electrons during tokamak disruptions (Boozer, 2015; Breizman et al., 2019), which is seen as almost inevitable in future reactors due to the presence of additional primary sources of runaway electrons. The first of these, labelled the “hot-tail” mechanism, occurs during the thermal quench of a disruption as the fastest electrons of the original hot thermal distribution take longer to slow down. They may therefore be accelerated by the electric field which is induced as the plasma current drops due to the increased resistivity, before they have time to thermalize. During tritium operation, energetic electrons resulting from tritium decay and Compton scattering of photons originating from the activated wall are predicted to also provide a significant seed electron population to drive the avalanche multiplication (Martín-Solís et al., 2017; Fülöp et al., 2020; Vallhagen et al., 2020).
During tokamak start-up, the Dreicer and avalanche mechanisms are expected to dominate the generation of runaway electrons, while the other generation mechanisms do not contribute significantly. Hot-tail generation is only expected to occur in cooling plasmas, and is not relevant to the conditions of the initiating plasma. Tritium decay and Compton scattering sources of runaway electrons are typically much lower than Dreicer generation due to the large normalized electric field and low electron densities that are typical during plasma initiation.
2.4.1 Runaway electron model
Runaway electrons primarily influence the plasma evolution during start-up by contributing a relativistic current component to the plasma current. Since the distribution of runaways is usually strongly beamed along the magnetic field lines, with speeds close to the speed of light, the runaways contribute a current density . This current density will in turn affect the evolution of the loop voltage in equation (23) and, by extension, the ohmic current and heating.
The runaway electron density is evolved according to
| (26) |
where is the rate at which electrons are generated by the Dreicer mechanism (Dreicer, 1959), is the avalanche growth rate by which runaway electrons exponentially multiply (Rosenbluth & Putvinski, 1997), and is the runaway electron confinement time. The Dreicer generation rate is evaluated using the neural network developed by Hesslow et al. (2019b), while the avalanche growth rate is given by the semi-analytical formula (Hesslow et al., 2019a)
| (27) |
where is the total density of electrons (bound and free), is a generalized Coulomb logarithm evaluated at relativistic energies, and and are the normalized slowing-down and deflection frequencies as defined by Hesslow et al. (2018b). The effective critical electric field is calculated as described in appendix C.2 of (Hoppe et al., 2021), and takes into account the effect of bremsstrahlung and synchrotron radiation based on the approach of Hesslow et al. (2018a). In partially ionized plasmas, both the Dreicer generation rate and the avalanche growth rate depend on the extent to which fast electrons can penetrate the bound electron cloud around the impurity ion. This effect of partial screening is taken into account in both the neural network for Dreicer generation and in equation (27) for the avalanche growth rate.
Using state-of-the-art models for the effect of partial screening is the main difference between the runaway generation models used in the Scenplint code and Stream. As shown by Hesslow et al. (2019b) these effects can lead to orders of magnitude differences in the Dreicer generation rate, in plasmas containing partially ionized atoms. Also, the generalized expression for the avalanche growth rate has been shown to lead to large differences in the final runaway current, compared to previously used expressions (e.g. in Martín-Solís et al. (2017)), as demonstrated in Hesslow et al. (2019a); Vallhagen et al. (2020).
As for ions, the runaway electron confinement time varies significantly during start-up (Kavin et al., 2017). In the early stages, before flux surfaces have formed, the transport will be dominated by parallel transport, and the distance traversed by a runaway before leaving the plasma is the same as for the thermal particles, i.e. the connection length given in equation (14). Starting from the equation of motion for the electron,
| (28) |
where is the electron momentum, and letting be positive in the co-current direction, we can estimate its confinement time. By assuming to be constant in time, integrating equation (28) and solving for the electron speed , we obtain
| (29) |
This can in turn be integrated over the time period it takes for the electron to travel a distance , to obtain the relation
| (30) |
which can be solved for the runaway electron confinement time
| (31) |
After flux surfaces have formed, the confinement time is rather set by the rate at which the runaways gain energy and drift out of the plasma. Assuming that a runaway electron drifts out of the plasma when reaching a relativistic energy , and assuming the electric field to be roughly constant during acceleration, the confinement time in this second phase can be related to the runaway electron energy via
| (32) |
The maximum energy for an electron was estimated by Knoepfel & Spong (1979) as
| (33) |
where and are the plasma minor and major radii respectively. The runaway electron confinement time due to drifts can therefore be taken as
| (34) |
Since the transition from the first to the second stage is determined by when closed flux surfaces form, which depends on the development of the plasma current, we interpolate between the confinement times (31) and (34) using
| (35) |
with the current at which flux surfaces form. is assumed to be approximately in ITER (Kim et al., 2020).
3 Verification of the burn-through model
The plasma initiation model presented in sec. 2 involves coupled equations, most of which are non-trivial in their numerical implementation. To verify that the implementation of Stream is correct, we must compare its predictions to previously established results. The runaway electron generation models included in Stream are inherited from Dream, for which extensive benchmarks to previous results have been made (some of which are documented in (Hoppe et al., 2021)).
For Stream, the crucial part to verify is the burn-through model, excluding the runaway electron physics. Such models have been implemented in several codes before, including in the Dyon (Kim et al., 2012), Scenplint (Belyakov et al., 2003a, b) and Bkd0 (Granucci et al., 2015) codes, which were carefully benchmarked against each other recently in (Kim et al., 2020). In this section we will reproduce the results of the two burn-through scenarios considered in (Kim et al., 2020) with Stream. In the first scenario, a pure hydrogen plasma start-up in an ITER-like setting is considered, assuming a perfectly insulating vacuum vessel. In the second scenario, a more advanced JET case is studied, involving multiple impurity species and a conducting structure which affects the current and electric field evolution.
Although the burn-through models in Stream and Dyon are similar regarding all the important physics components: the particle and heat balance, the electrical circuit model, the neutral screening, and the impurity charge-state evolution, there are slight differences. While Dyon assumes all the ions to have the same temperature, in Stream we allow for different ion species to have different temperatures and only assume that the temperature is the same in every charge state. Furthermore, there are also differences in how the conductivity is calculated as described in sec. 2.3. However, as we shall see, in spite of these subtle differences, the agreement between the results of the two codes is very good.
3.1 ITER scenario
We start by considering an idealized ITER ohmic burn-through scenario with constant input parameters, similar to the one considered in Sec. 2 of Kim et al. (2020). We assume a circular plasma and a constant loop voltage corresponding to . The prefilled fuel gas pressure is , corresponding to an initial hydrogen density of . The gas consists of pure hydrogen (no impurities) at (room temperature) in the beginning of the simulation. The plasma inductance is calculated from , where is assumed for the internal inductance and we neglect all currents in surrounding passive structures. The wall recycling coefficient for hydrogen is set equal to one (no external gas fuelling). The input parameters are summarized in Table 2. Note that while hydrogen is used as the main ion species, Stream has been temporarily modified in these simulations to use charge-exchange rates for deuterium, which should correspond more closely to the charge-exchange rates used for this scenario in (Kim et al., 2020).
| Parameter | Name | ITER | JET |
|---|---|---|---|
| Prefill gas pressure | |||
| Initial ionization degree | |||
| Toroidal magnetic field | |||
| Plasma major radius | |||
| Plasma minor radius | See fig. 10a in Kim et al. (2020) | ||
| Passive structure-distance | — | ||
| Vessel volume | |||
| Initial electron temperature | |||
| Initial ion temperature | |||
| Initial plasma current | |||
| Loop voltage | See fig. 10b in Kim et al. (2020) | ||
| Plasma inductance | |||
| Wall inductance | — | ||
| Mutual inductance | — | ||
| Wall resistance | — | ||
| First recycling coefficient | — | 1.1 | |
| Second recycling coefficient | — | 0.05 | |
| Third recycling coefficient | — | 0.1 | |
| Initial fraction of oxygen | — | 0.001 | |
| Initial fraction of carbon | — | 0 |
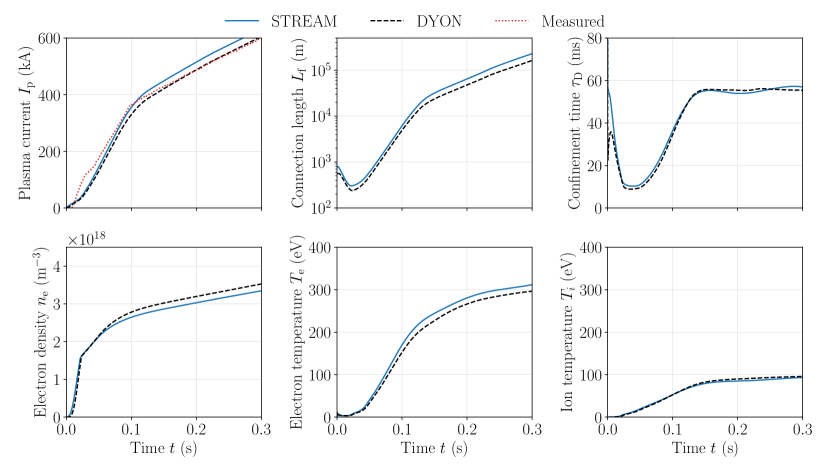
Figure 2 shows the time-evolution of the plasma current, effective connection length, particle confinement time, electron density, electron temperature, and ion temperature. After modifying Stream to use the ADAS charge-exchange rates for deuterium also for hydrogen, as was done in (Kim et al., 2020), good agreement was found between the simulation results of Dyon and Stream. Only a slightly delayed burn-through is seen in Stream which leads to a delayed rise of the plasma current, and a slightly faster heating rate for both ions and electrons in Stream. These small differences observed could potentially be explained by the different conductivities used (the Stream simulations use the conductivity of Redl et al. (2021) while the Dyon simulations use the Spitzer conductivity), the use of different line radiation and charge exchange rates (the Stream simulations use ADAS rates while the Dyon simulations use analytical fits), and differences in the electron-ion equilibration term (20) (the Dyon simulations use a constant value for the Coulomb logarithm).
3.2 JET scenario
Next, we consider an advanced burn-through scenario of a deuterium plasma with multiple impurity species and a conducting structure near the plasma. As in (Kim et al., 2020), we use parameters from a JET discharge with carbon wall, which was used to validate the Dyon code. In this case, both the breakdown region and the loop voltage are time-dependent, and the data is given in Figure 10 of (Kim et al., 2020). The plasma minor radius is inferred from the plasma volume given in Fig. 10a. The eddy current is calculated with the two-rings circuit model in equation (23). To obtain agreement it was necessary to modify the effective connection length according to from equation (14) in Stream to use the exact same model as was used in (Kim et al., 2020).
In the simulation, a time-evolving deuterium recycling coefficient is used. The coefficient is given generally by
| (36) |
and in this scenario we set , and .
Figure 3 shows the time-evolution of the plasma current, effective connection length, particle confinement time, electron density, electron temperature, and ion temperature. Also in this case Stream and Dyon results agree well, with a slight deviation in the effective connection length , and at early times in the deuterium confinement time , possibly explaining differences between the two codes. The differences in and could in turn possibly be explained by differences in the evolution of the plasma volume and the plasma major radius. The plasma volume was determined from figure 10a of (Kim et al., 2020), while the plasma major radius was assumed constant. The plasma volume plays an important role for the density and temperature evolution, while the plasma major radius affects the value of the toroidal magnetic field used in the simulation, all of which in turn affect the effective connection length and the particle confinement time.
4 ITER burn-through simulations with runaway electrons
The role of runaway electrons during tokamak start-up has been studied both experimentally (Esposito et al., 1996; Yoshino & Seki, 1997; Esposito et al., 2003; de Vries et al., 2020) and theoretically (Sharma & Jayakumar, 1988; de Vries & Gribov, 2019), and it is well known that the presence of superthermal or runaway electrons during start-up can lead to burn-through failing or the creation of a relativistic electron beam. Here, we use “superthermal” to mean electrons which are moving at speeds much faster than the thermal speed, but not undergoing free acceleration. By “runaway electrons”, on the other hand, we mean electrons which are sufficiently fast for the electric field acceleration to dominate collisional slowing-down, and which therefore accelerate freely. To study the dynamics of the former, one generally needs to solve a kinetic equation which accounts for the momentum dynamics of the electrons, while the latter can often be studied using conceptually simpler fluid models (see e.g. Vallhagen et al. (2020)). In this paper, we will only consider runaway electron discharges and leave considerations concerning superthermal discharges for a future publication.
In this section we consider runaway electron generation in an ITER ohmic first-plasma scenario. We investigate conditions for the appearance of runaway electrons in the plasma as well as their effect on the plasma start-up.
4.1 ITER first-plasma scenario
We begin by considering runaway generation in an ITER ohmic first plasma scenario, with the parameters given in the first column of Table 2 and a deuterium-deuterium recycling coefficient . Note, these parameters were chosen for benchmarking purposes by Kim et al. (2020), and they are quantitatively different from an actual plasma initiation scenario in ITER. In this baseline scenario, the plasma volume, position, and loop voltage are held constant while in reality they should be evolving in time, and no impurities are considered. Furthermore, the vessel volume is assumed to be as in ITER with a fully completed first wall, i.e. much smaller than the vessel volume in 2025 ITER first plasma. Nevertheless, since we are primarily interested in qualitatively studying the prevalence of runaway electrons in startup scenarios, we use these parameters to reduce the complexity of the simulations.
We focus on the tokamak start-up from just after breakdown when of deuterium atoms are ionised, the plasma current has reached and the electron temperature is . In this situation, closed flux surfaces have yet to be formed and deuterium burn-through has not yet occurred. Column A in Fig. 4 illustrates the evolution of plasma current, temperature and electric field. Burn-through is achieved within the first , after which the temperature continues to increase and the plasma current is ramped up linearly. In this case, no appreciable number of runaway electrons are generated, despite the fact that takes values as high as early in the start-up, and remains well above the threshold value throughout the start-up phase. The reason for this is the strong transport which expels all runaways that are generated before closed flux surfaces have formed. By the time the flux surfaces are closed, the free electron density and temperature have risen sufficiently for the ratio to be negligibly small. The subsequent increase in is due to the rising temperature, but never reaches values large enough for significant Dreicer generation to occur.
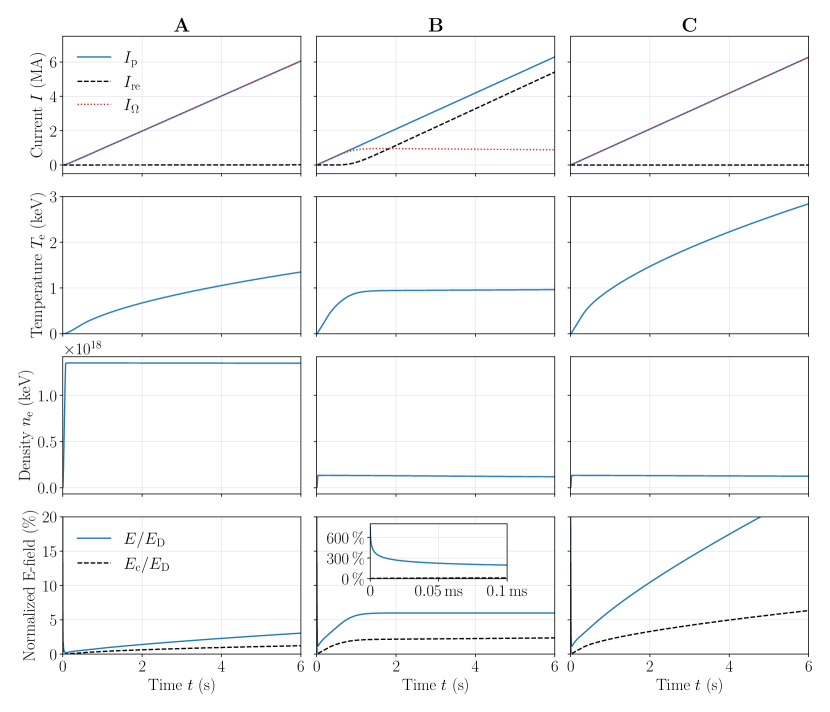
By lowering the prefill pressure by a factor of ten, to , so that the initial electron density is an order of magnitude lower than in the baseline case, we obtain a scenario in which burn-through succeeds and significant runaway electron generation occurs. In column B of figure 4 the evolution in this lower-prefill case is illustrated. As in the baseline case, column A, the plasma current rises at the expected rate, but the composition of the current is very different. The ohmic current saturates at a value of about while the current carried by the runaway electrons continues to rise unhindered. As with the ohmic current, the electron temperature also levels off since most of the energy transferred via the electric field is deposited to the runaway electrons which, due to their low rate of collisions, retain most of the energy without transmitting it to the thermal electrons. This also causes to reach a steady value, and since the externally applied loop voltage is held constant, the parameter saturates. It should be pointed out than in ITER, the loop voltage will eventually be forced to decrease, thus potentially greatly reducing the runaway generation. As long as , runaways can continue to reproduce through the avalanche mechanism, requiring that the model be coupled to a simulation of the current in surrounding coils for a quantitative study.
Figure 5a shows the role played by the Dreicer and avalanche generation mechanisms, respectively, in the low-prefill pressure case. Throughout the simulation, Dreicer generation remains the dominant mechanism while avalanche only starts producing a noticeable number of runaways after a few seconds, when a sufficient seed population has built up. The reason for the strong Dreicer production is the large value of which is sustained for a long time. This is in contrast to the typical situation in disruptions where the electric field usually attains significant fractions of only for a brief period during the current quench, after which it quickly drops and approaches , driving further runaway production mainly via avalanche multiplication.
Transport plays an important role for the runaway suppression only at very early times, before closed flux surfaces have formed (which occurs when the current reaches at about ). Beyond this point, confinement rapidly improves and enables net runaway production. As shown in figure 5, the losses of runaways due to drifts remain negligible throughout the simulation, even as drift losses become the dominant loss mechanism.
In column C of figure 4 we show the evolution of the same case as in column B, but with all runaway generation disabled (i.e. setting in equation (26)). In this case, burn-through succeeds and the plasma current and temperature are effectively ramped up. The large ratio is however a major warning sign, as it quickly rises beyond where significant runaway generation would generally be expected. This illustrates the need to not just ensure that burn-through is reached for successful start-up, but also to verify that remains sufficiently low for negligible runaways to be produced. Note that should be a better parameter to track in start-up simulations, rather than the threshold parameter , due to the relative importance of the Dreicer mechanism in these scenarios, which is exponentially sensitive to .
One of the most crucial uncertain parameters of the simulation is , the runaway electron confinement time. In section 2.4.1 we derived a heuristic model for the runaway confinement time, and as observed in the simulations above, it is short enough to completely eliminate the seed runaways produced in the burn-through phase. The model is however not validated against experiment, and it could therefore be informative to investigate how sensitive our results are to variations in this parameter. To this end, we introduce a scale factor in the transport term of the runaway density equation (26), such that . The result of varying between and 1 is shown in figure 6, illustrated by the time evolutions of the runaway electron density for different and runaway loss fraction
| (37) |
where was used for these simulations. As previously observed, with (transport exactly according to the heuristic model) all runaway electrons are lost from the plasma. This remains true for scale factors down to about , where some runaway electrons are able to survive until the closed flux surfaces form. With , effectively all runaways generated in the early phase survive the simulation.
4.2 Runaway electron generation after gas fuelling
Since the results of the previous section show that the most crucial parameter for the generation of runaways is , we can consider this parameter to try to understand how runaway electrons could potentially be prevented. The quantity depends on three physical parameters, namely the electric field strength , the electron temperature , and the electron density . Since the goal of the start-up is to reach a target plasma current and temperature, limiting can only be a temporary measure and is as such unfeasible for preventing runaways. Limiting can be effective in preventing the formation of runaways, but it will also limit the rate at which the current and temperature can be increased. This leaves the electron density as the main control parameter. Since , increasing the electron density (and thereby the electron collision frequency) could potentially be used to limit the growth of runaway electrons.
As was already illustrated by case A in section 4.1, a high prefill pressure can be effective in limiting the runaway electron growth. However, too high a prefill pressure will also prevent successful burn-through. Since persistent runaways tend to be generated during later stages of start-up, after burn-through has occurred, one could imagine a start-up scenario in which the prefill pressure is kept low to guarantee burn-through, with the density being subsequently increased to lower, or at least maintain, at safe levels.
In figure 7, we consider the same scenario as case B of section 4.1, but with the neutral influx (11) modified to include a source function :
| (38) |
Here we take the source function for deuterium to be a box function
| (39) |
with , is the activation time and is the duration of the source. As shown in figure 7a, in this study we only vary the onset of the source (i.e. its magnitude and duration are kept constant), and it results in the same number of injected electrons in all cases. In this section we consider injections starting at , and after breakdown, all with a duration of .
Figure 8a shows the evolution of the total plasma current and runaway current . While remains almost exactly the same in all three cases, the fraction of the current carried by runaways differs immensely. This also implies that the ohmic component of the current differs greatly, which will affect the ability of the electric field to heat the plasma. In the case with late fuelling (3-, blue), significant Dreicer generation occurs which causes runaway electrons to carry of the total current by the time the fuelling is initiated. The parameter plateaus near due to the poor ohmic coupling, allowing the plasma current to continue to increase while the temperature and ohmic current remain constant. Once fuelling commences, the Dreicer generation is suppressed as illustrated in figure 8c, but due to the large seed of runaways already created, and the difficulty of raising the threshold electric field sufficiently high, the runaways can still multiply via the avalanche mechanism and raise the runaway current further.
When the fuelling source is initiated earlier, at after breakdown, the effect on the runaway current is significant. Again, the fuelling is successful in suppressing the Dreicer generation, but in contrast to the delayed fuelling case, in this case the runaway seed is much smaller. As a result, avalanche multiplication is much slower and gives the ohmic current time to rise without runaway electrons overtaking the current. Eventually, after the gas fuelling is finished and the temperature has risen further, recovers somewhat and again allows Dreicer generation to produce more runaways.
By initiating the fuelling source even earlier, just after breakdown, the effect on the Dreicer generation becomes even more pronounced. In this case, almost all Dreicer runaways are suppressed, preventing them from multiplying. Also here, eventually recovers and allows the Dreicer generation to commence again, but only after the ohmic plasma current and temperature have been raised significantly. Adding to this the fact that, in reality, the loop voltage will have to decrease significantly after burn-through (de Vries & Gribov, 2019), (and by extension the runaway generation) will be much lower at later times than in our simulations.
From the above analysis we can conclude that gas fuelling may be effective in preventing significant runaway generation. Our simulations suggest that the timing of the fuelling is crucial, so that a higher density is reached as soon as possible after burn-through in order to reduce the parameter to which the Dreicer generation mechanism is exponentially sensitive. If the density can be raised sufficiently high early on during the start-up, the potential avalanching of runaways can be greatly reduced and bring the plasma into an essentially runaway-free operating state.
5 Discussion and conclusions
Runaway electrons produced during plasma initiation can have a significant effect on the evolution of plasma parameters, in particular in future tokamaks, where due to restrictions on the allowed toroidal electric field, the prefill pressure needs to be kept low in order for burn-through to be achievable. The low prefill pressure, and subsequent plasma density, leads to low values for the runaway electron threshold electric field , which makes significant runaway generation much more likely. Since most plasma parameters vary greatly during tokamak start-up, it is crucial to evolve the plasma parameters self-consistently in simulations of the start-up. In this study, we have therefore developed the new simulation tool Stream to self-consistently couple models for the background plasma to models for the runaway electrons. The background plasma models have been benchmarked to the results of Dyon presented in (Kim et al., 2020), which were in turn compared to simulations of the same scenarios using Bkd0 and Scenplint, and show good agreement.
In section 4.1 we considered an ITER first plasma-like scenario and varied the prefill pressure, as well as whether or not runaway electron generation was accounted for in the model. We found that a low prefill pressure would lead to significant runaway generation, which would also impact the ohmic coupling between the electric field and the plasma, thus limiting the amount of heat which could be provided to the plasma in the presence of runaways. The clearest sign of whether significant runaway generation would occur in our simulations was when , the electric field normalized to the Dreicer field, reached values of more than during a significant amount of time after successful burn-through. Prior to burn-through, usually takes extremely high values, but any runaway electrons which are generated during this phase are almost immediately lost to the wall due to the open field line configuration. Considering that significant runaway electron generation can impact the plasma properties during start-up, monitoring the evolution of and ensuring that it is kept sufficiently low could be a straightforward way to verify the applicability of other existing burn-through models.
The confinement time for runaway electrons is a highly uncertain parameter in our simulations, and they suggest that the result that all runaway electrons are lost is robust to within a factor of in the confinement time. This assumes that the generation is dominated by relativistic electrons, something which is not necessarily the case in an experimental setting. It is possible that electrons only attain moderate superthermal energies, likely leading to improved confinement of these electrons which are prone to continue accelerating and eventually turning into relativistic runaway electrons.
We also studied the effect of gas fuelling on the generation of runaway electrons and found that injection of deuterium after burn-through can be effective in suppressing much of the runaway generation. The large values of obtained early on in low prefill scenarios gives rise to significant Dreicer generation. This provides a large seed of runaway electrons which will avalanche even after has been reduced by the increased density, thus allowing a significant runaway current to build up. By fuelling the plasma early after burn-through, the Dreicer generation can be suppressed, leaving little or no runaway electrons available to avalanche when eventually recovers. By increasing the density even further than we have done in this paper it might also be possible to raise the runaway threshold above the applied electric field , thus also suppressing the avalanche multiplication. However, note that if fuelling is increased too much or too early, plasma burn-through will fail for the same reason as high prefill gas pressure cases. This calls for careful optimization of the prefill gas and fuelling to avoid the risk of both runaways and failed burn-through.
It is important to note that our studies are qualitative rather than quantitative, and that we have not considered the response of the tokamak control system in these simulations. Since the plasma resistivity decreases with temperature, the electric field should eventually be limited to maintain a constant plasma current when the target temperature is reached. When this happens, it should limit the avalanche generation mechanism, stop further runaway growth and instead reduce the number of runaways, if any, via collisions.
The focus in section 4.2 has been on preventing the generation of runaway electrons. A natural follow-up question to ask would be if it is possible to suppress already existing runaways. In our model, the only reasonable means for reducing the number of runaway electrons is to reduce the threshold parameter below unity to allow the runaways to avalanche “in reverse” and collisionally dissipate their energy to the bulk electrons. This might be feasible, and a natural result of successful start-up, if the fraction of runaway current is low. If, however, the runaway current is significant, this process would be difficult to reconcile with maintaining the plasma at a specified current and temperature.
In this study we have only considered the effect of relativistic electrons. During start-up it is also possible for the electron distribution function to be significantly distorted from thermal equilibrium due to the large values of , and for a large fraction of superthermal (albeit not relativistic) electrons to form. Such electrons will also affect the heating properties and general evolution of the plasma, but are not captured by the model presented here. An analysis of these electrons would require the solution of the Fokker–Planck equation with non-linear collision coefficients, since linearizations of the collision operator typically assume that most electrons are in thermal equilibrium. While Dream, and thus by extension Stream, supports the solution of a Fokker–Planck equation simultaneously with the evolution of the (fluid) background plasma, all collision operators available in the code are linearized. A kinetic treatment of the runaway problem during start-up could also allow us to study the effect of runaways on the ionization of atoms, as well as the effect of Electron Cyclotron Heating (ECH)—the latter which is anticipated to be used in ITER to assist startup—for the generation of fast electrons. This could be done by, for example, coupling Stream to the bounce-averaged Fokker-Planck code Luke (Decker & Peysson, 2004) which also solves for wave-particle interactions. We therefore leave for future studies a more detailed analysis of the momentum-space dynamics of fast electrons during start-up.
Acknowledgements
The authors are grateful to H. T. Kim, E. Nardon, S. Newton, I. Pusztai and J. Decker for fruitful discussions.
Funding
This work has been carried out within the framework of the EUROfusion Consortium, funded by the European Union via the Euratom Research and Training Programme (Grant Agreement No 101052200 — EUROfusion). Views and opinions expressed are however those of the author(s) only and do not necessarily reflect those of the European Union or the European Commission. Neither the European Union nor the European Commission can be held responsible for them. This work was supported by the Swedish Research Council (Dnr. 2018-03911). This work was supported in part by the Swiss National Science Foundation.
Declaration of interests
The authors report no conflict of interest.
Data availability statement
The source code for Stream as well as simulation scripts for all simulations of this study are openly available in https://github.com/chalmersplasmatheory/STREAM.
References
- Belyakov et al. (2003a) Belyakov, V., Vasiliev, V., Lobanov, K., Makarova, L. & Mineev, A. 2003a Analysis of initial stage of plasma discharge in tokamaks: mathematical model formulation, simulation results, comparison with experiments. In 2003 IEEE International Workshop on Workload Characterization (IEEE Cat. No.03EX775), pp. 1025–1034 vol. 3.
- Belyakov et al. (2003b) Belyakov, V. A., Lobanov, K. M., Makarova, L. P., Mineev, A. B. & Vasiliev, V. I. 2003b Plasma initiation stage analysis in tokamaks with TRANSMAK code. Plasma Devices and Operations 11 (3), 193–201.
- Boozer (2015) Boozer, A. H. 2015 Theory of runaway electrons in ITER: Equations, important parameters, and implications for mitigation. Physics of Plasmas 22 (3), 032504.
- Breizman et al. (2019) Breizman, B. N., Aleynikov, P., Hollmann, E. M. & Lehnen, M. 2019 Physics of runaway electrons in tokamaks. Nuclear Fusion 59 (8), 083001.
- Connor & Hastie (1975) Connor, J. & Hastie, R. 1975 Relativistic limitations on runaway electrons. Nuclear Fusion 15 (3), 415–424.
- Decker & Peysson (2004) Decker, J. & Peysson, Y. 2004 DKE: A fast numerical solver for the 3D drift kinetic equation. Tech. Rep. EUR-CEA-FC-1736. Euratom-CEA.
- Dreicer (1959) Dreicer, H. 1959 Electron and ion runaway in a fully ionized gas. i. Physical Review 115, 238.
- Esposito et al. (2003) Esposito, B., Martín-Solís, J. R., Poli, F. M., Mier, J. A., Sánchez, R. & Panaccione, L. 2003 Dynamics of high energy runaway electrons in the frascati tokamak upgrade. Physics of Plasmas 10 (6), 2350–2360, arXiv: https://doi.org/10.1063/1.1574328.
- Esposito et al. (1996) Esposito, B., Solis, R. M., van Belle, P., Jarvis, O. N., Marcus, F. B., Sadler, G., Sanchez, R., Fischer, B., Froissard, P., Adams, J. M., Cecil, E. & Watkins, N. 1996 Runaway electron measurements in the JET tokamak. Plasma Physics and Controlled Fusion 38 (12), 2035–2049.
- Fülöp et al. (2020) Fülöp, T., Helander, P., Vallhagen, O., Embreus, O., Hesslow, L., Svensson, P., Creely, A., Howard, N. & Rodriguez-Fernandez, P. 2020 Effect of plasma elongation on current dynamics during tokamak disruptions. Journal of Plasma Physics 86 (1), 474860101.
- Granucci et al. (2015) Granucci, G., Garavaglia, S., Ricci, D., Artaserse, G., Belli, F., Bin, W., Calabrò, G., Cavinato, M., Farina, D., Figini, L., Moro, A., Ramogida, G., Sozzi, C. & and, O. T. 2015 Experiments and modeling on FTU tokamak for EC assisted plasma start-up studies in ITER-like configuration. Nuclear Fusion 55 (9), 093025.
- Gribov et al. (2007) Gribov, Y., Humphreys, D., Kajiwara, K., Lazarus, E., Lister, J., Ozeki, T., Portone, A., Shimada, M., Sips, A. & Wesley, J. 2007 Chapter 8: Plasma operation and control. Nuclear Fusion 47 (6), S385–S403.
- Hesslow et al. (2018a) Hesslow, L., Embréus, O., Wilkie, G. J., Papp, G. & Fülöp, T. 2018a Effect of partially ionized impurities and radiation on the effective critical electric field for runaway generation. Plasma Physics and Controlled Fusion 60 (7), 074010.
- Hesslow et al. (2018b) Hesslow, L., Embréus, O., Hoppe, M., DuBois, T. C., Papp, G. & Fülöp, T. 2018b Generalized collision operator for fast electrons interacting with partially ionized impurities. Journal of Plasma Physics 84 (6), 905840605.
- Hesslow et al. (2019a) Hesslow, L., Embréus, O., Vallhagen, O. & Fülöp, T. 2019a Influence of massive material injection on avalanche runaway generation during tokamak disruptions. Nuclear Fusion 59 (8), 084004.
- Hesslow et al. (2019b) Hesslow, L., Unnerfelt, L., Vallhagen, O., Embreus, O., Hoppe, M., Papp, G. & Fülöp, T. 2019b Evaluation of the Dreicer runaway generation rate in the presence of high- impurities using a neural network. Journal of Plasma Physics 85 (6), 475850601.
- Hoppe et al. (2021) Hoppe, M., Embreus, O. & Fülöp, T. 2021 DREAM: A fluid-kinetic framework for tokamak disruption runaway electron simulations. Computer Physics Communications 268, 108098.
- Jayakumar et al. (1993) Jayakumar, R., Fleischmann, H. & Zweben, S. 1993 Collisional avalanche exponentiation of runaway electrons in electrified plasmas. Physics Letters A 172 (6), 447–451.
- Kavin et al. (2017) Kavin, A. A., Mineev, A. B. & Lobanov, K. M. 2017 Study of 1st plasma initiation using SCENPLINT code with revised model of runaway electrons. Tech. Rep. UCVKY4. ITER.
- Kim et al. (2012) Kim, H.-T., Fundamenski, W., Sips, A. & EFDA-JET Contributors 2012 Enhancement of plasma burn-through simulation and validation in JET. Nuclear Fusion 52 (10), 103016.
- Kim et al. (2020) Kim, H.-T., Mineev, A., Ricci, D., Lee, J. & Na, Y.-S. 2020 Benchmarking of codes for plasma burn-through in tokamaks. Nuclear Fusion 20 (12), 126049.
- Kim et al. (2013) Kim, H.-T., Sips, A. & Contributors, E. 2013 Physics of plasma burn-through and DYON simulations for the JET ITER-like wall. Nuclear Fusion 53 (8), 083024.
- Knoepfel & Spong (1979) Knoepfel, H. & Spong, D. A. 1979 Runaway electrons in toroidal discharges. Nuclear Fusion 19 (6), 785–829.
- Kramida et al. (2020) Kramida, A., Yu. Ralchenko, Reader, J. & and NIST ASD Team 2020 NIST Atomic Spectra Database (ver. 5.8), [Online]. Available: https://physics.nist.gov/asd [2022, February 22]. National Institute of Standards and Technology, Gaithersburg, MD.
- Lloyd et al. (1996) Lloyd, B., Carolan, P. G. & Warrick, C. D. 1996 ECRH-assisted start-up in ITER. Plasma Physics and Controlled Fusion 38 (9), 1627–1643.
- Lloyd et al. (1991) Lloyd, B., Jackson, G., Taylor, T., Lazarus, E., Luce, T. & Prater, R. 1991 Low voltage ohmic and electron cyclotron heating assisted startup in DIII-D. Nuclear Fusion 31 (11), 2031–2053.
- Martín-Solís et al. (2017) Martín-Solís, J., Loarte, A. & Lehnen, M. 2017 Formation and termination of runaway beams in ITER disruptions. Nuclear Fusion 57 (6), 066025.
- Mineev et al. (2014) Mineev, A. B., Belyakov, V. A., Gribov, Y. V., Kavin, A. A., Lobanov, K. M., Belov, A. V., Lamzin, E. A. & Sytchevsky, S. E. 2014 Study of ITER First Plasma Initiation using a 3D Electromagnetic Model. In Proceedings of the 25th IAEA Fusion Energy Conference. PPC/P3-20.
- Redl et al. (2021) Redl, A., Angioni, C., Belli, E., Sauter, O., ASDEX Upgrade Team & EUROfusion MST1 Team 2021 A new set of analytical formulae for the computation of the bootstrap current and the neoclassical conductivity in tokamaks. Physics of Plasmas 28 (2), 022502.
- Rosenbluth & Putvinski (1997) Rosenbluth, M. N. & Putvinski, S. V. 1997 Theory for avalanche of runaway electrons in tokamaks. Nuclear Fusion 37 (10), 1355.
- Sharma & Jayakumar (1988) Sharma, A. & Jayakumar, R. 1988 Runaway electrons during tokamak startup. Nuclear Fusion 28 (3), 491–498.
- Summers (2004) Summers, H. P. 2004 The ADAS user manual, version 2.6. http://www.adas.ac.uk.
- Vallhagen et al. (2020) Vallhagen, O., Embreus, O., Pusztai, I., Hesslow, L. & Fülöp, T. 2020 Runaway dynamics in the DT phase of ITER operations in the presence of massive material injection. Journal of Plasma Physics 86 (4), 475860401.
- de Vries & Gribov (2019) de Vries, P. & Gribov, Y. 2019 ITER breakdown and plasma initiation revisited. Nuclear Fusion 59 (9), 096043.
- de Vries et al. (2020) de Vries, P. C., Gribov, Y., Martin-Solis, R., Mineev, A. B., Sinha, J., Sips, A. C. C., Kiptily, V. & Loarte, A. 2020 Analysis of runaway electron discharge formation during Joint European Torus plasma start-up. Plasma Physics and Controlled Fusion 62 (12), 125014.
- Wesson (1997) Wesson, J. 1997 Tokamaks, 2nd edn. Oxford University Press.
- Yoshino & Seki (1997) Yoshino, R. & Seki, M. 1997 Low electric field plasma-current start-up in JT-60U. Plasma Physics and Controlled Fusion 39 (1), 205–222.