RoMe: A Robust Metric for Evaluating Natural Language Generation
Abstract
Evaluating Natural Language Generation (NLG) systems is a challenging task. Firstly, the metric should ensure that the generated hypothesis reflects the reference’s semantics. Secondly, it should consider the grammatical quality of the generated sentence. Thirdly, it should be robust enough to handle various surface forms of the generated sentence. Thus, an effective evaluation metric has to be multifaceted. In this paper, we propose an automatic evaluation metric incorporating several core aspects of natural language understanding (language competence, syntactic and semantic variation). Our proposed metric, RoMe, is trained on language features such as semantic similarity combined with tree edit distance and grammatical acceptability, using a self-supervised neural network to assess the overall quality of the generated sentence. Moreover, we perform an extensive robustness analysis of the state-of-the-art methods and RoMe. Empirical results suggest that RoMe has a stronger correlation to human judgment over state-of-the-art metrics in evaluating system-generated sentences across several NLG tasks.
1 Introduction
Automatic generation of fluent and coherent natural language is a key step for human-computer interaction. Evaluating generative systems such as text summarization, dialogue systems, and machine translation is challenging since the assessment involves several criteria such as content determination, lexicalization, and surface realization Liu et al. (2016); Dale and Mellish (1998). For assessing system-generated outputs, human judgment is considered to be the best approach. Obtaining human evaluation ratings, on the other hand, is both expensive and time-consuming. As a result, developing automated metrics for assessing the quality of machine-generated text has become an active area of research in NLP.
The quality estimation task primarily entails determining the similarity between the reference and hypothesis as well as assessing the hypothesis for grammatical correctness and naturalness. Widely used evaluation metrics such as BLEU Papineni et al. (2002), METEOR Banerjee and Lavie (2005), and ROUGE Lin (2004) which compute the word-overlaps, were primarily designed for evaluating machine translation and text summarization systems. Word-overlap based metrics, on the other hand, are incapable of capturing the hypotheses’ naturalness and fluency. Furthermore, they do not consider the syntactic difference between reference and hypothesis. In a different line of research, word mover distance (WMD) Kusner et al. (2015), BERTScore Zhang et al. (2020a) and MoverScore Zhao et al. (2019) compute word embedding based similarity for evaluating system-generated texts. Although these metrics employ the contextualized representation of words, they do not take the grammatical acceptability of the hypothesis and the syntactical similarity to the reference into account.
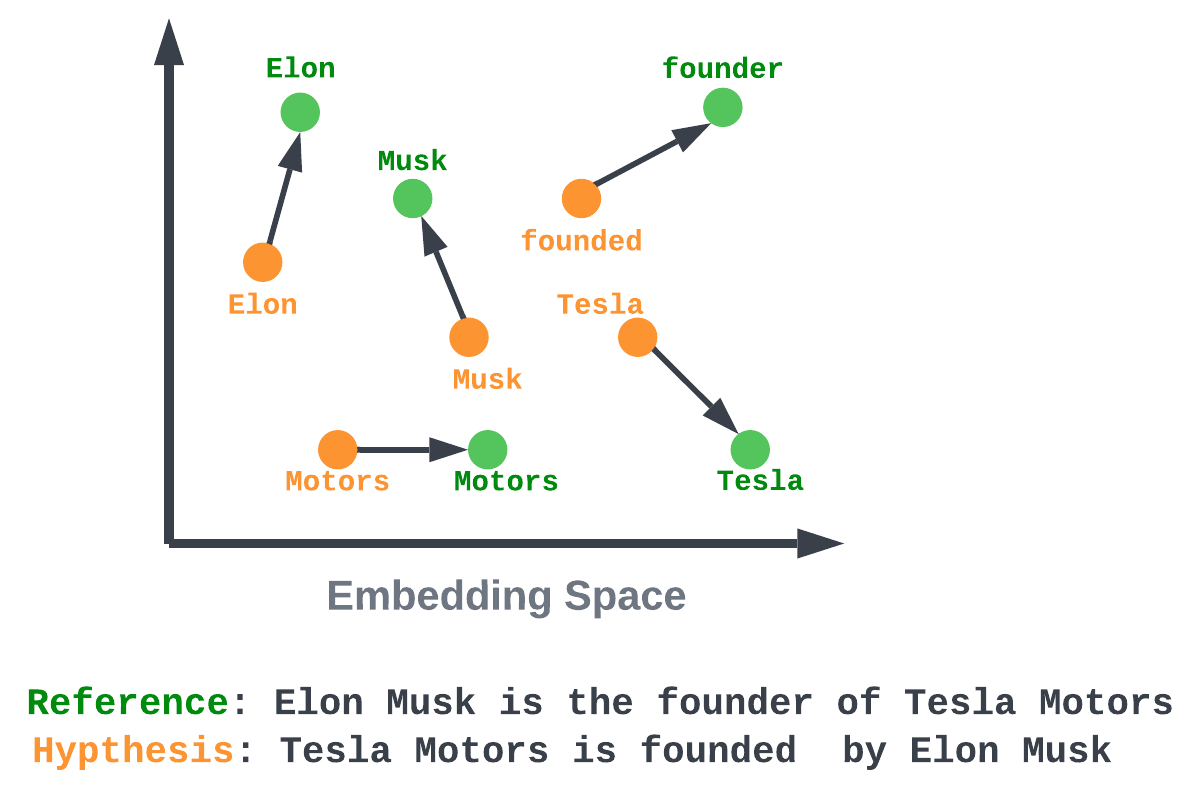
To address these shortcomings, we propose RoMe, an automatic and robust metric for evaluating NLG systems. RoMe employs a neural classifier that uses the generated sentence’s grammatical, syntactic, and semantic qualities as features to estimate the quality of the sentence. Firstly, it calculates the earth mover’s distance (EMD) Rubner et al. (1998) to determine how much the hypothesis differs from the reference. During the computation of EMD, we incorporate hard word alignment and soft-penalization constants to handle various surface forms of words in a sentence, such as repeated words and the passive form of a sentence. Secondly, using a semantically enhanced tree edit distance, the difference in syntactic structures between the reference and hypothesis sentences is quantified. Thirdly, the metric incorporates a binary classifier to evaluate the grammatical acceptability of the generated hypotheses. Finally, the scores obtained from the preceding steps are combined to form a representation vector, which is subsequently fed into a self-supervised network. The network produces a final score, referred to as RoMe’s output which represents the overall quality of the hypothesis statement.
We investigate the effectiveness of our proposed metric by conducting experiments on datasets from various domains of NLG such as knowledge graph based language generation dataset (KELM Agarwal et al. (2021)), dialogue datasets Eric et al. (2017); Chaudhuri et al. (2021), the WebNLG 2017 challenge dataset Shimorina et al. (2018), structured data to language generation dataset (BAGEL Mairesse et al. (2010) and SFHOTEL Wen et al. (2015)). The capability of existing metrics to handle various forms of text has lately become a matter of debate in the NLP community Ribeiro et al. (2020); Novikova et al. (2017); Liu et al. (2016). Hence, we conduct an extensive robustness analysis to assess RoMe’s performance in handling diverse forms of system-generated sentences. To verify our claim, we design the analysis based on the text perturbation methods used in CHECKLIST Ribeiro et al. (2020) and adversarial text transformation techniques from TextFooler Jin et al. (2020) and TextAttack Morris et al. (2020). Empirical assessment on benchmark datasets and the robustness analysis results exhibit that RoMe can handle various surface forms and generate an evaluation score, which highly correlates with human judgment. RoMe is designed to function at the sentence level and can be used to evaluate English sentences in the current version of the implementation. In the future versions, we plan to extend RoMe by including more languages. We released the code and annotation tool publicly 111https://github.com/rashad101/RoMe.
2 Preliminaries
2.1 Earth Mover’s Distance
The Earth Mover’s Distance (EMD) estimates the amount of work required to transform a probability distribution into another Rubner et al. (1998). Inspired by the EMD, in NLP the transportation problem is adopted to measure the amount of work required to match the system generated hypothesis sentence with the reference sentence Kusner et al. (2015); Zhao et al. (2019).
Let us define the reference as = and the hypothesis as = , where and indicates the -th and -th word of the reference and hypothesis, respectively. The weight of the word and are denoted as and respectively. Then, the total weight distribution of and is = and = , respectively. Here, the sentence-level and normalized TF-IDF score of a word is considered as the word’s weight. Formally, EMD can be defined as:
| (1) |
where is the distance between the words and in the space and is a set of possible flows between the two distributions that the system tries to optimize. In Equation 1, denotes the amount of work required to match the hypothesis with the reference. The optimization is done following four constraints:
| (2) |
The first constraint indicates that each flow must be non-negative. The second constraint limits the total weights flowing from to less than or equal to . Similarly, the third constraint restricts the total weights flowing from to less than or equal to . The final constraint indicates that the total flow of weights must be equal to the minimum weight distribution. Figure 1 depicts the EMD for a given hypothesis-reference pair.
2.2 Syntactic Similarity and Tree Edit Distance
In computational linguistics, dependency and constituency trees are used to represent syntactic dependencies between words in a sentence. Unlike the constituency tree, a dependency tree can represent non-adjacent and non-projective dependencies in a sentence, which frequently appear in spoken language and noisy text. That leads us to prefer dependency trees over constituency trees for evaluating NLG output.
Formally, a dependency tree is a set of nodes and a set of dependency links , where is the imaginary root node and is an index into representing the governor of . Every node has exactly one governor except for , which has no governor Hall and Novák (2010). Syntactic similarity between a pair of dependency trees can be estimated using several methods, such as graph centralities and Euclidean distances Oya (2020). In our work, we exploit the Tree Edit Distance (TED) algorithm Zhang and Shasha (1989) to estimate syntactic similarity between reference and hypothesis. TED is typically computed on ordered labeled trees and can thus be used to compare dependency trees. The edit operations performed during the comparison of parsed dependency trees include Change, Delete, and Insert.
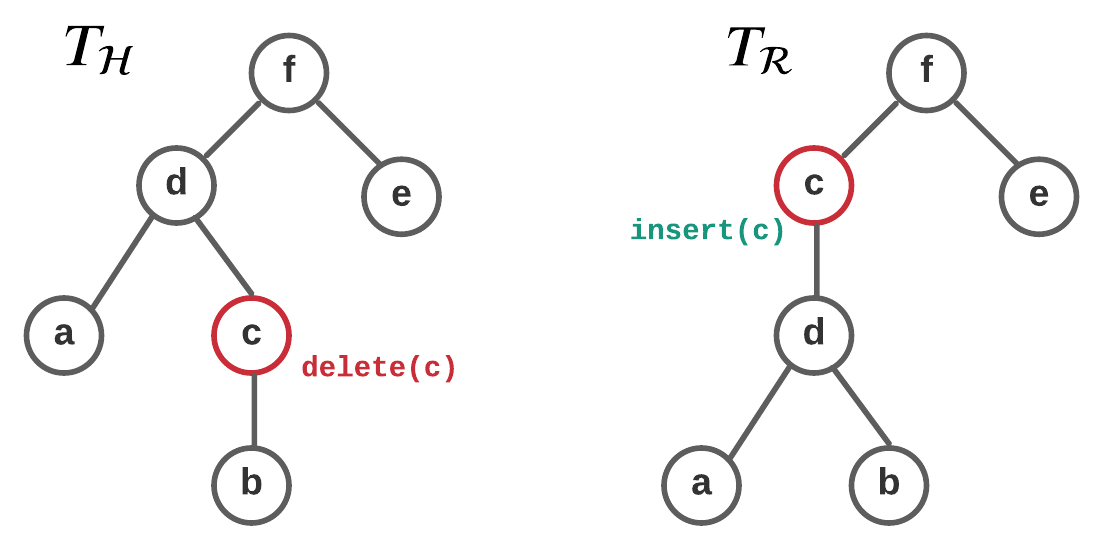
Let us consider and be the parsed dependency trees of the hypothesis and reference, respectively. The operations required to transform one tree into another are visualized in Figure 2. In TED, an exact match between the nodes of the compared trees is performed to decide if any edit operation is required. In this work, the syntactic difference between hypothesis and reference is determined by the output of TED, which specifies the total number of edit operations.
3 RoMe
In RoMe, a neural network determines the final evaluation score given a reference-hypothesis pair. The network is trained to predict the evaluation score based on three features: semantic similarity computed by EMD, enhanced TED, and the grammatical acceptability score. We explain these features in the following subsections.
3.1 Earth Mover’s Distance Based Semantic Similarity
During the computation of EMD, we employ hard word alignment and soft-penalization techniques to tackle repetitive words and passive forms of a sentence. We compute a distance matrix and a flow matrix as described below and finally obtain EMD utilizing Equation 1.
Hard Word Alignment. We first align the word pairs between reference and hypothesis based on their semantic similarities. The alignment is performed by computing all paired cosine similarities while taking word position information into account, as in Echizen-ya et al. (2019). In contrast to Echizen-ya et al. (2019), we use contextualized pre-trained word embedding from the language model ALBERT Lan et al. (2020). ALBERT uses sentence-order prediction loss, focusing on modeling inter-sentence coherence, which improves multi-sentence encoding tasks. The word alignment score is computed as follows:
| (3) |
where and denote the contextualized word embedding of and , respectively. The first part of the right side of the equation computes the cosine similarity between and , and the second part calculates the relative position information as proposed in Echizen-ya et al. (2019).
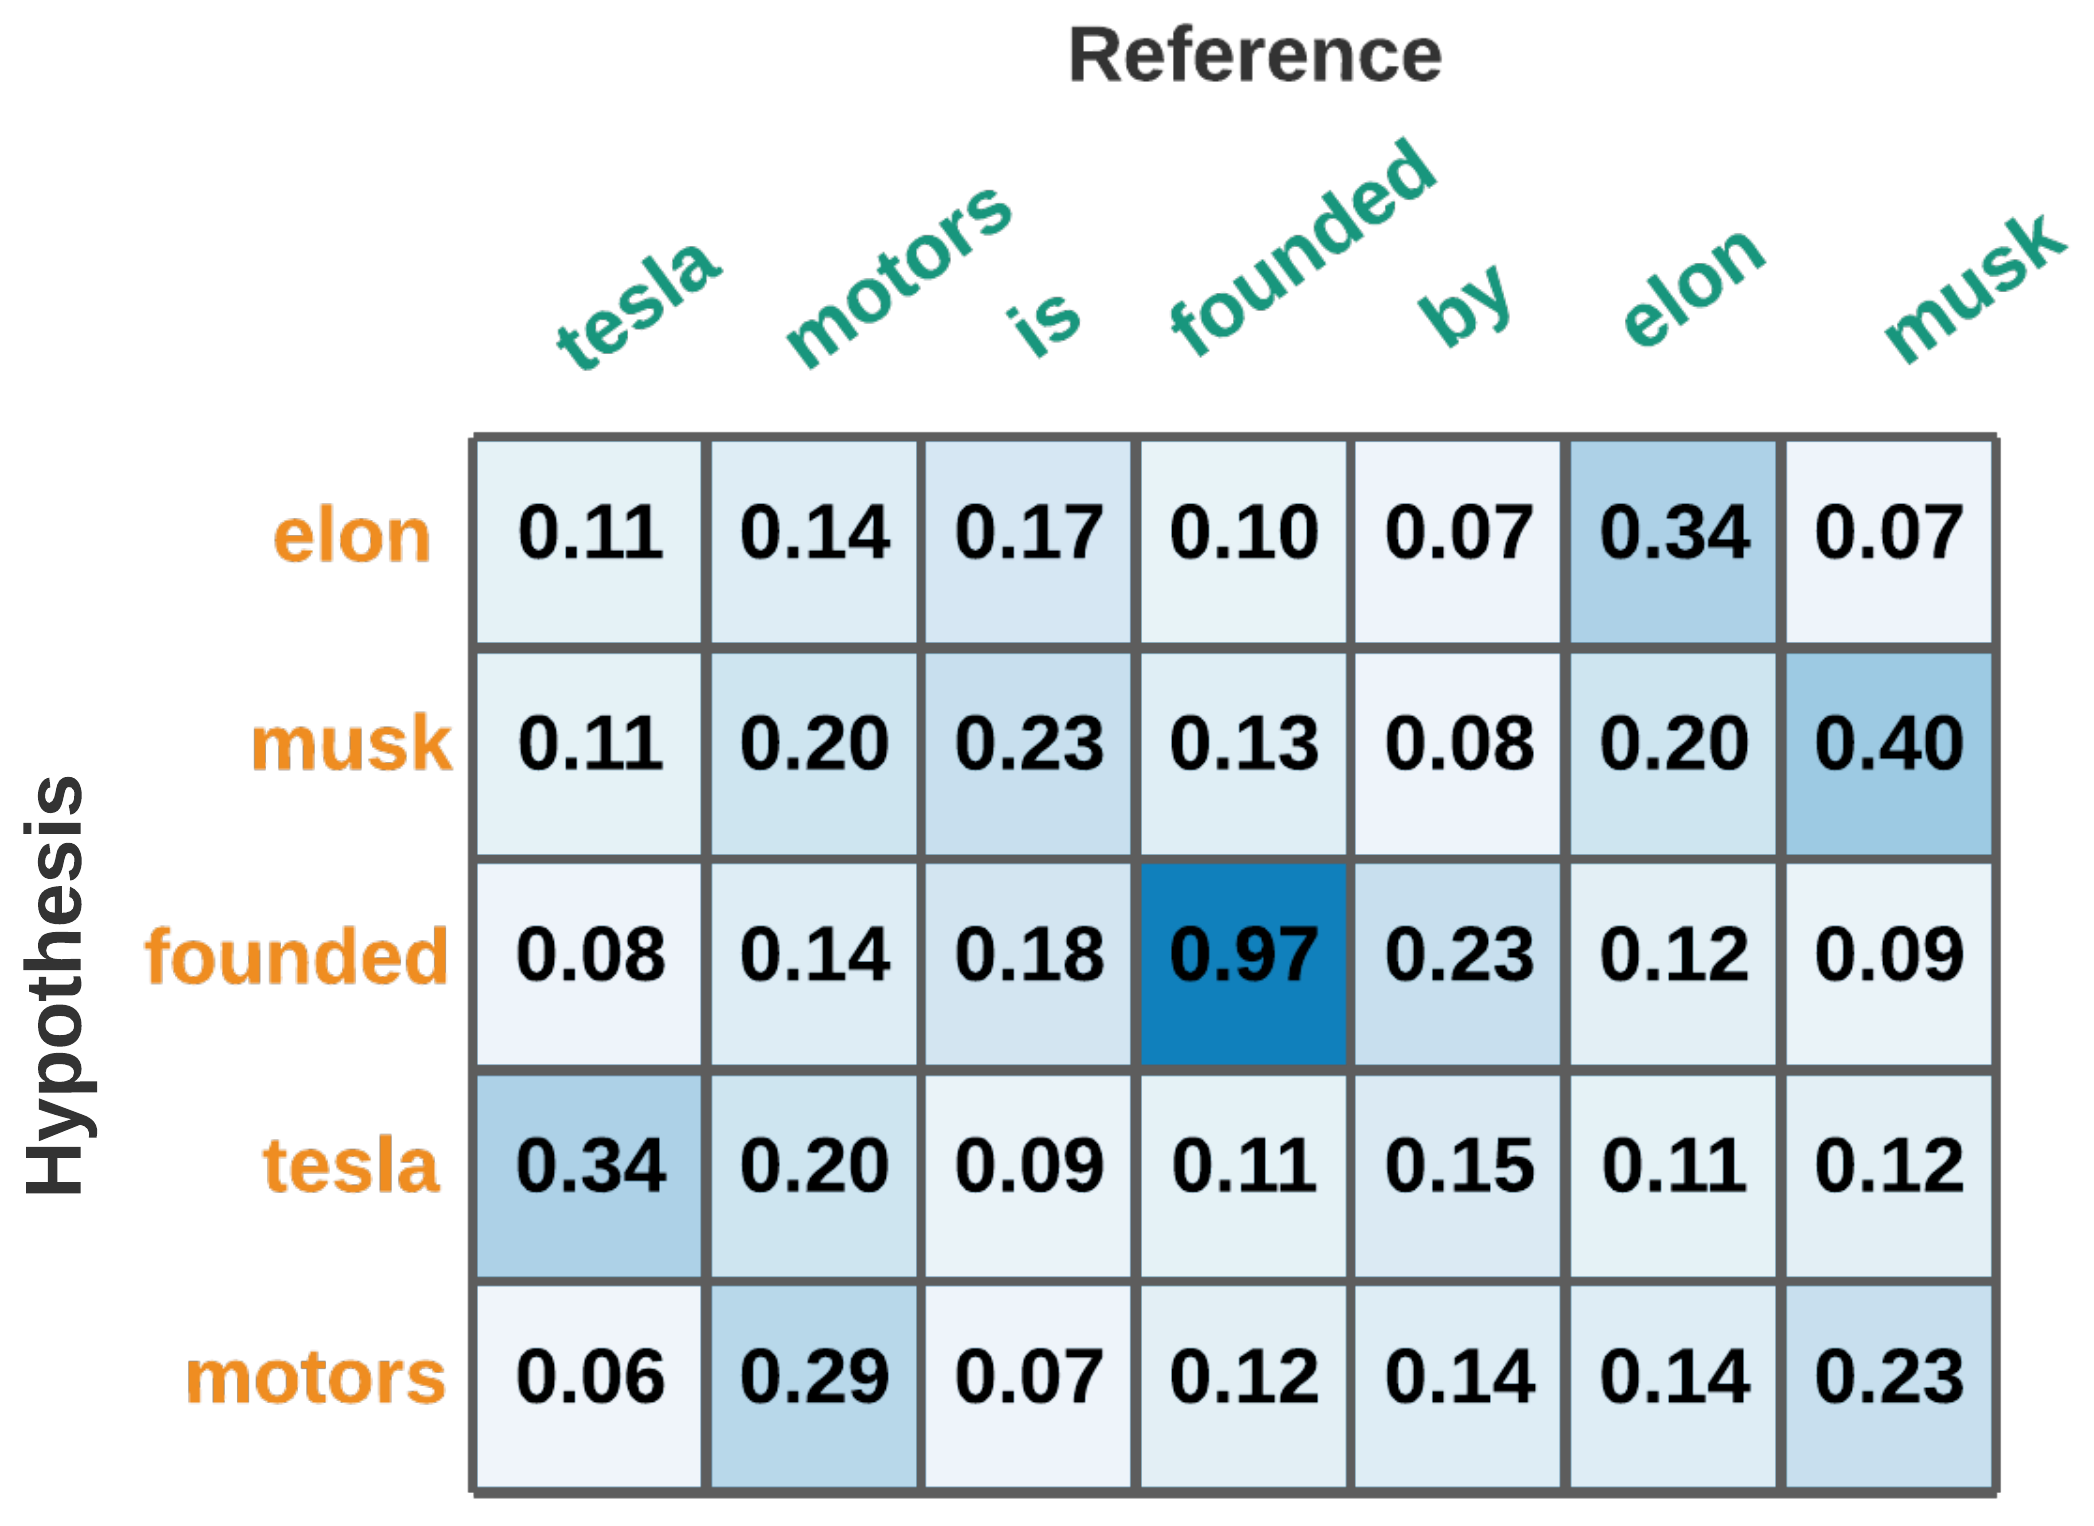
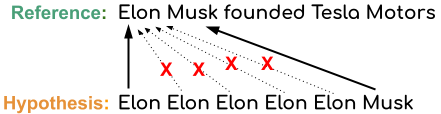
Figure 3 depicts a matrix of word alignment scores generated on an example pair of sentences. This alignment strategy fails to handle repetitive words where a word from the hypothesis may get aligned to several words in the reference (see Figure 4). To tackle such cases, we restrict the word alignment by imposing a hard constraint. In the hard constraint, we prevent the words in the hypothesis from getting aligned to multiple words in the reference as illustrated by the dotted arrows in Figure 4. We denote the resulting set of hard-aligned word pairs as .
Transport Distance. A distance matrix is required to compute the final EMD score. For each aligned pair where , the distance between and is computed as follows:
| (4) |
where and is a confidence threshold found via hyper-parameter search, is a soft-penalization constant. For all the non-hard-aligned pairs and aligned pairs with value less than , the distance receives a maximum value of 1.0. Intuitively, a lower value of implies that the word needs to travel a shorter distance in the transportation problem of EMD. In Equation 4, works as a penalty where a higher position difference multiplied with the negative constant will results in low score. The role of is explained below.
Soft-penalization. Existing metrics often impose hard penalties for words with different order than the reference sentence Zhao et al. (2019); Echizen-ya et al. (2019). For instance, sentences phrased in the passive form obtain a very low score in those metrics. Addressing this issue, we introduce a soft-penalization constant in Equation 4 to handle the passive form of a sentence better. Let us consider a reference, "Shakespeare has written Macbeth" and the passive form of the sentence as hypothesis, "The Macbeth is written by Shakespeare". The word Shakespeare appears at the beginning of the reference and at the end of the hypothesis, thus the position difference is larger. In such scenario, imposes a lower penalty as it divides the position difference by the length .
Finally, following the optimization constraints of Equation 2, we obtain the transportation flow . For the optimized flow , the final equation of EMD is as follows:
| (5) |
The semantic similarity between hypothesis and reference is denoted as . The normalized value of EMD is used to calculate .
3.2 Semantically Enhanced TED
To estimate the difference between the syntactic structures of reference and hypothesis, we extend the TED algorithm Zhang and Shasha (1989). The original TED algorithm performs edit operations based on an exact match between two nodes in the dependency trees of hypothesis and reference. In this work, we modify the TED algorithm and compute a word embedding-based cosine similarity to establish the equivalence of two nodes. Two nodes are considered equal, if the cosine similarity of their embedding representations exceeds the threshold . This allows the semantically enhanced TED to process synonyms and restricts it from unnecessary editing of similar nodes. We call the resulting algorithm TED-SE. The normalized value of TED-SE is denoted as . We compute TED-SE over the lemmatized reference and hypothesis since lemmatized text exhibits improved performance in such use cases Kutuzov and Kuzmenko (2019). The lemmatizer and dependency parser from Stanza Qi et al. (2020) are utilised to obtain the tree representation of the text. Further details are provided in Appendix A.1.
3.3 Grammatical Acceptability Classification
Linguistic competence assumes that native speakers can judge the grammatical acceptability of a sentence. However, system-generated sentences are not always grammatically correct or acceptable. Therefore, we train a binary classifier on the Corpus of Linguistic Acceptability (CoLA) Warstadt et al. (2019), predicting the probability that the hypothesis is grammatically acceptable. CoLA is a collection of sentences from the linguistics literature with binary expert acceptability labels containing over 10k examples Warstadt et al. (2019) 222with 70.5% examples manually labeled acceptable.. The classifier is based on BERT-large Devlin et al. (2019) and trained to optimize binary cross-entropy loss. A text sequence is fed as input and as output, the classifier produces the class membership probability (grammatically acceptable, grammatically unacceptable). The model achieves an accuracy of 80.6% on the out-of-domain CoLA test set (Warstadt et al., 2019, p. 8). We denote the score from the classifier as the feature , which is used to train a neural network (see §3.4).
Settings Metrics BAGEL SFHOTEL Info Nat Qual Info Nat Qual BLEU-1 0.225 0.141 0.113 0.107 0.175 0.069 BLEU-2 0.211 0.152 0.115 0.097 0.174 0.071 METEOR 0.251 0.127 0.116 0.163 0.193 0.118 BERTScore 0.267 0.210 0.178 0.163 0.193 0.118 SMD+W2V 0.024 0.074 0.078 0.022 0.025 0.011 Baselines SMD+ELMO+PMEANS 0.251 0.171 0.147 0.130 0.176 0.096 SMD+BERT+MNLI+PMAENS 0.280 0.149 0.120 0.205 0.239 0.147 WMD-1+ELMO+PMEANS 0.261 0.163 0.148 0.147 0.215 0.136 WMD-1+BERT+PMEANS 0.298 0.212 0.163 0.203 0.261 0.182 WMD-1+BERT+MNLI+PMEANS 0.285 0.195 0.158 0.207 0.270 0.183 RoMe (Fasttext) 0.112 0.163 0.132 0.172 0.190 0.231 RoMe RoMe (BERT) 0.160 0.251 0.202 0.212 0.283 0.300 RoMe (ALBERT-base) 0.162 0.259 0.222 0.231 0.295 0.315 RoMe (ALBERT-large) 0.170 0.274 0.241 0.244 0.320 0.327
3.4 Final Scorer Network
A feed-forward neural network takes the previously computed features as input and learns a function in the final step, yielding a final output score in the interval. The output score is regarded as the overall quality of the hypothesis. Following a self-supervised paradigm, the network is trained on artificially generated training samples from the KELM dataset Agarwal et al. (2021). KELM contains knowledge-grounded natural sentences. We randomly choose 2,500 sentence pairs from the KELM dataset and generate 2,500 more negative samples by randomly augmenting the sentences using TextAttack Morris et al. (2020) and TextFooler Jin et al. (2020). Following a similar approach, we additionally generate 1,000 test sentence pairs from the KELM dataset. Overall, we then have 5,000 training and 1,000 test examples. The network is a simple, two-layered feed-forward network optimized with stochastic gradient descent using a learning rate of 1e-4.
Text EMD TED-SE Grammar RoMe Munich is located at the southern part of Germany. 0.83 1.0 0.94 0.80 Munich is situated in the south of Germany. Tesla motors is founded by Elon Musk. 0.70 0.85 0.96 0.69 Elon Musk has founded Tesla Motors. Elon musk has founded tesla motors. 0.01 0.50 0.17 0.11 Elon elon elon elon elon founded tesla tesla tesla.
Text BLEU BERTScore MoverScore RoMe James Craig Watson, who died from peritonitis, discovered 101 Helena. 0.0 0.81 0.54 0.15 The Polish Academy of Science is regionserved. 1001 gaussia was formerly known as 1923 oaa907 xc. 0.0 0.79 0.51 0.13 The former name for the former name for 11 gunger is 1923. One of the former name is 1923.
Dialogue dataset Models SentBLEU METEOR BERTScore MoverScore RoMe Mem2Seq 0.07 0.35 0.40 0.49 0.51 In-car dialogue GLMP 0.04 0.29 0.32 0.31 0.32 DialoGPT 0.17 0.60 0.62 0.73 0.78 Mem2Seq 0.03 0.08 0.08 0.11 0.11 Soccer dialogue GLMP 0.02 0.08 0.03 0.12 0.14 DialoGPT 0.04 0.26 0.31 0.39 0.43
Approaches Correlation () RoMe with 64.8 + 66.0 + 66.9 + TED-SE 69.1 + Grammar 70.1
4 Experiments and Analysis
4.1 Data
To assess RoMe’s overall performance, first, we benchmark on two language generation datasets, BAGEL Mairesse et al. (2010) and SFHOTEL Wen et al. (2015), containing 404 and 796 data points, respectively. Each data point contains a meaning representation (MR) and a system generated output. Human evaluation scores of these datasets are obtained from Novikova et al. (2017). Furthermore, we evaluate dialogue system’s outputs on Stanford in-car dialogues Eric et al. (2017) containing 2,510 data points and the soccer dialogue dataset Chaudhuri et al. (2019) with 2,990 data points. Each data point of these datasets includes a user query, a reference response, and a system response as a hypothesis. Three different system outputs are evaluated for each dialogue dataset. We use the human annotated data provided by Chaudhuri et al. (2021). Moreover, we evaluate the metrics on the system generated outputs from the WebNLG 2017 challenge Shimorina et al. (2018).
Finally, to conduct robustness analysis, we randomly sample data points from KELM Agarwal et al. (2021) and perturb them with adversarial text transformation techniques. Three annotators participated in the data annotation process (two of them are from a Computer Science and one from a non-Computer Science background), where they annotated the perturbed data. We provided the annotators with an annotation tool which displays the reference sentence and the system output for each data point. The annotators were asked to choose a value from a range of [1,3], for each of the categories: Fluency, Semantic Correctness, and Grammatical correctness. In this case, the values stand for 1: poor, 2: average, and 3: good. The overall inter-annotator agreement score, is 0.78. The annotation tool and its interface are discussed in detail in Appendix A.2.
4.2 Hyper-parameter Settings
We use and in §3.1. Best values are found by a hyper-parameter search from a range of [0,1.0] with an interval of 0.1. RoMe obtained the best result by utilizing ALBERT-large Lan et al. (2020) model with 18M parameters and 24 layers. Furthermore, we use the English word embedding of dimension 300 to obtain results from Fasttext Bojanowski et al. (2017) throughout the paper. As the grammatical acceptability classifier, we train a BERT-base model with 110M parameters and 12 layers. The hidden layer size is 768 with a hidden layer dropout of 0.1. A layer norm epsilon of 1e-12 was used for layer normalization. GELU Hendrycks and Gimpel (2016) was used as the activation function. We use a single GPU with 12GBs of memory for all the evaluations.
4.3 Baselines
We select both the word-overlap and embedding-based metrics as strong baselines. For the experiment and robustness analysis we choose BLEU Papineni et al. (2002), METEOR Banerjee and Lavie (2005), BERTScore Zhang et al. (2020a) and MoverScore Zhao et al. (2019). We evaluate the metrics on the sentence level to make a fair comparison.
Metrics BLEU METEOR BERTScore MoverScore RoMe Systems r r r r r ADAPT 0.38 0.39 0.27 0.57 0.58 0.41 0.61 0.72 0.50 0.68 0.73 0.49 0.72 0.70 0.51 Baseline 0.35 0.42 0.26 0.49 0.49 0.33 0.49 0.50 0.35 0.59 0.61 0.43 0.53 0.53 0.37 melbourne 0.32 0.31 0.21 0.35 0.35 0.24 0.33 0.33 0.26 0.40 0.39 0.28 0.44 0.50 0.35 Pkuwriter 0.37 0.38 0.28 0.47 0.47 0.31 0.48 0.53 0.38 0.57 0.56 0.39 0.58 0.56 0.39 tilburg-nmt 0.25 0.20 0.13 0.26 0.26 0.18 0.38 0.39 0.30 0.49 0.50 0.36 0.64 0.68 0.50 tilburg-pipe 0.38 0.41 0.30 0.52 0.43 0.30 0.53 0.48 0.33 0.62 0.50 0.35 0.38 0.42 0.27 tilburg-smt 0.25 0.20 0.13 0.21 0.19 0.13 0.33 0.30 0.25 0.40 0.38 0.27 0.50 0.51 0.36 upf-forge 0.14 0.13 0.08 0.13 0.11 0.08 0.26 0.25 0.19 0.27 0.27 0.18 0.42 0.42 0.30 vietnam 0.73 0.80 0.62 0.87 0.90 0.72 0.81 0.76 0.70 0.90 0.78 0.73 0.84 0.89 0.83
Metrics BLEU METEOR BERTScore MoverScore RoMe Perturbation methods f s g f s g f s g f s g f s g Entity replacement 0.06 0.04 0.06 0.09 0.09 0.08 0.11 0.07 0.09 0.16 0.13 0.11 0.16 0.19 0.14 Adjective replacement 0.07 0.06 0.07 0.09 0.13 0.11 0.11 0.11 0.13 0.13 0.17 0.16 0.18 0.23 0.18 Random word replacement 0.05 0.06 0.03 0.06 0.06 0.05 0.11 0.10 0.08 0.11 0.13 0.09 0.15 0.15 0.23 Text transformation 0.03 0.01 0.03 0.08 0.09 0.07 0.13 0.15 0.15 0.15 0.18 0.19 0.18 0.19 0.21 Passive form 0.02 0.01 0.04 0.08 0.10 0.08 0.19 0.24 0.21 0.23 0.24 0.22 0.25 0.28 0.28
4.4 Results
Table 1 shows the performance of different metrics on data to language generation datasets (BAGEL and SFHOTEL). In both the BAGEL and SFHOTEL, a meaning representation (MR), for instance inform(name=’hotel drisco’,price_range=’pricey’) is given as a reference sentence, where the system output is: the hotel drisco is a pricey hotel, in this case. Although, RoMe outperformed the baseline metrics in evaluating the informativeness, naturalness and quality score, the correlation scores remain low with regard to human judgment. This is because the MR, which is not a natural sentence, is the reference statement in this scenario. For all the experiments, we take the normalized human judgement scores. We firstly evaluate our model using Fasttext Bojanowski et al. (2017) word embedding. We notice a significant improvement in results when we replace the Fasttext embedding with contextualized word embedding obtained from BERT Devlin et al. (2019). Furthermore, we experiment with multiple language models and finally, we reach to our best performing model with ALBERT-large Lan et al. (2020). In all the experiments, we report the results of RoMe, using ALBERT-large Lan et al. (2020). In Table 1, WMD and SDM refer to word mover distance and sentence mover distance, respectively, used in MoverScore. We report the results of WDM and SMD from Zhao et al. (2019).
Table 5 demonstrates the evaluation results on dialogue datasets. We evaluated the system-generated dialogues from three dialogue system models: Mem2Seq Madotto et al. (2018), GLMP Wu et al. (2019), and DialoGPT Zhang et al. (2020b). In case of in-car dataset, all the non-word-overlap metric achieved a better correlation score than the word-overlap based metrics. This is because generated responses in dialogue systems are assessed based on the overall semantic meaning and correctness of the information. Overall, RoMe achieves stronger correlation scores on both in-car and soccer dialogue datasets in evaluating several dialogue system outputs.
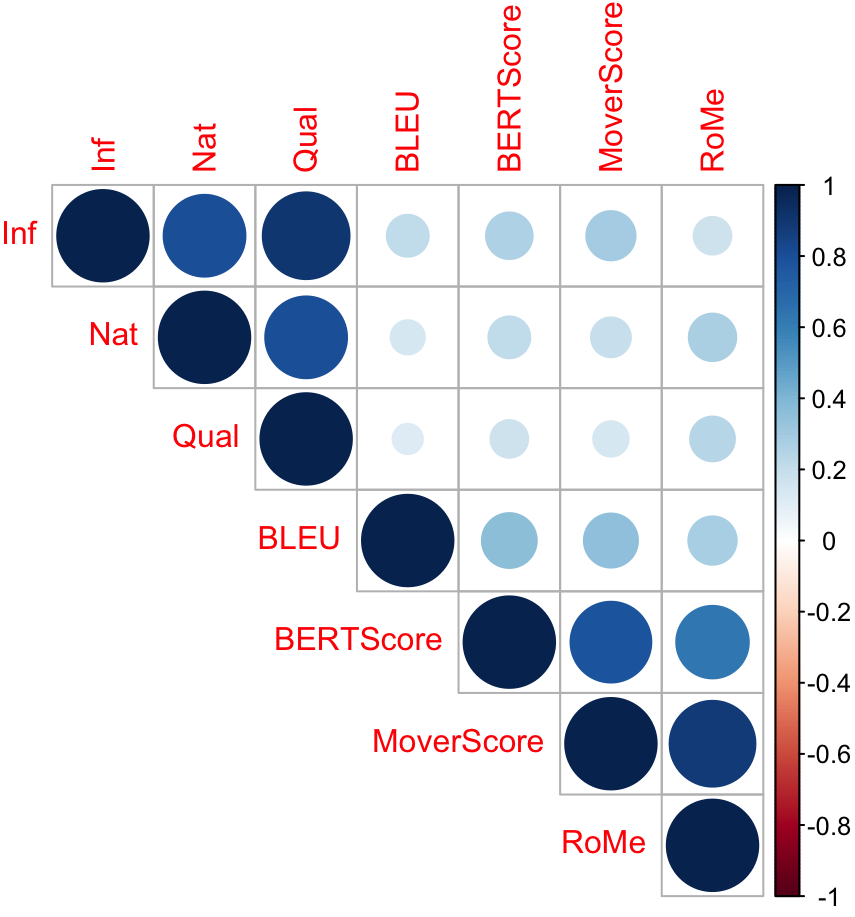
Finally, we investigate the outputs of nine distinct systems that competed in the WebNLG 2017 competition and report the correlation scores in Table 6. Although RoMe achieves the best correlation in most of the cases, we notice a comparable and in some cases better results achieved by the MoverScore Zhao et al. (2019). A correlation graph is plotted in Figure 5 to investigate the metrics’ performance correlations further. The graph is constructed from RoMe and baseline metrics’ scores on the BAGEL dataset. As observed from the correlation graph, we can infer that our proposed metric, RoMe correlates highly with the MoverScore. However, since RoMe handles both the syntactic and semantic properties of the text it achieved better results in all the datasets across different NLG tasks.
4.5 Ablation Study
We conduct an ablation study to investigate the impact of the RoMe’s components on its overall performance. Table 5 exhibits the incremental improvement in Spearman’s correlation coefficient, that each of the components brings to the metric. We randomly choose 100 system-generated dialogue utterances from the dialogue datasets, since they frequently contain sentences in passive form and repetitive words. The correlation of standard EMD with the human judgement is denoted as "RoMe score with ". Inclusion of semantic word alignment () and soft-penalization () further improved the correlation score. The classifier was not used until this point in the ablation since there was just one score. Moreover, the correlation score improved significantly when the semantically enhanced TED and grammatical acceptability were introduced as features in addition to the EMD score to a neural classifier. We hypothesize that the inclusion of language features related to grammar and syntactic similarity helped the neural network achieve better performance.
4.6 Qualitative Analysis
RoMe is developed in a modular fashion, so it may be used to generate scores for semantic similarity, syntactic similarity, and grammatical acceptability separately. Table 2 shows the component-wise score and the final score of RoMe on three example data points. In the first example, RoMe demonstrates its ability of capturing similar sentences by obtaining high score. The scores from several components in the second example demonstrate RoMe’s ability to handle passive form. The final example in Table 2 demonstrates that RoMe penalizes sentence with repetitive word.
Table 3 shows the performance of the three baselines and RoMe in handling erroneous cases. Although the first example contains a completely different hypothesis and the second case with repetitive hypothesis both BERTScore and MoverScore exhibit high score. On the contrary, BLEU score is unable to handle such scenarios. However, by obtaining low scores, RoMe demonstrates its ability to understand such cases better.
4.7 Robustness Analysis
In this section, we design five test cases to stress the models’ capabilities. For the analysis purpose, we randomly sample data points from KELM Agarwal et al. (2021) (cases 1, 2, and 4) and BAGEL Mairesse et al. (2010) (cases 3 and 5). The annotators annotate the sampled data points on the following criteria: fluency, semantic correctness, grammatical correctness.
Case 1: Entity replacement.
We perform invariance test (INV) from Ribeiro et al. (2020) to check the metrics’ NER capability in assessing the text quality. In this approach, we replace the entities present in the text partially or fully with other entities in the dataset. For instance, "The population of Germany" gets transformed to "The population of England".
Case 2: Adjective replacement.
Similar to the entity replacement, in this case we choose 100 data points from KELM that contain adjective in them. Then we replace the adjectives with a synonym and an antonym word to generate two sentences from a single data point. For instance, the adjective different is replaced with unlike and same. At the end of this process, we obtain 200 data points.
Case 3: Random word replacement.
The words in different positions in the text are replaced by a generic token AAA following the adversarial text attack method from Morris et al. (2020), in this case. For instance, the sentence, "x is a cheap restaurant near y" is transformed into "x is a cheap restaurant AAA AAA". We select the greedy search method with the constraints on stop-words modification from the TextAttack tool. This approach generates repetitive words when two consecutive words are replaced.
Case 4: Text transformation.
We leverage TextFooler Jin et al. (2020) to replace two words in the texts by similar words, keeping the semantic meaning and grammar preserved.
Case 5: Passive forms.
In this case, we randomly choose 200 data points from the KELM Agarwal et al. (2021) dataset where the system generated responses are in passive form.
From the results of robustness analysis in Table 7, it is evident that almost all the metrics obtain very low correlation scores with respect to human judgment. Word-overlap based metrics such as BLEU and METEOR mostly suffer from it. Although RoMe achieves higher correlation scores in most of the cases, there are still scope for improvement in handling the fluency of the text better. Text perturbation techniques used to design the test cases often generate disfluent texts. In some cases, the texts’ entities or subjects get replaced by words from out of the domain. From our observation, we hypothesize that handling keywords such as entities may lead to a better correlation score.
5 Related Work
A potentially good evaluation metric is one that correlates highly with human judgment. Among the unsupervised approaches, BLEU Papineni et al. (2002), METEOR Banerjee and Lavie (2005) and ROUGE Lin (2004) are the most popular evaluation metrics traditionally used for evaluating NLG systems. Although these metrics perform well in evaluating machine translation (MT) and summarization tasks, Liu et al. (2016) shows that none of the word overlap based metrics is close to human level performance in dialogue system evaluation scenarios. In a different line of work, word embedding based metrics are introduced for evaluating NLG systems Mikolov et al. (2013); Matsuo et al. (2017). Several unsupervised automated metrics were proposed that leverage EMD; one of them is word mover’s distance (WMD) Kusner et al. (2015). Later, Matsuo et al. (2017) proposed an evaluation metric, incorporating WMD and word-embedding, where they used word alignment between the reference and hypothesis to handle the word-order problem. Recently, Echizen-ya et al. (2019) introduced an EMD-based metric WE_WPI that utilizes the word-position information to tackle the differences in surface syntax in reference and hypothesis.
Several supervised metrics were also proposed for evaluating NLG. ADEM Lowe et al. (2017) uses a RNN-based network to predict the human evaluation scores. With the recent development of language model-based pre-trained models Zhang et al. (2020a) proposed BERTScore, which uses a pre-trained BERT model for evaluating various NLG tasks such as machine translation and image captions. Recently, Zhao et al. (2019) proposed MoverScore, which utilizes contextualized embedding to compute the mover’s score on word and sentence level. A notable difference between MoverScore and BERTScore is that the latter relies on hard alignment compared to soft alignments in the former. Unlike the previous methods, RoMe focuses on handling the sentence’s word repetition and passive form when computing the EMD score. Furthermore, RoMe trains a classifier by considering the sentence’s semantic, syntactic, and grammatical acceptability features to generate the final evaluation score.
6 Conclusion
We have presented RoMe, an automatic and robust evaluation metric for evaluating a variety of NLG tasks. The key contributions of RoMe include 1) EMD-based semantic similarity, where hard word alignment and soft-penalization techniques are employed into the EMD for tackling repetitive words and passive form of the sentence, 2) semantically enhanced TED that computes the syntactic similarity based on the node-similarity of the parsed dependency trees, 3) grammatical acceptability classifier, which evaluates the text’s grammatical quality, and 4) robustness analysis, which assesses the metric’s capability of handling various form of the text. Both quantitative and qualitative analyses exhibit that RoMe highly correlates with human judgment. We intend to extend RoMe by including more languages in the future.
Acknowledgements
We acknowledge the support of the following projects: SPEAKER (BMWi FKZ 01MK20011A), JOSEPH (Fraunhofer Zukunftsstiftung), OpenGPT-X (BMWK FKZ 68GX21007A), the excellence clusters ML2R (BmBF FKZ 01 15 18038 A/B/C), ScaDS.AI (IS18026A-F) and TAILOR (EU GA 952215).
References
- Agarwal et al. (2021) Oshin Agarwal, Heming Ge, Siamak Shakeri, and Rami Al-Rfou. 2021. Knowledge graph based synthetic corpus generation for knowledge-enhanced language model pre-training. In Proceedings of the 2021 Conference of the North American Chapter of the Association for Computational Linguistics: Human Language Technologies, pages 3554–3565, Online. Association for Computational Linguistics.
- Banerjee and Lavie (2005) Satanjeev Banerjee and Alon Lavie. 2005. Meteor: An automatic metric for mt evaluation with improved correlation with human judgments. In Proceedings of the acl workshop on intrinsic and extrinsic evaluation measures for machine translation and/or summarization, pages 65–72.
- Bojanowski et al. (2017) Piotr Bojanowski, Edouard Grave, Armand Joulin, and Tomas Mikolov. 2017. Enriching word vectors with subword information. Transactions of the Association for Computational Linguistics, 5:135–146.
- Chaudhuri et al. (2019) Debanjan Chaudhuri, Md Rashad Al Hasan Rony, Simon Jordan, and Jens Lehmann. 2019. Using a kg-copy network for non-goal oriented dialogues. In International Semantic Web Conference, pages 93–109. Springer.
- Chaudhuri et al. (2021) Debanjan Chaudhuri, Md Rashad Al Hasan Rony, and Jens Lehmann. 2021. Grounding dialogue systems via knowledge graph aware decoding with pre-trained transformers. In Eighteenth Extended Semantic Web Conference - Research Track.
- Dale and Mellish (1998) Robert Dale and Chris Mellish. 1998. Towards evaluation in natural language generation. In In Proceedings of First International Conference on Language Resources and Evaluation.
- Devlin et al. (2019) Jacob Devlin, Ming-Wei Chang, Kenton Lee, and Kristina Toutanova. 2019. BERT: Pre-training of deep bidirectional transformers for language understanding. In Proceedings of the 2019 Conference of the North American Chapter of the Association for Computational Linguistics: Human Language Technologies, Volume 1 (Long and Short Papers), pages 4171–4186, Minneapolis, Minnesota. Association for Computational Linguistics.
- Echizen-ya et al. (2019) Hiroshi Echizen-ya, Kenji Araki, and Eduard Hovy. 2019. Word embedding-based automatic mt evaluation metric using word position information. In Proceedings of the 2019 Conference of the North American Chapter of the Association for Computational Linguistics: Human Language Technologies, Volume 1 (Long and Short Papers), pages 1874–1883.
- Eric et al. (2017) Mihail Eric, Lakshmi Krishnan, Francois Charette, and Christopher D. Manning. 2017. Key-value retrieval networks for task-oriented dialogue. In Proceedings of the 18th Annual SIGdial Meeting on Discourse and Dialogue, pages 37–49, Saarbrücken, Germany. Association for Computational Linguistics.
- Hall and Novák (2010) Keith Hall and Václav Novák. 2010. Corrective dependency parsing. Trends in Parsing Technology, pages 151–167.
- Hendrycks and Gimpel (2016) Dan Hendrycks and Kevin Gimpel. 2016. Gaussian error linear units (gelus). arXiv preprint arXiv:1606.08415.
- Jin et al. (2020) Di Jin, Zhijing Jin, Joey Tianyi Zhou, and Peter Szolovits. 2020. Is bert really robust? a strong baseline for natural language attack on text classification and entailment. In Proceedings of the AAAI conference on artificial intelligence, volume 34, pages 8018–8025.
- Kusner et al. (2015) Matt Kusner, Yu Sun, Nicholas Kolkin, and Kilian Weinberger. 2015. From word embeddings to document distances. In International conference on machine learning, pages 957–966.
- Kutuzov and Kuzmenko (2019) Andrey Kutuzov and Elizaveta Kuzmenko. 2019. To lemmatize or not to lemmatize: How word normalisation affects ELMo performance in word sense disambiguation. In Proceedings of the First NLPL Workshop on Deep Learning for Natural Language Processing, pages 22–28, Turku, Finland. Linköping University Electronic Press.
- Lan et al. (2020) Zhenzhong Lan, Mingda Chen, Sebastian Goodman, Kevin Gimpel, Piyush Sharma, and Radu Soricut. 2020. Albert: A lite bert for self-supervised learning of language representations. In International Conference on Learning Representations.
- Lin (2004) Chin-Yew Lin. 2004. ROUGE: A package for automatic evaluation of summaries. In Text Summarization Branches Out, pages 74–81, Barcelona, Spain. Association for Computational Linguistics.
- Liu et al. (2016) Chia-Wei Liu, Ryan Lowe, Iulian Serban, Mike Noseworthy, Laurent Charlin, and Joelle Pineau. 2016. How NOT to evaluate your dialogue system: An empirical study of unsupervised evaluation metrics for dialogue response generation. In Proceedings of the 2016 Conference on Empirical Methods in Natural Language Processing, pages 2122–2132, Austin, Texas. Association for Computational Linguistics.
- Lowe et al. (2017) Ryan Lowe, Michael Noseworthy, Iulian Vlad Serban, Nicolas Angelard-Gontier, Yoshua Bengio, and Joelle Pineau. 2017. Towards an automatic Turing test: Learning to evaluate dialogue responses. In Proceedings of the 55th Annual Meeting of the Association for Computational Linguistics (Volume 1: Long Papers), pages 1116–1126, Vancouver, Canada. Association for Computational Linguistics.
- Madotto et al. (2018) Andrea Madotto, Chien-Sheng Wu, and Pascale Fung. 2018. Mem2Seq: Effectively incorporating knowledge bases into end-to-end task-oriented dialog systems. In Proceedings of the 56th Annual Meeting of the Association for Computational Linguistics (Volume 1: Long Papers), pages 1468–1478, Melbourne, Australia. Association for Computational Linguistics.
- Mairesse et al. (2010) François Mairesse, Milica Gašić, Filip Jurčíček, Simon Keizer, Blaise Thomson, Kai Yu, and Steve Young. 2010. Phrase-based statistical language generation using graphical models and active learning. In Proceedings of the 48th Annual Meeting of the Association for Computational Linguistics, ACL ’10, page 1552–1561, USA. Association for Computational Linguistics.
- Matsuo et al. (2017) Junki Matsuo, Mamoru Komachi, and Katsuhito Sudoh. 2017. Word-alignment-based segment-level machine translation evaluation using word embeddings. arXiv preprint arXiv:1704.00380.
- Mikolov et al. (2013) Tomas Mikolov, Ilya Sutskever, Kai Chen, Greg S Corrado, and Jeff Dean. 2013. Distributed representations of words and phrases and their compositionality. In Advances in neural information processing systems, pages 3111–3119.
- Morris et al. (2020) John Morris, Eli Lifland, Jin Yong Yoo, Jake Grigsby, Di Jin, and Yanjun Qi. 2020. Textattack: A framework for adversarial attacks, data augmentation, and adversarial training in nlp. In Proceedings of the 2020 Conference on Empirical Methods in Natural Language Processing: System Demonstrations, pages 119–126.
- Novikova et al. (2017) Jekaterina Novikova, Ondřej Dušek, Amanda Cercas Curry, and Verena Rieser. 2017. Why we need new evaluation metrics for NLG. In Proceedings of the 2017 Conference on Empirical Methods in Natural Language Processing, pages 2241–2252, Copenhagen, Denmark. Association for Computational Linguistics.
- Oya (2020) Masanori Oya. 2020. Syntactic similarity of the sentences in a multi-lingual parallel corpus based on the euclidean distance of their dependency trees. In Proceedings of the 34th Pacific Asia Conference on Language, Information and Computation, pages 225–233.
- Papineni et al. (2002) Kishore Papineni, Salim Roukos, Todd Ward, and Wei-Jing Zhu. 2002. Bleu: a method for automatic evaluation of machine translation. In Proceedings of the 40th annual meeting on association for computational linguistics, pages 311–318. Association for Computational Linguistics.
- Qi et al. (2020) Peng Qi, Yuhao Zhang, Yuhui Zhang, Jason Bolton, and Christopher D. Manning. 2020. Stanza: A Python natural language processing toolkit for many human languages. In Proceedings of the 58th Annual Meeting of the Association for Computational Linguistics: System Demonstrations.
- Ribeiro et al. (2020) Marco Tulio Ribeiro, Tongshuang Wu, Carlos Guestrin, and Sameer Singh. 2020. Beyond accuracy: Behavioral testing of NLP models with CheckList. In Proceedings of the 58th Annual Meeting of the Association for Computational Linguistics, pages 4902–4912, Online. Association for Computational Linguistics.
- Rubner et al. (1998) Yossi Rubner, Carlo Tomasi, and Leonidas J Guibas. 1998. A metric for distributions with applications to image databases. In Sixth International Conference on Computer Vision (IEEE Cat. No. 98CH36271), pages 59–66. IEEE.
- Shimorina et al. (2018) Anastasia Shimorina, Claire Gardent, Shashi Narayan, and Laura Perez-Beltrachini. 2018. WebNLG Challenge: Human Evaluation Results. Technical report, Loria & Inria Grand Est.
- Warstadt et al. (2019) Alex Warstadt, Amanpreet Singh, and Samuel R. Bowman. 2019. Neural network acceptability judgments. Transactions of the Association for Computational Linguistics, 7:625–641.
- Wen et al. (2015) Tsung-Hsien Wen, Milica Gašić, Nikola Mrkšić, Pei-Hao Su, David Vandyke, and Steve Young. 2015. Semantically conditioned LSTM-based natural language generation for spoken dialogue systems. In Proceedings of the 2015 Conference on Empirical Methods in Natural Language Processing, pages 1711–1721, Lisbon, Portugal. Association for Computational Linguistics.
- Wu et al. (2019) Chien-Sheng Wu, Richard Socher, and Caiming Xiong. 2019. Global-to-local memory pointer networks for task-oriented dialogue. In Proceedings of the International Conference on Learning Representations (ICLR).
- Zhang and Shasha (1989) Kaizhong Zhang and Dennis Shasha. 1989. Simple fast algorithms for the editing distance between trees and related problems. SIAM journal on computing, 18(6):1245–1262.
- Zhang et al. (2020a) Tianyi Zhang, Varsha Kishore, Felix Wu, Kilian Q. Weinberger, and Yoav Artzi. 2020a. Bertscore: Evaluating text generation with bert. In International Conference on Learning Representations.
- Zhang et al. (2020b) Yizhe Zhang, Siqi Sun, Michel Galley, Yen-Chun Chen, Chris Brockett, Xiang Gao, Jianfeng Gao, Jingjing Liu, and Bill Dolan. 2020b. DIALOGPT : Large-scale generative pre-training for conversational response generation. In Proceedings of the 58th Annual Meeting of the Association for Computational Linguistics: System Demonstrations, pages 270–278, Online. Association for Computational Linguistics.
- Zhao et al. (2019) Wei Zhao, Maxime Peyrard, Fei Liu, Yang Gao, Christian M. Meyer, and Steffen Eger. 2019. MoverScore: Text generation evaluating with contextualized embeddings and earth mover distance. In Proceedings of the 2019 Conference on Empirical Methods in Natural Language Processing and the 9th International Joint Conference on Natural Language Processing (EMNLP-IJCNLP), pages 563–578, Hong Kong, China. Association for Computational Linguistics.
Appendix A Appendix
A.1 Dependency Tree Representation for Tree Edit Distance Calculation
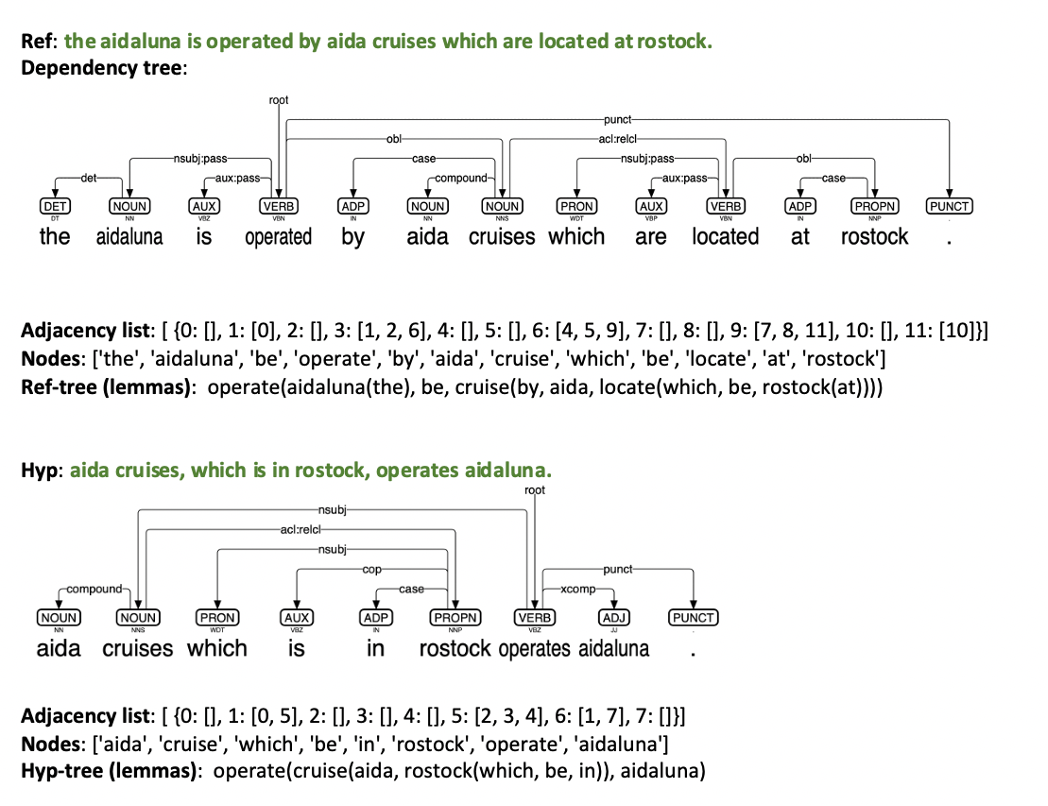
This section describes the process of parsing a dependency tree from a sentence, followed by converting the dependency tree to the adjacency list for computing TED-SE. Let us consider a reference statement "the aidaluna is operated by aida cruises which are located at rostock." and a hypothesis, "aida cruises, which is in rostock, operates aidaluna.". First, a dependency tree is parsed utilizing the Stanza dependency parser Qi et al. (2020) and then converted to an adjacency list. The adjacency list contains a key-value pair oriented data structure where each key corresponds to a node’s index in the tree, and the value is a list of edges on which the head node is incident. Figure 6 demonstrates the dependency trees and their corresponding adjacency lists for the given reference and hypothesis. List of nodes and adjacency lists are then fed into the TED-SE algorithm to calculate semantically enhanced tree edit distance as described in §3.2.
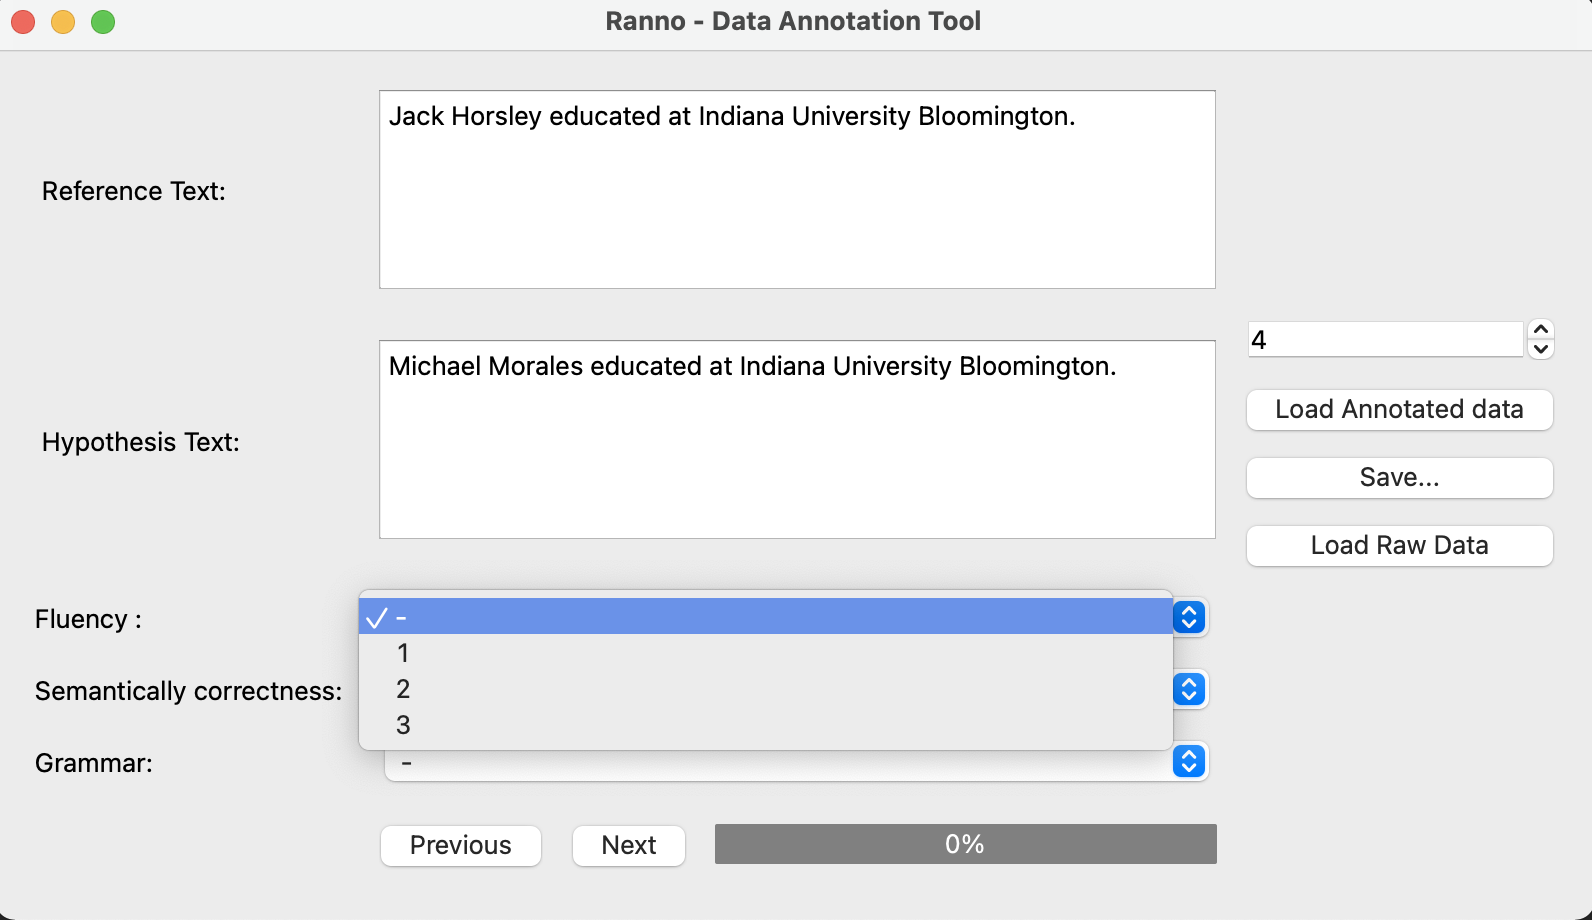
A.2 Annotation Tool
For all the annotation processes, we use the annotation tool shown in Figure 7. The tool is developed using Python programming language. Annotators can load their data into the tool in JSON format by selecting the Load Raw Data button. An example annotation step is shown in Figure 7. The reference and hypothesis sentences are displayed in different text windows. The annotators were asked to annotate the data based on Fluency, Semantically correctness and Grammar. Annotators can choose a value on a scale of [1,3] for each category, from the corresponding drop-down option. Finally, the annotated text can be saved for evaluation using the save button, which saves the annotated data in JSON format.