11email: mehrnoosh.tahani@nrc.ca 22institutetext: Physics & Astronomy, University of Victoria, Victoria, British Columbia, Canada 33institutetext: Physics & Astronomy, University of Calgary, Calgary, Alberta, Canada 44institutetext: Dunlap Institute for Astronomy and Astrophysics University of Toronto, Toronto, ON M5S 3H4, Canada 55institutetext: Department of Physics, Graduate School of Science, Nagoya University, Furo-cho, Chikusa-ku, Nagoya 464-8602, Japan 66institutetext: Korea Astronomy and Space Science Institute, 776 Daedeok-daero, 34055 Daejeon, Republic of Korea 77institutetext: Université de Paris and Université Paris Saclay, CEA, CNRS, AIM, F-91190 Gif-sur-Yvette, France 88institutetext: Herzberg Astronomy and Astrophysics Research Centre, National Research Council Canada, 5071 West Saanich Road, Victoria BC V9E 2E7, Canada 99institutetext: Department of Earth Science and Astronomy, Graduate School of Arts and Sciences, The University of Tokyo, 3-8-1 Komaba, Meguro, Tokyo 153-8902, Japan 1010institutetext: Department of Astrophysics/IMAPP, Radboud University, P.O. Box 9010, 6500 GL Nijmegen, The Netherlands
Orion A’s complete 3D magnetic field morphology
Magnetic fields permeate the interstellar medium and are important in the star formation process. Determining the 3D magnetic fields of molecular clouds will allow us to better understand their role in the evolution of these clouds and formation of stars. We fully reconstruct the approximate three-dimensional (3D) magnetic field morphology of the Orion A molecular cloud (on scales of a few to pc) using Galactic magnetic field models, as well as present line-of-sight and plane-of-sky magnetic field observations. While previous studies identified the 3D magnetic field morphology of the Orion A cloud as an arc shape, in this study we provide the orientation of this arc-shaped field and its plane-of-sky direction, for the first time. We find that this 3D field is a tilted, semi-convex (from our point of view) structure and mostly points in the direction of decreasing latitude and longitude on the plane of the sky, from our vantage point. The previously identified bubbles and events in this region were key in shaping this arc-shaped magnetic field morphology.
Key Words.:
magnetic fields, ISM: clouds, ISM: magnetic fields, stars: formation1 Introduction
The role of magnetic fields on different scales of star formation (from the formation of clouds to the formation of stars) is poorly understood. A major limitation in this understanding is the lack of knowledge of the three-dimensional (3D) magnetic fields in the interstellar medium (ISM). Multi-wavelength magnetic field observations are necessary to determine the 3D magnetic fields associated with star-forming regions.
Far-infrared dust polarized emission (e.g., Houde et al. 2004; Poidevin et al. 2011; Fissel et al. 2016; Pattle & Fissel 2019; Doi et al. 2020) and near-infrared/optical (e.g., Pereyra & Magalhães 2004; Clemens et al. 2020) starlight polarization observations have enabled us to probe the plane-of-sky orientation of magnetic fields () in a number of molecular clouds. Dust polarization observations revealed that magnetic field lines tend to be perpendicular to high column density ( cm-2) filamentary structures (Planck Collaboration et al. 2016a, c), allowing for greater mass accumulations and denser filaments (e.g., Inoue et al. 2018; Hennebelle & Inutsuka 2019).
Radio observations of Faraday rotation (Tahani et al. 2018) and Zeeman measurements (e.g., Goodman et al. 1989; Heiles 1997; Troland & Crutcher 2008) have been used to probe the line-of-sight magnetic fields () of molecular clouds. Tahani et al. (2018) developed a new technique based on Faraday rotation measurements for determining the strength and direction of associated with molecular clouds111Tahani et al. (2018) code for determining is available at https://github.com/MehrnooshTahani/MappingBLOS_MolecularClouds. In this technique they incorporated an approach based on relative measurements to estimate the amount of rotation measure (RM) caused by molecular clouds, using RM data from Taylor et al. (2009). To extract the magnetic field strengths from the RMs, they estimated the electron column density of the molecular cloud at the position of each RM point using a chemical evolution code (Gibson et al. 2009) and extinction maps for each cloud.
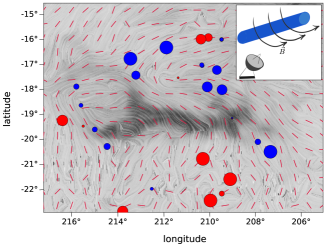
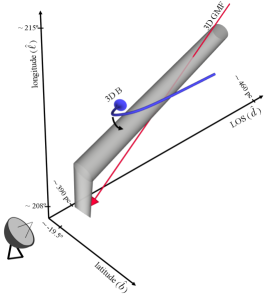
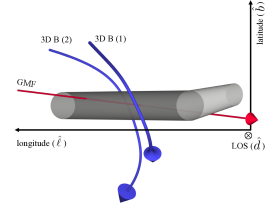
The observations of and are slowly paving the way for the determination of 3D magnetic fields of molecular clouds. Tahani et al. (2019) investigated the 3D magnetic field morphology of the Orion A molecular cloud using both (Tahani et al. 2018) and (Planck Collaboration et al. 2016c) observations. The line-of-sight magnetic field observations in this region showed that the reverses direction from one side of this filamentary-shaped cloud to the other (perpendicular to the filament axis; illustrated in Fig. 1). Tahani et al. (2019) constructed models to account for this reversal and compared their synthetic observations to the observed and . Using Monte-Carlo simulations and chi-squared probability values (as well as examining systematic biases between the two observing techniques), they concluded that an arc-shaped222Also referred to as bow-shaped; pronounced /bō/ as in rainbow or bow and arrow magnetic field morphology was the most likely magnetic structure for the Orion A molecular cloud.
This arc-shaped morphology is illustrated in the inset of Fig. 1. The background gray-scale image in this figure depicts the visual extinction map of Orion A (in units of magnitude of visual extinction or ; Kainulainen et al. 2009), and the red and drapery lines (made using the line integration convolution technique333https://pypi.org/project/licpy/, Cabral & Leedom 1993) show the observed by the Planck Space Observatory, with blue (red) circles indicating magnetic fields toward (away from) us. The magnetic field on the Galactic north side of the cloud points toward us, while on the Galactic south side it points away from us. This reversal was previously observed using Zeeman measurements in the study of Heiles (1997), which predicted an arc-shaped magnetic field morphology caused by recurrent shocks from nearby supernovae in the Orion-Eridanus superbubble.
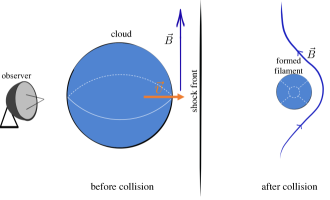
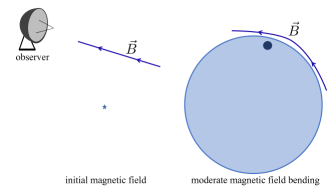
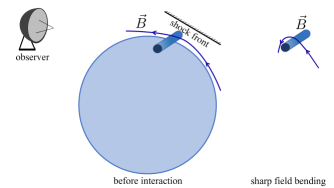
An arc-shaped magnetic field morphology has also been generated in the ideal magnetohydrodynamic simulations of Inoue et al. (2018) and Inoue & Fukui (2013), and predicted in the Inutsuka et al. (2015) molecular-cloud-formation model (also see Inutsuka et al. 2016). Multiple compressions caused by expanding ISM bubbles are required for the formation of filamentary molecular clouds in the Inutsuka et al. (2015) model, where magnetic field lines with a component perpendicular to the direction of bubble expansion or propagation can be bent. Figure 2 depicts a schematic cartoon of this interaction, which occurs between a relatively dense cloud ( cm-3) and a shock wave propagating in low density gas (H\scaleto1.2ex) and bends the field lines around the formed filament. We refer to this cloud-formation model as the shock-cloud interaction (SCI) model.
While previous studies described the magnetic field morphology of the Orion A cloud as having an arc shape, its complete 3D orientation and direction (particularly when projected onto the plane of the sky) remained unknown, even in the 3D magnetic field study by Tahani et al. (2019). In this study, the complete 3D magnetic field morphology of the Orion A molecular cloud, including its direction and bending orientation, is reconstructed from data. To this end, we employ Galactic magnetic field (GMF) models, the data of Tahani et al. (2018), and the observed by the Planck Space Observatory (whereas in Tahani et al. (2019) only and observations were used). We present our approach and results in Sect. 2, discuss the role of surrounding structures, bubbles, and events in formation of this 3D field in Sect. 3, and provide a summary and conclusion in Sect. 4. Supplemental material, including the data used in this study (see Appendix A), are provided in the appendix sections.
2 Results: 3D magnetic field morphology of Orion A
We recreate the 3D magnetic field shape of the Orion A molecular cloud using GMF vectors as initial magnetic fields, the orientation of reversal, and morphology (under the assumption of an arc-shaped magnetic morphology). To approximate the direction of the initial magnetic fields, we use the GMF model of Jansson & Farrar (2012), neglecting the isotropic random field components (caused by ISM turbulence). We refer to this structure as the “Coherent GMF” model. Figure 3 illustrates these GMF vectors projected onto the plane of the sky (red arrows) at the location of Orion A.
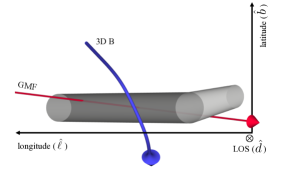
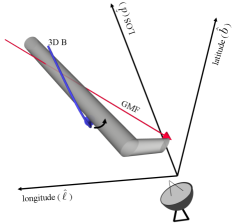
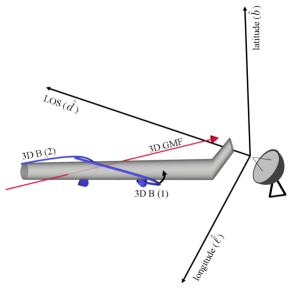
To best describe the GMF vectors, we employ a frame of reference in this region (see Fig. 4), with its axes pointing in the increasing directions of longitude (), latitude (), and distance () at Orion A’s plane-of-sky location (where , , and are unit vectors). The GMF direction in this region can be described as a unit vector of . This vector appears mostly parallel to Orion A when projected onto the plane of the sky, but has a large component along the line of sight (pointing toward us). This vector is consistent with previous GMF studies (e.g., Van Eck et al. 2011, see their Fig. 6), with the same inclination angle and direction (45∘ to 50∘ with respect to the plane of the sky; e.g., Oren & Wolfe 1995; Heiles 1997).
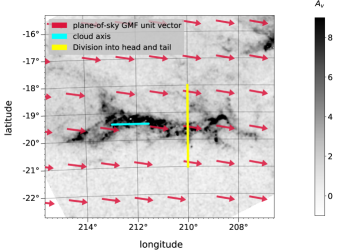
We also need to account for the inclination angle of Orion A when reconstructing its 3D magnetic field. Großschedl et al. (2018) demonstrated that the majority of Orion A has a high inclination angle with respect to the plane of the sky. They divided the cloud into a head (longitudes less than ) and a tail (longitudes greater than , as depicted in Fig. 3), with the head running approximately parallel to the plane of the sky and the tail trending into the line of sight at an approximately inclination angle, as illustrated in Fig. 4.
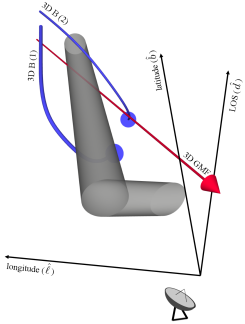
We reconstruct an arc-shaped morphology as depicted in Fig. 4, by connecting the approximate GMF vectors to the observations via an arc that accounts for the 3D orientation of the cloud and matches the morphology and the relative strengths. The initial magnetic field (the GMF) is depicted in this figure as a red vector pointing toward us, and the filament is shown with a gray cylindrical shape. The blue vector illustrates the reconstructed arc-shaped magnetic field morphology, which looks semi-convex (from our point of view) and points in the direction of decreasing latitude.
This 3D magnetic field morphology is an approximate large-scale configuration that ignores smaller-scale variations and fluctuations, enabling us to determine the direction and orientation of the arc, as well as the direction of magnetic fields projected onto the plane of sky. Therefore, small variations of this field could be possible as long as they remain consistent with the and observations, as well as the GMF vectors. While the majority of these variations are insignificant, rotations up to maximum along the black arrow shown in the middle and lower panels of Fig. 4 may be possible (also see Fig. 7), covering possible field shapes from the front to the back side of the cloud (that are consistent with the observations). The field shapes in this possible range remain semi-convex from our point of view and point in the decreasing latitude direction when projected onto the plane of the sky.
Moreover, while we did not directly consider field strengths when reconstructing the field lines, the results are consistent with observed strengths; the cloud has a stronger line-of-sight field component to its Galactic north side than to its Galactic south side. This is consistent with the observations of Tahani et al. (2018) and Zeeman measurements of Heiles (1997). The error-weighted average strength of the observations in both studies is twice as strong on the cloud’s Galactic north side as on the cloud’s Galactic south side. Finally, while we believe that this 3D field is the most probable and natural field morphology for the Orion A cloud, it does not completely rule out other possibilities. Future observations with a high rotation measure source density and improved resolution will allow us to more accurately and precisely determine the 3D fields.
3 Discussion
Our reconstructed 3D magnetic morphology is consistent with the SCI cloud-formation model, in which the surrounding environment (e.g., bubbles, events, structures, or sheet-like clouds) influenced and bent the field lines. In this section we discuss the formation of this arc-shaped morphology and environmental influences that shaped it.
3.1 Bubbles influencing the Orion A cloud
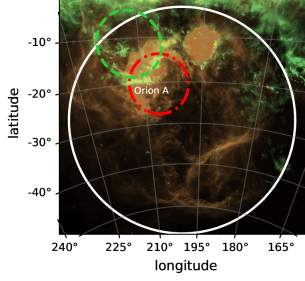
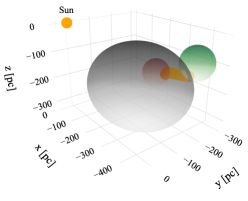
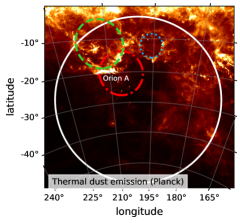
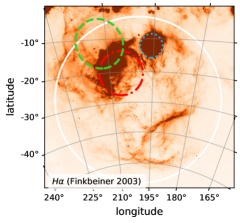
Orion-Eridanus superbubble: Orion A (located at pc from the Sun; Zucker et al. 2019) was likely shaped by energy release from the Orion OB association (Bally 2008). From the Sun, the cloud is seen in the projected interior of the Orion-Eridanus superbubble. Its distance puts it on the far side of the superbubble, but its location within, along, or beyond the bubble rim remains uncertain because of the complex composite structure of the superbubble (Ochsendorf et al. 2015; Joubaud et al. 2019). The stellar content (Voss et al. 2010), stellar age gradient (Bouy & Alves 2015; Zari et al. 2017), and X-ray temperature gradient (Joubaud et al. 2019) all indicate that the bubble has likely evolved in time and space from a near (150-200 pc away) to far distance (close to Orion A and B) after a 10- to 20-Myr-long series of supernova events. The approximate outline of the superbubble (based on Ochsendorf et al. 2015) is depicted in Fig. 5 as a white circle, with the background light-green and orange colors representing thermal dust (at 545 GHz) and H observations, respectively. Figure 6 illustrates a rough 3D approximation of the location of this superbubble as a gray ellipsoid, based on the 3D models of Pon et al. (2014) and Pon et al. (2016).
Großschedl et al. (2020b), Kounkel (2020), and Pellizza et al. (2005) found coherent stellar proper motion associated with the Orion region and the superbubble. Coherent proper motions observed by Großschedl et al. (2020a) and Kounkel (2020) are associated with the young stellar objects in the Orion A and B clouds, implying the influence of a feedback-driven event. Großschedl et al. (2020a) refers to this event as Orion-BB (big blast), whereas Kounkel (2020) links the coherent velocities to the Barnard’s loop. In general, these coherent velocities are likely indicative of feedback-driven (e.g., supernovae) impacts on the Orion A and B clouds and their young stellar objects.
Barnard’s loop: Barnard’s loop (Barnard 1894) is a complete bubble located within the Orion-Eridanus superbubble (Ochsendorf et al. 2015). The Barnard’s loop bubble, with an estimated age of yr, is expanding at a velocity of 100 km s-1 (Ochsendorf et al. 2015), while the Orion-Eridanus superbubble has an expansion velocity of km s-1 (Joubaud et al. 2019). This bubble is located between 340 pc and 400 pc from us (Großschedl et al. 2020b). Using Barnard’s loop and the Orion A cloud’s distances, we find that the Barnard’s loop bubble is likely in contact with (and has interacted with) Orion A’s head but not its tail, as depicted in Fig. 6. This could account for the tilt of Orion A’s head and the fact that the star formation rate in Orion A’s head is an order of magnitude greater than in its tail (Großschedl et al. 2020a). We predict that as the Barnard’s loop bubble expands, it will interact with Orion A and trigger a new star-formation sequence in the tail.
Orion dust ring: Schlafly et al. (2015) map the 3D dust and find a dust ring (indicating a bubble origin) between 400 pc and 550 pc (from us) in the Orion complex region. This dust ring is depicted in Fig. 5 as a green-dashed circle and is seen at more positive latitudes compared to Orion A. Schlafly et al. (2015) estimate the age of the bubble to be around 10 Myr or greater, because they find no evidence of H associated with the ring. A closer examination of Fig. 5, however, indicates that this ring may be visible in H observations. We roughly approximate the ring (and its original bubble) as a sphere (depicted in green in Fig. 6) with a radius of 150 pc and a center location of , , and pc.
3.2 Gradual formation of the arc-shaped field morphology
The bubbles detailed in Sect. 3.1 have influenced the evolution (and the formation) of the Orion A cloud and its magnetic field lines. These influences can be summarized in two steps: 1) recurrent interactions with old events or bubbles pushed the Orion A cloud, its ambient environment, and the field lines (toward more positive latitudes), resulting in large-scale bending of the initial Galactic magnetic field, as predicted by the simulations of Kim & Ostriker (2015). 2) Subsequently, further interactions (likely by the dust ring) pushed the H\scaleto1.2ex gas around the Orion A cloud (toward more negative latitudes), creating a sharp arc-shaped magnetic morphology associated with the Orion A cloud, as depicted in Fig. 4.
This two-step process is similar to that described in Tahani et al. (2022) for the Perseus molecular cloud (see Fig. 9 and Appendix D). In the first step, the Galactic magnetic fields are bent approximately tangential to expanding objects or bubbles (e.g., Orion-BB event or Orion-Eridanus superbubble). This results in magnetic field lines that are bent at Orion A’s location, point toward us on its Galactic north side, and are mostly parallel to the plane of the sky on its Galactic south side (and perpendicular to the formed filament main axis). Subsequently, the interaction with the dust ring bends these field lines even more, causing them to point away from us on the cloud’s Galactic south side. Therefore, the field lines on the Galactic north side of the cloud have a greater component along the line of sight compared to the Galactic south side of the cloud, as discussed in Sect. 2.
To examine this view further, we estimate the gas and magnetic field pressures (see Appendix E) before the formation of the Orion A cloud and in its present state. During the initial stages of the Orion A cloud formation, we find that the gas pressure is greater than the magnetic field pressure (using a Galactic magnetic field strength of G, particle volume density of a few to 100 cm-3, and ambient temperature of 1000 K and higher; Joubaud et al. 2019), implying that recurrent supernovae can easily bend the magnetic field lines, as seen in simulations of Kim & Ostriker (2015). Furthermore, using an average non-thermal velocity dispersion of a few () km s-1, we find an Alfvén Mach number of maximum , indicating that the field lines can retain a memory of the large-scale initial field morphology (with small-scale variations; cf. Han & Zhang 2007). As a result, when the field lines interact with bubbles and events in this region (such as the Orion-Eridanus superbubble or the Orion-BB event) and bend, they remain largely coherent (Kim & Ostriker 2015), rather than becoming completely distorted and perturbed (Li & Klein 2019).
To estimate the gas and magnetic field pressures in the Orion A molecular cloud in its current state, we use the error-weighted mean magnetic fields on two sides of the cloud (for detections pointing toward us and away from us), which are 87 G and G, respectively, based on the observations of Tahani et al. (2018). Using particle volume density and temperature values of cm-3 (e.g., Castets et al. 1990; Dutrey et al. 1993; Johnstone & Bally 1999a, b) and 25 K (e.g., Mitchell et al. 2001; Johnstone & Bally 2006; Buckle et al. 2012; Schnee et al. 2014), we find that the magnetic field pressure of the Orion A cloud is approximately one order of magnitude greater than its gas pressure (on both sides of the cloud). Using an average non-thermal velocity dispersion of 2 km s-1 (Goicoechea et al. 2020), we find Alfvén Mach numbers of and for the two sides of the Orion A molecular cloud. This implies that the field lines do not deform and if their magnetic field morphology changes (due to interaction with the environment), they retain a memory of their previous field morphology.
This gradual bending of the field lines is consistent with the cloud-formation model of Inutsuka et al. (2015). We also determine the H\scaleto1.2ex and CO line-of-sight velocities in this region (See Appendix C) and find no significant offset between the two, indicating that the offset velocities caused by bubble interactions have dissipated or are mostly in the plane of the sky. Given the morphology of the Orion A cloud (which is inclined along the line of sight) and the fact that the GMF vectors are parallel to the longitude axis and point toward us along the line of sight, the interactions necessary for the formation of the arc-shaped magnetic morphology are mostly parallel to the plane of the sky. Therefore, we expect that any velocity offsets that may hint at arc-shaped magnetic field morphology formation (and perhaps are not yet completely dissipated) should be parallel to the plane of the sky.
4 Summary and conclusions
We determine the large-scale (and approximate) 3D magnetic field shape of the Orion A molecular cloud using Galactic magnetic field models, as well as present line-of-sight and plane-of-sky magnetic field observations. From our perspective, this 3D field is generally semi-convex and points toward the decreasing longitude and decreasing latitude directions in the plane of the sky. To our knowledge, this is the first time that the complete 3D large-scale ( a few to pc) magnetic field of the Orion A cloud has been reconstructed (including its plane-of-sky direction). We suggest that the Orion-Eridanus superbubble (or events within it, such as the Orion-BB event) and the dust ring in this region are largely responsible for the development of the arc-shaped magnetic field morphology of Orion A.
Reconstructing the 3D magnetic field morphology of Orion A, which is consistent with the Planck observations when projected onto the plane of the sky, relies mainly on the initial Galactic magnetic fields and the observations. This 3D magnetic field is a large-scale approximation that neglects smaller-scale distortions or entanglements in the field lines. Because we are interested in relatively large-scale and approximate fields, the presence of low-density regions in the foreground of Orion A (especially those smaller than the size of the Orion A cloud and the scales at which the reversal was observed; Rezaei Kh. et al. 2020) has no effect on our results.
Acknowledgements.
We would like to express our appreciation to the anonymous referee for their thoughtful comments that helped us improve the results and paper. MT is grateful for the helpful discussion with Pak-Shing Li. We have used LaTeX, Python and its associated libraries including astropy (Astropy Collaboration et al. 2013) and plotly (Plotly Technologies Inc. 2015), PyCharm, Jupyter notebook, SAO Image DS9, the Starlink (Currie et al. 2014) software, the Hammurabi code, Shapr3D, and Adobe Draw for this work. For our line integration convolution plot, we used a Python function originally written by Susan Clark. QuillBot444https://quillbot.com/ was used for language editing purposes. The Dunlap Institute is funded through an endowment established by the David Dunlap family and the University of Toronto. J.L.W. acknowledges the support of the Natural Sciences and Engineering Research Council of Canada (NSERC) through grant RGPIN-2015-05948, and of the Canada Research Chairs program. Y.D. acknowledges the support of JSPS KAKENHI grant 18H01250. M.H. acknowledges funding from the European Research Council (ERC) under the European Union’s Horizon 2020 research and innovation programme (grant agreement No 772663).References
- Astropy Collaboration et al. (2013) Astropy Collaboration, Robitaille, T. P., Tollerud, E. J., et al. 2013, A&A, 558, A33
- Bally (2008) Bally, J. 2008, Overview of the Orion Complex, ed. B. Reipurth, Vol. 4, 459
- Barnard (1894) Barnard, E. E. 1894, Popular Astronomy, 2, 151
- Bouy & Alves (2015) Bouy, H. & Alves, J. 2015, A&A, 584, A26
- Buckle et al. (2012) Buckle, J. V., Davis, C. J., Di Francesco, J., et al. 2012, MNRAS, 422, 521
- Cabral & Leedom (1993) Cabral, B. & Leedom, L. C. 1993, Proceedings of the 20th annual conference on Computer graphics and interactive techniques
- Castets et al. (1990) Castets, A., Duvert, G., Dutrey, A., et al. 1990, A&A, 234, 469
- Clemens (1985) Clemens, D. P. 1985, ApJ, 295, 422
- Clemens et al. (2020) Clemens, D. P., Cashman, L. R., Cerny, C., et al. 2020, ApJS, 249, 23
- Currie et al. (2014) Currie, M. J., Berry, D. S., Jenness, T., et al. 2014, in Astronomical Society of the Pacific Conference Series, Vol. 485, Astronomical Data Analysis Software and Systems XXIII, ed. N. Manset & P. Forshay, 391
- Dame et al. (2001) Dame, T. M., Hartmann, D., & Thaddeus, P. 2001, ApJ, 547, 792
- Doi et al. (2020) Doi, Y., Hasegawa, T., Furuya, R. S., et al. 2020, ApJ, 899, 28
- Dutrey et al. (1993) Dutrey, A., Duvert, G., Castets, A., et al. 1993, A&A, 270, 468
- Finkbeiner (2003) Finkbeiner, D. P. 2003, ApJS, 146, 407
- Fissel et al. (2016) Fissel, L. M., Ade, P. A. R., Angilè, F. E., et al. 2016, ApJ, 824, 134
- Gibson et al. (2009) Gibson, D., Plume, R., Bergin, E., Ragan, S., & Evans, N. 2009, ApJ, 705, 123
- Goicoechea et al. (2020) Goicoechea, J. R., Pabst, C. H. M., Kabanovic, S., et al. 2020, A&A, 639, A1
- Goodman et al. (1989) Goodman, A. A., Crutcher, R. M., Heiles, C., Myers, P. C., & Troland, T. H. 1989, ApJ, 338, L61
- Großschedl et al. (2018) Großschedl, J. E., Alves, J., Meingast, S., et al. 2018, A&A, 619, A106
- Großschedl et al. (2020a) Großschedl, J. E., Alves, J., Meingast, S., & Hasenberger, B. 2020a, in Origins: From the Protosun to the First Steps of Life, ed. B. G. Elmegreen, L. V. Tóth, & M. Güdel, Vol. 345, 27–33
- Großschedl et al. (2020b) Großschedl, J. E., Alves, J., Meingast, S., & Herbst-Kiss, G. 2020b, arXiv e-prints, arXiv:2007.07254
- Han & Zhang (2007) Han, J. L. & Zhang, J. S. 2007, A&A, 464, 609
- Heiles (1997) Heiles, C. 1997, ApJS, 111, 245
- Hennebelle & Inutsuka (2019) Hennebelle, P. & Inutsuka, S.-i. 2019, Frontiers in Astronomy and Space Sciences, 6, 5
- HI4PI Collaboration et al. (2016) HI4PI Collaboration, Ben Bekhti, N., Flöer, L., et al. 2016, A&A, 594, A116
- Houde et al. (2004) Houde, M., Dowell, C. D., Hildebrand, R. H., et al. 2004, ApJ, 604, 717
- Imara & Blitz (2011) Imara, N. & Blitz, L. 2011, ApJ, 732, 78
- Inoue & Fukui (2013) Inoue, T. & Fukui, Y. 2013, ApJ, 774, L31
- Inoue et al. (2018) Inoue, T., Hennebelle, P., Fukui, Y., et al. 2018, PASJ, 70, S53
- Inutsuka et al. (2015) Inutsuka, S.-i., Inoue, T., Iwasaki, K., & Hosokawa, T. 2015, A&A, 580, A49
- Inutsuka et al. (2016) Inutsuka, S.-I., Inoue, T., Iwasaki, K., Hosokawa, T., & Kobayashi, M. I. N. 2016, in From Interstellar Clouds to Star-Forming Galaxies: Universal Processes?, ed. P. Jablonka, P. André, & F. van der Tak, Vol. 315, 61–68
- Ishii et al. (2019) Ishii, S., Nakamura, F., Shimajiri, Y., et al. 2019, PASJ, 71, S9
- Jansson & Farrar (2012) Jansson, R. & Farrar, G. R. 2012, ApJ, 757, 14
- Johnstone & Bally (1999a) Johnstone, D. & Bally, J. 1999a, ApJ, 510, L49
- Johnstone & Bally (1999b) Johnstone, D. & Bally, J. 1999b, in The Physics and Chemistry of the Interstellar Medium, ed. V. Ossenkopf, J. Stutzki, & G. Winnewisser
- Johnstone & Bally (2006) Johnstone, D. & Bally, J. 2006, ApJ, 653, 383
- Joubaud et al. (2019) Joubaud, T., Grenier, I. A., Ballet, J., & Soler, J. D. 2019, A&A, 631, A52
- Kainulainen et al. (2009) Kainulainen, J., Beuther, H., Henning, T., & Plume, R. 2009, A&A, 508, L35
- Kerp et al. (2011) Kerp, J., Winkel, B., Ben Bekhti, N., Flöer, L., & Kalberla, P. M. W. 2011, Astronomische Nachrichten, 332, 637
- Kim & Ostriker (2015) Kim, C.-G. & Ostriker, E. C. 2015, The Astrophysical Journal, 802, 99
- Kong et al. (2015) Kong, S., Lada, C. J., Lada, E. A., et al. 2015, ApJ, 805, 58
- Kounkel (2020) Kounkel, M. 2020, ApJ, 902, 122
- Li & Klein (2019) Li, P. S. & Klein, R. I. 2019, MNRAS, 485, 4509
- Ma et al. (2020) Ma, Y.-H., Wang, H.-C., Li, C., & Yang, J. 2020, Research in Astronomy and Astrophysics, 20, 060
- McClure-Griffiths et al. (2009) McClure-Griffiths, N. M., Pisano, D. J., Calabretta, M. R., et al. 2009, ApJS, 181, 398
- Mitchell et al. (2001) Mitchell, G. F., Johnstone, D., Moriarty-Schieven, G., Fich, M., & Tothill, N. F. H. 2001, ApJ, 556, 215
- Ochsendorf et al. (2015) Ochsendorf, B. B., Brown, A. G. A., Bally, J., & Tielens, A. G. G. M. 2015, ApJ, 808, 111
- Oren & Wolfe (1995) Oren, A. L. & Wolfe, A. M. 1995, ApJ, 445, 624
- Pattle & Fissel (2019) Pattle, K. & Fissel, L. 2019, Frontiers in Astronomy and Space Sciences, 6, 15
- Pellizza et al. (2005) Pellizza, L. J., Mignani, R. P., Grenier, I. A., & Mirabel, I. F. 2005, A&A, 435, 625
- Pereyra & Magalhães (2004) Pereyra, A. & Magalhães, A. M. 2004, ApJ, 603, 584
- Planck Collaboration et al. (2016a) Planck Collaboration, Adam, R., Ade, P. A. R., et al. 2016a, A&A, 586, A135
- Planck Collaboration et al. (2016b) Planck Collaboration, Adam, R., Ade, P. A. R., et al. 2016b, A&A, 596, A103
- Planck Collaboration et al. (2016c) Planck Collaboration, Ade, P. A. R., Aghanim, N., et al. 2016c, A&A, 586, A138
- Plotly Technologies Inc. (2015) Plotly Technologies Inc. 2015, Collaborative data science
- Poidevin et al. (2011) Poidevin, F., Bastien, P., & Jones, T. J. 2011, ApJ, 741, 112
- Pon et al. (2014) Pon, A., Johnstone, D., Bally, J., & Heiles, C. 2014, MNRAS, 444, 3657
- Pon et al. (2016) Pon, A., Ochsendorf, B. B., Alves, J., et al. 2016, ApJ, 827, 42
- Rezaei Kh. et al. (2020) Rezaei Kh., S., Bailer-Jones, C. A. L., Soler, J. D., & Zari, E. 2020, A&A, 643, A151
- Rice et al. (2016) Rice, T. S., Goodman, A. A., Bergin, E. A., Beaumont, C., & Dame, T. M. 2016, ApJ, 822, 52
- Schlafly et al. (2015) Schlafly, E. F., Green, G., Finkbeiner, D. P., et al. 2015, ApJ, 799, 116
- Schnee et al. (2014) Schnee, S., Mason, B., Di Francesco, J., et al. 2014, MNRAS, 444, 2303
- Tahani et al. (2022) Tahani, M., Lupypciw, W., Glover, J., et al. 2022, arXiv e-prints, arXiv:2201.04718
- Tahani et al. (2018) Tahani, M., Plume, R., Brown, J. C., & Kainulainen, J. 2018, A&A, 614, A100
- Tahani et al. (2019) Tahani, M., Plume, R., Brown, J. C., Soler, J. D., & Kainulainen, J. 2019, A&A, 632, A68
- Taylor et al. (2009) Taylor, A. R., Stil, J. M., & Sunstrum, C. 2009, ApJ, 702, 1230
- Troland & Crutcher (2008) Troland, T. H. & Crutcher, R. M. 2008, ApJ, 680, 457
- Van Eck et al. (2011) Van Eck, C. L., Brown, J. C., Stil, J. M., et al. 2011, ApJ, 728, 97
- Voss et al. (2010) Voss, R., Diehl, R., Vink, J. S., & Hartmann, D. H. 2010, A&A, 520, A51
- Waelkens et al. (2009) Waelkens, A., Jaffe, T., Reinecke, M., Kitaura, F. S., & Enßlin, T. A. 2009, A&A, 495, 697
- Winkel et al. (2016) Winkel, B., Kerp, J., Flöer, L., et al. 2016, A&A, 585, A41
- Zari et al. (2017) Zari, E., Brown, A. G. A., de Bruijne, J., Manara, C. F., & de Zeeuw, P. T. 2017, A&A, 608, A148
- Zucker et al. (2019) Zucker, C., Speagle, J. S., Schlafly, E. F., et al. 2019, ApJ, 879, 125
Appendix A Data used in the study
In this study, we use estimates of the initial magnetic field direction, line-of-sight magnetic fields, and velocities associated with each cloud. We use the Jansson & Farrar (2012) GMF model to determine the Galactic magnetic field. We employ the catalog of Tahani et al. (2018) for the magnetic field information, and available CO and H\scaleto1.2ex observations for the velocities.
A.1 Galactic magnetic field
The Jansson & Farrar (2012) model includes a two-dimensional (2D) thin-disk field component that is tightly coupled to the Galactic spiral arms, an azimuthal/toroidal halo field component, and an X-shaped vertical/out-of-plane field component. To estimate the GMF, we use the Hammurabi program555http://sourceforge.net/projects/hammurabicode/ (Waelkens et al. 2009), which is a synchrotron modelling code, that has been used in different studies (e.g., Planck Collaboration et al. 2016b; Jansson & Farrar 2012). We find the GMF vectors within a box around the Orion A cloud (), in the longitude range of to and latitude range of to . We set a resolution of one GMF vector per .
A.2 Line-of-sight magnetic field
We employ the observations of Tahani et al. (2018), in which they used Faraday rotation measurements to determine of molecular clouds. They used RM point sources along with an on-off approach based on relative measurements to decouple the molecular clouds’ contribution to RM from that caused by the rest of the Galaxy. They then calculated the strength of employing a chemical evolution code and the Kainulainen et al. (2009) extinction maps (for more details, see Tahani et al. 2018).
A.3 Velocity information
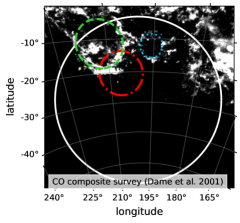
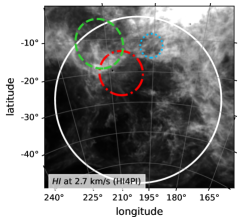
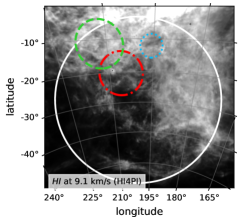
We consider both the available CO and H\scaleto1.2ex velocities to explore the line-of-sight velocities of the cloud and its surrounding environment. We obtain H\scaleto1.2ex velocity information from the all-sky database of the H\scaleto1.2ex Survey (HI4PI; HI4PI Collaboration et al. 2016), which is based on the Effelsberg-Bonn H\scaleto1.2ex Survey (EBHIS; Kerp et al. 2011; Winkel et al. 2016) and the Galactic All-Sky Survey (GASS; McClure-Griffiths et al. 2009). We use the radial velocities from the Dame et al. (2001) carbon monoxide survey, to determine the cloud’s CO velocity. This catalog is a survey of the 12CO J(1-0) spectral line of the Galaxy.
Appendix B 3D magnetic field sensitivity
As discussed in Sect. 2, the reconstructed 3D field is an approximation of the large-scale field, which allows for small-scale variations such as small rotations along the black arrow shown in the middle panel of Fig. 7. Rotations in other directions, on the other hand, are more sensitive and limited, as they do not produce the observed or . We emphasize that these variations must remain consistent with the GMF, as well as the and observations. The magnetic field that we reconstructed666The .obj files are available at https://github.com/MehrnooshTahani/OrionA3DMagneticFields in Sect. 2 is depicted as 3D B (1) in Fig. 7. Examining a large number of 3D field varieties, we find that rotations along the black arrow up to maximum may be possible (covering possible field morphologies from the front to the back side of the cloud), resulting in the arc-shaped field depicted as 3D B(2) in Fig. 7, which is semi-convex from our perspective and points in the direction of decreasing latitude.
Appendix C Velocity observations
To investigate the line-of-sight velocities of the cloud thoroughly, we first calculate the line-of-sight Galactic rotation velocities. We find a Galactic rotation velocity (LSR) of km s-1 for the Orion A cloud ( and pc), using the model of Clemens (1985) with the IAU standard values of the solar distance from the Galactic center (8.5 kpc) and orbital velocity (220 km s-1).
For H\scaleto1.2ex velocities, we select locations that have a single H\scaleto1.2ex peak emission and exclude those with multiple peaks, absorption, or self-absorption, as discussed in Tahani et al. (2022). Similarly, we pick points whose CO spectrum can be described primarily by a single Gaussian fit. For more accuracy, we take H\scaleto1.2ex and CO data from similar coordinates. These H\scaleto1.2ex and CO velocities agree with other studies at similar coordinates (e.g., Kong et al. 2015; Rice et al. 2016; Ishii et al. 2019; Ma et al. 2020). We note that average CO and HI velocities along the main axis of the cloud are close to Galactic rotation velocities at this location ( to km s-1).
Subsequently, we can find the molecular cloud velocities (CO) in the co-moving frame of the H\scaleto1.2ex gas using:
| (1) |
where is the cloud CO velocity in the co-moving H\scaleto1.2ex frame, is the CO velocity in the local standard of rest (LSR) frame and is the H\scaleto1.2ex velocity of the region in the LSR frame. To account for the velocity gradients and fluctuations along the cloud, we find on the cloud point by point (considering the peak emission of CO and H\scaleto1.2ex) and then take an average. This obtained value is km s-1 (where the uncertainty value is the standard deviation of the points), indicating that within the uncertainty range of the observations, there is no significant line-of-sight offset between the H\scaleto1.2ex and CO velocities in the Orion A cloud (also consistent with Fig. 1 of Imara & Blitz 2011).
This zero km s-1 line-of-sight average CO velocity in the co-moving H\scaleto1.2ex frame emphasizes the importance of considering the plane-of-sky environmental influences and their effect on the GMF vectors. Furthermore, since the GMF vectors fall parallel to the cloud on the plane of the sky and the cloud has a large inclination angle, it is even more critical to consider plane-of-sky influences and events (e.g., coherent velocities observed by Großschedl et al. 2020b) in order to fully understand the evolution of 3D magnetic fields in this region.
Appendix D Orion bubbles
We discussed the bubbles that influence the Orion A cloud in Sect. 3.1 and Sect. 3.2. The presence of these bubbles is further demonstrated by multi-wavelength observations shown in Fig. 8. Thermal dust, H, CO, and H\scaleto1.2ex observations are illustrated in this multi-panel figure, with the Orion-Eridanus superbubble, dust ring, Barnard’s loop, and the Orionis ring outlined as white, green dashed, red dash-dotted, and blue dotted circles, respectively.
In Sect. 3.2, we discussed the gradual evolution of initial magnetic field lines, resulting in the arc-shaped morphology depicted in Fig. 4. This evolution process is summarized in Fig. 9: 1) The first step (left panel) involves the bending of Galactic magnetic fields toward positive latitudes (by the Orion-Eridanus superbubble, or bubbles and events within, such as the Orion-BB event). At this stage field lines are bent at Orion A’s location, pointing toward us on its Galactic north side, and mostly parallel to the plane of the sky on the Galactic south side of the cloud (on the plane of the sky appearing mostly perpendicular to the main axis of the filament that is formed). 2) Following that (right panel), additional environmental influences, such as the dust ring, interact with the cloud’s surrounding H\scaleto1.2ex gas, further bending these field lines, causing them to point away from us on the cloud’s Galactic south side.
Appendix E Alfvén Mach number and gas and magnetic pressures
In Sect. 3.2, we calculated magnetic and gas pressures, as well as Alfvén Mach numbers, to elucidate the step-by-step evolution of the field lines that resulted in the arc-shaped morphology shown in Fig. 4. To estimate the magnetic and gas pressures, we used the following equations,
| (2) | ||||
where , , , , , and are the magnetic pressure, total strength of magnetic field, gas pressure, particle volume density, Boltzmann constant, and temperature, respectively.
To determine the Alfvén mach number, we used the following equation:
| (3) |
where is the non-thermal velocity dispersion and is the Alfvén wave group velocity. The Alfvén velocity can be obtained using
| (4) |
where B is the strength of magnetic field and is the volume density. Simulations by Li & Klein (2019) suggest that in the presence of strong fields (), magnetic field lines can coherently bend around a formed filamentary molecular cloud as a result of converging flows, whereas for , complete distortion of magnetic fields is expected.