2022
[1]\fnmKevser Irem \surDanaci
[1]\orgdivDepartment of Electrical Eng., \orgnameSivas University of Science And Technology, \orgaddress \countryTurkey
2]\orgdivThe Graduate School of Informatics, \orgnameMiddle East Technical University, \orgaddress \countryTurkey
A Survey on Infrared Image & Video Sets
Abstract
In this survey, we compile a list of publicly available infrared image and video sets for artificial intelligence and computer vision researchers. We mainly focus on IR image and video sets, which are collected and labelled for computer vision applications such as object detection, object segmentation, classification, and motion detection. We categorise 109 publicly available or private sets according to their sensor types, image resolution, and scale. We describe each set in detail regarding their collection purpose, operation environment, optical system properties, and application area. We also cover a general overview of fundamental concepts related to IR imagery, such as IR radiation, IR detectors, IR optics and application fields. We analyse the statistical significance of the entire corpus from different perspectives. This survey will be a guideline for computer vision and artificial intelligence researchers who want to delve into working with the spectra beyond the visible domain.
keywords:
Infrared Image & Video Sets, Infrared Imagery, Survey, Deep Learning Datasets1 Introduction
Artificial intelligence is based on data, which is the new defining element of science. In the past decade, machine learning techniques have evolved to the point where they are now capable of processing larger data sets than humans could ever imagine or possess. Particularly in the field of computer vision, large-scale data sets improve machine learning performance so dramatically that deep neural networks are able to perform as well as humans on especially high-quality images Dodge and Karam (2017). The amount of labelled visual data available for various computer vision tasks (such as image classification, segmentation, detection, tracking, etc.) has reached billions of high-quality images Zhang and Rui (2013) available worldwide for use by researchers and engineers.
Visual data that is publicly accessible comes in a variety of formats. Although the available data is overwhelmingly composed of the visible band, or in other words, “RGB” images; public access to images of other modalities, such as multi/hyperspectral, magnetic resonance (MR), computerised tomography (CT), synthetic aperture radar (SAR), to name a few, is also possible. One relatively less public imaging modality is the infrared (IR) imagery, which corresponds to images constructed with the radiation of an invisible portion of the electromagnetic spectrum, known as the infrared band.
All kinds of objects emit infrared radiation HAMAMATSU PHOTONICS K.K., Solid State Division (2011). With its low radiation absorption, high contrast, and capacity for hot target detection, the IR band is popular and practical for use in civil and military applications Piñeiro-Ave et al (2014). IR imaging is used in many applications, such as object detection, object segmentation, classification, motion detection, etc. However, in contrast to visible band imagery, IR images are difficult to access for several reasons. To begin with, the technology of most IR imaging systems is relatively expensive for use in consumer electronics. Besides, since most IR vision applications are utilised for military or medical applications, they are inaccessible due to either security reasons or intellectual property rights. As a result, the publicly available infrared image and video sets are limited compared to high-scale labelled visible band image and video sets.
The primary purpose of this article is to compile a list of publicly available infrared image and video sets for artificial intelligence and computer vision researchers. We mainly focus111Multispectral image sets collected with satellites are left out of the scope of this survey paper. We believe that multispectral satellite imagery is a category that requires a unique focus due to differences in IR imaging in vision practices, perspective, atmospheric effects and applications. on IR image and video sets which are collected and labelled for computer vision applications such as object detection, object segmentation, classification, and motion detection. We categorize 109 different publicly available or private sets according to their sensor types, image resolution, and scale. We describe each and every set in detail regarding their collection purpose, operation environment, optical system properties, and area of application.
The number of survey studies on IR vision algorithms and IR vision technologies is increasing Teutsch et al (2021); He et al (2021); Perpetuini et al (2021); Hou et al (2022). However, to the best of our knowledge, no published survey studies that review IR image or video sets exist. Our aim is to compile a collection of sets so that researchers in the fields of computer vision and deep learning can identify a visual corpus with necessary properties and compare it with other sets already available. As a result, we believe that the survey can contribute to new algorithms in deep learning and vision research using the spectra beyond the visible spectrum. By scanning public academic sources, we compile this list of image and video sets collected using IR imaging equipment. What is more, for the reader to completely evaluate the different properties of IR image and video sets, we also provide a background on the fundamentals of infrared imagery, including topics such as principles of infrared radiation, infrared sensors, infrared optics, and application fields of IR imagery.
The remainder of this paper is organised as follows: Section 2 covers a general overview of IR radiation, IR detectors, IR optics and related applications. Section 3 starts with an analysis of the statistical significance of the entire corpora and follows by providing the compiled sets as a list with brief descriptions. Finally, Section 4 procures conclusions and sets future directions for the paper.
2 Fundamentals of Infrared Imagery
2.1 Infrared Radiation
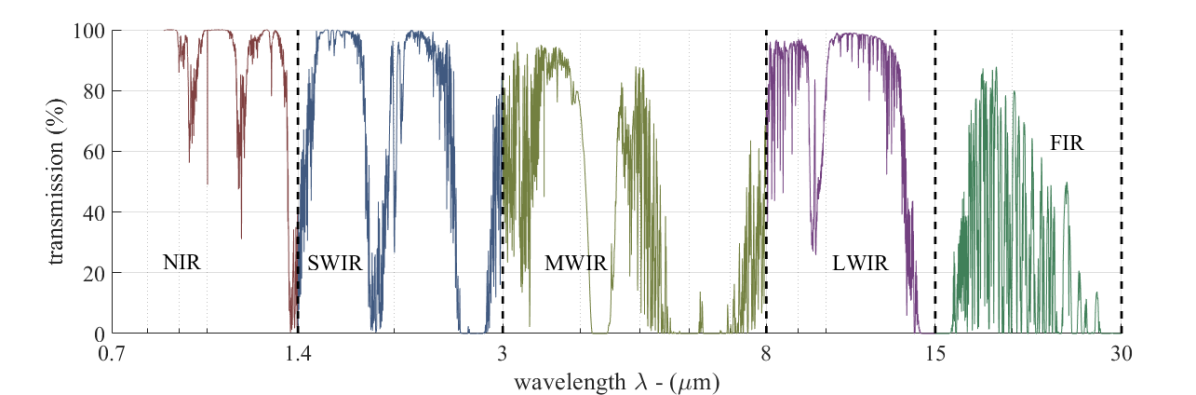
The discovery of IR radiation dates back to an experiment by Frederick William Herschel more than 200 years ago using prisms and basic temperature sensors to measure the wavelength distribution of the stellar spectra Clerke (2003). However, its widespread use is relatively new, starting by the early 20th century with the understanding of Plank’s law and blackbody radiation, and also with the help of modern physics and quantum theory Karim and Andersson (2013); Buser and Tompsett (1997). Today it is almost common knowledge that according to specific known laws of physics, objects emit unique radiation in a broad region of wavelengths called the electromagnetic spectrum (ES). The IR region of this spectrum corresponds to wavelengths from the nominal red edge of the visible spectrum around 700 nanometers to 1 millimetre. IR wavelengths in this region are conventionally categorised into five spectral sub-bands. The wavelength region of 0.7m to 1.4 m is called the near-infrared (NIR), 1.4m to 5m: the short-wave infrared (SWIR), 3m to 8m: the mid-wave infrared (MWIR), 8 m to 15 m the long-wave infrared (LWIR), and finally 15m to 1000m the far-infrared (FIR) (see Table 1).
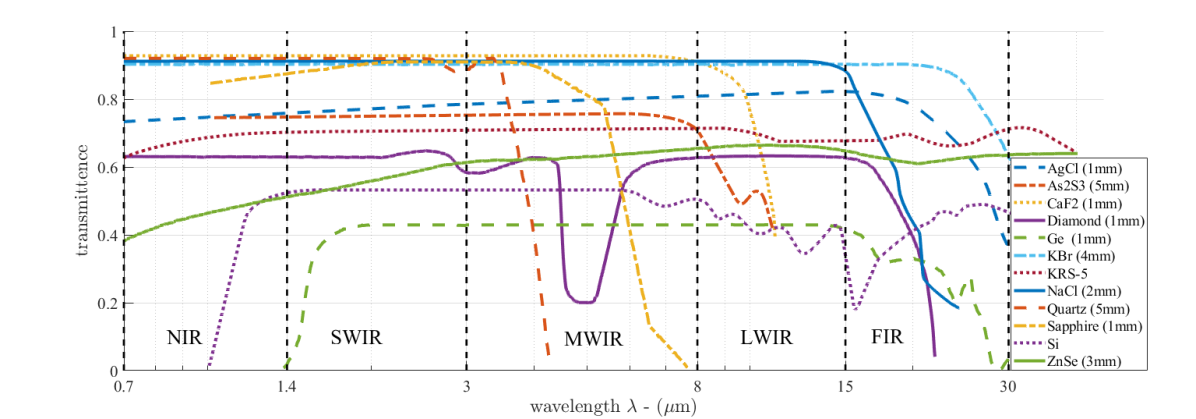
The conventional categorization of IR sub-bands defined in Table 1 is correlated with how IR radiation is absorbed, reflected or transmitted by the atmosphere. The region of the IR spectrum, where there is relatively little absorption of terrestrial thermal radiation by atmospheric gases, is called the IR atmospheric window, which is roughly between 1 to 15 m. The absorption of IR radiation depends on various atmospheric conditions such as altitude, latitude, solar Zenith angle, water vapour, etc. In Figure 1, a synthetically created spectrum of atmospheric transmission between 0.7-30 m, using the ATRAN module222ATRAN module input parameters are selected as, observatory altitude: 13800 feet (Mauna Kea (red) at an altitude of 13.8K feet and 3.4 mm water vapour), observatory latitude: 39 degrees, water vapour overburden: 0 microns, standard atmosphere with 2 Layers, Zenith angle: 45 degrees, smoothing resolution: 1000. Lord (1992) is depicted. For instance, as seen in Figure 1, atmospheric transmittance of the NIR spectrum band is relatively high, which makes this sub-band an effective spectrum for active (i.e. a radiation source illuminating the scene) night vision systems.
| Wavelength | Designation |
| m to m | x rays |
| m to m | ultraviolet |
| 0.4m to 0.7 m | visible |
| 0.7m to 1.4m | NIR |
| 1.4m to 3m | SWIR |
| 3m to 8m | MWIR |
| 8m to 15m | LWIR |
| 15m to 1mm | FIR |
| 1mm to 1m | microwaves |
| 1m to 10km | radiowaves |
It is also seen in Figure 1 that much of the IR spectrum is not suitable for everyday applications because IR radiation is absorbed by water or carbon dioxide in the atmosphere. However, there are a number of wavelength bands with low absorption, which actually create the IR sub-bands known as the short, medium and long-wavelength IR bands, abbreviated as SWIR, MWIR and LWIR respectively.
Visible, NIR or SWIR light (0.35-3 m) corresponds to a high atmospheric transmission band and peak solar illumination. This is why most optical systems usually include detectors sensitive to these bands for the best clarity and resolution. However, without moonlight or artificial illumination, SWIR imaging systems are known to provide poor or no imagery of objects below 300K temperatures. SWIR imaging systems predominantly use reflected light. Accordingly, they are comparable to grey-scale visible images in resolution and detail.
The MWIR (also referred to as the ‘MIR’) band also provides partial regions of lossless atmospheric transmission with the added benefit of reduced ambient and background noise. This region is referred to as the “thermal infrared”. The radiation in this sub-band is emitted from the object itself; hence passive imaging is utilised. Two principal factors determine how bright an object appears in the MWIR spectrum: the object’s temperature and its emissivity (E). Emissivity is a physical property of materials that describes how efficiently it radiates the absorbed radiation.
The LWIR band spans roughly between 8-15 m, with almost no atmospheric absorption between the 9-12 m region. Because LWIR sensors can construct an image of a scene based on passive thermal emissions only and hence require no active illumination, this region is also considered as “thermal infrared”. LWIR band is better than MWIR for imaging through smoke or atmospheric particles (aerosols). Therefore, surveillance applications usually prefer LWIR technology. On the other hand, for very long-range detection (such as 10km or more), MWIR has greater atmospheric transmission than LWIR in most atmospheric conditions.
Although the FIR spectrum is defined between 0.75m and 1mm, the atmosphere absorbs almost all IR radiation with wavelengths above 25m. Hence, atmospheric FIR spectroscopy can only be effectively utilised for wavelengths in the limited spectrum between 0.75 to 25 m. This region is also an atmospheric thermal band, which we can experience in the form of heat waves. For astronomical observation outside of the atmosphere, the entire FIR spectrum is utilised.
For a general overview of the subject and the fundamentals of radiometry, the reader may refer to Parr et al (2005).
2.2 Infrared Detectors
One of the fundamental parts of an IR electro-optical system is the detecting sensor. In order to capture the IR signature of a scene, a detector sensitive to IR radiation is needed. IR-sensitive detectors capture the IR radiation emitted by the objects and the scene, and convert it into electrical signals. Objects that have different temperatures and emissivity, emit different levels of radiation so that the camera produces electrical signals that have different amplitudes. These electrical signals are used to produce the IR image.
Detectors are the core of an IR imaging system. Historically IR detectors can be scrutinised in three generations. The first generation consists of single-cell detectors. In order to create an image plane, the infrared beam emitted from a scene reaches a reflective surface (i.e. mirror). As the position of the mirror is deflected by two-dimensional rotary actuators, the focused infrared beam creates a two-dimensional pattern of the target image plane. In contrast, the second-generation systems comprise an array of detectors with an optical mirror system that rotates only on a single axis. Finally, the modern third-generation IR optical systems have two-dimensional array detectors, known as focal plane arrays (FPA), so that the system does not need a mirror system to scan different parts of the scene Bagavathiappan et al (2013); HAMAMATSU PHOTONICS K.K., Solid State Division (2011).Third-generation IR detectors are quite similar to modern digital photographing machines in principle.
In order to measure IR detector performance, three principle metrics are utilised: photosensitivity (or responsivity), noise-equivalent-power (NEP), and Detectivity (D*).
Photosensitivity or responsivity is defined as the output signal per Watts of incident energy. The output may vary according to the type of detector, for example, while the output signals in photovoltaic detectors are usually photocurrent (i.e. Amperes), the output signals in photoconductor detectors are obtained as voltage. Photosensitivity is related to the magnitude of the sensor’s response and is expressed as follows;
| Type | Properties | |
| Thermal Detectors | Thermocouples, Thermopiles, Bolometers, Pneumatic cells, Pyroelectric Detectors | room temperature operation, low cost, low sensitivity, slow response. |
| Photon Detectors | Photoconductors, Photodiodes, Schottky Barrier Detectors, Quantum Well IR Photodetectors | low temperature operation, higher cost, higher sensitivity, fast response. |
| (1) |
where S is signal output, P is incident energy and A is the detector’s active area Vollmer and Möllmann (2017); HAMAMATSU PHOTONICS K.K., Solid State Division (2011).
The signal-to-noise ratio (SNR) for a given input flux level is an important parameter used to determine IR image sensitivity Boreman (1998). NEP is the quantity of incident light when the SNR is 1 and expressed as follows:
| (2) |
where N is the noise output and is the noise bandwidth (and S,P and A are the same as in eq. 1).
Detectivity D* (normalised detectivity) is the photosensitivity per unit active area of a detector and is expressed as follows:
| (3) |
Technologically, IR detectors are classified into two main groups: thermal detectors and photon (quantum) detectors (see Table 2) Rogalski (2002). Thermal detectors include thermocouples, thermopiles, pyrometers and bolometers that use infrared energy for detection. They are constructed using metal compounds or semiconductor materials and are low-cost. These detectors operate at room temperature. Their sensitivity is independent of wavelengths. Consequently, they are capable of capturing scenes in all IR sub-bands. However, they suffer from slow response times, low sensitivity, and low resolution.
In contrast to thermal detectors, photon detectors simply count photons of IR radiation. There are different technologies that operationalize these types of sensors such as photoconductors, photodiodes, Schottky Barrier Detectors, and Quantum Well detectors Rogalski (2002). Compared to thermal sensors, they are more sensitive and operate faster. However, these types of detectors do not operate at room temperature but require a cooling capability. In addition, they are made from materials such as InSb, HgCdTe, and GaAs/AIGaAs whose sensitivity depends on photon absorption and, therefore are more expensive. They also have a limited IR spectrum. Photon detectors are usually utilised when a high-sensitivity response is required at a specific wavelength.
Comparative studies on thermal and photon detectors show that both sensor types have their pros and cons Hudson et al (1976); Vollmer and Möllmann (2017); Rogalski (2002). Photon detectors are favoured at specific wavelengths and lower operating temperatures, whereas thermal detectors are favoured at a very long spectral range Rogalski (1997). Photon detectors are fundamentally limited by generation-recombination noise arising from photon exchange with a radiating background. Thermal detectors are fundamentally limited by temperature fluctuation noise arising from radiant power exchange with a radiating background Kruse (1995).

2.2.1 IR Detector Raw Output
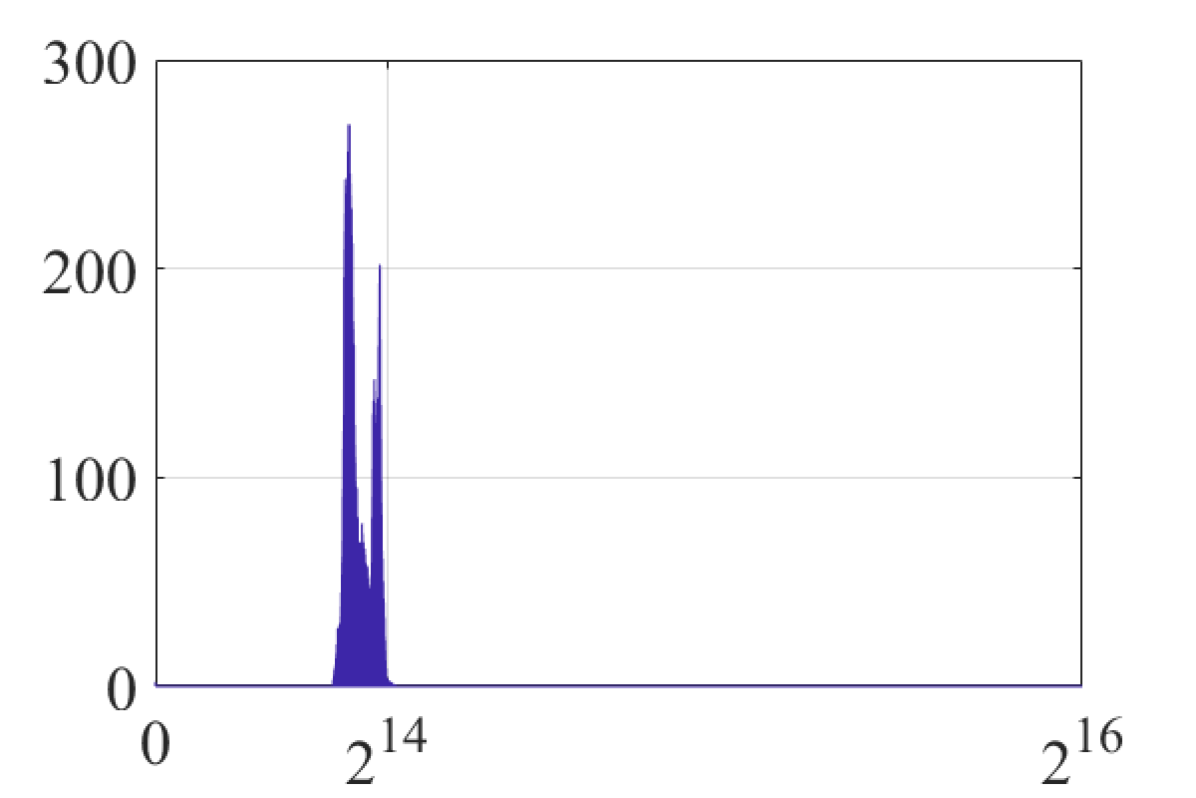
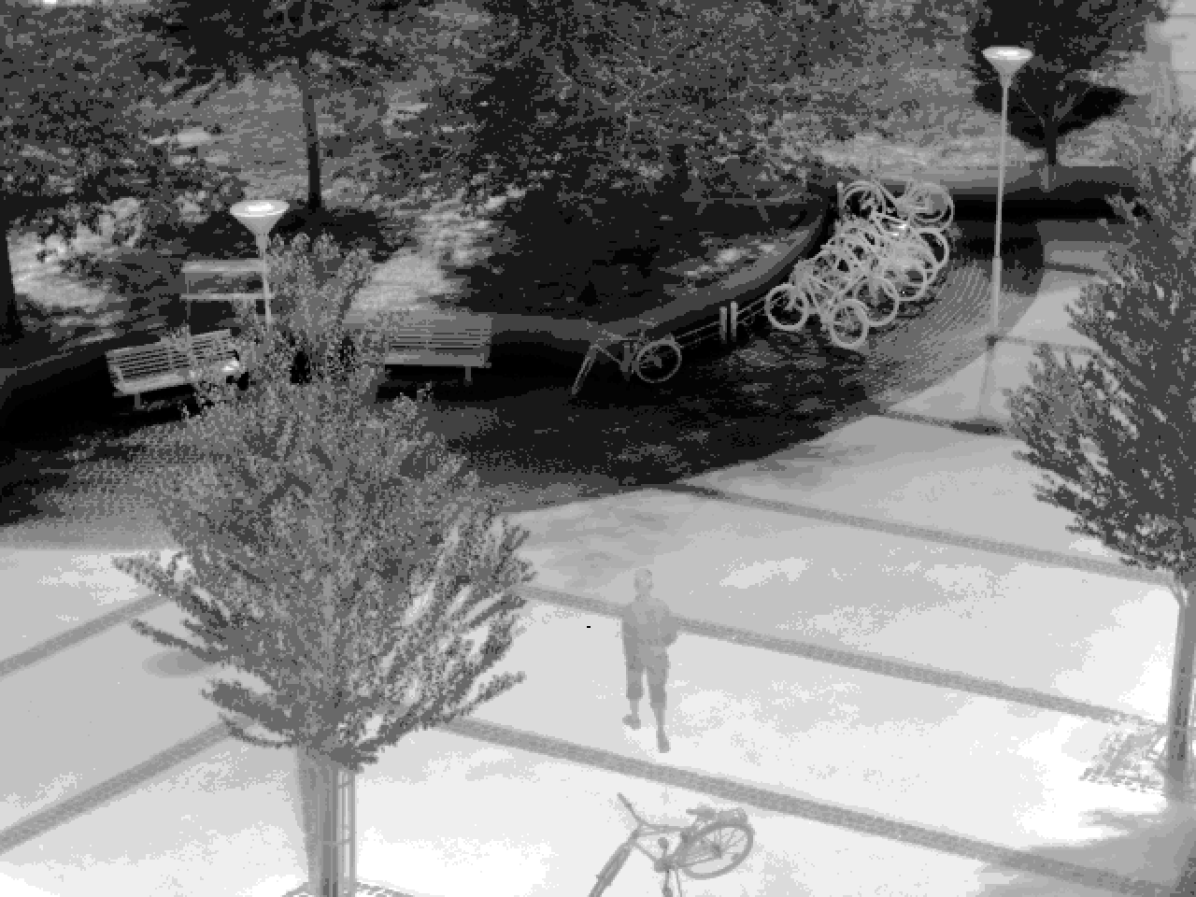
The raw pixel output of an IR detector is the irradiance (i.e. the flux of infrared energy per unit area) transformed into quantised n-bit values. These values are within the limits of the so-called “dynamic range”, which is the difference between the largest and smallest signal value the detector can record or reproduce. Hence, the raw pixel values are usually not uniformly distributed within the dynamic range. In practice, a raw IR detector output is usually confined to a very limited range. In Figure 2, a 16bit IR detector raw output (taken from Berg et al (2015)), its 16-bit raw pixel histogram and the enhanced image are depicted.
IR electro-optical systems that provide a visual output for human users, enhance the raw detector output using contrast-enhancing histogram shaping methods Soundrapandiyan et al (2022). These types of systems usually provide 8-bit contrast-enhanced images as output. The aim of such a process is to increase the contrast of the raw IR image for the human observer. As seen in Figure 2a, the raw image is barely visible to the human eye. Due to the irreversibility of most image enhancement algorithms, the bit range decreases with the price of sacrificing information. This enhancement is usually a default process for visible band cameras. On the other hand, systems that provide intelligent IR image processing algorithms, such as tracking, detection, recognition, etc., utilize the raw output of pixels; since the raw output is representative of the actual irradiance values collected from the scene and has a higher dynamic bit range. The raw output of the electro-optical system usually has the same bit-depth as the IR detector, such as 11-bits or 14-bits. In the following section, when analyzing the various image and video sets, information regarding the raw or enhanced nature of pixel values for a given set is specifically indicated.
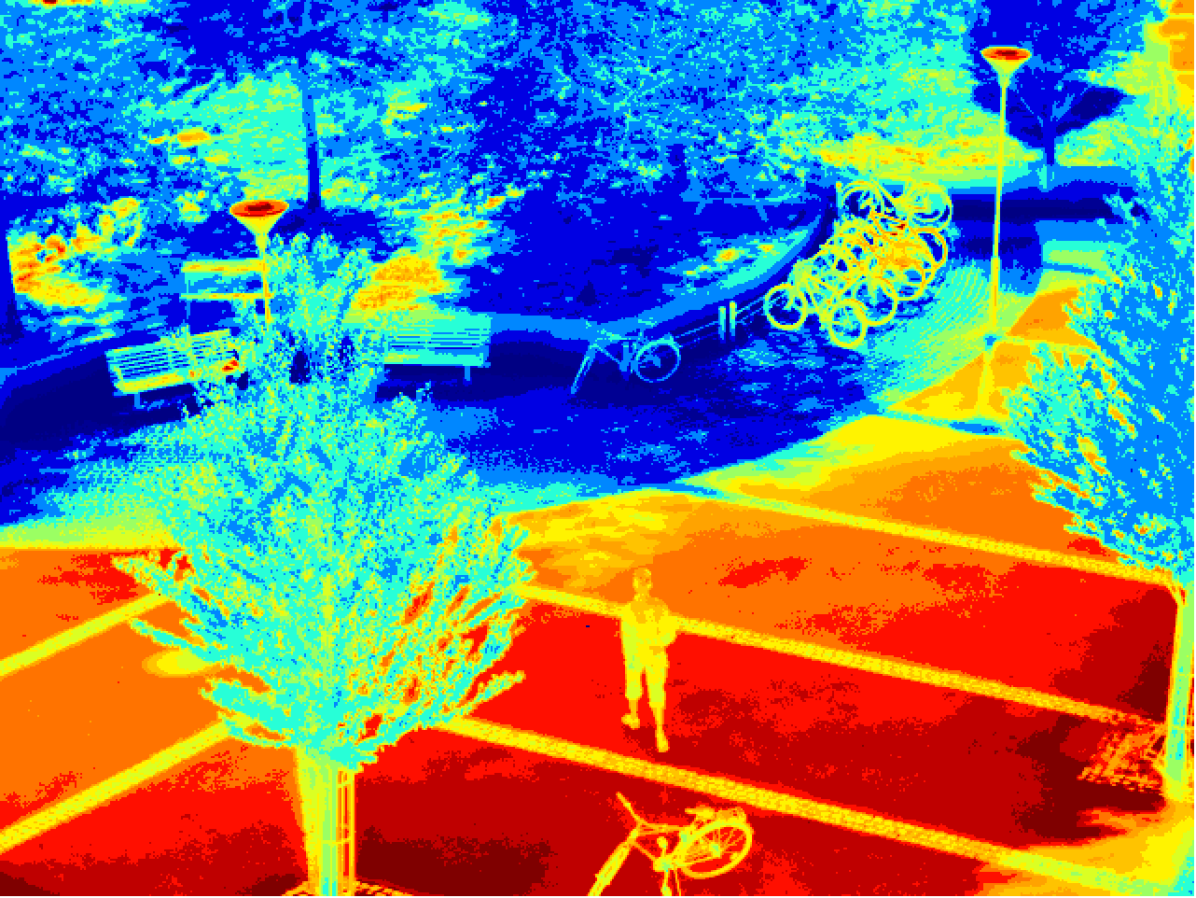
Some thermal cameras utilize false colours for their 8-bit contrast-enhanced output. This is usually done for temperature mapping for cameras that are used for temperature measurement. In Figure 2d, an example of a false-colour contrast-enhanced infrared image is depicted.
2.3 Infrared Optics
IR imaging technology was founded in the late 1920s with the understanding of photon emission, and improvements continue even today Buser and Tompsett (1997). IR imaging is based on a fundamental concept in geometrical optics called the ray model. A ray model ignores the diffraction and assumes that light travels in straight lines from a source point. Each location in the scene can be assumed as a source point, and the source points emit different levels of radiation that create the IR scene.Boreman (1998).
In geometrical optics an image is constructed via an optical material, by focusing the rays collected from the scene onto an image plane. Hence, the optical material used in an infrared system needs to be transparent (i.e. with transmittance closer to 1.0) at the wavelength the detector is sensitive to. The percentage of incident light that passes through a material for a given wavelength of radiation is defined as electromagnetic transmission, also known as transmittance.
When choosing the correct optical material for an IR imaging system, there are three main points to consider. The first is the thermal properties of the material. Optical materials are typically placed in environments with varying temperatures, and as a result, they can generate a significant amount of heat. To ensure that the user receives the desired performance, the coefficient of thermal expansion (CTE) of the material should be evaluated. Secondly, as mentioned above, sufficient transmittance of the material for the given wavelength is a must. In Figure 3, the transmittance of different materials in IR sub-bands is depicted. For example, if the system is intended to operate in the LWIR band, germanium (Ge) optics with a thickness of 1mm are preferable to sapphire optics with the same thickness.
Another factor in choosing a suitable optical material is the refractive index, which is the measure of how fast radiation travels through a material. IR refractive index varies among materials, allowing more flexibility in system design. As a solution, anti-reflection coatings are applied to materials used for IR optics, which also limits them to a desired band within the IR spectrum.
For more information on the subject, the reader may refer to Daniels (2018).
| Cameras Parameters | FLIR A35 | FLIR T560 | FLIR A655SC | FLIR T1010 | FLIR A65 | FLIR E8-XT |
| Spectral Range | 7.5–13 | 7.5-14 | 7.5–14 | 7.5–14 | 7.5–13 | 7.5–13 |
| Detector Type | Uncooled VOx µ-bol. | Uncooled µ-bol. | Uncooled µ-bol. | Uncooled µ-bol. | Uncooled VOx µ-bol. | Uncooled µ-bol. |
| Field of View (lens size (if available | 63°x50°(7.5mm) 48°x39°(9mm) 24°x19.2°(19mm) 13°x10.8°(35mm) 7.6°x6.08°(60mm) | 14°x10° | 15°x11° | 12°x9° | 90°x69°(7.5mm) 45°x37°(13mm) 25°x20°(25mm) 12.4°x9.92°(50mm) 6.2°x4.96°(100mm) | 45°x34° |
| Thermal Sensitivity (NETD) | <0.05°C @ 30°C / 50 mK | <50 mK @ 30°C | <30 mK | <25 mK @ 30°C | < 50 mK @ 30°C | <0.05°C /<50 mK |
| Object Temperature Range | –25135°C –40550°C | –20120°C 0650°C 3001500°C | –40150°C 100650°C | –40650°C | –25135°C –40550°C | –20550°C (-41022°F) |
| Measure- ment Accuracy | ± 5°C (± 9°F) or 5 % of reading | ±2°C or ±2% of reading | ±2°C or ±2 % of reading | ± 2 °C or ± 2% of reading | ± 5°C (± 9°F) or 5 % of reading | ±2°C (±3.6°F) or ±2% of reading |
| Operating Temperature Range | –1560°C | –4075°C | –1550°C | –1550°C | –1560°C | –1550°C |
2.4 IR Electro-Optical System Properties
There are some important parameters used in selecting appropriate equipment and characterising the performance of IR systems. The parameters that measure the performance of an IR electro-optical system depend on its ability to detect IR radiation and resolve the temperature differences in the scene. The contrast in an IR image occurs due to variations in temperature and emissivity. The parameters that may affect the performance of an IR electro-optical system, in general, include spectral range, normalised detectivity, temperature range, absolute accuracy, repeatability, frame rate, spatial resolution and thermal sensitivity Venkataraman and Raj (2003). Below these parameters are briefly explained:
-
•
Spectral range: refers to the wavelength range in which the IR system will operate.
-
•
Normalised detectivity (D*): as defined in eq. (3), is one of the widely used parameters to compare the performance of IR detectors.
-
•
Temperature range: or the operating temperature, is the minimum and maximum temperatures that can be measured by the IR electro-optical system. It has a unit of K, C, or F.
-
•
Absolute Accuracy: is a measure of how accurately the system detects the actual temperature and is denoted by temperature units. Related to this measure, Repeatability is defined as the consistency of the system accuracy.
-
•
Frame rate: is the number of frames displayed per second. For monitoring moving objects, higher frame rate cameras are mostly preferred Bagavathiappan et al (2013). It has a unit of Hz.
-
•
Spatial resolution: also referred to as the “instantaneous field-of-view” (IFOV), is the imaging system’s ability to differentiate the details of objects within a single pixel-sized FOV. It is a measure of solid angle, hence represented by steradians. As spatial resolution increases, so does the image qualityç Bagavathiappan et al (2013).
-
•
Thermal sensitivity: is the smallest temperature change detected by the IR imaging system. There are three most common parameters used as a measure of thermal sensitivity, namely “Noise Equivalent Temperature Difference” (NEDT), “Minimum Resolvable Temperature Difference” (MRDT) and “Minimum Detectable Temperature Difference” (MDTD) Venkataraman and Raj (2003). It has a unit of temperature (i.e. K, C, or F).
In order to choose the right camera for the right application, all of the aforementioned parameters should be taken into account. There are numerous commercial IR electro-optical systems available in the market. In Table 3, we provide a selection of six different near-infrared electro-optical systems, with their comparative parameters, so as to give the reader a sense of the systems engineering perspective of IR electro-optical system selection.
2.5 Applications of IR Electro-Optical Systems
The development in IR sensing technologies has resulted in countless applications, which we divided into four major categories: military surveillance, industrial, medical, and scientific. Each category title is briefly explained below. The IR image and video sets provided in the next section are categorised according to these application titles.
-
•
Military Surveillance Applications: The military and surveillance field, which also encapsulates law enforcement and rescue applications, cover a wide variety of applications utilised in all IR sub-bands. Warfare applications include target tracking/detection/acquisition in various platforms such as missile seeker heads, forward-looking infrared (FLIR) systems, infrared search and track (IRST) systems, and directional countermeasure (DIRCM) systems. Regarding law enforcement and rescue applications, night vision systems, reconnaissance and surveillance, fire fighting and rescue in smoke, identification of earthquake victims’ locations, forest fire detection, and radiation thermometer are prime examples.
-
•
Industrial Applications: Industrial applications of IR imaging systems include the utilization of IR sensing technology in various industrial fields, such as infrared heating in process control, nondestructive inspection of thermal insulators, hidden piping location detection, diseased tree and crop detection, hot spot detection, brake lining, industrial temperature measurement, clear-air turbulence detection, pipeline leak and petrol spill detection, just to name a few.
-
•
Medical Applications: In medicine, IR technology is fundamentally used for diagnosis, such as early cancer detection, determining the optimum site for amputation, determining the location of the placenta, detecting strokes and vein blockages before they occur, monitoring wound healing, and detecting infection. Due to its non-invasive nature, IR technology in medicine provides information about conditions that are directly or indirectly related to the focused region of the body (such as hands Sousa et al (2017)), as well as facilitating the assessment of treatment.
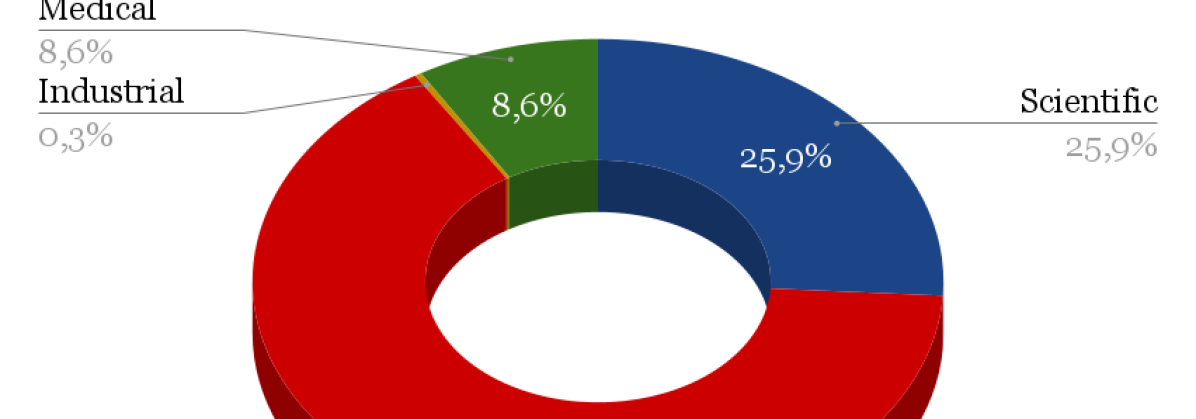
(a) Application fields 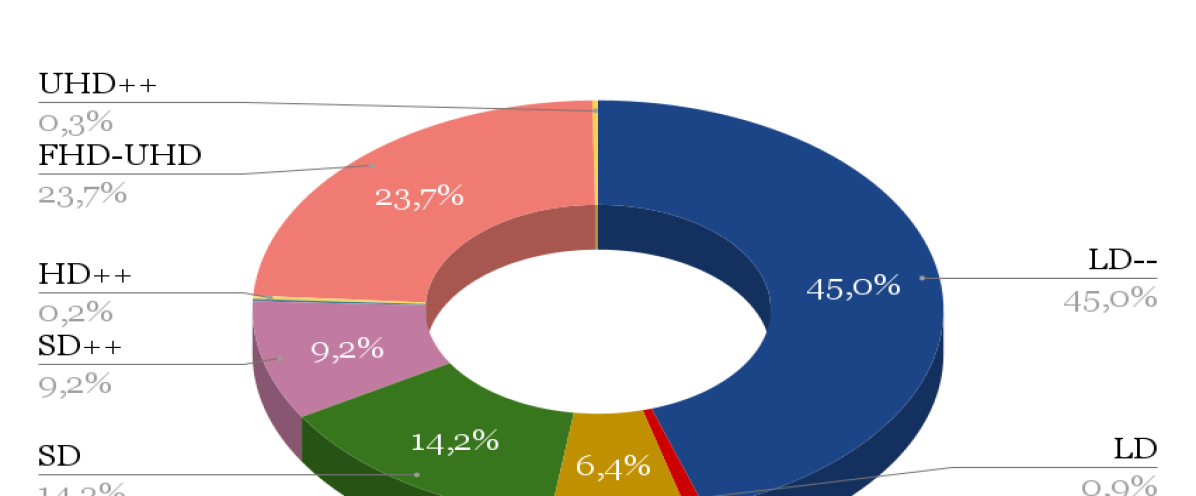
(b) Image/frame resolutions 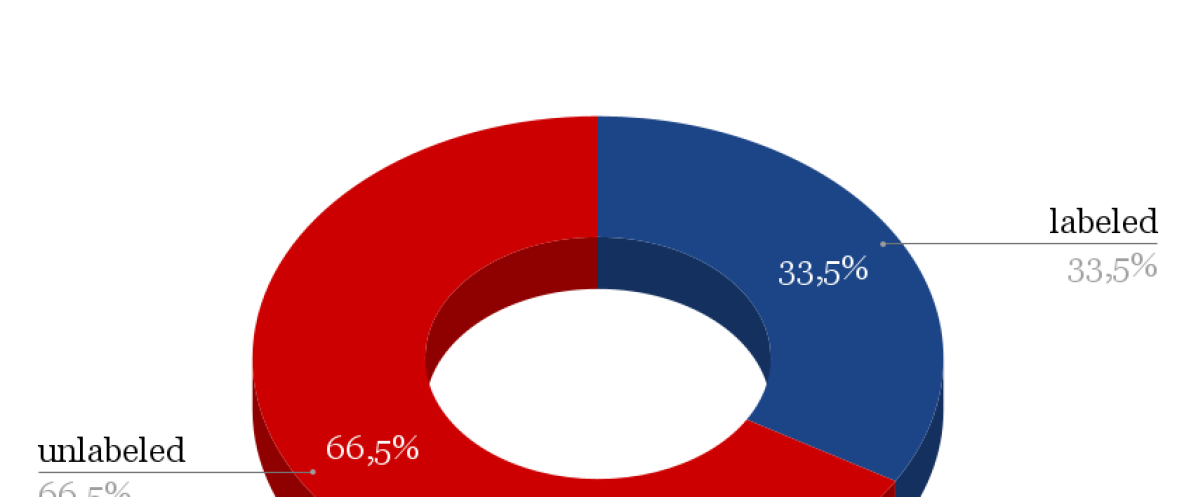
(c) Ground truth labels 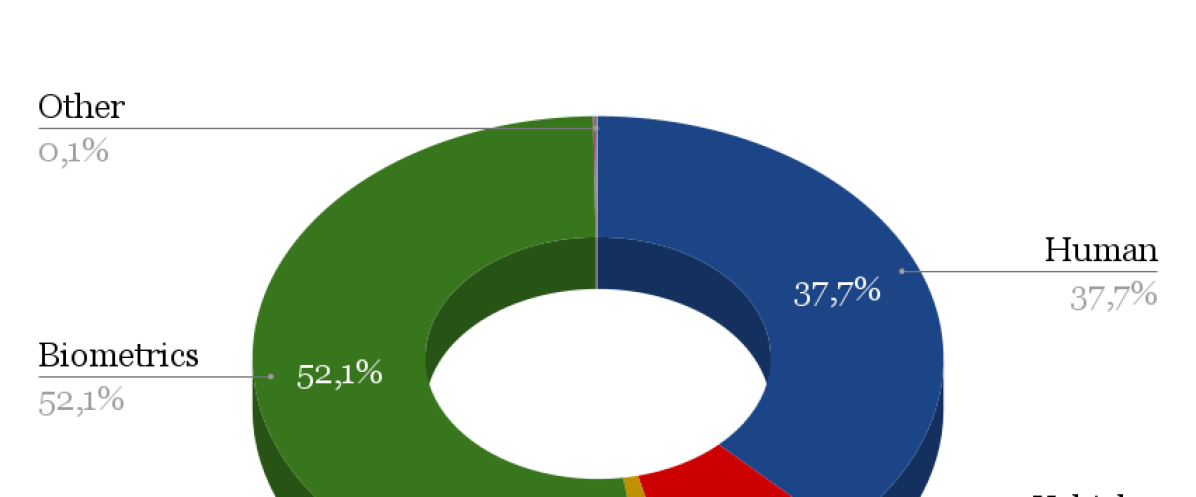
(d) Object categories 
(e) Image Enhancement Figure 4: Distributions of various attributes (application field, resolution, ground truth labelling, object category and image enhancement) in the entire collected image/frame corpus are depicted in pie charts. -
•
Scientific Applications: In nearly every scientific field, from remote sensing and meteorology to material science and microbiology, from engineering to biology, IR imaging technologies are used. In this paper, when categorizing a set as "scientific", we took into account its use outside of the other categorised sectors, namely military, surveillance, industrial, and medical. An image or video set, for example, is classified as both Military Surveillance and Scientific if it has the capacity to support both types of applications.
3 IR Image & Video Sets
The paper analyses 109 IR image and/or video sets and provides a list of the sets in Table 4. A total of 77 are public, in other words, they offer public download links, while 3 are private and require payment. The remaining 29 sets can be downloaded for free but require manual registration by contacting the institution that owns them. The entire corpus of sets includes nearly 20 million still images and video frames. In the following, we provide the statistical details of the compiled list of IR image and video sets in terms of application fields, included object categories, resolution, annotation, and preprocessing, before presenting the list with brief descriptions.
Table 4 provides a sample image and a brief description for every set. There are also separate columns for technical details, such as types of annotated classes, number of total frames, image resolutions, sensor types, image bit depths, and application fields. The description section additionally specifies whether the collection is accessible to everyone (pub), accessible to paid users only (pri), or needs registration (rr). For more details, we suggest that the reader consult the References section for an online link to the image set.
3.1 Application Fields
As mentioned in the previous section, application fields for IR image and video sets are scrutinised in 4 main titles: Military & Surveillance (Mil. & Sur.), Industrial, Medical and Scientific. As seen in Figure 4a, Military & Surveillance comprises 65.2% of the total volume of images and video frames, clearly demonstrating the importance of IR imaging in this industry. Sets collected for scientific applications cover 25.9% of the corpus, while medical applications cover 8.6%, most likely due to the legal challenges involved in collecting or publishing health informatics data. Industrial applications account for a marginal share, which is probably due to the fact that they do not publish their data in public domain. In Table 4, the application fields for every individual set are indicated in the right-most column (titled “App.”).
3.2 Resolution and Sensor
IR image and video sets listed in this survey range from lower-definition (LD–), which corresponds to resolutions lower than LD, to ultra-higher-definition (HD++), which corresponds to resolutions higher than UHD. Depending on the application, the resolution plays a significant role. Most surveillance systems require HD or better resolutions for accuracy. On the other hand, LD and standard definition (SD) systems are ideal when the computational capabilities of the system are limited. Figure 4b shows that despite three-quarters of the corpora being SD++ or worse, the rest are almost UHD or better. It is important to note that sets with UHD or better resolutions are recent sets showing a clear future trend. In Table 4, the actual resolutions for every individual set are indicated in column four (titled “res”).
In addition, the optical equipment used to collect each set is provided in column five (titled “Sensor”). When compared to RGB cameras, IR optical systems are capable of different kinds of calibration, and they are capable of producing characteristic output that may not be replicated with similar equipment. The reason for this is that today’s RGB cameras usually use the same preprocessing and aim at producing almost the same output, whereas, with IR vision, it becomes important to know the parameters of the equipment in order to recreate similar scenes or images. Therefore, in Table 4 column titled “Sensor”, we provide details regarding the collection equipment for the sets, which openly specify these details.
3.3 Annotations and Object Categories
Many computer vision applications annotate data with labels for certain purposes, such as detection, tracking, and recognition. Data annotation/labelling is an expensive effort, which provides means for supervised learning, and hence deep learning if the annotated data are sufficiently large in scale. Similarly, some of the IR sets listed in this survey are annotated with various labels. As shown in Figure 4c, about 33.5% of the entire corpus is annotated. For some sets, these annotations are black-box locations for objects, whereas for others they are global labels for entire images. A majority of the corpora are not labelled, but we believe that most annotations may not be shared publicly due to their commercial implications. Once again, it is important to note that sets with labels are recent sets showing another future trend.
In Table 4, (in column three, titled “Classes”), categories for any existing annotation of a given set are provided. The entire collection of sets includes a wide range of object annotation categories. The objects are categorised under seven titles in Figure 4d, namely biometrics, environments, humans, vehicles, animals, unknown and uncategorised. Biometrics annotations include IR images of faces, irises, ears and/or fingerprints, and cover the majority of the annotations with a 52.1% share. Human annotations, including pedestrians, runners, sportsmen, etc cover 37.7% of these annotations. Vehicles of different sorts such as cars, bicycles, motorcycles, aircraft, boats, etc, are also included and cover 8.6% of label annotations. There are a small number of animal class annotations that take 1.4%. There is also a marginal share of annotations that are related to environmental objects, including terrain, roads, clouds, or various objects like food, or uncategorised application-specific labels.
3.4 Image Enhancement
As mentioned previously in Section 2.2.1, IR electro-optical systems that provide a visual output for human users, usually enhance the raw detector output using contrast-enhancing histogram shaping methods. However, IR image processing systems that utilize algorithms such as tracking, detection, recognition, etc., utilize the raw output of pixels, which usually has the same bit-depth of the IR detector. The histogram-enhanced image is, in most cases, the only accessible output of an IR optical system. For such systems, the details of the enhancement algorithms are rarely provided to the user. Most systems apply different algorithms that suit their design requirements such as level of contrast, and real-time operation, just to name a few. As seen in Figure 4e, only a minority of 5.3% of the entire corpora of collected frames are raw detector outputs. The “bit” column in Table 4 gives information about the bit depth of an image/frame for a given set. The number (8, 11, 16, etc.) corresponds to image bit-depth. For some sets, the bit depth is indicated by “8*” showing that the images/frames are of 24bit RGB (i.e 8bit per channel) format. The abbreviation “HE” is to indicate the existence of any histogram enhancement process, whereas “RAW” suggests the accessibility of the raw detector output. The type of enhancement technique is not indicated in the table, because this information is not available for most of the collection equipment.
| Name | Sample | Classes | # fr. | res. | Sensor | bit | Description | App. |
| AAlart Data Zhang et al (2018) |
![[Uncaptioned image]](/html/2203.08581/assets/dataset_images/1-aalartdata.jpg)
|
pedestrian, vehicle | 771 | 640x513 | Catherine MP LWIR | 8 HE | (pub) The dataset includes thermal infrared video sequences comprising of pedestrians and various types of vehicles for an infrared surveillance system that can be widely applied in military applications. | Mil. & Sur. |
| AAU RainSnow Bahnsen and Moeslund (2018) |
![[Uncaptioned image]](/html/2203.08581/assets/dataset_images/3-aau-rainsnow.png)
|
vehicle | 4.5K | 640x480 | not specified | 8* HE | (pub) The image set includes traffic surveillance images (RGB+thermal) and 22 video pairs in rainfall and snowfall from seven different traffic intersections at the Danish cities of Aalborg and Viborg. The purpose of the dataset is detection and classification under challenging weather conditions. The dataset includes pixel-level annotations of 2.200 frames, containing 13,297 objects. | Mil. & Sur. |
| AAU-PD-T Huda et al (2020) |
![[Uncaptioned image]](/html/2203.08581/assets/dataset_images/2-aaupdt.jpg)
|
pedestrian | 3K | 384×288 640×480 | Axis Q1921 Axis 1922 | 8* HE | (pub) The image set contains approximately 3k thermal pedestrian images with a total of 5590 person annotations. Training data is divided into 9 categories, such as good weather, far viewpoint, occlusions, snow, wind, just to name a few. | Mil. & Sur. |
| All-Ther AV-Public (2022) |
![[Uncaptioned image]](/html/2203.08581/assets/dataset_images/all_ther.jpg)
|
vehicle, pedestrian | 20K | 640x512 1280x1024 | not specified | 8* HE | (pub) The thermal dataset contains vehicle and pedestrian infrared images in traffic and parking land scenarios. The set provides bounding box annotations. | Mil. & Sur. |
| ASL-TIR Portmann et al (2014) |
![[Uncaptioned image]](/html/2203.08581/assets/dataset_images/ir_humans.png)
|
human, cat, horse | 4381 | 324x256 | FLIR Tau 320 | 8/16 HE/RAW | (pub) ASL thermal IR dataset includes 8 sequences of thermal images of humans, cats and horses, with annotations. The images are captured at indoor and outdoor environments. | Mil. & Sur. |
| Baracca S. Pini and Cucchiara (2020) |
![[Uncaptioned image]](/html/2203.08581/assets/dataset_images/baracca.png)
|
person | 9600 | 160x120 640×480 | Pico Zense DCAM710 PureThermal 2 | 8 HE | (rr) The dataset presents depth, thermal and RGB images for anthropometric measurements such as height, shoulder width, and forearm with annotations. | Scientific |
| BCT Ghayoumi zadeh et al (2016) |
![[Uncaptioned image]](/html/2203.08581/assets/dataset_images/5-breastcancer.jpg)
|
breast | 60 | 640x480 | Infrec R500 | 8 HE | (pub) The dataset contains thermal breast images of 60 patients for breast cancer detection. | Medical |
| BERTIN D’Angelo et al (2006) |
![[Uncaptioned image]](/html/2203.08581/assets/dataset_images/bertin.jpg)
|
vehicle, pedestrian | more than 10K | 320x240 | FLIR A20M | 16 RAW | (rr) The dataset includes both visible and thermal images of pedestrians and vehicles, captured with a static and a moving camera. Contains training, validation and test sets with their ground truths. | Mil. & Sur. |
| Bird Aniket (2022) |
![[Uncaptioned image]](/html/2203.08581/assets/dataset_images/bird.jpg)
|
bird | 302 | 416x416 | not specified | 8* HE | (pub) The dataset presents thermal images that include flying birds with annotations. | Scientific |
| Table 4 | continued… | |||||||
| BIRDSAI Bondi et al (2020) |
![[Uncaptioned image]](/html/2203.08581/assets/dataset_images/4-birdsai.jpg)
|
human, animal | 160K | 640x480 | FLIR Vue Pro 640 Tamarisk 640 | 8 HE | (pub) The dataset consists of two parts: real and synthetically-created, with annotations. The real data includes 48 thermal infrared videos sequences of humans and animals, captured with a thermal camera mounted on a UVA, that flies over African landscapes. The synthetic data, generated with MS AirSim simulation platform, include 124 thermal infrared video sequences. | Scientific |
| BU-TIV Wu et al (2014) |
![[Uncaptioned image]](/html/2203.08581/assets/dataset_images/butiv1.jpg)
|
motorcycle, runner, car, bicycle, pedestrian | 35K 2999 6000 1275 1282 | up to 1024x1024 | FLIR SC8000 | 16 RAW | (pub) The dataset contains various tasks, such as single object detection, multi-object detection, motion detection, counting, that describes real world scenarios such as a marathon runner, people walking down a hall, etc., with ground truth data. In addition, the set includes images of bats for tracking and counting purposes. | Mil. & Sur. |
![[Uncaptioned image]](/html/2203.08581/assets/dataset_images/butiv2.png)
|
bat | 19K | Scientific | |||||
| CAMEL Gebhardt and Wolf (2018) |
![[Uncaptioned image]](/html/2203.08581/assets/dataset_images/6-camel.png)
|
biker, vehicle, pedestrian | 44.5k | 336x256 | FLIR Vue Pro | 8* HE | (pub) The dataset contains 26 video sequences, captured in an urban environment, in the visible and thermal infrared domains, with their annotations. | Mil. & Sur. |
| Carl Database Faundez-Zanuy et al (2013) |
![[Uncaptioned image]](/html/2203.08581/assets/dataset_images/7-carl.png)
|
face | 7380 | 640x480 | TESTO 880-3 | 8* HE | (rr) Contains visible and thermal images of human faces, with a constant 135 cm distance from the sensor, in front of a matt black background. | Mil. & Sur. |
| CATS Wayne Treible (2017) |
![[Uncaptioned image]](/html/2203.08581/assets/dataset_images/8-cats.png)
|
vehicles, pedestrians, other | 1520 | 640x480 | Xenics Gobi 640 GigEs | 16 RAW | (pub) The dataset contains stereo thermal, stereo colour, and cross-modality images of pedestrians, vehicles, and some other objects in different weather conditions. | Mil. & Sur. |
| CBSR NIR Li et al (2007) |
![[Uncaptioned image]](/html/2203.08581/assets/dataset_images/31-cbrs.png)
|
face | 4K | 480x640 | not specified | 8 HE | (pub) The dataset contains NIR images from 197 people, collected for face detection, eye detection and face recognition tasks. | Mil. & Sur. |
| CDW 2014 Wang et al (2014) |
![[Uncaptioned image]](/html/2203.08581/assets/dataset_images/10-cdw.jpg)
|
pedestrian | 21K | 320x240 720x576 | not specified | 8* HE | (pub) The 2014 CDnet dataset, which is extended version of CDnet 2012 dataset, contains 11 video categories, one of which is the Thermal category, that contains 5 video sequences (3 outdoor + 2 indoor) shot by a far infrared camera annotated with pedestrian bounding boxes. | Mil. & Sur. |
| Cheetah Roboflow (2020) |
![[Uncaptioned image]](/html/2203.08581/assets/dataset_images/cheetah.png)
|
cheetah | 129 | 416x416 | Seek Compact XR | 8 HE | (pub) This dataset is a collection of thermal infrared images and video frames of cheetahs. | Mil. & Sur. |
| Table 4 | continued… | |||||||
| Comp-Mat Erazo-Aux et al (2020) |
![[Uncaptioned image]](/html/2203.08581/assets/dataset_images/composite.png)
|
composite materials | 2000 | 512X512 | FLIR X6900 | 8 HE | (pub) The dataset consists of 12 image sequences collected for locating laminar defective regions from composite materials. The IR camera records the thermal evolution of both sides of the sample for a few seconds for 3 stages, before a heat pulse, during the heat pulse and after the heat pulse. | Industrial |
| CSIR CSIO Akula et al (2014) |
![[Uncaptioned image]](/html/2203.08581/assets/dataset_images/11-csircsio.png)
|
vehicle, human, dog, bird | 3650 | 640x480 | Uncool. µ-bol | 8* HE | (pub) A moving object detection dataset which has 18 sequences of moving targets, four, three and two-wheelers, pedestrians and some animals. Thermal infrared videos were captured at the coastal area of the Bay of Bengal in Southern India with a sampling rate of 10hz. | Mil. & Sur. |
| CVC-09 Socarras et al (2013) |
![[Uncaptioned image]](/html/2203.08581/assets/dataset_images/12-cvc09.png)
|
pedestrian | 10K | 640x480 | not specified | 8 HE | (pub) FIR Sequence Pedestrian Dataset include two sequences, day and night, captured at urban areas. Each sequence has about five thousand frames, divided into distinct train and test sets. | Mil. & Sur. |
| CVC-14 Gonzalez Alzate et al (2016) |
![[Uncaptioned image]](/html/2203.08581/assets/dataset_images/13-cvc14.png)
|
pedestrian | 8400 | 471x640 | not specified | 8 HE | (pub) Visible-FIR Day-Night Pedestrian Sequence dataset includes two sequences of 3695 day images and 3390 night images, with pedestrians annotated, again divided into distinct train and test sets. | Mil. & Sur. |
| DDPM Speth et al (2021) |
![[Uncaptioned image]](/html/2203.08581/assets/dataset_images/notre_1.png)
|
face | 8M | 80x60 1920×1080 | DMK 33UX290 FLIR C2 | 8 HE | (rr) The dataset includes RBG and IR face videos of 13 hours of recordings of 70 subjects, for an interview scenario, in which the interviewee attempts to deceive the interviewer on selected responses. Besides the RGB and IR videos, the set includes various biometric sensor records. | Mil. & Sur. |
| DIAST Ariffin et al (2016) |
![[Uncaptioned image]](/html/2203.08581/assets/dataset_images/14-daist.jpg)
|
ear | 2200 | 125x125 | FLIR E60 | 8 HE | (pub) The DIAST dataset contains visible and thermal ear images taken from a side face profile, from 55 subjects, collected for the task of ear recognition. | Mil. & Sur. |
| Dim Small Air. Hui et al (2019) |
![[Uncaptioned image]](/html/2203.08581/assets/dataset_images/15-dim-small.png)
|
aircraft | 16K | 256×256 | not specified | 8* HE | (pub) The dataset includes 22 sequences with sky and open-field backgrounds for infrared aircraft detection and recognition tasks. | Mil. & Sur. |
| DMR-IR Visual Lab. (accessed on 2022) |
![[Uncaptioned image]](/html/2203.08581/assets/dataset_images/DMR-IR.png)
|
breast | 1522 | 640x480 | FLIR SC-620 | 8 HE | (pub) The dataset consists of thermal breast images to be used for breast cancer diagnosis. | Medical |
| Dogs Nelson (2020) |
![[Uncaptioned image]](/html/2203.08581/assets/dataset_images/dog.png)
|
pedestrian, dog | 203 | 416x416 | Seek Compact XR | 8 HE | (pub) The dataset includes thermal infrared person and dog images captured in outdoor environments. | Mil. & Sur. |
| Drones Korki14 (2022) |
![[Uncaptioned image]](/html/2203.08581/assets/dataset_images/drone.jpg)
|
drone | 150 | 416x416 640x480 | not specified | 8* HE | (pub) The dataset contains thermal images for detecting UAVs. It provides ground truth bounding boxes for drones. | Mil. & Sur. |
| Table 4 | continued… | |||||||
| EADS D’Angelo et al (2006) |
![[Uncaptioned image]](/html/2203.08581/assets/dataset_images/eads.png)
|
plane, vehicle | not specified | not specified | not specified | 8 HE | (rr) The dataset contains aerial images of vehicles, planes etc, for object detection tasks. Training and validation sets are provided with ground truths. | Mil. & Sur. |
| ESPOL FIR Rivadeneira et al (2019) |
![[Uncaptioned image]](/html/2203.08581/assets/dataset_images/espol_fir.png)
|
person, vehicle, objects | 101 | 640x512 | FLIR TAU 2 | 8 HE | (pub) The dataset contains infrared images taken in outdoor and indoor environments during the day. The dataset is primarily intended for super-resolution problems in the IR domain. | Mil. & Sur. |
| Focus-Obj Faundez-Zanuy et al (2011) |
![[Uncaptioned image]](/html/2203.08581/assets/dataset_images/thermalfocus.png)
|
circuits, heater, face, hand, etc. | 960 | 160×120 | TESTO 880-3 | 8 HE | (rr) The database consists of several image sets. In each set, the camera acquires one image of the scene at 96 different lens positions. | Industrial |
| FREE FLIR FLIR (2022) |
![[Uncaptioned image]](/html/2203.08581/assets/dataset_images/FLIR_00005.jpeg)
|
vehicle bicycle dog pedestrian | 14K images 10k short videos | up to 1280x1024 | IR Tau2 FLIR BlackFly | 8/14 HE/RAW | (rr) The dataset contains 8 bit RGB and 8/14 bit thermal images images, with annotations. The images are captured on streets and highways of Santa Barbara, CA area, in different weather conditions, during day and night. | Mil.& Sur. Industrial |
| FV-USM Mohd Asaari et al (2014) |
![[Uncaptioned image]](/html/2203.08581/assets/dataset_images/FV-USM.png)
|
Finger Vein | 5904 | 640x480 | not specified | 8* HE | (rr) The dataset contains infrared finger images of 83 male and 40 female volunteers for finger vein recognition tasks. | Mil. & Sur. |
| HGRD Mantecon et al (2016) |
![[Uncaptioned image]](/html/2203.08581/assets/dataset_images/16-hand-gesture.png)
|
hand | 20K | 640×240 | not specified | 8 HE | (pub) The Hand Gesture Recognition Dataset (HGRD) includes NIR images of 10 different gestures, performed by 10 different subjects (5 men and 5 women). It has 200 frames for each subject and each hand gesture. | Industrial |
| HS-NIR HACARUS Inc. (2020) |
![[Uncaptioned image]](/html/2203.08581/assets/dataset_images/27-near-inf-hyp.png)
|
coffee bean, sugar, floor, salt | 480 | 192x256 | AHS- U20MIR | 8 HE | (pub) The dataset provides a total of 480 images of 5 objects. For each object, there are 96 different NIR hyperspectral images. | Industrial |
| IIT Delhi Kumar and Srikanth (2008) |
![[Uncaptioned image]](/html/2203.08581/assets/dataset_images/delhi.png)
|
face | 612 | 768x576 | not specified | 8 HE | (rr) The database contains face images, captured at IIT Delhi campus with a webcam, shot with NIR-only illumination. | Mil. & Sur. |
| Illegal Fishers Alqattan (2020) |
![[Uncaptioned image]](/html/2203.08581/assets/x12.jpg)
|
fishing gear, ship | 84 | 640x480 4056x3040 | not specified | 8* HE | (pub) The dataset has raw thermal, visible, and night vision images captured by a drone with a thermal camera to detect the illegal fishing in Kuwaiti Bay. | Mil. & Sur. |
| Indoor-Outdoor IR Morris et al (2007) |
![[Uncaptioned image]](/html/2203.08581/assets/dataset_images/indoor-outdoor.png)
|
person, vehicle, objects | 400 | 384x288 | Thermoteknix Miricle 110KS | 8* HE | (pub) The dataset presents indoor and outdoor IR-visible image pairs. The authors captured the images to compare the statistics of the visible and infrared images. | Mil. & Sur. |
| Table 4 | continued… | |||||||
| InfAR Gao et al (2016) |
![[Uncaptioned image]](/html/2203.08581/assets/dataset_images/infar.png)
|
person | 3.6M (600 vid.) | 293×256 | GUIDIR IR300 | 8* HE | (pub) The first publicly available dataset for infrared action recognition contains video action classes such as walking, hopping, fighting, etc. There are 12 human action classes, each with 50 videos. | Mil.& Sur. Scientific |
| IPATCH Patino et al (2016) |
![[Uncaptioned image]](/html/2203.08581/assets/dataset_images/IPATCH.png)
|
boat | not specified | 640x480 640x512 | FLIR SC655 FLIR A65 | not specified | (pri) The IPATCH dataset contains 14 thermal videos from the coast of Brest, France, for object detection and tracking, event detection, and threat recognition tasks of maritime piracy. There are selected sequences of abnormal events, such as boat speeding up, boat loitering, boat moving around vessel, etc. | Mil. & Sur. |
| IRIS Kong et al (2007) |
![[Uncaptioned image]](/html/2203.08581/assets/dataset_images/18-iris-thermal.png)
|
face | 4228 | 320x240 | Raytheon Palm IR Pro | 8* HE | (pub) The dataset consists of thermal and visible face images with various expressions, poses and illumination conditions. | Mil. & Sur. |
| IRShips Westlake et al (2020) |
![[Uncaptioned image]](/html/2203.08581/assets/dataset_images/19-irship.png)
|
ship | 972K | 1024x512 | N/A | 8 HE | (pub) This dataset contains synthetically generated IR images of 10 different ships. | Mil. & Sur. |
| JPL Iwashita et al (2019) |
![[Uncaptioned image]](/html/2203.08581/assets/dataset_images/20-jpl-mars.png)
|
sand, soil, rocks, bedrock, rocky terrain, etc. | 1300 | 800x600 | FLIR AX65 | 8 HE | (pub) The dataset comprises IR and RGB images, in 2 parts: 1) the Semantic Dataset for Terrain Types and 2) the Virtual Sensor Dataset for deriving RGB-to-IR mapping models. Semantic Dataset includes manually annotated 7 categories: unlabeled, sand, soil, rocks, bedrock, rocky terrain, and ballast. | Scientific |
| KAIST Hwang et al (2015) |
![[Uncaptioned image]](/html/2203.08581/assets/dataset_images/kaist.png)
|
pedestrian | 95K | 320x256 | FLIR A35 | 8 HE | (pub) The dataset contains multispectral images of vehicles captured in day and night traffic with annotations. | Mil. & Sur. |
| Kayak Image Fusion Toet (2002) |
![[Uncaptioned image]](/html/2203.08581/assets/dataset_images/21-kayak.png)
|
kayak | 2541 | up to 752x582 | Raytheon Rad. HS, AEG AIM 256 PLW, Philips LTC500 | 8-8* HE | (pub) This dataset includes sequences with several kayaks in a maritime environment. The images are captured in MWIR, LWIR and visible domains. | Mil. & Sur. |
| L-CAS FACE Coşar et al (2018) |
![[Uncaptioned image]](/html/2203.08581/assets/dataset_images/lcas.png)
|
face | 3000 | 382x288 | Optris PI-450 | 8 HE | (rr) The dataset comprises of thermal images of moving faces, captured with a sensor that is mounted on the top of a robot to measure respiration and heartbeat rate for physiological monitoring. The dataset provides ground truth for respiration and heartbeat. | Mil. & Sur. |
| L-CAS ReID Cosar and Bellotto (2019) |
![[Uncaptioned image]](/html/2203.08581/assets/dataset_images/lcasrgbt.png)
|
person | 36K | 382×288 | Optris PI-450 | 8 HE | (rr) The dataset includes RGB, depth, and thermal images of people for re-identification tasks. The set is collected via a thermal camera on a robot. | Mil. & Sur. |
| Leaves dis (2020) |
![[Uncaptioned image]](/html/2203.08581/assets/dataset_images/39-leaves.jpg)
|
leaf | 636 | 320x240 | FLIR E8 | 8 HE | (pub) The dataset, composed of thermal leaf images, is categorised into 6 categories: bacteria leaf blight, blast, leaf spot, leaf folder, hispa, healthy leaves. | Industrial |
| Table 4 | continued… | |||||||
| LLVIP Jia et al (2021) |
![[Uncaptioned image]](/html/2203.08581/assets/dataset_images/llvip.png)
|
person, vehicle | 31K | 1920×1080 1280×720 | Hikvision DS-2TD8166 75C2F/V2 | 8 HE 16 RAW | (rr) Contains infrared and visible images of pedestrians in low-light conditions. The images contain vehicles, but pedestrians are only labelled. Raw data can also be obtained. | Mil. & Sur. |
| LR-MR-HR FIR Rivadeneira et al (2020) |
![[Uncaptioned image]](/html/2203.08581/assets/dataset_images/lr_mr_hr.jpg)
|
person, animal, vehicle, objects | 3063 | up to 640x512 | Axis Domo P1290 Axis Q2901-E FC-6320 FLIR | 8 HE | (pub) The dataset contains thermal images at different resolutions for image super-resolution tasks. Various levels of resolution are available: low, medium and high resolution, which correspond to 160x120, 320x240, and 640x512 pixels, respectively. There are 1021 images per resolution. | Mil. & Sur. |
| LSI Olmeda et al (2013) |
![[Uncaptioned image]](/html/2203.08581/assets/dataset_images/LSI.png)
|
pedestrian | 20K | 32x64 164x128 | Indigo Omega | 14 RAW | (pub) The set consists of FIR pedestrian images in an outdoor urban environment, divided into train and test sets, with manually annotated bounding boxes. | Mil. & Sur. |
| LSOTB TIR Liu et al (2020) |
![[Uncaptioned image]](/html/2203.08581/assets/dataset_images/lsotb.png)
|
person, animal, vehicle, aircraft, boat | 600K | not specified | not specified | 8 HE | (pub) Contains various object classes with 730K bounding box annotations, shot in various environments, including urban areas, forests, the sea, etc. | Mil. & Sur. |
| LTIR Berg et al (2015) |
![[Uncaptioned image]](/html/2203.08581/assets/dataset_images/46-ltir.png)
|
rhino, human, horse, car, quadrocopter, dog | 11K | up to 1920x480 | FLIR A35 FLIR Tau320 FLIR A655SC | 8/16 HE/RAW | (pub) The dataset includes 20 thermal IR sequences of different objects, captured at indoor and outdoor environments, with annotations. | Mil. & Sur. |
| Mango Naik (2019) |
![[Uncaptioned image]](/html/2203.08581/assets/dataset_images/23-mango.jpg)
|
mango | 309 | 640x480 | FLIR One | 8* HE | (pub) The dataset consists of thermal mango images for object counting and colour feature extraction tasks. | Industrial |
| MBD Sedik et al (2020) |
![[Uncaptioned image]](/html/2203.08581/assets/dataset_images/24-mbd.jpg)
|
finger-print, finger-vein, face, iris | 72 | up to 640x480 | not specified | 8/8*/32 HE | (pub) The set includes 45 thermal fingerprints, 9 thermal finger veins, 9 thermal iris, and 9 thermal face images. | Mil. & Sur. |
| MBDA D’Angelo et al (2006) |
![[Uncaptioned image]](/html/2203.08581/assets/dataset_images/mbda.jpg)
|
plane, helicopter, vehicle, tower | >15K | 320x240 256x256 | N/A | 14/16 RAW | (rr) The dataset contains computer-generated aircraft and vehicle images. Train and validation sets are provided with ground truths. | Mil. & Sur. |
| METU Yaman and Kalkan (2015) |
![[Uncaptioned image]](/html/2203.08581/assets/dataset_images/47-kinect.png)
|
various objects | 24 | 640x480 | Kinect | 8 HE | (pub) METU Kinect dataset consists of IR and visible image pairs of various objects. | Scientific |
| MIntPAIN Haque et al (2018) |
![[Uncaptioned image]](/html/2203.08581/assets/dataset_images/pain.png)
|
person, face | 2M (9366 vid.) | 640x480 | Axis Q 1922 | 8 HE | (rr) The MIntPAIN is an RGB, Depth and Thermal (RGBDT) image set, which contains RGBDT videos of 20 subjects. Each subject has 80 folders in visible, depth, and thermal domains for pain level recognition tasks. | Med.& Sci. |
| Table 4 | continued… | |||||||
| MS Focus Zukal et al (2013) |
![[Uncaptioned image]](/html/2203.08581/assets/dataset_images/multispectral.png)
|
building, car, corridor, head, keyboard, office desk, pens | 420 | 640x480 | Canon EOS 350D FLIR SC660 | 8 HE | (pub) Contains 420 images of 7 objects in different optical focus positions, captured in visible, near-infrared, and thermal spectrum. | Industrial |
| MM-Bio Computer Vision and Biometrics Lab. (2022) |
![[Uncaptioned image]](/html/2203.08581/assets/dataset_images/biometrics.png)
|
face | 2500 | not specified | FLIR E40 | 8 HE | (rr) A multi-model biometric dataset containing thermal and RGB images of 125 people. | Mil. & Sur. |
| MM-Hand mul (2018) |
![[Uncaptioned image]](/html/2203.08581/assets/dataset_images/26-multi-modal-hand.png)
|
hand | 65K | 412x273 | not specified | 8 HE | (pub) Multi-modal Hand Gesture Recognition dataset presents near-infrared images of 15 different hand gestures from 15 different subjects (5 women and 10 men). | Scientific |
| Mov-Tar Sun et al (2021) |
![[Uncaptioned image]](/html/2203.08581/assets/dataset_images/25-moving-target.png)
|
vegetation, building | 150K | 640x512 | not specified | 8 HE | (pub) This dataset contains synthetic small infrared targets embedded in IR background images to be used for target detection and tracking applications. | Mil. & Sur. |
| MS-SS Ha et al (2017) |
![[Uncaptioned image]](/html/2203.08581/assets/dataset_images/ms-ss.png)
|
car, person, bike | 1569 | 480×640 | InfRec R500 | 8* HE | (pub) Contains RGB-Thermal combined images of autonomous vehicles with pixel-level annotations. | Industrial |
| MSSpoof Chingovska et al (2016) |
![[Uncaptioned image]](/html/2203.08581/assets/dataset_images/msspoof.png)
|
face | 4.5K | 1280x1024 | uEye camera | 8 HE | (rr) The dataset contains visible and NIR face images of 21 subjects, designed for spoofing attacks. It provides manual face annotations with 16 key point coordinates. | Mil. & Sur. |
| MS-OD Karasawa et al (2017) |
![[Uncaptioned image]](/html/2203.08581/assets/dataset_images/ms_od.png)
|
bike, car, person | 30K | 320×256 640×480 | InfReC R500 InfReC H8000 Xeva-1.7-320 | 8 HE | (pub) The Multi-Spectral Object Detection dataset contains RGB, NIR, MIR and FIR images for automatic mobile robot tasks in traffic. The authors also present the ground truth labels. There are 7512 images per domain. | Industrial |
| Multi-Focus Benes et al (2013) |
![[Uncaptioned image]](/html/2203.08581/assets/dataset_images/focus.png)
|
uncate-gorised | 576 | 320×240 | TESTO 882-3 | 8 HE | (rr) The set consists of six image sets acquired at different lens positions, by manually moving the lens in 1 mm steps. Each set consists of 96 different images of a single scene. | Industrial |
| ND X1 Chen et al (2005) |
![[Uncaptioned image]](/html/2203.08581/assets/dataset_images/nd-x1.png)
|
face | 4584 | not specified | Merlin uncooled µ-bol. | 8 HE | (rr) The set includes 2292 IR and 2292 visible face images from 82 subjects. | Mil. & Sur. |
| ND-NIVL Bernhard et al (2015) |
![[Uncaptioned image]](/html/2203.08581/assets/dataset_images/notre_5.png)
|
face | 25K | 4770x3177 4288x2848 | Nikon D90 Canon EOS 50D | 8 HE | (rr) The dataset includes RGB face images obtained from 574 subjects and NIR face images obtained from 230 subjects. There are 2341 frames in the visible domain and 22264 frames in the IR domain. | Mil. & Sur. |
| NOAA Science Center (accessed on 2022) |
![[Uncaptioned image]](/html/2203.08581/assets/dataset_images/noaa.png)
|
animal | 80K | 640x512 | FLIR A6751 SLS | 14 RAW | (pub) Contains visible and IR aerial images with annotations. There are additional images with no objects/animals. It can be used for detecting animals on sea ice. | Scientific |
| Table 4 | continued… | |||||||
| NTU RGB+D Shahroudy et al (2016) |
![[Uncaptioned image]](/html/2203.08581/assets/dataset_images/ntu.png)
|
120 human actions | 114K | 512x424 | Kinect V2 | 8 HE | (rr) The dataset contains RGB videos, depth map sequences, 3D skeletal data, and infrared (IR) videos of 82 daily actions, 12 medical conditions, and 26 mutual actions. | Scientific |
| OSU-CTD Davis and Sharma (2007) |
![[Uncaptioned image]](/html/2203.08581/assets/dataset_images/28-osu-color-thermal.png)
|
vehicle, pedestrian | 17089 | 320x240 | Raytheon PalmIR 250D | 8* HE | (pub) The OSU Color-Thermal Database (CDT) includes six colour/thermal sequences, collected at three locations, used for fusion and fusion-based object detection in colour or thermal imagery. | Mil. & Sur. |
| OSU TPD Davis and Keck (2005) |
![[Uncaptioned image]](/html/2203.08581/assets/dataset_images/29-osu-thermal.png)
|
pedestrian | 284 | 360x240 | Raytheon 300D | 8 HE | (pub) The OSU Thermal Pedestrian Database (TPD) includes 10 sequences of videos with annotations of pedestrians who are 50% visible in images. | Mil. & Sur. |
| OTCBVS-P Bilodeau et al (2014) |
![[Uncaptioned image]](/html/2203.08581/assets/dataset_images/30-pedestrian-stereo.jpg)
|
pedestrian | 5390 | 480x360 | FLIR A40M | 8* HE | (pub) Pedestrian Infrared/visible Stereo Video dataset contains 4 visible and infrared video sequences of several people walking with 206 annotated frames and 25819 ground-truth point pairs. | Mil. & Sur. |
| Overhead UMDAMAV-Dataset (2022) |
![[Uncaptioned image]](/html/2203.08581/assets/dataset_images/overhead.jpg)
|
pedestrian | 1.9K | 640x370 | FLIR Vue TZ20 | 8* HE | (pub) The dataset presents thermal images from a UAV perspective, with object annotations. The images do not always include objects. | Mil. & Sur. |
| Parma Bertozzi and Broggi (2006) |
![[Uncaptioned image]](/html/2203.08581/assets/dataset_images/parma.png)
|
pedestrian | 18K | 320x240 | not specified | not specified | (pri) Parma Tetravision dataset, includes visible and infrared images captured from a car, with pedestrian annotations. | Mil. & Sur. |
| PETS 2005 Strat (2005) |
![[Uncaptioned image]](/html/2203.08581/assets/dataset_images/32-pets2005.jpg)
|
vehicle | 5K | 320x256 | not specified | 8* HE | (pub) This an aerial vehicle tracking dataset containing 6 visible and 3 thermal infrared video sequences with annotations. | Mil. & Sur. |
| PTB-TIR Liu and He (2018) |
![[Uncaptioned image]](/html/2203.08581/assets/dataset_images/33-ptb-tir.jpg)
|
vehicle, pedestrian | 30128 | up to 1280×720 | 8 dif. cams. | 8 HE | (pub) TIR pedestrian tracking dataset include manually annotated 60 thermal sequences, divided into nine subsets with different shooting properties. The images are captured indoor and outdoor environments with surveillance, hand-held, vehicle-mounted and drone cameras during day and night. | Mil. & Sur. |
| RGB-NIR Brown and Süsstrunk (2011) |
![[Uncaptioned image]](/html/2203.08581/assets/dataset_images/0036_nir.png)
|
building, mountain, tree, car, motorcy- cle, etc. | 477 | 1024x768 | Canon T1i | 8* HE | (pub) The dataset contains RGB and NIR images of 9 categories: country, field, forest, indoor, mountain, old buildings, street, urban, and water. Some frames include objects like buildings, trees, cars and motorcycles. | Scientific |
| RGBT Salient Tu et al (2020) |
![[Uncaptioned image]](/html/2203.08581/assets/dataset_images/rgbt.png)
|
various objects | 5000 | 640x480 | FLIR T640 T610 | 8 HE | (pub) This dataset contains 5000 thermal/RGB image pairs with ground truth annotations of various objects like sneakers, pontoon, stool, dustbin, headphones for salient object detection tasks. | Scientific |
| RIFIR Miron (2014) |
![[Uncaptioned image]](/html/2203.08581/assets/dataset_images/rifir.png)
|
pedestrian | 20K | 640X480 | not specified | 8* HE | (pub) The dataset contains sequences of images, captured in an urban environment with one FIR and two colour cameras. There are train and test sets, with annotated pedestrians in both visible and IR domains. | Mil. & Sur. |
| Table 4 | continued… | |||||||
| Roboflow-P Projects (2022) |
![[Uncaptioned image]](/html/2203.08581/assets/dataset_images/roboflow-people.jpg)
|
person | 13K | 640x512 | not specified | 8* HE | (pub) The dataset contains IR images of people with annotations. Augmented images are also available. | Mil. & Sur. |
| SAGEM D’Angelo et al (2006) |
![[Uncaptioned image]](/html/2203.08581/assets/dataset_images/sagem.jpg)
|
vehicle, etc. | 1400 | 384x256 | MWIR Matis | 16 RAW | (rr) The dataset contains 16bits raw IR aerial images of vehicles for classification and detection tasks. | Mil. & Sur. |
| SCUT-FIR Xu et al (2019) |
![[Uncaptioned image]](/html/2203.08581/assets/dataset_images/scut.jpg)
|
pedestrian | 211K | 720×576 | NV628 | 8 HE | (pub) The dataset consists of approximately 11-hour-long image sequences captured in various traffic scenarios. 11 road segments are captured in different environments, such as the city centre, suburbs, highway, and campus. | Mil. & Sur. |
| SDT Strohmayer et al (2020) |
![[Uncaptioned image]](/html/2203.08581/assets/dataset_images/36-syntetic.png)
|
person | 48K | 640x480 | FLIR Lepton 3.5 | 16 RAW | (pub) The dataset includes 40k synthetic and 8k real depth and thermal stereo images for human behaviour recognition and person detection tasks, with bounding box annotations. | Mil. & Sur. |
| SENSIAC SENSIAC (2008) |
![[Uncaptioned image]](/html/2203.08581/assets/dataset_images/sensiac.jpg)
|
people, vehicles, etc | not publicly specified | not publicly specified | not publicly specified | not publicly specified | (pri) The dataset contains 207 GB of videos in the IR domain and 106 GB of videos in the visible domain with ground truth data for automatic target recognition (ATR) tasks. Collected by the US Army Night Vision and Electronic Sensors Directorate (NVESD). | Mil. & Sur. |
| Server Liu et al (2019) |
![[Uncaptioned image]](/html/2203.08581/assets/dataset_images/38-server.jpg)
|
server hardware | 1351 | 320x240 | FLIR E8 | 8* HE | (pub) The dataset contains thermal images of servers for detecting the overheated area of the server surface, with five categories: normal status, main fan failure, vice-fan failure, air vent blockage and low-load status. | Industrial |
| SG-Ship Prasad et al (2017) |
![[Uncaptioned image]](/html/2203.08581/assets/dataset_images/35-singapore.png)
|
ship | 24K | 1080x1920 | Canon 70D | 8* HE | (pub) Singapore Maritime dataset The ship videos, are captured at various locations around Singapore waters. The set is divided into three parts, 40 videos for visible on-shore, 11 videos for visible on-board and 30 videos for NIR on-shore shots. The dataset provides annotations in .mat format in 3 folders: horizon, object and track. | Mil. & Sur. |
| Soccer Gade and Moeslund (2018) |
![[Uncaptioned image]](/html/2203.08581/assets/dataset_images/42-soccer.png)
|
people | 3000 | 1920x480 | AXIS Q1922 | 8 HE | (pub) The dataset provides four thermal infrared video sequences of eight soccer players at an indoor sports arena. | Mil. & Sur. |
| Spindle Xiang (2020) |
![[Uncaptioned image]](/html/2203.08581/assets/dataset_images/spindle.png)
|
lathe milling | 1500 | 640x480 | not specified | 8* HE | (rr) Spindle thermal error prediction dataset contains all the thermal images and error data of a spindle, taken on a lathe and a milling machine. | Industrial |
| Surf-Coat Silva and Calado (2020) |
![[Uncaptioned image]](/html/2203.08581/assets/dataset_images/40-optical.jpg)
|
various materials | 449 | 320x240 | FLIR E4 | 8* HE | (pub) This dataset contains raw temperature measurement data of external, and internal surfaces and air in the interior of a structure under different conditions. It has also surface thermographic images of different types of coatings and diffuses reflectance data for these materials. | Industrial |
| Table 4 | continued… | |||||||
| Terravic-F Miezianko (accessed on 2022) |
![[Uncaptioned image]](/html/2203.08581/assets/dataset_images/facial.jpg)
|
face | 23K | 320x240 | Raytheon L3 | 8 HE | (pub) The Terravic Facial dataset consists of 20 thermal infrared facial image sequences, captured from the front, left and right at indoor and outdoor environments. | Mil. & Sur. |
| Terravic-M Miezianko (accessed on 2022) |
![[Uncaptioned image]](/html/2203.08581/assets/dataset_images/44-terravic-motion.jpg)
|
human, plane, dock | 22K | 320x240 | Raytheon L3 | 8 HE | (pub) The Terravic Motion dataset has 18 sequences of thermal infrared images, captured at indoor and outdoor environments for object detection and tracking tasks. | Mil. & Sur. |
| Terravic-W Miezianko (accessed on 2022) |
![[Uncaptioned image]](/html/2203.08581/assets/dataset_images/45-weapon.jpg)
|
person, weapon | 3555 | 320x240 | Raytheon L3 | 8 HE | (pub) The dataset includes 5 thermal IR image sequences for weapon detection and weapon evacuation detection tasks. | Mil. & Sur. |
| TestisT Ghayoumi zadeh et al (2017) |
![[Uncaptioned image]](/html/2203.08581/assets/dataset_images/testis.png)
|
testis | 50 | 640x320 | VIS-IR 640 | 8 HE | (pub) The Testis Thermography dataset contains 50 thermal testis images to detect varicocele. | Medical |
| THALES D’Angelo et al (2006) |
![[Uncaptioned image]](/html/2203.08581/assets/dataset_images/thales.png)
|
vehicle, boat | more than 6K | 320x240 640x512 | not specified | 8/16 HE/RAW | (rr) Contains aerial images obtained from six hours of video recorded from a helicopter in different environments, such as urban, expressway, rural, etc. | Mil. & Sur. |
| The Flame Shamsoshoara et al (2021) |
![[Uncaptioned image]](/html/2203.08581/assets/dataset_images/flame.png)
|
fire | 49K | 640x512 3840x2160 | FLIR Vue Pro R DJI Phantom 3 | 8* HE | (rr) The dataset consists of raw aerial video and raw heat map footage captured by drones, during a pile burn in Northern Arizona. Collected for wildfire detection and includes 47992 labelled frames for fire classification and 2003 ground truth masked frames for fire segmentation. | Mil. & Sur. |
| TIDOC Ashfaq et al (2021) |
![[Uncaptioned image]](/html/2203.08581/assets/dataset_images/41-thermal-image4.jpg)
|
car, cat, pedestrian | 6892 | 300x400 1080x1440 | FLIR Seek Thermal | 8* HE | (pub) The Thermal Image dataset for Object Classification (TIDOC) includes thermal images of three classes, car, cat, and pedestrian. | Mil. & Sur. |
| TIMo Schneider et al (2022) |
![[Uncaptioned image]](/html/2203.08581/assets/dataset_images/timo.png)
|
person | 635.6K | 512x512 288x320 | Microsoft Azure Kinect RGB-D | 16 RAW | (rr) The time-of-Flight Indoor Monitoring dataset presents IR and depth videos. Totally, 612 K frames for anomaly detection and 23.6 K frames for person detection, with annotations for both tasks. For person detection, bounding boxes and segmentation masks are available. | Mil. & Sur. |
| TIRDRD Yoon et al (2016) |
![[Uncaptioned image]](/html/2203.08581/assets/dataset_images/drivable.png)
|
road | 6000 | 640x480 | FLIR A655SC | 8 HE | (pub) Thermal IR-based Drivable Region Detection dataset consists of about 6000 manually annotated images, with road scenarios, such as on-road, off-road, and cluttered road for drivable region detection tasks. | Mil. & Sur. |
| TNO Toet et al (1997) |
![[Uncaptioned image]](/html/2203.08581/assets/dataset_images/tno.png)
|
objects, person, vehicle | 400 | 256x256 | Amber Radiance 1 | 8* HE | (pub) The TNO Image Fusion Dataset consists of visual and IR pairs of images captured at night time. | Mil. & Sur. |
| Transformer Najafi et al (2021) |
![[Uncaptioned image]](/html/2203.08581/assets/dataset_images/43-transformer.png)
|
transformer, induction motors | 255 | 320x240 | Dali-tech T4/T8 | 8* HE | (pub) The dataset contains thermal images of induction motors and transformers for the purpose of condition monitoring. | Industrial |
| Table 4 | continued… | |||||||
| TRICLOBS Toet et al (2016) |
![[Uncaptioned image]](/html/2203.08581/assets/dataset_images/triclobs.jpg)
|
people, vehicle | 57K | 640x480 | XenICs Gobi 384 | 8 HE | (pub) The TRICLOBS (TRI-band Color Low Light OBServation) dataset contains video sequences in visible, NIR and LWIR bands. The main purpose of this dataset is to use image fusion and colour-mapping algorithms for surveillance applications. | Mil. & Sur. |
| Tufts-Face Panetta et al (2018) |
![[Uncaptioned image]](/html/2203.08581/assets/dataset_images/tufts.png)
|
face | 100K | not specified | various cameras | not specified | (rr) Tufts-Face-Database has more than 100K face images of 7 image modes: visible, NIR, thermal, computerised sketch, video, plenoptic and 3D images. | Mil. & Sur. |
| UL-FMTV Ghiass et al (2018) |
![[Uncaptioned image]](/html/2203.08581/assets/dataset_images/UL-FMTV.png)
|
face | 71400 | 640x512 | Indigo Phoenix Thermal | 8 HE | (rr) The ULFMT video dataset includes MWIR band facial videos of 238 subjects for facial pose and expression recognition applications. | Mil. & Sur. |
| UNIRI-TID Krišto et al (2020) |
![[Uncaptioned image]](/html/2203.08581/assets/dataset_images/UNIRI.png)
|
person | 11K | 1280x960 | FLIR Therma -Cam P10 | 8 HE | (rr) This is a collection of thermal videos and images that simulate illegal border crossings and movements in protected areas. The videos were shot in and around the forest at night and in various weather conditions. | Mil. & Sur. |
| VAIS Zhang et al (2015) |
![[Uncaptioned image]](/html/2203.08581/assets/dataset_images/48-vais.png)
|
ship | 1242 | 1024x680 | Sofradir EC Atom 1024 | 8 HE | (pub) VAIS includes IR and visible image sequences of actual ship images captured from piers, along with annotations. | Mil. & Sur. |
| Valle-Aerial Garcia et al (2020) |
![[Uncaptioned image]](/html/2203.08581/assets/x13.jpg)
|
road, car | 110 | 336x256 | Zenmuse XT | 8* HE | (pub) The dataset is made up of thermal and visible aerial images of a planar scene captured using a UAV at Universidad del Valle in Cali, Colombia. | Mil. & Sur. |
| VAP Palmero et al (2016) |
![[Uncaptioned image]](/html/2203.08581/assets/dataset_images/49-vap.jpg)
|
people | 11537 | 640x480 | AXIS Q1922 | 16/32 HE/RAW | (pub) The dataset contains RGB (32bit), depth (16bit), and thermal (32bit) images of people for human detection, human segmentation, person re-identification tasks, with 5724 annotated frames. | Mil. & Sur. |
| ViViD++ Lee et al (2019) |
![[Uncaptioned image]](/html/2203.08581/assets/dataset_images/vivid.png)
|
uncate-gorised | 9290 | 640×480 | FLIR A65 | 8 HE | (rr) The dataset provides normal and poor illumination sequences, captured by thermal, depth, and temporal difference sensors for indoor and outdoor environments. | Scientific |
| VOT-RGBTIR Kristan et al (2016) |
![[Uncaptioned image]](/html/2203.08581/assets/dataset_images/vot.jpg)
|
pedestrian, bike, car, dog, motorcycle | 20K | around 600x400 | not specified | 8* HE | (pub) VOT-RGB TIR 2019 dataset includes infrared images in 60 sequences. Each sequence contains various numbers of images with objects like cars, pedestrians, motorcycles, etc. The dataset has different object annotations, such as baby, child or cars with colour, etc. | Mil. & Sur. |
4 Conclusions and Future Directions
In this survey, we compile a list of publicly available IR image and video sets for artificial intelligence and computer vision researchers. We mainly focus on IR image and video sets, which are collected and labelled for computer vision applications such as object detection, object segmentation, classification, and motion detection. We categorize 109 publicly available or private sets according to their sensor types, image resolution, and scale. The list includes brief descriptions for each set. The statistical details of the entire corpus of IR image & video sets are provided in terms of applications fields, including object categories, resolution, annotations, sensor types and preprocessing details.
We believe that this survey, with solid introductory references to the fundamentals of IR imagery, will be a guideline for computer vision and artificial intelligence researchers who want to delve into working with the spectra beyond the visible domain. Today, consumer electronics are integrating IR cameras with smartphones, making IR imaging a reality within the consumer market. Within a short time, the IR domain will host a large number of pre-trained deep learning models. Therefore, this collection can be used to research deep learning models for vision problems like IR domain adaptation, multi-modal vision, and fusion in the future. Such an approach may result in IR subband-specific deep feature extractors, which can be used for a variety of vision tasks. These models would need very large-scale sets. A crucial practice in the future would be the ongoing updating of this survey, especially in light of the possibility that annotated IR sets may soon be made available in vast quantities.
Declarations
The authors have no conflicts of interest to declare that are relevant to the content of this article.
Data Availability Statement
The dataset generated during the current study is available from the corresponding author upon reasonable request.
References
- \bibcommenthead
- mul (2018) (2018) Multi-modal dataset for hand gesture recognition. Available at https://www.kaggle.com/gti-upm/multimodhandgestrec
- dis (2020) (2020) Thermal images - diseased and healthy leaves - paddy. Available at https://www.kaggle.com/sujaradha/thermal-images-diseased-healthy-leaves-paddy?select=thermal+images+UL
- Akula et al (2014) Akula A, Khanna N, Ghosh R, et al (2014) Adaptive contour-based statistical background subtraction method for moving target detection in infrared video sequences. Infrared Physics and Technology 63:103–109. Available at http://vcipl-okstate.org/pbvs/bench/
- Alqattan (2020) Alqattan M (2020) A dataset of raw thermal, visible and night vision images for illegal fishers in the kuwaiti bay. 10.17632/69ncy4nxsg.1, Available at https://data.mendeley.com/datasets/69ncy4nxsg/1
- Aniket (2022) Aniket A (2022) bird dataset. Available at https://universe.roboflow.com/antiuav-9-aniket/bird-6le8u
- Ariffin et al (2016) Ariffin SMZSZ, Jamil N, Rahman PNMA (2016) Diast variability illuminated thermal and visible ear images datasets. In: 2016 Signal Processing: Algorithms, Architectures, Arrangements, and Applications (SPA), pp 191–195, 10.1109/SPA.2016.7763611, Available at http://vcipl-okstate.org/pbvs/bench/
- Ashfaq et al (2021) Ashfaq Q, Akram U, Zafar R (2021) Thermal image dataset for object classification. 10.17632/btmrycjpbj.1, Available at https://data.mendeley.com/datasets/btmrycjpbj/1
- AV-Public (2022) AV-Public (2022) All thermal dataset. Available at https://universe.roboflow.com/avpublic/all_ther
- Bagavathiappan et al (2013) Bagavathiappan S, Lahiri B, Saravanan T, et al (2013) Infrared thermography for condition monitoring - a review. Infrared Physics and Technology 60:35–55
- Bahnsen and Moeslund (2018) Bahnsen CH, Moeslund TB (2018) Rain removal in traffic surveillance: Does it matter? IEEE Transactions on Intelligent Transportation Systems pp 1–18. 10.1109/TITS.2018.2872502, Available at https://www.kaggle.com/aalborguniversity/aau-rainsnow/
- Benes et al (2013) Benes R, Dvorak P, Faundez-Zanuy M, et al (2013) Multi-focus thermal image fusion. Pattern Recognition Letters 34(5):536–544. Available at http://splab.cz/en/download/databaze/multi-focus-thermal-image-database
- Berg et al (2015) Berg A, Ahlberg J, Felsberg M (2015) A thermal object tracking benchmark. In: Advanced Video and Signal Based Surveillance (AVSS), 2015 12th IEEE International Conference on, Available at http://www.cvl.isy.liu.se/en/research/datasets/ltir/version1.0/
- Bernhard et al (2015) Bernhard J, Barr J, Bowyer KW, et al (2015) Near-ir to visible light face matching: Effectiveness of pre-processing options for commercial matchers. In: 2015 IEEE 7th International Conference on Biometrics Theory, Applications and Systems (BTAS), pp 1–8, 10.1109/BTAS.2015.7358780, Available at https://cvrl.nd.edu/projects/data/
- Bertozzi and Broggi (2006) Bertozzi M, Broggi MVGDRMA.and Felisa (2006) Low-level pedestrian detection by means of visible and far infra-red tetra-vision. Maintained by http://vislab.it/
- Bilodeau et al (2014) Bilodeau GA, Torabi A, St-Charles PL, et al (2014) Thermal–visible registration of human silhouettes: A similarity measure performance evaluation. Infrared Physics and Technology 64:79–86. Available at http://vcipl-okstate.org/pbvs/bench/
- Bondi et al (2020) Bondi E, Jain R, Aggrawal P, et al (2020) Birdsai: A dataset for detection and tracking in aerial thermal infrared videos. In: WACV, Available at https://sites.google.com/view/elizabethbondi/dataset
- Boreman (1998) Boreman GD (1998) Basic electro-optics for electrical engineers, vol 31. SPIE Press
- Brown and Süsstrunk (2011) Brown M, Süsstrunk S (2011) Multispectral SIFT for scene category recognition. In: Computer Vision and Pattern Recognition (CVPR11), Colorado Springs, pp 177–184, Available at https://ivrlwww.epfl.ch/supplementary_material/cvpr11/index.html
- Buser and Tompsett (1997) Buser RG, Tompsett MF (1997) Historical overview. In: Semiconductors and Semimetals, vol 47. Elsevier, p 1–16
- Chen et al (2005) Chen X, Flynn P, Bowyer K (2005) Ir and visible light face recognition. Computer Vision and Image Understanding 99:332–358. 10.1016/j.cviu.2005.03.001, Available at https://cvrl.nd.edu/projects/data/
- Chingovska et al (2016) Chingovska I, Erdogmus N, Anjos A, et al (2016) Face Recognition Systems Under Spoofing Attacks, Springer International Publishing, Cham, pp 165–194. 10.1007/978-3-319-28501-6_8, URL https://doi.org/10.1007/978-3-319-28501-6_8, Available at https://www.idiap.ch/en/dataset/msspoof
- Clerke (2003) Clerke AM (2003) A popular history of astronomy during the nineteenth century. Sattre Pr
- Computer Vision and Biometrics Lab. (2022) Computer Vision and Biometrics Lab. (2022) Multimodal biometrics dataset thermal face images. Available at https://cvbl.iiita.ac.in/dataset.php
- Cosar and Bellotto (2019) Cosar S, Bellotto N (2019) Human re-identification with a robot thermal camera using entropy-based sampling. Journal of Intelligent and Robotic Systems https://doi.org/10.1007/s10846-019-01026-w, Available at https://lcas.lincoln.ac.uk/wp/research/data-sets-software/l-cas-rgb-d-t-re-identification-dataset/
- Coşar et al (2018) Coşar S, Yan Z, Zhao F, et al (2018) Thermal camera based physiological monitoring with an assistive robot. In: 2018 40th Annual International Conference of the IEEE Engineering in Medicine and Biology Society (EMBC), pp 5010–5013, 10.1109/EMBC.2018.8513201, Available at https://lcas.lincoln.ac.uk/wp/research/data-sets-software/
- D’Angelo et al (2006) D’Angelo E, Herbin S, Ratieville M (2006) Robin challenge. Available at https://robin.inrialpes.fr/testsdefinitions.php
- Daniels (2018) Daniels A (2018) Field Guide to Infrared Optics, Materials, and Radiometry, vol FG39. SPIE
- Davis and Keck (2005) Davis JW, Keck MA (2005) A two-stage template approach to person detection in thermal imagery. In: 2005 Seventh IEEE Workshops on Applications of Computer Vision (WACV/MOTION’05)-Volume 1, IEEE, pp 364–369, Available at http://vcipl-okstate.org/pbvs/bench/
- Davis and Sharma (2007) Davis JW, Sharma V (2007) Background-subtraction using contour-based fusion of thermal and visible imagery. Computer vision and image understanding 106(2-3):162–182. Available at http://vcipl-okstate.org/pbvs/bench/
- Dodge and Karam (2017) Dodge SF, Karam LJ (2017) A study and comparison of human and deep learning recognition performance under visual distortions. CoRR abs/1705.02498. URL http://arxiv.org/abs/1705.02498, https://arxiv.org/abs/arXiv:1705.02498
- Erazo-Aux et al (2020) Erazo-Aux J, Loaiza-Correa H, Restrepo-Giron AD, et al (2020) Thermal imaging dataset from composite material academic samples inspected by pulsed thermography. Data in brief 32:106,313. 10.1016/j.dib.2020.106313, URL https://europepmc.org/articles/PMC7508994, Available at https://data.mendeley.com/datasets/v4knrwgj9y/2
- Faundez-Zanuy et al (2011) Faundez-Zanuy M, Mekyska J, Espinosa-Duró V (2011) On the focusing of thermal images. Pattern Recognition Letters 32:1548–1557. 10.1016/j.patrec.2011.04.022, Available at http://splab.cz/en/download/databaze/thermal-focus-image-database
- Faundez-Zanuy et al (2013) Faundez-Zanuy M, Mekyska J, Font X (2013) A new hand image database simultaneously acquired in visible, near-infrared and thermal spectrums. Cognitive Computation 6. 10.1007/s12559-013-9230-3, Available at http://splab.cz/en/download/databaze/carl-database
- FLIR (2022) FLIR (2022) Free flir thermal dataset for algorithm training. Available at https://www.flir.com/oem/adas/adas-dataset-form/
- Gade and Moeslund (2018) Gade R, Moeslund TB (2018) Constrained multi-target tracking for team sports activities. IPSJ Transactions on Computer Vision and Applications 10(1):1–11. Available at https://www.kaggle.com/aalborguniversity/thermal-soccer-dataset
- Gao et al (2016) Gao C, Du Y, Liu J, et al (2016) Infar dataset: Infrared action recognition at different times. Neurocomputing 212:36–47. https://doi.org/10.1016/j.neucom.2016.05.094, Available at https://drive.google.com/file/d/0B8URzo24xElURU1Oa0ctYmpaTlk/view?usp=sharing&resourcekey=0-6EOSjRX7_Ea-14tJorumrg
- Garcia et al (2020) Garcia L, Diaz J, Loaiza Correa H, et al (2020) Thermal and visible aerial imagery. 10.17632/ffgxxzx298.2, Available at https://data.mendeley.com/datasets/ffgxxzx298/2
- Gebhardt and Wolf (2018) Gebhardt E, Wolf M (2018) Camel dataset for visual and thermal infrared multiple object detection and tracking. In: 2018 15th IEEE International Conference on Advanced Video and Signal Based Surveillance (AVSS), IEEE, pp 1–6, Available at https://camel.ece.gatech.edu/
- Ghayoumi zadeh et al (2016) Ghayoumi zadeh H, Haddadnia J, Seryasat O, et al (2016) Segmenting breast cancerous regions in thermal images using fuzzy active contours 10.17877/DE290R-17666, Available at http://database.irthermo.ir/
- Ghayoumi zadeh et al (2017) Ghayoumi zadeh H, Namdari F, Dadpay M, et al (2017) Evaluation of thermal imaging in the diagnosis and classification of varicocele. Iranian journal of medical physics 14:114–121. 10.22038/ijmp.2017.20753.1200, Available at http://database.irthermo.ir/
- Ghiass et al (2018) Ghiass R, Bendada H, Maldague X (2018) Université laval face motion and time-lapse video database (ul-fmtv). 10.21611/qirt.2018.051, Available at http://www.qirt.org/liens/FMTV.htm
- Gonzalez Alzate et al (2016) Gonzalez Alzate A, Fang Z, Socarras Y, et al (2016) Pedestrian detection at day/night time with visible and fir cameras: A comparison. Sensors 16:820. 10.3390/s16060820
- Ha et al (2017) Ha Q, Watanabe K, Karasawa T, et al (2017) Mfnet: Towards real-time semantic segmentation for autonomous vehicles with multi-spectral scenes. In: 2017 IEEE/RSJ International Conference on Intelligent Robots and Systems (IROS), pp 5108–5115, 10.1109/IROS.2017.8206396, Available at https://www.mi.t.u-tokyo.ac.jp/static/projects/mil_multispectral/
- HACARUS Inc. (2020) HACARUS Inc. (2020) Near infrared hyperspectral image dataset. Available at https://www.kaggle.com/hacarus/near-infrared-hyperspectral-image
- HAMAMATSU PHOTONICS K.K., Solid State Division (2011) HAMAMATSU PHOTONICS K.K., Solid State Division (2011) Characteristics and Use of Infrared Dedectors. Tech. rep.
- Haque et al (2018) Haque MA, Bautista RB, Noroozi F, et al (2018) Deep multimodal pain recognition: a database and comparison of spatio-temporal visual modalities. In: 2018 13th IEEE International Conference on Automatic Face and Gesture Recognition (FG 2018), IEEE, pp 250–257, Available at https://vap.aau.dk/mintpain-database/
- He et al (2021) He Y, Deng B, Wang H, et al (2021) Infrared machine vision and infrared thermography with deep learning: A review. Infrared physics and technology 116
- Hou et al (2022) Hou F, Zhang Y, Zhou Y, et al (2022) Review on infrared imaging technology. Sustainability 14(18). 10.3390/su141811161, URL https://www.mdpi.com/2071-1050/14/18/11161
- Huda et al (2020) Huda NU, Hansen BD, Gade R, et al (2020) The effect of a diverse dataset for transfer learning in thermal person detection. Sensors 20(7). Available at https://www.kaggle.com/noorulhuda90/aaupdt
- Hudson et al (1976) Hudson R, Hudson J, Levinstein H (1976) Infrared detectors. Physics Today 29(3):59
- Hui et al (2019) Hui B, Song Z, Fan H, et al (2019) A dataset for infrared image dim-small aircraft target detection and tracking under ground / air background. doi:10.11922/sciencedb.902, URL http://www.dx.doi.org/10.11922/sciencedb.902, Available at https://www.scidb.cn/en/detail?dataSetId=720626420933459968&dataSetType=journal
- Hwang et al (2015) Hwang S, Park J, Kim N, et al (2015) Multispectral pedestrian detection: Benchmark dataset and baseline. In: Proceedings of the IEEE conference on computer vision and pattern recognition, pp 1037–1045, Available at https://soonminhwang.github.io/rgbt-ped-detection/
- Iwashita et al (2019) Iwashita Y, Nakashima K, Stoica A, et al (2019) Tu-net and tdeeplab: Deep learning-based terrain classification robust to illumination changes, combining visible and thermal imagery. pp 280–285, 10.1109/MIPR.2019.00057, Available at http://robotics.ait.kyushu-u.ac.jp/~yumi/db/jpl_marsyard_db.html
- Jia et al (2021) Jia X, Zhu C, Li M, et al (2021) Llvip: A visible-infrared paired dataset for low-light vision. In: Proceedings of the IEEE/CVF International Conference on Computer Vision, pp 3496–3504, Available at https://bupt-ai-cz.github.io/LLVIP/
- Karasawa et al (2017) Karasawa T, Watanabe K, Ha Q, et al (2017) Multispectral object detection for autonomous vehicles. Proceedings of the on Thematic Workshops of ACM Multimedia 2017 Available at https://www.mi.t.u-tokyo.ac.jp/static/projects/mil_multispectral/
- Karim and Andersson (2013) Karim A, Andersson JY (2013) Infrared detectors: Advances, challenges and new technologies. In: IOP Conference Series: Materials Science and Engineering, IOP Publishing, p 012001
- Kong et al (2007) Kong S, Heo J, Boughorbel F, et al (2007) Multiscale fusion of visible and thermal ir images for illumination-invariant face recognition. International Journal of Computer Vision 71:215–233. 10.1007/s11263-006-6655-0, Available at http://vcipl-okstate.org/pbvs/bench/
- Korki14 (2022) Korki14 (2022) Drones dataset. Available at https://universe.roboflow.com/korki14/drones-srdze
- Kristan et al (2016) Kristan M, Matas J, Leonardis A, et al (2016) A novel performance evaluation methodology for single-target trackers. IEEE Transactions on Pattern Analysis and Machine Intelligence 38(11):2137–2155. 10.1109/TPAMI.2016.2516982, Available at https://www.votchallenge.net/vot2019/dataset.html
- Krišto et al (2020) Krišto M, Ivasic-Kos M, Pobar M (2020) Thermal object detection in difficult weather conditions using yolo. IEEE Access 8:125,459–125,476. 10.1109/ACCESS.2020.3007481, Available at https://dx.doi.org/10.21227/yec9-yy29
- Kruse (1995) Kruse P (1995) A comparison of the limits to the performance of thermal and photon detector imaging arrays. Infrared Physics and Technology 36(5):869–882. https://doi.org/10.1016/1350-4495(95)00014-P, URL https://www.sciencedirect.com/science/article/pii/135044959500014P
- Kumar and Srikanth (2008) Kumar A, Srikanth T (2008) Online personal identification in night using multiple face representations. In: 2008 19th International Conference on Pattern Recognition, pp 1–4, 10.1109/ICPR.2008.4761695, Available at https://www4.comp.polyu.edu.hk/~csajaykr/IITD/FaceIR.htm
- Lee et al (2019) Lee AJ, Cho Y, Shin Ys, et al (2019) Vivid : Vision for visibility dataset. Available at https://visibilitydataset.github.io/
- Li et al (2007) Li SZ, Chu R, Liao S, et al (2007) Illumination invariant face recognition using near-infrared images. IEEE Transactions on pattern analysis and machine intelligence 29(4):627–639. Available at http://vcipl-okstate.org/pbvs/bench/
- Liu et al (2019) Liu H, Bao C, Xie T, et al (2019) Research on the intelligent diagnosis method of the server based on thermal image technology. Infrared Physics and Technology 96:390–396. Available at https://www.kaggle.com/liuhangaz/thermal-images-of-the-server
- Liu and He (2018) Liu Q, He Z (2018) PTB-TIR: A thermal infrared pedestrian tracking benchmark. CoRR abs/1801.05944. URL http://arxiv.org/abs/1801.05944, Available at https://github.com/QiaoLiuHit/PTB-TIR_Evaluation_toolkit, https://arxiv.org/abs/arXiv:1801.05944
- Liu et al (2020) Liu Q, Li X, He Z, et al (2020) Lsotb-tir: A large-scale high-diversity thermal infrared object tracking benchmark. 10.1145/3394171.3413922, Available at https://github.com/QiaoLiuHit/LSOTB-TIR
- Lord (1992) Lord SD (1992) A new software tool for computing Earth’s atmospheric transmission of near- and far-infrared radiation. NASA Technical Memorandum 103957
- Mantecon et al (2016) Mantecon T, Del-Blanco C, Jaureguizar F, et al (2016) Hand gesture recognition using infrared imagery provided by leap motion controller. pp 47–57, 10.1007/978-3-319-48680-2_5, Available at https://www.kaggle.com/gti-upm/leapgestrecog
- Miezianko (accessed on 2022) Miezianko R (accessed on 2022) Terravic research infrared database. Available at http://vcipl-okstate.org/pbvs/bench/
- Miron (2014) Miron A (2014) Multi-modal, multi-domain pedestrian detection and classification : Proposals and explorations in visible over stereovision, fir and swir Available at https://zenodo.org/record/3754168#.YIvye7UzZPa
- Mohd Asaari et al (2014) Mohd Asaari MS, Suandi SA, Rosdi B (2014) Fusion of band limited phase only correlation and width centroid contour distance for finger based biometrics. Expert Systems with Applications 41:3367–3382. 10.1016/j.eswa.2013.11.033, Available at http://drfendi.com/fv_usm_database/
- Morris et al (2007) Morris N, Avidan S, Matusik W, et al (2007) Statistics of infrared images. pp 1–7, 10.1109/CVPR.2007.383003, Available at http://www.dgp.toronto.edu/~nmorris/IR/
- Naik (2019) Naik S (2019) Thermal mango image dataset - flir one. 10.17632/vksfkmphzs.1, Available at https://data.mendeley.com/datasets/vksfkmphzs/1
- Najafi et al (2021) Najafi M, Baleghi Y, Mirimani SM (2021) Thermal images dataset, transformer, 1 phase dry type. 10.17632/8mg8mkc7k5.2, Available at https://data.mendeley.com/datasets/8mg8mkc7k5/2
- Nelson (2020) Nelson J (2020) Thermal dogs and people object detection dataset. Available at https://public.roboflow.com/object-detection/thermal-dogs-and-people
- Olmeda et al (2013) Olmeda D, Premebida C, Nunes U, et al (2013) Pedestrian detection in far infrared images. Integrated Computer-Aided Engineering 20. 10.3233/ICA-130441, Available at https://e-archivo.uc3m.es/handle/10016/17370
- Palmero et al (2016) Palmero C, Clapés A, Holmberg Bahnsen C, et al (2016) Multi-modal rgb–depth–thermal human body segmentation. International Journal of Computer Vision 118. 10.1007/s11263-016-0901-x, Available at https://vap.aau.dk/vap-trimodal-people-segmentation-dataset/
- Panetta et al (2018) Panetta K, Wan Q, Agaian S, et al (2018) A comprehensive database for benchmarking imaging systems. IEEE transactions on pattern analysis and machine intelligence 42(3):509–520. Available at https://www.kaggle.com/kpvisionlab/tufts-face-database?select=file_1
- Parr et al (2005) Parr AC, Datla R, Gardner J (2005) Optical radiometry, vol 41. Elsevier
- Patino et al (2016) Patino L, Cane T, Vallee A, et al (2016) Pets 2016: Dataset and challenge. In: Proceedings of the IEEE Conference on Computer Vision and Pattern Recognition Workshops, pp 1–8, Available at http://www.cvg.reading.ac.uk/PETS2016/a.html
- Perpetuini et al (2021) Perpetuini D, Filippini C, Cardone D, et al (2021) An overview of thermal infrared Imaging-Based screenings during pandemic emergencies. International Journal of Environmental Research and Public Health 18(6)
- Piñeiro-Ave et al (2014) Piñeiro-Ave J, Blanco-Velasco M, Cruz-Roldán F, et al (2014) Target detection for low cost uncooled mwir cameras based on empirical mode decomposition. Infrared Physics and Technology 63:222–231
- Portmann et al (2014) Portmann J, Lynen S, Chli M, et al (2014) People detection and tracking from aerial thermal views. In: 2014 IEEE International Conference on Robotics and Automation (ICRA), pp 1794–1800, 10.1109/ICRA.2014.6907094, Available at https://projects.asl.ethz.ch/datasets/doku.php?id=ir%3Airicra2014
- Prasad et al (2017) Prasad DK, Rajan D, Rachmawati L, et al (2017) Video processing from electro-optical sensors for object detection and tracking in a maritime environment: A survey. IEEE Transactions on Intelligent Transportation Systems 18(8):1993–2016. 10.1109/TITS.2016.2634580, Available at https://sites.google.com/site/dilipprasad/home/singapore-maritime-dataset
- Projects (2022) Projects RU (2022) People detection - thermal dataset. Available at https://universe.roboflow.com/roboflow-universe-projects/people-detection-thermal
- Rivadeneira et al (2019) Rivadeneira RE, Suárez PL, Sappa AD, et al (2019) Thermal image superresolution through deep convolutional neural network. In: International Conference on Image Analysis and Recognition, Springer, pp 417–426, Available at https://github.com/rafariva/ThermalDatasets
- Rivadeneira et al (2020) Rivadeneira RE, Sappa AD, Vintimilla BX (2020) Thermal image super-resolution: a novel architecture and dataset. In: International Conference on Computer Vision Theory and Applications, pp 1–2, Available at https://github.com/rafariva/ThermalDatasets
- Roboflow (2020) Roboflow (2020) Thermal cheetah object detection dataset. Available at https://public.roboflow.com/object-detection/thermal-cheetah
- Rogalski (1997) Rogalski A (1997) Infrared thermal detectors versus photon detectors: I. Pixel performance. In: Sizov FF, Tetyorkin VV (eds) Material Science and Material Properties for Infrared Optoelectronics, International Society for Optics and Photonics, vol 3182. SPIE, pp 14 – 25, URL https://doi.org/10.1117/12.280417
- Rogalski (2002) Rogalski A (2002) Infrared detectors: an overview. Infrared physics and technology 43(3-5):187–210
- S. Pini and Cucchiara (2020) S. Pini GBRVA. D’Eusanio, Cucchiara R (2020) Baracca: a multimodal dataset for anthropometric measurements in automotive. In: Proceedings of the International joint Conference on Biometrics (IJCB), Available at https://aimagelab.ing.unimore.it/imagelab/page.asp?IdPage=37
- Schneider et al (2022) Schneider P, Anisimov Y, Islam R, et al (2022) Timo: a dataset for indoor building monitoring with a time-of-flight camera. Sensors 22(11). 10.3390/s22113992, URL https://www.mdpi.com/1424-8220/22/11/3992, Available at https://vizta-tof.kl.dfki.de/timo-dataset-overview/
- Science Center (accessed on 2022) Science Center AF (accessed on 2022) A dataset for machine learning algorithm development. Available at https://lila.science/datasets/noaa-arctic-seals-2019/
- Sedik et al (2020) Sedik A, Abd El-Rahiem B, Abd El-Samie F, et al (2020) Mbd: Multi-biometric dataset. 10.17632/94ksjgbwnz.1, Available at https://data.mendeley.com/datasets/94ksjgbwnz/1
- SENSIAC (2008) SENSIAC (2008) Military sensing information analysis center (sensiac). Available at https://www.sensiac.org/external/products/list_databases/
- Shahroudy et al (2016) Shahroudy A, Liu J, Ng TT, et al (2016) Ntu rgb+ d: A large scale dataset for 3d human activity analysis. In: Proceedings of the IEEE conference on computer vision and pattern recognition, pp 1010–1019, Available at https://rose1.ntu.edu.sg/dataset/actionRecognition/
- Shamsoshoara et al (2021) Shamsoshoara A, Afghah F, Razi A, et al (2021) Aerial imagery pile burn detection using deep learning: The flame dataset. Computer Networks 193:108,001. 10.1016/j.comnet.2021.108001, Available at https://dx.doi.org/10.21227/qad6-r683
- Silva and Calado (2020) Silva A, Calado C (2020) Thermal and optical behavior dataset of surfaces coated with high reflectance and common materials under different conditions, used in brazil. Data in Brief 30:105,445. 10.1016/j.dib.2020.105445, Available at https://data.mendeley.com/datasets/gnhjwsf6jf/2
- Socarras et al (2013) Socarras Y, Ramos S, Vazquez D, et al (2013) Adapting pedestrian detection from synthetic to far infrared images. Available at http://adas.cvc.uab.es/elektra/enigma-portfolio/item-1/
- Soundrapandiyan et al (2022) Soundrapandiyan R, Satapathy SC, P.V.S.S.R. CM, et al (2022) A comprehensive survey on image enhancement techniques with special emphasis on infrared images. Multimedia Tools and Applications 81(7):9045–9077. 10.1007/s11042-021-11250-y, URL https://doi.org/10.1007/s11042-021-11250-y
- Sousa et al (2017) Sousa E, Vardasca R, Teixeira S, et al (2017) A review on the application of medical infrared thermal imaging in hands. Infrared Physics and Technology 85:315–323. https://doi.org/10.1016/j.infrared.2017.07.020, URL https://www.sciencedirect.com/science/article/pii/S1350449517304024
- Speth et al (2021) Speth J, Vance N, Czajka A, et al (2021) Deception detection and remote physiological monitoring: A dataset and baseline experimental results Available at https://cvrl.nd.edu/projects/data/
- Strat (2005) Strat T (2005) Vivid tracking evaluation web site. Available at http://vision.cse.psu.edu/data/vividEval/datasets/datasets.html
- Strohmayer et al (2020) Strohmayer J, Pramerdorfer C, Kampel M (2020) Sdt: A synthetic multi-modal dataset for person detection and pose classification Available at https://zenodo.org/record/4124309#.YWlGKRpBxPZ
- Sun et al (2021) Sun X, Guo L, Zhang W, et al (2021) A dataset for small infrared moving target detection under clutter background. v1. Available at https://datapid.cn/31253.11.sciencedb.j00001.00231
- Teutsch et al (2021) Teutsch M, Sappa AD, Hammoud RI (2021) Computer vision in the infrared spectrum: challenges and approaches. Synthesis Lectures on Computer Vision 10(2):1–138
- Toet (2002) Toet A (2002) Detection of dim point targets in cluttered maritime backgrounds through multisensor image fusion. In: Targets and Backgrounds VIII: Characterization and Representation, International Society for Optics and Photonics, pp 118–129, Available at https://figshare.com/articles/dataset/Kayak_image_fusion_sequence_Part_I/1007650
- Toet et al (1997) Toet A, IJspeert J, Waxman A, et al (1997) Fusion of visible and thermal imagery improves situational awareness. Displays 18(2):85–95. https://doi.org/10.1016/S0141-9382(97)00014-0, Available at https://figshare.com/articles/dataset/TNO_Image_Fusion_Dataset/1008029?file=37872186
- Toet et al (2016) Toet A, Hogervorst MA, Pinkus AR (2016) The triclobs dynamic multiband image dataset. Available at https://figshare.com/articles/dataset/The_TRICLOBS_Dynamic_Multiband_Image_Dataset/3206887/1
- Tu et al (2020) Tu Z, Ma Y, Li Z, et al (2020) Rgbt salient object detection: A large-scale dataset and benchmark. arXiv preprint arXiv:200703262 Available at https://github.com/lz118/RGBT-Salient-Object-Detection
- UMDAMAV-Dataset (2022) UMDAMAV-Dataset (2022) Thermal overhead dataset. Available at https://universe.roboflow.com/umdamavdataset/thermal_overhead
- Venkataraman and Raj (2003) Venkataraman B, Raj B (2003) Performance parameters for thermal imaging systems. Insight-Non-Destructive Testing and Condition Monitoring 45(8):531–535
- Visual Lab. (accessed on 2022) Visual Lab. (accessed on 2022) Thermal images for breast cancer diagnosis dmr-ir. Available at http://visual.ic.uff.br/en/proeng/thiagoelias/
- Vollmer and Möllmann (2017) Vollmer M, Möllmann KP (2017) Infrared thermal imaging: fundamentals, research and applications. John Wiley and Sons
- Wang et al (2014) Wang Y, Jodoin PM, Porikli F, et al (2014) Cdnet 2014: An expanded change detection benchmark dataset. In: Proceedings of the IEEE conference on computer vision and pattern recognition workshops, pp 387–394, Available at http://jacarini.dinf.usherbrooke.ca/dataset2014/
- Wayne Treible (2017) Wayne Treible SSAKMOBPKSCKPhilip Saponaro (2017) Cats: A color and thermal stereo benchmark. In: Conference on Computer Vision and Pattern Recognition (CVPR), Available at http://bigdatavision.org/CATS/download.html
- Westlake et al (2020) Westlake ST, Volonakis TN, Jackman J, et al (2020) Deep learning for automatic target recognition with real and synthetic infrared maritime imagery. In: Artificial Intelligence and Machine Learning in Defense Applications II, International Society for Optics and Photonics, p 1154309, Available at https://cord.cranfield.ac.uk/articles/dataset/IRShips/12800324
- Wu et al (2014) Wu Z, Fuller N, Theriault D, et al (2014) A thermal infrared video benchmark for visual analysis. In: 2014 IEEE Conference on Computer Vision and Pattern Recognition Workshops, pp 201–208, 10.1109/CVPRW.2014.39, Available at http://csr.bu.edu/BU-TIV/BUTIV.html
- Xiang (2020) Xiang S (2020) Spindle thermal error prediction approach based on thermal infrared images: a deep learning method. 10.21227/vwp1-q708, Available at https://dx.doi.org/10.21227/vwp1-q708
- Xu et al (2019) Xu Z, Zhuang J, Liu Q, et al (2019) Benchmarking a large-scale fir dataset for on-road pedestrian detection. Infrared Physics and Technology 96:199–208. https://doi.org/10.1016/j.infrared.2018.11.007, Available at https://github.com/SCUT-CV/SCUT_FIR_Pedestrian_Dataset
- Yaman and Kalkan (2015) Yaman M, Kalkan S (2015) An iterative adaptive multi-modal stereo-vision method using mutual information Available at https://kovan.ceng.metu.edu.tr/MMStereoDataset/
- Yoon et al (2016) Yoon JS, Park K, Hwang S, et al (2016) Thermal-infrared based drivable region detection. In: Intelligent Vehicles Symposium (IV), 2016 IEEE, IEEE, pp 978–985, Available at https://sites.google.com/site/drivableregion/
- Zhang et al (2018) Zhang H, Luo C, Wang Q, et al (2018) A novel infrared video surveillance system using deep learning based techniques. Multimedia Tools and Applications 77(20):26,657–26,676. Available at http://www.lpi.tel.uva.es/AALARTDATA
- Zhang and Rui (2013) Zhang L, Rui Y (2013) Image search—from thousands to billions in 20 years. ACM Trans Multimedia Comput Commun Appl 9(1s). 10.1145/2490823, URL https://doi.org/10.1145/2490823
- Zhang et al (2015) Zhang MM, Choi J, Daniilidis K, et al (2015) Vais: A dataset for recognizing maritime imagery in the visible and infrared spectrums. In: 2015 IEEE Conference on Computer Vision and Pattern Recognition Workshops (CVPRW), pp 10–16, 10.1109/CVPRW.2015.7301291, Available at http://vcipl-okstate.org/pbvs/bench/
- Zukal et al (2013) Zukal M, Mekyska J, Cika P, et al (2013) Interest points as a focus measure in multi-spectral imaging. Radioengineering 22:68–81. Available at http://splab.cz/en/download/databaze/multispec
Appendix 1
4.1 List of Abbreviations
| CT | Computerised Tomography |
| CTE | Coefficient of Thermal Expansion |
| D* | Detectivity |
| E | Emissivity |
| ES | Electromagnetic Spectrum |
| FHD | Full High Definition |
| FIR | Far-Infrared |
| FLIR | Forward Looking Infrared |
| FOV | Field-of-View |
| FPA | Focal Plane Array |
| HD | High Definition |
| HE | Histogram Equalization |
| IR | Infrared |
| LD | Low Definition |
| LWIR | Long-Wave Infrared |
| Mil.&Sur. | Military & Surveillance |
| MR | Magnetic Resonance |
| MWIR | Mid-Wave Infrared |
| NEP | Noise-Equivalent-Power |
| NIR | Near-Infrared |
| pri | Private Dataset |
| pub | Public Dataset |
| RGB | Red-Green-Blue |
| rr | Dataset that Requires Registration |
| SAR | Synthetic Aperture Radar |
| SD | Standard Definition |
| SNR | Signal-to-Noise Ratio |
| SWIR | Short-Wave Infrared |
| UHD | Ultra High Definition |