Flexible terahertz photonic light-cage modules
for in-core sensing and high temperature applications
Abstract
Terahertz technology is a growing and multi-disciplinary research field, particularly in applications relating to sensing and telecommunications. A number of terahertz waveguides have emerged over the past few years, which are set to complement the capabilities of existing and bulky free space setups. In most terahertz waveguide designs however, the guiding region is physically separated from the surroundings, making any interaction between the guided light and the environment inefficient. Here we present photonic terahertz light cages (THzLCs) operating at terahertz frequencies, consisting of free-standing dielectric strands, which guide light within a central hollow core with immediate access to the environment. We experimentally show the versatility and design flexibility of this concept, by 3D-printing several cm-length-scale modules on the basis of a single design, using four different polymer- and ceramic- materials, which are either rigid, flexible, or resistant to high temperatures. We characterize both propagation- and bend- losses for straight- and curved- waveguides, which are of order 1 dB/cm in the former, and 2-8 dB/cm in the latter for bend radii below 10 cm, and largely independent of the chosen material. Our transmission experiments are complemented by near-field measurements at the waveguide output, which reveal the antiresonant guidance for straight THzLCs, and a deformed fundamental mode in the bent waveguides, in agreement with numerical conformal mapping simulation models. We show that these THzLCs can be used either as: (i) flexible, reconfigurable, and bendable modular assemblies; (ii) in-core sensors of resonant structures contained directly inside the hollow core; (iii) high-temperature waveguide sensors, with potential applications in industrial monitoring and sensing. The 3D-printed light cages presented are a novel and useful addition to the growing library of terahertz waveguides, marrying the waveguide-like advantages of reconfigurable, diffractionless propagation, with the free-space-like immediacy of direct exposure to the surrounding environment.
keywords:
Terahertz photonics, hollow core waveguide, 3D printing, terahertz spectroscopy, antiresonant guidanceInstitute of Photonics and Optical Science]Institute of Photonics and Optical Science (IPOS), School of Physics, The University of Sydney, NSW 2006, Australia Institute of Photonics and Optical Science]Institute of Photonics and Optical Science (IPOS), School of Physics, The University of Sydney, NSW 2006, Australia The University of Sydney Nano Institute]The University of Sydney Nano Institute (Sydney Nano), The University of Sydney, NSW 2006, Australia Biomaterials and Tissue Engineering Research Unit]Biomaterials and Tissue Engineering Research Unit, School of Biomedical Engineering, The University of Sydney, NSW 2006, Australia Biomaterials and Tissue Engineering Research Unit]Biomaterials and Tissue Engineering Research Unit, School of Biomedical Engineering, The University of Sydney, NSW 2006, Australia \alsoaffiliation[Australian Research Council Training Centre for Innovative Bioengineering] Australian Research Council Training Centre for Innovative Bioengineering, Sydney, NSW 2006, Australia Biomaterials and Tissue Engineering Research Unit]Biomaterials and Tissue Engineering Research Unit, School of Biomedical Engineering, The University of Sydney, NSW 2006, Australia \alsoaffiliation[Australian Research Council Training Centre for Innovative Bioengineering] Australian Research Council Training Centre for Innovative Bioengineering, Sydney, NSW 2006, Australia \alsoaffiliation[Australian Research Council Training Centre for Innovative Bioengineering] School of Mechanical, Medical and Process Engineering, Queensland University of Technology, 2 George St Brisbane, QLD 4000 Australia Institute of Photonics and Optical Science]Institute of Photonics and Optical Science (IPOS), School of Physics, The University of Sydney, NSW 2006, Australia \alsoaffiliation[The University of Sydney Nano Institute] The University of Sydney Nano Institute (Sydney Nano), The University of Sydney, NSW 2006, Australia
1 Introduction
Recent years have been marked by a rapid development in sources, detectors, and waveguides operating in the terahertz frequency range (), which has the unique capability of serving a number of far-reaching and diverse applications areas 1, 2. These include sensing and spectroscopy (e.g., of gases 3, molecules 4, or DNA 5, 6); imaging and security 7, 8, 9, pharmaceutical research 10; broadband wireless communication (6G) 11; and industrial applications 12. In spite of its significance, and even as the number of THz sources and detectors continue to expand 13, devices which operate at terahertz frequencies have yet to reach a level of maturity and sophisitication that is comparable with their photonic counterparts 14.
As a result, much effort has been dedicated to developing novel terahertz waveguides, particularly dielectric-based fiber-like devices that can guide and route terahertz radiation at will. These include solid-core step index waveguides 15, sub-wavelength core fibers 16, hollow-core fibers 17, 18, 19, 20, 21, 22, metal tube waveguides 23, porous fibers 24, 25, and Bragg fibers 26, to name a few. More broadly, planar THz waveguides have also recently emerged, including photonic crystal- 27, step index- 28 and topological 29 waveguides, as well as modular circuit elements 30. Each structure has various advantages and disadvantages; we refer the reader to Refs. 31, 32, 28 for recent reviews on terahertz waveguides.
In index-guided waveguides, the environment can be weakly probed via the modes’ evanescent fields; in hollow core waveguides, it is necessary to wait for any analytes – be they gases 33, liquids 34, or scatterers 35 – to diffuse inside the walled-off area where the light is guided. Alternatively, one can use the light guided by the fiber core for remote endoscopy, but only at the waveguide output 36. These shortcomings can be addressed, for example, by introducing occasional hollow channels in the cladding that accelerate diffusion of gases from the environment into the core 37, but such processes require significant post-processing. We note that single metal wires can guide terahertz radiation via radially polarized surface modes and with relatively low loss and in direct contact with the surrounding environment, but the associated coupling efficiency and confinement characteristics are notoriously poor 38. Multi-wire waveguides 39 offer an attractive alternative, but typically rely on additional support to maintain the desired spacing and configuration 39, 40, and are often enclosed entirely 8, 30, 21.
In recent years, an alternative novel hollow core waveguide has emerged: the so-called “photonic light cage” 41, 42. This geometry consists of a single ring of free-standing cylindrical dielectric strands of wavelength-scale diameter, arranged around a hollow core within which the light is guided. The appeal of this kind of geometry lies in its unique capability of providing direct access to the core via the spaces between the strands. This effectively provides diffractionless propagation through free space, albeit at the cost of small propagation losses due to the leaky nature of the guided modes of such structures. This kind of waveguide is particularly attractive for applications which demand long-length light-matter interactions 43, e.g., gas 41 and liquid 44 sensing, immediately containing any analytes within the waveguide core section. So far, such devices have been designed to operate in the visible and near-infrared regime 41, 42, 44, 43 (all fabricated via 3D-nanoprinting), only in straight configurations, with the transmittance and modes measured in the far field. To the best of our knowledge, a detailed study of any light cage’s guidance and sensing characteristics in the THz regime is still missing. Furthermore, no studies so far have addressed the impact that any bends may have on photonic light cages, which is particularly important in the context of reconfigurability 30.
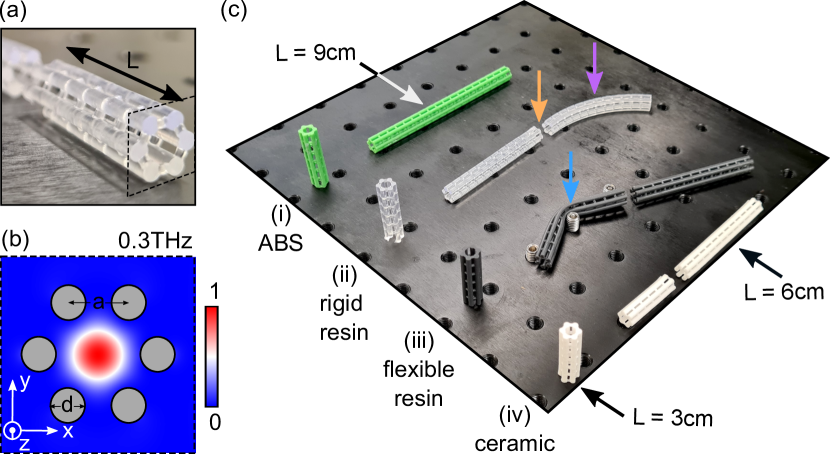
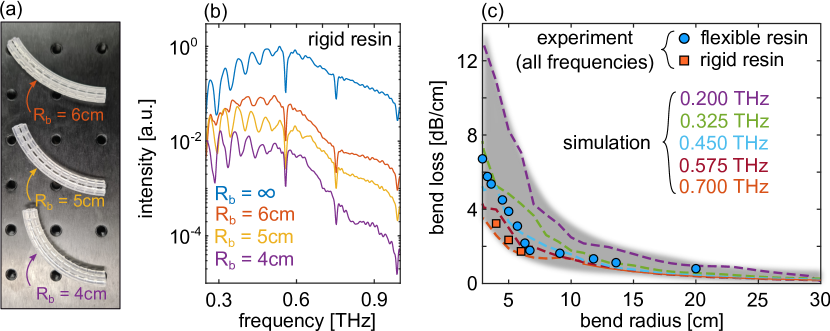
Here, we fabricate and experimentally characterize in detail the propagation losses, guided modes, and bend-loss characteristics of terahertz light cages (THzLCs), and demonstrate their versatility as waveguides and as sensors made out of a variety of materials, including examples capable of sensing at high temperatures. The straight- and bent- light cages are 3D printed up to lengths of 9 cm, and bend radii down to 4 cm, naturally lending themselves as modular elements of arbitrarily arranged assemblies. A picture of an example THzLC of length is shown in Fig. 1(a). As a first proof-of-concept study, our design is a scaled-up version of a previous design 41: it consists of six, hexagonally arranged, high-aspect ratio strands (strand diameter: ; center-to-center pitch: ) connected by a thin bridge, as shown in Fig. 1(a). By omitting the central strand of the hexagonal lattice, a hollow core is formed, which supports an antiresonant guided mode, shown in Fig. 1(b). As noted, the THzLC allows direct access to the hollow core via the open sections between transversally separated strands. The large fractions of modal fields within the hollow section (typical value: ), leading to diffractionless propagation, potentially over hundreds of wavelengths, while being in direct contact with the external environment 41.
To show the versatility of this kind of device, we study the terahertz transmission- and bend- characteristics of several nominally equivalent structures (in terms of cross-sectional geometric parameters), while varying the length, bend radii, and material. Each THzLCs is made from one of four different materials, using three distinct 3D printing procedures. Figure 1(c) shows an overview of the different structures considered and their salient characteristics. Rigid light cages are constructed using three different polymers: (i) acrylonitrile butadiene styrene (ABS) (Filaform ABS, green); (ii) a clear resin (Formlabs Clear V4) (both (i) and (ii) are rigid); (iii) a flexible resin (Formlabs Flexible V2), which can be reversibly deformed; (iv) a rigid and robust ceramic (Baghdadite) 45. 3D-printed Baghdadite has recently attracted applications in the context of bone tissue engineering 46, 47, and most importantly can withstand temperatures of at least 1400 45. Each of these materials would usually be considered to have prohibitively large losses for any THz applications (absorption: 10-100 dB/cm), but each can lend itself to form the cladding of anti-resonant hollow-core waveguides (propagation loss: 1-5 dB/cm), because loss in the latter is dominated by radiation leakage due to antiresonant guidance, as opposed to material loss, as a result of the vanishingly small overlap of antiresonant core modes with the solid strands.
The rest of the paper is structured as follows. We first present the fabrication and terahertz loss measurements of the THzLC and of the materials composing them; we then measure the terahertz near-field of the supported modes in two example rigid light cages, i.e., in a straight- and bent- configurations; next, we provide a detailed measurements and simulations of the bend losses of these light cages for bend radii below 10 cm; finally, we present experiments presenting their versatility, and use them as either flexible components of modular assemblies, in-core sensors, or waveguide sensors operating at high temperatures, before concluding with some final remarks.
2 Fabrication
All light cages are printed from the same design template, produced by using Solidworks (MA, US).The ABS light cages, shown in Fig. 1(c)(ii) were fabricated using a Funmat HT filament printer (Filaform ABS 1.75 mm; print temperature: 220). The resin light cages are fabricated using a Formlabs 3B printer, using a clear rigid resin (Formlabs Clear V4, Fig. 1(c)(ii)) and a flexible resin (Formlabs Flexible V2, Fig. 1(c)(iii)). After printing, each resin light cage is first washed in IPA and cured for 15 minutes at 60. The ceramic light cage (Fig. 1(c)(iv) is fabricated following the procedure described in Ref. 45. Briefly, a photosensitive ceramic resin was formulated by mixing 65wt% of the ceramic (Baghdadite) powder with a 1:1 ratio of a photopolymer (Formlabs clear resin V4, NY, US) and a dispersant (Tween 20, Sigma Aldrich). A basic desktop printer (Formlabs 2, NY, US) was then used to print the geometries. Separately, we use mm-thick samples of the constituent materials to characterize their complex refractive index following the procedure outlined in Ref. 48
3 Transmission experiments
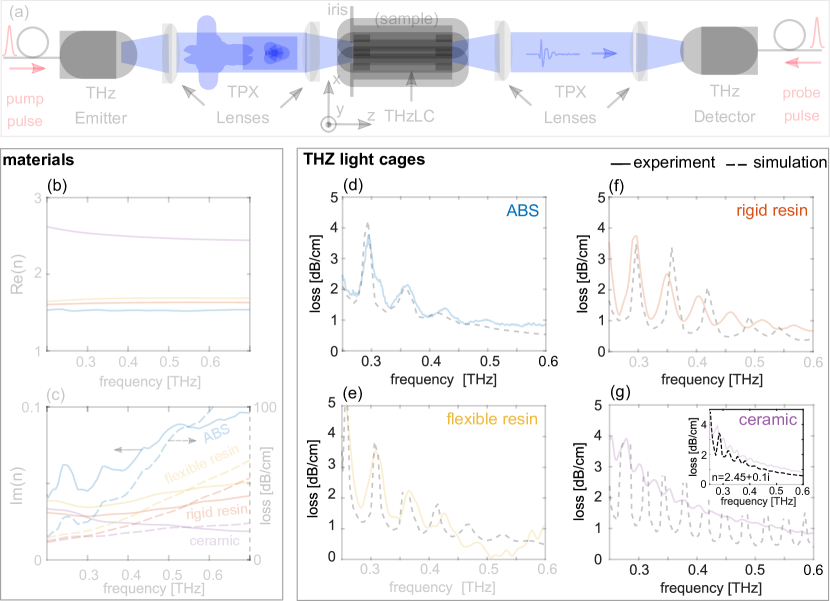
Figure 2(a) shows a schematic of the experimental setup used to measure the waveguide propagation loss and refractive index of each material. We use a commercially available THz-TDS System (Menlo TERAK15), which relies on THz emission from biased photoconductive antennas that are pumped by fiber-coupled near-infrared pulses (pulse width: 90 fs; wavelength: 1560 nm). Polymethylpentene (TPX) lenses (Thorlabs TPX50) collimate and focus the beam towards the sample core, previously aligned using an iris. The THz field emerging from the THzLC is sampled as a function of the time delay of a fiber-coupled probe pulse on another photoconductive antenna, which forms the THz detector. Here we consider the the electric field polarized in , using the sample orientation and reference frame shown in Fig. 1(b); all waveguide bends are in the plane. These choices are guided by preliminary calculations and prior experiments 20, 22 indicating that such configurations have the lowest loss; a complete study of how the overall performance is affected by alternate choices of the polarization- and bend- directions is beyond the scope of this first proof-of-concept study.
Figures 2(b) and 2(c) respectively show the measured refractive index and loss of each material used, obtained by measuring their respective transmitted THz pulses, and using the method outlined in Ref. 48. Subsequently, the THzLC attenuation was experimentally obtained by measuring the transmission through three straight waveguides (3–9 cm lengths) with the same cross-sectional profiles, and fitting it for each frequency with an exponential function. The solid lines in Fig. 2(d)–(g) show the measured loss of the THzLCs composed of different materials as labelled, as a function of frequency, showing regions of alternating low and high absorption corresponding to the strands’ high (low) reflectivity at antiresonance (resonance) 41. The behaviour and underlying physics is analogous to guidance using a single dielectric tube with wavelength-scale thickness 20; here the resonant reflections, rather than being caused Fabry-Perot resonances of a thin dielectric tube, are due to the coupled resonances of the surrounding cylindrical strands 41 – with the important additional feature that here the core region and the surrounding environment are directly connected. A comparison with calculated loss of the fundamental is plotted as a dashed line, showing good agreement. Our calculations use the Mode Analysis Package of the Finite Element Software COMSOL 5.3 49, which computes the propagation constants and mode profiles at each frequency, using perfectly matched layers (cylindrical coordinates) at the external-most boundary. All calculations use the experimentally measured complex refractive index shown in Fig. 2(b),(c) for each respective THzLC strand, with and as per Fig. 1(b). As a first experimental study of THz light cages, and to simplify the discussion of the underlying physics, our calculations consider only the fundamental mode. Note in particular that Fig. 2(g) shows minor discrepancies between measured an calculated loss values, and an absence of any antiresonant oscillating features. We believe that this is a result of the fact that the ceramic 3D printing procedure introduces additional material losses: the inset of Fig. 2(g) shows the same calculations assuming an imaginary part of the ceramic refractive index of 0.1, which shows better agreement with the simulations. This additional loss does not significantly hinder THzLC performance over the length scales considered here, adding only 1 dB/cm of loss; reducing additional losses introduced by the printing process for ceramic materials will be the subject of future work.
Waveguide losses are low compared to material losses, but material losses arguably present some benefits for light cages: the resonances of the strands have low quality factor, with relatively sharp resonant/antiresonant transmission features present with lower loss materials (Fig.2(e,f)) washed out with higher loss materials, resulting in smoother transmission characteristics (Fig. 2(g)).
4 Near field experiments
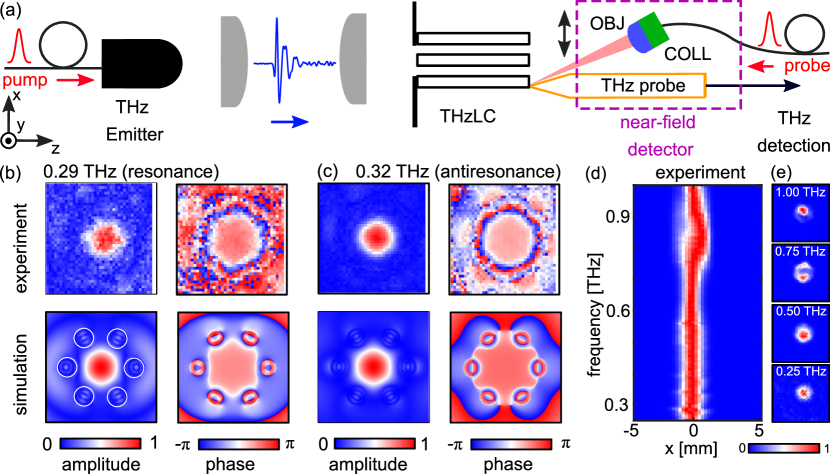
We next measure the near-field emerging from the waveguides. Figure 3(a) shows a schematic of the near-field measurement system: it is the same as that of Fig. 2(a), with the notable difference that the fiber carrying the probe pulse, which was previously directed to a detector in the far field, is now focused to a near-field THz probe (Protemics TeraSpike TD-1550-X-HR), using a fiber collimator and objective. The entire unit (dashed line in Fig. 3(a)) forms a monolithic, moveable near-field detector module which raster scans the waveguide output in and . The scans were performed on a area with lateral steps of 0.25 mm, at a distance of about from the end-face of the THzLC. Both emitter and detector are oriented to generate and detect linearly polarized fields in , respectively. The electric near-field at output was thus directly measured as a function of time, at every and coordinate. One important feature of THz-TDS is that it directly maps the physical electric field, including both amplitude and phase information, so that the measured amplitude of the electric field at every frequency can then be immediately obtained from a Fourier transform 1.
4.1 Straight waveguides
To reveal the guidance properties of the THzLC directly, we first consider a straight THzLC composed of rigid resin (length: 6 cm), corresponding to Fig. 1(c)(ii). The top row Figure 3(b) shows the near field amplitude (left) and phase (right) measured at a representative frequency of 0.29 THz, which corresponds to the region of (local) high waveguide loss – see also Fig. 2(f). The near field measurements reveal that, although most of the power is in the hollow core, some power can be found in the surrounding regions, due to resonant coupling to higher-order strand modes 41. In contrast, in Figure 3(c), which shows the same measurements at 0.32 THz, most of the power is in the central core region, as a result of antiresonance guidance effects. Nevertheless, the measured phase in this window, shown in the top right of Fig. 3(c), distinctly reveals the existence of six light cage strands - showcasing the antiresonant guidance mechanism. These phase measurements in low-intensity regions are uniquely enabled by the high signal-to-noise ratio at these frequencies (40 dB). A comparison with the simulation of the intensity- and phase- of the fundamental mode profile, shown in the bottom row Fig. 3(b) and 3(c), shows good agreement of the salient experimental features.
Figure 3(d) shows the average intensity distribution in the central core region as a function of and frequency, confirming that the majority of the power is contained in the hollow core region in the entire sub-THz band. Although the waveguide is multi-moded, our measurements show coupling into a single mode, with diffractionless guidance of the fundamental mode up to about 0.5 THz. Figure 3(e), shows the modal intensity images at 0.25 THz frequency spacing: the power distribution at 0.75 THz and 1.00 THz reveal that multiple modes are excited, but at 500 GHz and below the fundamental mode dominates.
4.2 Bent waveguides
We now investigate the properties of bent light cages under typical experimental conditions, with an eye on developing convenient and reconfigurable THzLC circuits to guide THz fields at will – for example, either by assembling rigid elements 30, or reconfigurably bending flexible elements 22. We begin by considering a rigid resin light cage, of length and bend radius , shown by the purple arrow in Fig. 1(c). Analogously to previous approaches 19, 20, 22, the bend radius is the ratio between the waveguide length and the angle (in radians) swept by the external profile of each waveguide. Due to the cm-scale waveguide diameter and bend radii, such resulting bend radii are approximate, and can be considered as upper limit estimates.
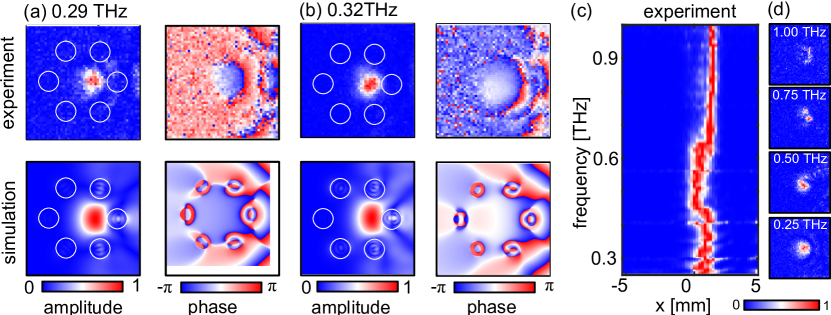
The top row of Figure 4(a) and 4(b) show the near field amplitude (left) and phase (right), at frequencies of 0.29 THz and 0.32 THz respectively for ease of comparison with Fig. 3. One may clearly observe a strong deformation of the measured field, in the direction of the waveguide bend, as is typical for any strongly bent waveguides 50. Similar measurements have been performed in the far field for several terahertz waveguides 51, 52, 20, 22, and in the near field for planar waveguides in the longitudinal plane 50, 53; to our knowledge however, this is the first transverse near-field measurement of a the complex field cross-section emerging from a waveguide with extreme bends.
To interpret these results, we compare our experiments with numerical models. We adapt out finite element mode solver to model an equivalent refractive index profile for the bent THzLCs, given by 54
| (1) |
where is the (horizontal) bending direction, and is the cross-sectional refractive index distribution of the straight waveguide considered. The resulting amplitude- and phase- profiles at these frequencies is shown in the bottom row of Fig. 4(a) and 4(b). The simulations and experiments both show that these bends induce a radiative leakage of the field outside the waveguide, which here is the dominant loss mechanism.
To investigate this further, we first consider three curved rigid resin light cages, shown in Fig. 5(a), of decrasing bend radius (here: (orange), 5 cm (yellow) and 4 cm (purple)), and repeat the transmission experiments for each one. Note that, in the context of cm-scale terahertz waveguides, the bends presented here as typical are in fact quite strong: bending a 1 cm diameter waveguide to a 4 cm bend, for example, is analogous to bending a standard 125 m diameter fiber to a 0.5 mm bend radius. The fiber-coupled THz system allows us to align the hollow core at input- and output- at the same nominal location relative to the emitter and detector, respectively. The resulting raw transmission spectra in each case are shown in Fig. 5(b), including the spectrum for the straight waveguide. We note that, as an overall trend, the transmitted power drops by 10-30 dB as the bend radius decreases, with higher frequencies having larger bend losses. The oscillations at lower frequencies, associated with regions of low- and high- leakage loss as per Fig. 2(f), do not have the local minima and maxima at the same frequency. A similar effect was previously observed for enclosed polymer tubes 20, and can be explained by inspecting the refractive index profile of the conformal map (Eq. (1)): upon bending, effective refractive index changes in the strands shift the resonances/antiresonances. Furthermore, significant changes in the strand diameter could be occurring along the device length, due to the relatively small bend radii (relative to the wavelength.)
As a result, it is challenging to unambiguously quantify the bend loss at each specific frequency. Instead, we experimentally quantify the overall power transmitted by the terahertz pulse, and compute the degree to which bending the waveguide introduces additional losses to the overall transmission per unit length by defining the bend loss per unit length as
| (2) |
where and respectively represent the total transmitted intensity integrated across frequencies for a straight- and bent- waveguide of length in cm. The orange squares in Fig. 5(c) plots , taking the total (integrated) intensity between 0.2-1 THz. We find that the total bend losses are in the range of 2–4 dB/cm, which is comparable to previous results in rigid and flexible enclosed tubes 20, 19, 22, despite there being no continuous boundary between the mode and the outside air in this geometry.
To verify the validity of our experiments, we perform finite element modal simulations in COMSOL using the refractive index mapping of Eq. 1, for a few representative frequencies, and for a wide range of bend radii (). For each frequency, the complex effective index of the calculated fundamental mode at each value of yields the simulated bend loss per unit length via
| (3) |
where is the free space wave vector in units of , , and is the effective index calculated for a bend radius . The resulting calculated bend losses of the fundamental mode of the THzLC at frequencies between 0.2–0.7 THz are shown as dashed lines Fig. 5(c). The grey shaded region encompasses the range of calculated losses between 0.2-0.7 THz – where most of the power is contained. The simulations overlap well with our experiments, and confirm that our experimental results for the bend loss are within the expected range. Note however that the calculated bend loss of the fundamental mode at higher frequencies (e.g., 0.7 THz) is smaller than that at lower frequencies (e.g., at 0.2 THz), a trend that is opposite to that of our experiments. This is most likely because, in practice, higher modes are excited at high frequencies (and bending itself can lead to mode coupling), increasing the overall bend loss, and making direct comparisons with single-mode simulations challenging.
The flexible, reconfigurable resin waveguides, shown in Fig. 1(c)(iii), allow us to repeat these experiments using a wider range of while using the same sample. Custom-built THzLC sample holders, combined with the fiber-coupled THz system, ensure that the input- and output- conditions are left unchanged when these flexible THzLCs are bent 22. The blue circles in Figure 5(c) show the experimental results: the bend losses appear to be overall slightly higher, while still within the range suggested by our numerical simulations.
5 Applications
Having characterized both straight- and bent- THzLC modules individually, we now turn our attention to potential applications, presenting three key separate but complementary experiments to illustrate the opportunities enabled by these devices: (1) modular, flexible, reconfigurable waveguide assemblies, which thus allow to re-route diffractionless free-space beams without additional free-space optics; (2) in-core- terahertz sensing, which is unique to the light cage geometry; and (3) high-temperature terahertz guidance and sensing, enabled by the use of ceramics as the device material.
5.1 (1) Modular flexible assemblies
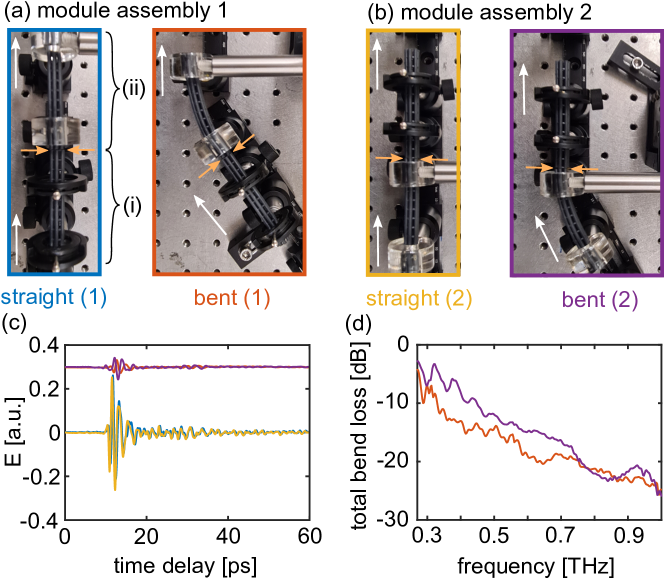
We begin by considering flexible resin THzLC modular assemblies composed of two 6 cm-elements placed in series, where either the first- or second- of the two elements is arbitrarily bent. Two module assemblies, composed of THzLC (i) and (ii), are shown in Fig. 6(a) (blue) and 6(b) (yellow). Their respective transmitted terahertz electric field pulse measurement is shown as blue- and yellow- lines in Fig. 6(c), showing that they are comparable, confirming that the coupling conditions are similar in each configuration. Subsequently, each module assembly is mechanically bent by nominally the same amount, while maintaining the input- and output- alignment; the resulting experimental configurations are shown in Fig. 6(a) (orange) and 6(b) (purple), and their respective transmitted THz pulses are shown as the orange- and purple- curves in Fig. 6(c). Note the drop in amplitude, which we quantify at each frequency and for both bent configurations. Figure 6(d) shows the total intensity lost in each bent configuration with respect to each straight configuration. As one would expect from our data of Fig. 5(c), the total drop in intensity is between 5–25 dB over the entire assembly length, which is predominantly due to the 6 cm bent region. We find that higher frequencies experience more loss, most likely due to the excitation of higher oreder modes in each waveguides in that region. Note that a number of factors can influence the overall loss, including a mode mismatch between straight- and bent- WGs (see Fig. 3 and Fig. 4), and the waveguide profile resulting from the specific mechanical bend, which can influence small local changes in the local bend radius and thus the overall transmission, especially when as is the case here.
Our experiments show that transmission losses depend on the bends and exact assembly of modules - but remain at a level that could readily be normalized out for many applications. However, in spectrally sensitive applications it will be important to carry out the normalization in situ, in the final THzLC configuration.
5.2 (2) In-core sensing
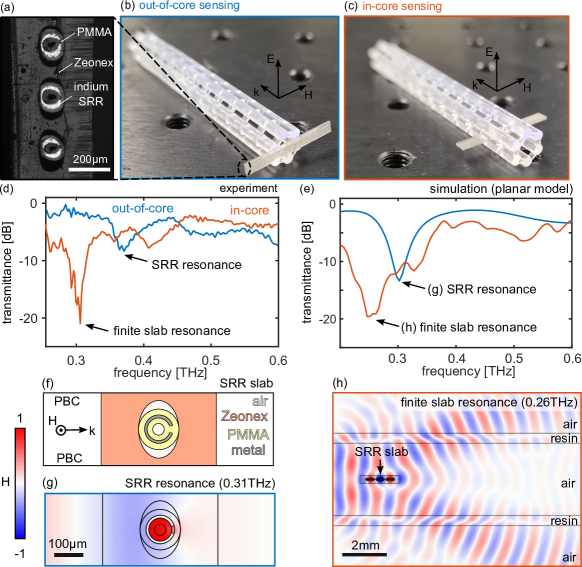
We now show that this structure allows to detect resonant features both outside and inside the core of the waveguide, harnessing the unique characteristics of the THzLC. Most THz sensing applications rely on the observation and monitoring of characteristic molecular resonances 4; to perform a controlled experiment, here we use a slab containing resonant “meta-molecules”, composed of slotted ring resonators (SRRs). Fig. 7(a) shows a detailed microscope image of the cross section of the SRRs array used. As previously reported 55, it is formed by an array of six sub-wavelength slotted indium cylinders inside a PMMA jacket, which form an array inside a Zeonex slab (slab area: ; slab length: 30 mm). A previous experiment 55 placed a single slab of this sample in the focus of a THz 1 mm beam, such that most of the beam overlapped with the sample. It was found that this structure possess a magnetic resonance at 0.35 THz when the magnetic field is aligned parallel to the cylinder axis. In the present context, an analogous experiment can be repeated by placing the slab at the output of a THzLC as illustrated in the photograph in Figure 7(b) (here termed “out-of-core sensing”.) This kind of experiment can, in fact, be readily performed by placing the sample at the output of any cm-scale THz waveguide: for example, an extension of this technique in the context of bendable terahertz fibers was used to perform terahertz endoscopy 36. The THzLC, however, provides an additional avenue, as illustrated in Fig. 7(c): the ability to place the sample directly in the core of the waveguide (here termed “in-core sensing”). In this specific case, the sample is self-aligned with the center of the waveguide; more broadly, this technique guarantees that any changes in the transmission must originate from the core. Due to absence of continuous confining boundary, and the core’s multi-modedness and low numerical aperture, scattering sources produce radiation leakage directly into the surroundings, dropping the overall waveguide transmission, providing strong resonant signatures that can uniquely be attributed to elements in the core.
To illustrate this point, we perform transmittance experiments using the out-of-core and in-core configurations. The antenna and detector are rotated so that the magnetic field is parallel to the slotted cylinders when the sample is arranged as in Fig. 7(b) and 7(c), as required 55. The blue and orange lines in Fig. 7(d) show the transmittance in each respective case. For the out-of-core case, we observe a resonant dip at 0.35 THz, corresponding to the previously reported magnetic resonance of the SRR 55. For the in-core case, we measure a dominant resonant dip at lower frequency of 0.3 THz, accompanied by two other less prominent resonances at 0.35 THz and 0.4 THz. In order to understand this result, we simulate this system using a 2D propagation model, which captures the fundamental physics with relatively fast computation times. A schematic resonator used in the model is shown in Fig. 7(f), which is an idealized version of the central resonator shown in Fig. 7(a).
Analogously to earlier treatments 55, the out-of-core transmission is modelled using plane wave port input with periodic boundary conditions. An example simulation of the magnetic field at resonance is shown in Fig. 7(g). The resulting transmittance as a function of frequency is shown as a blue line in Fig. 7(e), showing the characteristic resonant feature observed in the out-of-core experiment.
To capture the physics of the in-core sensing capabilities, our numerical analysis model replicates the experimental condition of Fig. 7(c) by considering a 1D slab containing six SRRs inside an antiresonant waveguide, as shown in Figure 7(h). We consider an array of six resonators inside a one-dimensional waveguide, formed an 5 mm air core surrounded by two 0.5 mm slabs (), forming a simple 1D antiresonant slab waveguide. The transmittance as a function of frequency is shown as an orange line in Fig. 7(e). Despite the simplicity of this in-core-sensing model, we observe the same salient features as our experiment: (i) a strong resonance at a lower frequency than the out-of-core case – which, via the associated field plots in Fig. 7(h), we can attribute to a Fabry Perot type resonance of the finite slab; and (ii) additional weaker resonance emerging at slightly higher frequencies, which are due to the SRR- and higher-order- slab resonances, respectively. Note that this kind of experiment, were it performed at the focus of a free-space beam using two lenses, would be challenging to perform and difficult to interpret. For example, at a frequency of 0.3 THz (, the fitted Gaussian beam waist radius of the intensity profile equivalent to one emerging from the THzLC is (Fig. 3(d)), corresponding to a Rayleigh length of only , barely matching the sample size. As a result, performing this experiment in free space would require precise alignment and identification of the exact location of the focus in three dimensions; furthermore, the lenses collecting the scattered light could themselves capture some of the scattered power at the focus depending on alignment, and features observed would be highly dependent on alignment and be open to interpretation. Here, by collecting the light at the output of a 60 mm waveguide supporting diffractionless propagation, the scattering source can be anywhere inside the waveguide, which in this case is also self-aligned with the central part of the cage core. Thus, the physical location of the resonant scattering and light collection are separated, offering both convenience and ease of interpretation of any spectral features.

5.3 (3) High temperature guidance and sensing
We now demonstrate the potential of using the ceramic light cages as sensors operating at higher temperatures than those allowed by conventional 3D printing polymer-based materials, which typically deform or melt at temperatures close to 150–200 ∘C. Operating waveguides at extremely high temperatures has applications in optical sensing within harsh environments 56, which in the context of terahertz radiation allows, for example, remote monitoring of gases (e.g., H2O, CO) inside gasifiers 57 and furnaces 58, with implications for industrial process control. Our modified experimental setup for measuring the temperature-dependent terahertz spectrum is shown in Fig. 8(a). The far-field THz-TDS light-cage transmission setup of Fig. 2(a) is modified to include a thermocouple in contact with a ceramic light cage (), and connected to an oscilloscope via an amplifier. This setup thus enables us to measure the temperature of the THzLC while the terahertz pulse is passing through it (refresh rate: 1 Hz). As a readily available heat source, we use the butane flame from a common household lighter, held directly underneath the light cage for 30 s. Figure 8(b) shows the time-dependent temperature profile as the heat source is turned on: the starting temperature is 25 ∘C, and reaches a maximum of 450 ∘C. The associated terahertz pulse and spectrum at the lowest- and highest- temperatures measured are shown in Fig. 8(c) and 8(d) respectively: they are similar, and confirm that the ceramic light cage’s guidance is not significantly affected at such high temperatures. In addition, we detect a small phase shift of the terahertz pulse at high temperatures: Figs. 8(e) and 8(f) respectively show the terahertz pulse, time-averaged over the shaded regions in Fig. 8(b), over smaller time windows. The shaded regions in Fig. 8(f) encompass the standard deviation. We observe a 6 fs in the time shift, in agreement with expectations 3, and which we attribute to a reduction of the air’s refractive index in the cage core, which causes the pulse to reach the detector sooner. Note that the maximum temperature reached is well above the melting temperature of plastics and resins, but significantly below the 1400 ∘C which the ceramic light cages can potentially withstand, due to inherent difficulties associated with installing and safely using high-temperature sources within our university’s terahertz laboratory. Nevertheless, we believe the present experiments are a valuable proof-of-concept starting point for showing the viability of using ceramics as the cladding material for modular antiresonant terahertz waveguides and sensors in harsh environments 56 – which might include simple tubes, but which in the specific case of the THzLC also allows direct access to the guiding core as discussed.
6 Conclusions
Light cages can confine and guide terahertz radiation, while offering direct lateral access to the guided mode. With propagation losses in light cages largely independent of the materials used, we demonstrated that additive manufacturing is a versatile fabrication tool that is well suited for the required geometries, including for modular, flexible and high-temperature resistant waveguides.
Our near-field measurements revealed the characteristic leaky resonant- and antiresonant- modes involved in light guidance; most remarkably, the measurements in a bent configuration showed excellent agreement with that predicted by solving for the fundamental mode using a conformal map 54 – an aspect which has, to the best of our knowledge, eluded measurement until now.
Our experiments reveal that propagation- and bend- losses are comparable to that of other antiresonant dielectric waveguides – but with the added benefit of having immediate exposure to the surrounding environment and direct access to the waveguide core, resulting in effectively diffractionless propagation in free space. Exploiting the direct access to the guided mode, we demonstrated alignment-free sensing of small samples, but the long diffractionless propagation could in principle also be used for increased sensitivity gas sensing, including at high temperatures.
Much can still be done to reduce losses further, both by lowering the loss of the cladding materials 59 or by tailoring the coupled strand resonances 60. We believe this will enable these structures to serve as flexible waveguides for constructing modular terahertz sensors and circuits.
A.T. and M.M. are supported by an Australian Research Council Discovery Early Career Researcher Award (DE200101041, DE210100975). The authors acknowledge the facilities as well as the scientific and technical assistance of the Research and Prototype Foundry Core Research Facility at the University of Sydney, part of the NSW node of the NCRIS-enabled Australian National Fabrication Facility, where part of this work was performed.
Animation of the measured and simulated electric fields in Fig. 3(b) and 3(c) (straight waveguides).
Animation of the measured and simulated electric fields in Fig. 4(a) and 3(b) (bent waveguides).
References
- Jepsen et al. 2011 Jepsen, P. U.; Cooke, D. G.; Koch, M. Terahertz spectroscopy and imaging–Modern techniques and applications. Laser & Photonics Reviews 2011, 5, 124–166
- Dhillon et al. 2017 Dhillon, S.; Vitiello, M.; Linfield, E.; Davies, A.; Hoffmann, M. C.; Booske, J.; Paoloni, C.; Gensch, M.; Weightman, P.; Williams, G., et al. The 2017 terahertz science and technology roadmap. Journal of Physics D: Applied Physics 2017, 50, 043001
- Mittleman et al. 1998 Mittleman, D. M.; Jacobsen, R. H.; Neelamani, R.; Baraniuk, R. G.; Nuss, M. C. Gas sensing using terahertz time-domain spectroscopy. Applied Physics B 1998, 67, 379–390
- Seo and Park 2020 Seo, M.; Park, H.-R. Terahertz biochemical molecule-specific sensors. Advanced Optical Materials 2020, 8, 1900662
- Fischer et al. 2002 Fischer, B.; Walther, M.; Jepsen, P. U. Far-infrared vibrational modes of DNA components studied by terahertz time-domain spectroscopy. Physics in Medicine & Biology 2002, 47, 3807
- Ahmadivand et al. 2020 Ahmadivand, A.; Gerislioglu, B.; Ahuja, R.; Mishra, Y. K. Terahertz plasmonics: The rise of toroidal metadevices towards immunobiosensings. Materials Today 2020, 32, 108–130
- Liu et al. 2007 Liu, H.-B.; Zhong, H.; Karpowicz, N.; Chen, Y.; Zhang, X.-C. Terahertz spectroscopy and imaging for defense and security applications. Proceedings of the IEEE 2007, 95, 1514–1527
- Tuniz et al. 2013 Tuniz, A.; Kaltenecker, K. J.; Fischer, B. M.; Walther, M.; Fleming, S. C.; Argyros, A.; Kuhlmey, B. T. Metamaterial fibres for subdiffraction imaging and focusing at terahertz frequencies over optically long distances. Nature Communications 2013, 4, 2706
- Atakaramians et al. 2017 Atakaramians, S.; Stefani, A.; Li, H.; Habib, M. S.; Hayashi, J. G.; Tuniz, A.; Tang, X.; Anthony, J.; Lwin, R.; Argyros, A.; Fleming, S. C.; Kuhlmey, B. T. Fiber-Drawn Metamaterial for THz Waveguiding and Imaging. Journal of Infrared, Millimeter, and Terahertz Waves 2017, 38, 1162–1178
- Taday 2004 Taday, P. F. Applications of terahertz spectroscopy to pharmaceutical sciences. Philosophical Transactions of the Royal Society of London. Series A: Mathematical, Physical and Engineering Sciences 2004, 362, 351–364
- Saad et al. 2019 Saad, W.; Bennis, M.; Chen, M. A vision of 6G wireless systems: Applications, trends, technologies, and open research problems. IEEE Network 2019, 34, 134–142
- Tao et al. 2020 Tao, Y. H.; Fitzgerald, A. J.; Wallace, V. P. Non-contact, non-destructive testing in various industrial sectors with terahertz technology. Sensors 2020, 20, 712
- Lewis 2014 Lewis, R. A. A review of terahertz sources. Journal of Physics D: Applied Physics 2014, 47, 374001
- Shastri et al. 2021 Shastri, B. J.; Tait, A. N.; Ferreira de Lima, T.; Pernice, W. H.; Bhaskaran, H.; Wright, C. D.; Prucnal, P. R. Photonics for artificial intelligence and neuromorphic computing. Nature Photonics 2021, 15, 102–114
- Nielsen et al. 2009 Nielsen, K.; Rasmussen, H. K.; Adam, A. J.; Planken, P. C.; Bang, O.; Jepsen, P. U. Bendable, low-loss Topas fibers for the terahertz frequency range. Optics Express 2009, 17, 8592–8601
- Roze et al. 2011 Roze, M.; Ung, B.; Mazhorova, A.; Walther, M.; Skorobogatiy, M. Suspended core subwavelength fibers: towards practical designs for low-loss terahertz guidance. Optics Express 2011, 19, 9127–9138
- Lu et al. 2008 Lu, J.-Y.; Yu, C.-P.; Chang, H.-C.; Chen, H.-W.; Li, Y.-T.; Pan, C.-L.; Sun, C.-K. Terahertz air-core microstructure fiber. Applied Physics Letters 2008, 92, 064105
- Chen and Chen 2010 Chen, D.; Chen, H. A novel low-loss Terahertz waveguide: Polymer tube. Optics Express 2010, 18, 3762–3767
- Setti et al. 2013 Setti, V.; Vincetti, L.; Argyros, A. Flexible tube lattice fibers for terahertz applications. Optics Express 2013, 21, 3388–3399
- Bao et al. 2015 Bao, H.; Nielsen, K.; Bang, O.; Jepsen, P. U. Dielectric tube waveguides with absorptive cladding for broadband, low-dispersion and low loss THz guiding. Scientific Reports 2015, 5, 7620
- Li et al. 2016 Li, H.; Atakaramians, S.; Lwin, R.; Tang, X.; Yu, Z.; Argyros, A.; Kuhlmey, B. T. Flexible single-mode hollow-core terahertz fiber with metamaterial cladding. Optica 2016, 3, 941–947
- Stefani et al. 2021 Stefani, A.; Skelton, J. H.; Tuniz, A. Bend losses in flexible polyurethane antiresonant terahertz waveguides. Opt. Express 2021, 29, 28692–28703
- Lu et al. 2010 Lu, J.-T.; Hsueh, Y.-C.; Huang, Y.-R.; Hwang, Y.-J.; Sun, C.-K. Bending loss of terahertz pipe waveguides. Optics Express 2010, 18, 26332–26338
- Dupuis et al. 2009 Dupuis, A.; Allard, J.-F.; Morris, D.; Stoeffler, K.; Dubois, C.; Skorobogatiy, M. Fabrication and THz loss measurements of porous subwavelength fibers using a directional coupler method. Optics Express 2009, 17, 8012–8028
- Atakaramians et al. 2009 Atakaramians, S.; Afshar, S.; Ebendorff-Heidepriem, H.; Nagel, M.; Fischer, B. M.; Abbott, D.; Monro, T. M. THz porous fibers: design, fabrication and experimental characterization. Optics Express 2009, 17, 14053–14062
- Skorobogatiy and Dupuis 2007 Skorobogatiy, M.; Dupuis, A. Ferroelectric all-polymer hollow Bragg fibers for terahertz guidance. Applied Physics Letters 2007, 90, 113514
- Tsuruda et al. 2015 Tsuruda, K.; Fujita, M.; Nagatsuma, T. Extremely low-loss terahertz waveguide based on silicon photonic-crystal slab. Optics Express 2015, 23, 31977–31990
- Nallappan et al. 2021 Nallappan, K.; Guerboukha, H.; Cao, Y.; Xu, G.; Nerguizian, C.; Mittleman, D. M.; Skorobogatiy, M. Next Generation Wireless Terahertz Communication Networks; CRC Press, 2021; pp 379–410
- Yang et al. 2020 Yang, Y.; Yamagami, Y.; Yu, X.; Pitchappa, P.; Webber, J.; Zhang, B.; Fujita, M.; Nagatsuma, T.; Singh, R. Terahertz topological photonics for on-chip communication. Nature Photonics 2020, 14, 446–451
- Cao et al. 2020 Cao, Y.; Nallappan, K.; Guerboukha, H.; Xu, G.; Skorobogatiy, M. Additive manufacturing of highly reconfigurable plasmonic circuits for terahertz communications. Optica 2020, 7, 1112–1125
- Humbert 2019 Humbert, G. Handbook of Optical Fibers; Springer Singapore, 2019; Chapter 26
- Islam et al. 2020 Islam, M. S.; Cordeiro, C. M.; Franco, M. A.; Sultana, J.; Cruz, A. L.; Abbott, D. Terahertz optical fibers. Optics Express 2020, 28, 16089–16117
- Ritari et al. 2004 Ritari, T.; Tuominen, J.; Ludvigsen, H.; Petersen, J.; Sørensen, T.; Hansen, T. P.; Simonsen, H. R. Gas sensing using air-guiding photonic bandgap fibers. Optics Express 2004, 12, 4080–4087
- Wu et al. 2009 Wu, D. K.; Kuhlmey, B. T.; Eggleton, B. J. Ultrasensitive photonic crystal fiber refractive index sensor. Optics Letters 2009, 34, 322–324
- Faez et al. 2015 Faez, S.; Lahini, Y.; Weidlich, S.; Garmann, R. F.; Wondraczek, K.; Zeisberger, M.; Schmidt, M. A.; Orrit, M.; Manoharan, V. N. Fast, label-free tracking of single viruses and weakly scattering nanoparticles in a nanofluidic optical fiber. ACS Nano 2015, 9, 12349–12357
- Lu and Argyros 2014 Lu, W.; Argyros, A. Terahertz spectroscopy and imaging with flexible tube-lattice fiber probe. Journal of Lightwave Technology 2014, 32, 4621–4627
- Hoo et al. 2010 Hoo, Y.; Liu, S.; Ho, H. L.; Jin, W. Fast response microstructured optical fiber methane sensor with multiple side-openings. IEEE Photonics Technology Letters 2010, 22, 296–298
- Wang and Mittleman 2004 Wang, K.; Mittleman, D. M. Metal wires for terahertz wave guiding. Nature 2004, 432, 376–379
- Mbonye et al. 2009 Mbonye, M.; Mendis, R.; Mittleman, D. M. A terahertz two-wire waveguide with low bending loss. Applied Physics Letters 2009, 95, 233506
- Dong et al. 2022 Dong, J.; Tomasino, A.; Balistreri, G.; You, P.; Vorobiov, A.; Charette, É.; Le Drogoff, B.; Chaker, M.; Yurtsever, A.; Stivala, S., et al. Versatile metal-wire waveguides for broadband terahertz signal processing and multiplexing. Nature Communications 2022, 13, 1–8
- Jain et al. 2018 Jain, C.; Braun, A.; Gargiulo, J.; Jang, B.; Li, G.; Lehmann, H.; Maier, S. A.; Schmidt, M. A. Hollow core light cage: trapping light behind bars. ACS Photonics 2018, 6, 649–658
- Jang et al. 2019 Jang, B.; Gargiulo, J.; Ando, R. F.; Lauri, A.; Maier, S. A.; Schmidt, M. A. Light guidance in photonic band gap guiding dual-ring light cages implemented by direct laser writing. Optics Letters 2019, 44, 4016–4019
- Davidson-Marquis et al. 2021 Davidson-Marquis, F.; Gargiulo, J.; Gómez-López, E.; Jang, B.; Kroh, T.; Müller, C.; Ziegler, M.; Maier, S. A.; Kübler, H.; Schmidt, M. A., et al. Coherent interaction of atoms with a beam of light confined in a light cage. Light: Science & Applications 2021, 10, 1–10
- Kim et al. 2020 Kim, J.; Jang, B.; Gargiulo, J.; Bürger, J.; Zhao, J.; Upendar, S.; Weiss, T.; Maier, S. A.; Schmidt, M. A. The optofluidic light cage–on-chip integrated spectroscopy using an antiresonance hollow core waveguide. Analytical Chemistry 2020, 93, 752–760
- Mirkhalaf et al. 2021 Mirkhalaf, M.; Dao, A.; Schindeler, A.; Little, D. G.; Dunstan, C. R.; Zreiqat, H. Personalized Baghdadite scaffolds: stereolithography, mechanics and in vivo testing. Acta Biomaterialia 2021, 132, 217–226
- Lu et al. 2020 Lu, Z.; Zhang, W.; No, Y. J.; Lu, Y.; Mirkhalaf Valashani, S. M.; Rollet, P.; Jiang, L.; Ramaswamy, Y.; Dunstan, C. R.; Jiang, X., et al. Baghdadite Ceramics Prevent Senescence in Human Osteoblasts and Promote Bone Regeneration in Aged Rats. ACS Biomaterials Science & Engineering 2020, 6, 6874–6885
- No et al. 2021 No, Y. J.; Nguyen, T.; Lu, Z.; Mirkhalaf, M.; Fei, F.; Foley, M.; Zreiqat, H. Development of a bioactive and radiopaque bismuth doped baghdadite ceramic for bone tissue engineering. Bone 2021, 153, 116147
- Jepsen 2019 Jepsen, P. U. Phase Retrieval in terahertz time-domain measurements: a “how to” Tutorial. Journal of Infrared, Millimeter, and Terahertz Waves 2019, 40, 395–411
- com 2017 Wave Optics Module User’s Guide, COMSOL Multiphysics v. 5.3. COMSOL AB, Stockholm, Sweden 2017,
- Yuan et al. 2005 Yuan, G.; Lear, K. L.; Stephens, M. D.; Dandy, D. S. Characterization of a 90 waveguide bend using near-field scanning optical microscopy. Applied Physics Letters 2005, 87, 191107
- Doradla et al. 2012 Doradla, P.; Joseph, C. S.; Kumar, J.; Giles, R. H. Characterization of bending loss in hollow flexible terahertz waveguides. Optics Express 2012, 20, 19176–19184
- Navarro-Cía et al. 2013 Navarro-Cía, M.; Vitiello, M. S.; Bledt, C. M.; Melzer, J. E.; Harrington, J. A.; Mitrofanov, O. Terahertz wave transmission in flexible polystyrene-lined hollow metallic waveguides for the 2.5-5 THz band. Optics Express 2013, 21, 23748–23755
- Bozhevolnyi and Kuipers 2006 Bozhevolnyi, S. I.; Kuipers, L. Near-field characterization of photonic crystal waveguides. Semiconductor science and technology 2006, 21, R1
- Heiblum and Harris 1975 Heiblum, M.; Harris, J. Analysis of curved optical waveguides by conformal transformation. IEEE Journal of Quantum Electronics 1975, 11, 75–83
- Tuniz et al. 2011 Tuniz, A.; Lwin, R.; Argyros, A.; Fleming, S. C.; Pogson, E. M.; Constable, E.; Lewis, R. A.; Kuhlmey, B. T. Stacked-and-drawn metamaterials with magnetic resonances in the terahertz range. Optics Express 2011, 19, 16480–16490
- Ghosh et al. 2019 Ghosh, A.; Zhang, C.; Shi, S. Q.; Zhang, H. High-temperature gas sensors for harsh environment applications: a review. CLEAN–Soil, Air, Water 2019, 47, 1800491
- Bidgoli et al. 2014 Bidgoli, H.; Cherednichenko, S.; Nordmark, J.; Thunman, H.; Seemann, M. Terahertz spectroscopy for real-time monitoring of water vapor and CO levels in the producer gas from an industrial biomass gasifier. IEEE Transactions on Terahertz Science and Technology 2014, 4, 722–733
- Song et al. 2015 Song, Y.; Wang, Z.; Loh, J.; Thomson, M. J. High-Temperature H2O Vapor Measurement Using Terahertz Spectroscopy for Industrial Furnace Applications. IEEE Transactions on Terahertz Science and Technology 2015, 6, 26–31
- Islam et al. 2021 Islam, M. S.; Sultana, J.; Osório, J. H.; Dinovitser, A.; Ng, B. W.; Benabid, F.; Ebendorff-Heidepriem, H.; Abbott, D.; Cordeiro, C. M. Single-Step Tabletop Fabrication for Low-Attenuation Terahertz Special Optical Fibers. Advanced Photonics Research 2021, 2, 2100165
- Li et al. 2022 Li, G.; Ando, R. F.; Zeisberger, M.; Weiss, T.; Schmidt, M. A. Interpreting light guidance in antiresonant and photonic bandgap waveguides and fibers by light scattering: analytical model and ultra-low guidance. Optics Express 2022, 30, 2768–2779