:
\theoremsep
\jmlrvolume[VOLUME # TBD]
\jmlryear2022
\jmlrworkshopMachine Learning for Healthcare
Auto-Gait: Automatic Ataxia Risk Assessment with Computer Vision on Gait Task Videos
Abstract
In this paper, we investigated whether we can 1) detect participants with ataxia-specific gait characteristics (risk-prediction), and 2) assess severity of ataxia from gait (severity-assessment). We collected 155 videos from 89 participants, 24 controls and 65 diagnosed with (or are pre-manifest) spinocerebellar ataxias (SCAs), performing the gait task of the Scale for the Assessment and Rating of Ataxia (SARA) from 11 medical sites located in 8 different states in the United States. We developed a method to separate the participants from their surroundings and constructed several features to capture gait characteristics like step width, step length, swing, stability, speed, etc. Our risk-prediction model achieves 83.06% accuracy and an 80.23% F1 score. Similarly, our severity-assessment model achieves a mean absolute error (MAE) score of 0.6225 and a Pearson’s correlation coefficient score of 0.7268. Our models still performed competitively when evaluated on data from sites not used during training. Furthermore, through feature importance analysis, we found that our models associate wider steps, decreased walking speed, and increased instability with greater ataxia severity, which is consistent with previously established clinical knowledge. Our models create possibilities for remote ataxia assessment in non-clinical settings in the future, which could significantly improve accessibility of ataxia care. Furthermore, our underlying dataset was assembled from a geographically diverse cohort, highlighting its potential to further increase equity. The code used in this study is open to the public, and the anonymized body pose landmark dataset could be released upon approval from our Institutional Review Board (IRB).
Data and Code Availability
We will provide an anonymized dataset consisting of extracted pose-features and SARA score upon acquiring approval from the IRB. The code used in this project is available at: https://github.com/Masum06/Automated-Ataxia-Gait
1 Introduction
Ataxia is a general term referring to a lack of muscle coordination and control, typically arising due to damage to the cerebellum in the brain (Mayo-Clinic-Stuff, 2021). Common symptoms include difficulties walking, deterioration of fine motor skills, imbalance, and trouble eating and swallowing (Seladi-Schulman, 2020). Ataxia may have several different causes including genetics, injuries, stroke, toxins, and more. In this paper, we analyze two forms of a hereditary ataxia named spinocerebellar ataxia (SCA) types 1 and 3 (SCA1 and SCA3) which demonstrate the fastest progression rate and highest prevalence respectively (Jacobi et al., 2012).
To date, there are no cures for ataxia; however, early detection and consistent monitoring can greatly improve symptom management and long-term patient prognosis (Mayo-Clinic-Stuff, 2021). The Scale for the Assessment and Rating of Ataxia (SARA) is a popularly used scale for measuring ataxia progression with high inter-rater reliability, inter-rater consistency, and test-retest reliability (Schmitz-Hübsch et al., 2006; Perez-Lloret et al., 2021; Hartley et al., 2015; Bürk et al., 2009). Although SARA has eight tasks (gait, stance, sitting, speech, etc), we have analyzed the gait task in this paper since 1) SCA heavily impacts common gait characteristics, and 2) gait provides objective, clinically applicable measurements (Buckley et al., 2018).
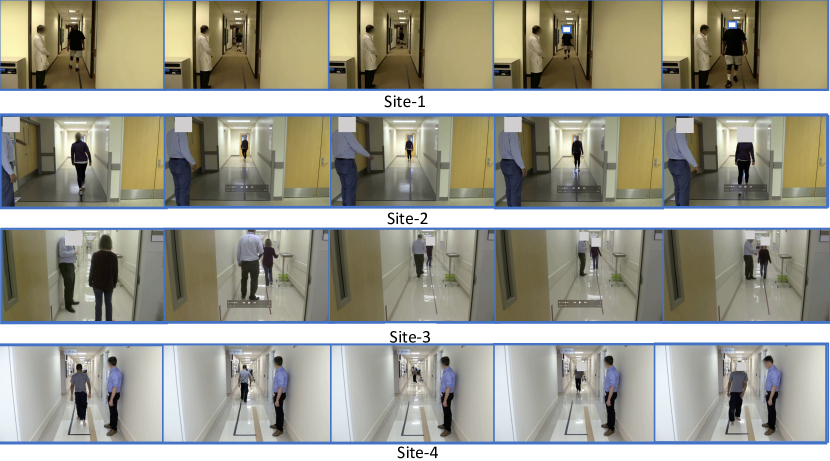
One particular challenge in applying machine learning to ataxia assessment is constructing a dataset of sufficient size. Given that ataxia is a rare disorder, doing so typically requires collaboration across multiple institutions to accrue enough data. In this study, we have analyzed 155 videos of both ataxia patients and controls collected from 11 different medical sites completing the SARA gait task. However, while the sites all followed the SARA protocol, each introduced variations to the overall dataset. Figure 2 provides an overview of the variations in data collected from four of these sites. Although this introduces new challenges in terms of different site settings, lighting conditions, arrangement of doctors and participants, and the presence of other people, it also presents us with a unique opportunity to build a generalizable model. Ataxia is a rare disorder and ataxia specialists are typically clustered in large urban settings. If we can build models that perform reasonably well across different sites, they may be greatly helpful in increasing accessibility of ataxia assessment, especially in underserved communities.
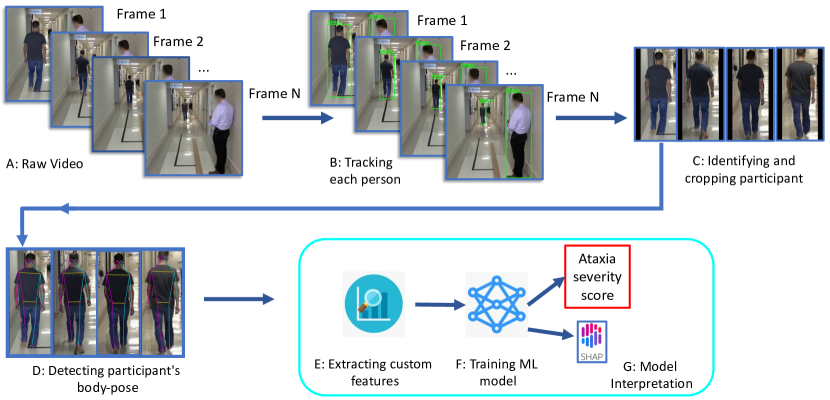
We designed an automated data processing system (Figure 1) that: a) clips the first six seconds of data of an input video (to normalize height among different settings), b) tracks each person across the video, and c) identifies, crops, and reshapes the participant. Once we obtain cropped images belonging to the participant, we then extract body-pose coordinates, as well as several features designed to measure gait characteristics like swing, stability, speed, etc.(Buckley et al., 2018). These features are then fed into a random-forest (Breiman, 2001) machine learning algorithm to generate predictions for ataxia risk and ataxia severity (descriptions in the next paragraph). Furthermore, we applied SHAP (SHapley Additive exPlanations) (Lundberg and Lee, 2017), a feature interpretation tool to understand the magnitude and direction of each feature’s impact in the model’s prediction(s).
Thus, we have addressed two research questions:
-
1.
RQ1: Can we provide an early-stage screening of ataxia from the SARA gait task?
-
2.
RQ2: Can we measure severity of ataxia from the SARA gait task?
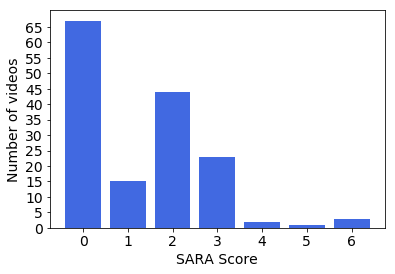
In order to answer those questions, we have trained two separate machine learning models. Gait task SARA scores range between 0 and 8, where 0 represents normal gait and 8 represents an inability to walk, even while supported. Figure 3 provides an overview of how many videos we have corresponding to each gait task SARA score. Since our dataset is focused on early-stage ataxia patients (Sec. 3), most of our subjects have gait task SARA scores in the range of [0-3]. In order to answer RQ1, we divided our data into two classes: one with gait task SARA scores of (Class 0) and another with gait task SARA scores (Class 1). Our Risk-prediction model can differentiate between these two classes with an 83.06% binary accuracy from 10-fold cross-validation (Table 3). To answer RQ2, we divided our dataset into four classes with gait task SARA scores: . For all data with a gait task SARA score , we replace their label with since we have very few data with gait task SARA scores . Our Severity-assessment regression model has a mean absolute error of 0.6225 (STD 0.0132) and a Pearson’s correlation coefficient of 0.7268 (STD 0.0144). For both of these models, we ran SHAP analysis. Figure 7 and Figure 7, corresponding to the Risk-prediction and Severity-assessment models respectively, show that SHAP can provide intuitive, previously-validated results (Sec 5.3). Furthermore, we ran a “leave-one-site-out” analysis, where we exclude data from one site in the training set and test the model’s performance on that site’s data. This allows us to assess how well the model performs on completely unseen data. While the performance of both models decrease through this method, they still perform significantly better than random chance (Table 3) and zero-correlation (Table 4).
Our contributions are as follows:
-
1.
We developed machine learning algorithms for Risk-prediction and Severity-assessment of ataxia from recorded videos of the SARA gait task. Our models achieve 83.06% accuracy and an 80.23 F-1 score for the Risk-prediction task (Table 3). For the Severity-assessment task, we achieve mean absolute error (MAE) of 0.6225 and a Pearson’s correlation coefficient of 0.7268 (Table 4).
-
2.
We designed a robust and automated data-processing algorithm that can separate out participants from videos across different site settings that include both doctors and other passersby. Our leave-one-site analysis shows that our models, built around this data-processing algorithm, perform better than random chance across these different sites (Table 3 and Table 4).
-
3.
We will release an anonymized version of our dataset containing body pose coordinates upon acceptance so that the research community can develop better algorithms for ataxia assessment.
2 Related Works
Objectively assessing ataxia features is an active area of interest for the researchers. Prior efforts have used sensors to assess ataxia gait and its severity. Other studies have analyzed speech features. There is growing interest in using telemedicine-type platforms to increase accessibility of care for ataxia patients in non-clinical settings.
2.1 Detecting Ataxia from Speech
Speech anomalies are a common feature of neurological disorders (and may be the earliest indicators of disease) (Duffy, 2019). Thus, recent machine learning-based approaches have analyzed speech recordings, particularly in the domains of Parkinson’s disease (PD) and cerebellar ataxia (CA) (Rahman et al., 2021; Little et al., 2008; Kashyap et al., 2019, 2020). Kashyap et al. (2020) analyzed recordings of participants repeating single syllables in order to detect and quantify speech-timing anomalies due to CA. Kashyap et al. (2019) were also successful in distinguishing subjects with CA from healthy controls by tracking vocal tract acoustic biomarkers. To accomplish this, participants recited a tongue-twister phrase (i.e.: “British Constitution”).
2.2 Sensors Aiding Automated Analysis of Ataxia
Wearable sensors and Inertia Measurement Units (IMU) are popular modes for objective diagnosis and assessment of CA. Krishna et al. (2019b) collected features across three tests: finger-to-nose test (FNT), upper limb dysdiadochokinesia test (DDK), and heel-to-shin test (HST) using IMU. IMU can efficiently capture kinematic parameters (for example, acceleration, velocity, angle) and can effectively discriminate between subjects with CA and healthy controls. The extracted features using IMU have been found to be highly correlated with well-established clinical assessment scores for measuring severity of CA, including SARA scores (Krishna et al., 2019c, a). Nguyen et al. (2020) were also successful in using wearable sensors to correctly classify CA and control participants, achieving nearly 80% accuracy using features extracted from finger and foot tapping task. Kinect, a motion sensing device developed by Microsoft, is a well-accepted tool in this research domain. Tran et al. (2019) combined Kinect with IMU sensors to automatically assess the severity of CA symptoms based on finger chasing and finger tapping tasks. Tran et al. (2018) were also successful in quantifying CA-related disabilities via Kinect as subjects performed the finger chasing task. Kinect is also useful as an alternative to physical therapy, allowing subjects with CA to be rehabilitated from the comfort of their home (Ilg et al., 2012; Wang et al., 2019).
2.3 Detecting Ataxia from Gait Task
Patients with CA may demonstrate clumsy, staggering movements while performing the gait task (Serrao and Conte, 2018). Both wearable sensors and the Kinect system have demonstrated promise in analyzing CA based on subjects performing the SARA gait task (LeMoyne et al., 2016; Phan et al., 2019; Honda et al., 2020; Dostál et al., 2021). LeMoyne et al. (2016) gathered accelerometry and gyroscopic data by mounting wireless inertial sensors on the ankle joints of participants. The signals captured were transmitted to a server, where features were then extracted and fed to a machine learning model to distinguish subjects with Friedreich’s ataxia from healthy controls. Phan et al. (2019) also employed a similar strategy, but instead of relying on a single gait task, they captured gait features at self-selected slow, preferred and fast walking speeds. The extracted features were successful for both detecting CA and evaluating its severity. Honda et al. (2020) analyzed the gait task by extracting features using a Kinect-based system and also produced promising results. Most recently, Dostál et al. (2021) obtained accelerometry data using 31 time-synchronized sensors placed on different parts of the body. They obtained an excellent accuracy of 98.0%, and 98.5% in classifying between healthy subjects and subjects with CA, using neural networks extracted features from the shoulders and head/spine respectively. Another recent, similar approach obtained 95.8% accuracy in classifying Ataxic and normal gait by using deep learning to analyze frequency components of accelerometric signals simultaneously recorded at multiple body positions. While the above mentioned studies depend on using external sensors, Ortells et al. (2018) explored automated video assessment to analyze Ataxic gait. However, the dataset used in the study was simulated by 10 healthy volunteers, so it did not contain real data from subjects with Ataxia.
2.4 Application of Teleneurology
Recently, researchers have tried to increase the use of telemedicine to care for patients with CA, which is also recommended by experts (Manto et al., 2020). Notably, Grobe-Einsler et al. (2021) developed , a video-based instrument to measure ataxia severity from a subject’s home. Independently, a user performs 5 of the 8 SARA items; items were modified so that the tool could be easily self-applied without the presence of a provider. After all the tasks are completed, the recorded videos are securely transferred to be evaluated by an expert rater offline using SARA criteria. While this tool represents an advance in remote delivery of care, it still requires a human rater, even if asynchronously. Separately, Summa et al. (2020) created SaraHome, a tool that interlinks the Microsoft Kinect 2.0 and Leap Motion Controller (LMC), and launched a pilot study to gauge participant reception and feasibility of the tool.The tool was well-received; however, to date, it has not been tested on actual video footage to assess its performance compared to traditional measures.
2.5 Automated Video Analysis
While automated video analysis is challenging, it has the potential to increase accessibility of care. Jaroensri et al. (2017) introduced an automated method for quantifying motion impairment of ataxia patients by analyzing video recordings of the Finger to Nose Test (FNT). They used a neural network for pose estimation and optical flow techniques to track participant hand motion. Their models performed comparably to traditional clinical assessments of ataxia severity.
In this paper, we use machine learning to distinguish between ataxia gait and normal gait, as well as assess the severity of ataxia gait, from recorded videos of subjects performing the SARA gait task in clinical settings. We introduced 14 features that can be computed without sensors; these features are reflective of well-established ataxia gait characteristics. In addition, we combined data across multiple clinical sites to validate the effectiveness of the proposed features across different environments.
3 Dataset Description
| Status | Number of participants (N=89) | Mean age (std deviation) | # Female (percentage) | #Videos |
|---|---|---|---|---|
| PwA | 65 | 47.07(9.08) | 36 (55.38) | 116 |
| Control | 24 | 41.73(8.72) | 15 (62.5) | 39 |
Our dataset consists of recorded videos of 89 unique participants completing SARA tasks at annual visits in a clinical setting across eleven different medical sites in USA. Of these 89 individuals, 24 were healthy controls. The remaining 65 were either already symptomatic with spinocerebellar ataxia type 1 or type 3 (SCA1 and SCA3 respectively) or were otherwise pre-symptomatic. We will refer to these 65 participants as People-with-Ataxia (PwA). Across the 65 PwA and 24 controls, we obtained 116 and 39 unique videos from each group respectively. Table 1 provides demographic information on all 89 participants. If any one of the following exclusionary criteria were met, then a participant was deemed ineligible to participate in the study:
-
•
Known genotype consistent with that of other inherited ataxia (for example, Freidrich’s ataxia)
-
•
Concomitant disorder(s) that affected assessment of ataxia severity during study
-
•
Changes in physical and occupational ataxia therapy in the two months prior to study enrollment
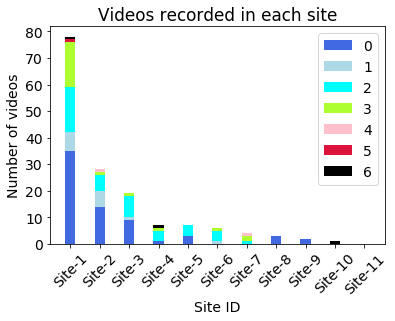
Not all sites provided equal amounts of data. Figure 5 provides an overview of how many videos were recorded at each site and the gait-specific SARA score distribution of them. As can be seen, the first three sites supplied most of the videos and have a good mix of videos with different SARA scores. Figure 2 provides snapshots of videos collected at the various locations. While SARA was administered at each site, there nonetheless were some site-specific variations present in the videos, including:
-
1.
Each site had different lighting conditions
-
2.
Providers would sometimes walk beside the participants (Site 3) and thus overlap with the participants
-
3.
Providers would either stand to the left (Site 2) or to the right (Site 4) of the participants
-
4.
Because some videos were captured in high-traffic areas, other people (not participants or providers) would occasionally be captured in the recordings (Site 4)
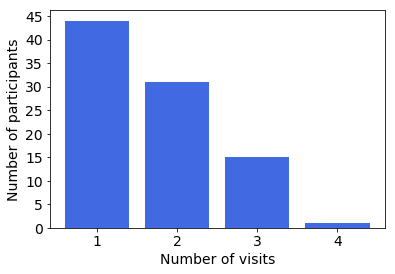
Furthermore, this study is a multi-visit study, meaning that some of the captured videos are of the same participant and collected over an extended time period. Figure 4 provides the distribution of number of study visits completed across all participants.
While the videos include footage of the 89 participants completing all eight tasks in SARA, we specifically focused on the gait task portions. As described previously, SARA assigns a score from 0 to 8 for the gait task, where 0 represents normal walking and 8 represents inability to walk, even with support. Figure 3 provides a breakdown of the distribution of gait-specific SARA scores across all 155 collected videos (PwA and control). As can be seen, the majority of participants had gait-specific SARA scores between 0 and 3. These SARA scores were provided by multiple neurologists with high inter-rater agreement (on average, the score from different raters had a difference of on same video).
4 Data Processing and Feature Extraction
4.1 Data Prepossessing
For each recorded video, we analyzed the first six seconds of data. Since participants took different amounts of time to complete the gait task, we restricted analysis to the first six seconds in order to normalize the data. During those six seconds, all participants were moving away from the camera and did not have time to turn around and return back towards the camera. As can be seen in Figure 2, the videos contained noise, including:
-
1.
Doctors evaluating participants, who are captured in the video. They typically were either at rest or moved a few steps.
-
2.
Passersby captured in the video. They typically moved horizontally and were visible only for a few frames.
To isolate the participant’s movement, we had to separate the participant from the surrounding environment. To accomplish that, we designed appropriate heuristics after making the following observations:
-
1.
At every site, the camera was statically located behind the participant and the participant walked away from the camera.
-
2.
The participant was visible in almost every frame and constantly moving away from the camera. Thus, the participant continuously got smaller in size.
To isolate the participant’s gait, we processed the videos through the following three steps (Figure 1). First, we detected the presence of each individual in the video. Second, we tracked each individual through a bounding-box, and third, designed heuristics to correctly isolate the participant.
We used a Faster R-CNN object detection model (Ren et al., 2015) to process all video frames. This model outputs a box that assigns boundaries to each object in the frame. With at least 80% probability, we could successfully separate objects detected as ”people”. Then, we applied the SORT algorithm to track the identified persons throughout the video (Bewley et al., 2016). The SORT algorithm tracks the objects detected via the Faster R-CNN model by assigning a unique ID to each one. Thus, we could generate a series of bounding boxes for all persons detected in the videos.
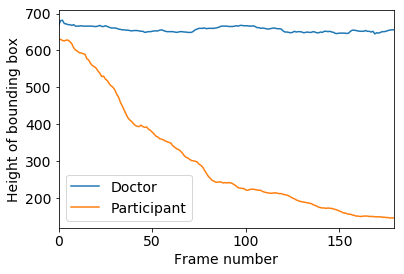
As mentioned previously, the participants consistently decreased in size throughout the duration of the videos. Figure 6 provides an example of how the height of the bounding boxes containing the doctor and the participant changed over time. By representing height in the th frame as , we can calculate a score for height change,
| (1) |
We calculated a for each of the persons tracked; the individual with the highest score has walked the farthest distance consistently, hence, they are the participant. Afterwards, we manually inspected all the data to ensure the correctness of this method. An additional, unintended benefit of this simple method is that it filtered out many of the extraneous passersby. Because these individuals only appear in a small number of frames, their will be low.
4.2 Feature Extraction
| Feature group | Measurement | Estimation for | Source |
|---|---|---|---|
| feet_dist | Distance between feet | Step width, step length, swing | 1, 2 |
| feet_angle | Angle between the x-axis and line joining feet | Swing, step length, swing | 1 |
| right_x | X-Coordinate of right feet | Step length, step width, swing | 1, 2 |
| right_y | Y-Coordinate of right feet | Step length, step width, swing | 1, 2 |
| left_x | X-Coordinate of left feet | Step length, step width, swing | 1, 2 |
| left_y | Y-Coordinate of left feet | Step length, step width, swing | 1, 2 |
| left_knee_bent | Angle between the left thigh and knee | Swing | 1 |
| right_knee_bent | Angle between the right thigh and knee | Swing | 1 |
| imbalance | Horizontal deviation of the mid-shoulders and hip. | Stability | 2 |
| tilt | Angle of shoulder line with horizontal axis | Stability | 2 |
| nose_x | X-coordinate of the nose | Stability | 2 |
| nose_y | Y-coordinate of the nose | Stability | 2 |
| stance | % of frames where the participant was stationary | Stance phase, swing phase | 1 |
| height_reduction | Total height reduction for the 6s walk | Speed | 1 |
After separating out the frames containing the participant of interest, we extracted several features based on previously validated gait characteristics of SCA patients (Buckley et al., 2018; Honda et al., 2020). Notably, these features reflect common ataxia gait features including step width, step length, swing, stability, stance phase, swing phase, and speed.
Table 2 provides a short description of our features. For first 13 entries listed in the “Feature group” column in Table 2, we identified six sub-features: mean, std-deviation, max, min, range (), entropy. Since we get a sequence of data for these 13 entries, we need to compute some sample statistics to capture their information succinctly. For the last entry height_reduction was itself a number (Section 4.1), hence no sub-feature was necessary. Thus, we finally have features to build our models. From which, we select the final features using Recursive Feature Elimination with Cross-Validation (RFECV) algorithm.
We derived entropy features as they can capture the irregularity in a sequence of data. Mathematically, a periodic signal will have zero entropy, and a random signal will have high entropy. As SCA patients have difficulties in maintaining a consistent rhythm in their walk, entropy-related features should effectively capture these irregularities in walking pattern. We used a open-source Python implementation (Vallat, 2022) of the spectral entropy method originally designed to capture irregularities in EEG brain signals (Inouye et al., 1991).
5 Models and Results
| Test | F1 score (%) | Accuracy (%) | ||
|---|---|---|---|---|
| Mean | STD | Mean | STD | |
| 10-fold CV | 80.23 | 9.19 | 83.06 | 6.79 |
| Site 2 | 80.5 | 2.65 | 80.54 | 2.64 |
| Site 3 | 65.34 | 5.04 | 65.79 | 4.85 |
| Site 4 | 74.65 | 6.32 | 81.43 | 6.55 |
| Site 5 | 66.94 | 5.83 | 72.86 | 4.29 |
| Site 6 | 94.55 | 16.36 | 98.33 | 5.0 |
| Test | MAE | Corr Coeff. | ||
|---|---|---|---|---|
| Mean | STD | Mean | STD | |
| 10-fold CV | 0.6225 | 0.0132 | 0.7268 | 0.0144 |
| Site 2 | 0.5673 | 0.0 | 0.7081 | 0.0 |
| Site 3 | 0.7723 | 0.0 | 0.4569 | 0.0 |
| Site 4 | 1.0886 | 0.0 | 0.2146 | 0.0 |
| Site 5 | 0.6334 | 0.0 | 0.6244 | 0.0 |
| Site 6 | 0.4402 | 0.0 | 0.4297 | 0.0 |
fig:scatter_regression
\subfigure[Risk prediction model (binary)]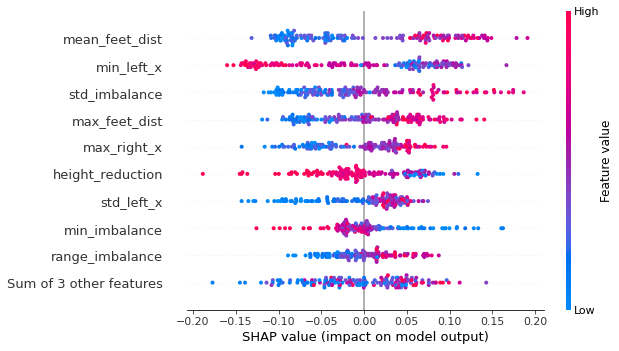 \subfigure[Severity assessment model (regression)]
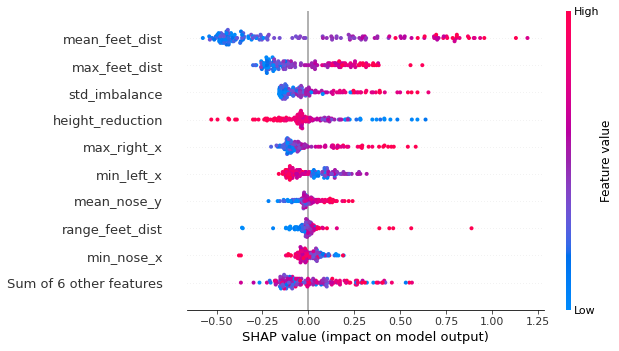
fig:scatter_regression
\subfigure[Scatter plot]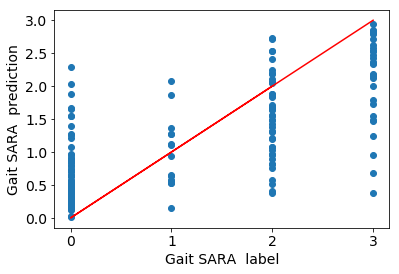 \subfigure[Gaussian kernel density estimation]
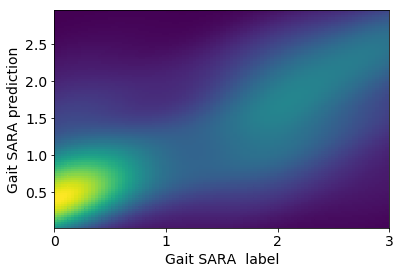
Once we computed the numeric features from the participants’ gait data, we trained two different machine learning classifiers to answer RQ1 (Risk-prediction) and RQ2 (Severity-assessment) posed in Section 1 .
5.1 Risk-prediction
First, we trained a random forest classifier to classify participants at risk for ataxia from healthy controls. All participants with a score are classified as ‘at risk’ (Class 1) and healthy controls are considered ’risk-free’ (Class 0). To select the optimal set of features for training this model, we employed the recursive feature elimination with cross-validation method (recursive_feature_selection). The complete list of features used for training this model is available in A.1.
There are 88 videos in Class 1 and 67 videos in Class 0. Therefore, the accuracy of choosing the majority class is 0.568. Hence, accuracy of more than 0.568 indicates the model is performing better than random chance. We evaluated the model using 10-fold cross-validation and leave-one-site-out methodologies. In the second case, we trained the model on all sites but one and tested the model on the held-out site. Good performance on this task provides a useful metric for evaluating our model’s generalizability in completely unseen situations. We perform all of the experiments 20 times to minimize randomness. The mean and standard deviation of the 20 runs are reported in Table 3. We can see from Table 3 that the model achieves an F1 score of 80.23% and an accuracy of 83.06% in 10-fold cross-validation. Clinically which means, the model is able to distinguish a CA patient from non-CA subject with above 80% correctness. The low standard deviation between results indicates that the results are fairly consistent between different runs. In leave-one-site-out tests, the model performs fairly well, despite never seeing data from a particular site.
5.2 Severity-assessment
Second, in order to predict the SARA score directly from gait data, we designed a random forest regression model. As our primary motivation is to identify early stage CA, we focus on lower scores of SARA and categorize all SARA scores of 3 or above to simply 3. The model takes the numeric features from participants walking as input and predicts a continuous score between 0 and 3. We use the feature importance score of the random forest algorithm to identify the best features for training this model (a complete list is available in A.2.
We evaluate the model via calculating the mean absolute error (MAE) and a Pearson’s correlation coefficient (PCC). A lower MAE is better, as it indicates the mean difference between the model’s prediction and the actual SARA score. PCCs range from -1 to 1, where higher values are better, implying a correlation between the prediction and ground truth. On 10-fold-cross-validation, our model achieves MAE and PCC scores of 0.6225 and 0.7268 respectively. We can see from Table 4 that in most cases, the model achieves less than 1.0 MAE through the leave-one-site analysis and its predictions are positively correlated with ground truth SARA scores. The low standard deviation indicates that the predictions are consistent across runs. By manually inspecting 6 datapoints (Figure 2) in Site 6, we find that although the model has high accuracy in Table 3 and the lowest of all MAE in Table 4, a single misclassification results in a relatively lower but still acceptable correlation score. Figures 8 and 8 visualize the positive correlation through a scatter plot and Gaussian kernel density estimation.
5.3 Model Interpretation
Figure 7 and 7 give us insights into which features most influence our models’ predictions. We can see that the coordinates of the left and right feet, as well as the distance of steps, play important roles in model prediction. Based on these summaries, we see that wider steps (min_left_x, max_feet_dist, max_right_x, etc.) and variation in steps (std_left_x, range_feet_dist, etc.) both affect ataxia scores; this is consistent with (Buckley et al., 2018; Schmitz-Hübsch et al., 2006; Vyšata et al., 2021), who also found that step length, step width, step distance, and differences in step length between the left and right feet are indicative of CA. (Buckley et al., 2018; Schmitz-Hübsch et al., 2006) also reported that individuals with CA have lower walking speeds than healthy controls. In our analysis, height_reduction is a direct reflection of walking speed, as reduced height indicates a further distance traveled, which is proportional to distance traveled in a fixed duration (6 seconds in this study). We can see that in both graphs, height_reduction negatively affects CA score. In addition, (Schmitz-Hübsch et al., 2006) found that ataxia participants’ have oscillatory walking patterns, which is effectively captured through the imbalance features in our model; range_imbalance, std_imbalance, min_imbalance, etc.) contribute to higher SARA scores, thus denoting more advanced ataxia. Position of the nose (Figure 7) also can be indicative of oscillation in upper body movement. Overall, Figure 7 and 7 demonstrate that the most significant features in our model are consistent with those identified in prior literature.
6 Limitations and Future Work
6.1 Incorporating Additional Characteristics
In this study, the classification features are computed with clever engineering grounded on existing literature. However, a more exhaustive study of ataxia and its effects could reveal more discriminative features that can result in better performance. In order to normalize different walking distance between sites, we only considered the first 6 second of walking forward part of video-recorded gait. However, in a standard setting, a patient walks forward, turns and then walks back to the initial position. Taking the full walk into consideration could potentially provide more information. Further work can also be done in tandem walk, Stance task, finger to nose task, etc. using similar techniques. In the future, we plan to find novel ways to capture features reflective of different task in Cerebellar Ataxia prediction and cover a larger part of SARA score metric.
6.2 Limitations of dataset
Our dataset was collected on people either diagnosed or at-risk of Cerebellar Ataxia (SCA). While SARA can be also used to assess other types of ataxia aside from SCAs – such as ataxia due to brain tumors and ataxia telangiectasia (Perez-Lloret et al., 2021) – the target populations nonetheless differ. Therefore, our results may not translate to other other types of Ataxia. In addition, the videos were collected in clinical settings, and all the participants were assisted by a doctor. It would be interesting to explore whether our findings hold for home-recorded videos, potentially without any supervision of another person.
6.3 Differentiating between Parkinson’s disease and ataxia
At least 15% of patients diagnosed with Parkinson’s disease (PD) are later found to be incorrectly diagnosed (Schrag et al., 2002). SCAs and other types of ataxia present very similar symptoms to PD, namely slowed movements, tremors, stiffness, and difficulty balancing (Park et al., 2015). In the words of an ataxia patient, “I know there are people walking around with exactly what I have and they don’t know it…. It is often misdiagnosed because it resembles other things like multiple sclerosis, stroke and Parkinson’s disease.”(Body and staff, 2021). Both SARA for measuring ataxia severity and the Movement Disorder Society Unified Parkinson’s Disease Rating Scale (MDS-UPDRS) include a gait task (Goetz et al., 2008; Subramony, 2007). In collaboration with researchers, we have already amassed a collection of videos of PD participants completing the gait task of the MDS-UPDRS. We intend to build machine learning models that can distinguish between PD and ataxia in individuals from gait video footage.
6.4 Creating a platform for automated, end-to-end SARA scoring for clinic and home use
While our current models only score the gait task section of SARA from captured videos, this work nonetheless opens up possibilities for development of an end-to-end framework that provides scores for all eight tasks based on recorded footage. Not only could such a system be utilized in the clinic, but in the home as well. In the future, we are interested in developing a platform that collects video footage of users completing a modified version of SARA in a home environment (Grobe-Einsler et al., 2021) and scores each section accordingly (perhaps through a smartphone application or web application). This would improve accessibility of valuable neurological information and may inform earlier interventions.
In the future, we plan to develop an analogous scoring scheme using machine learning-based approaches to complement SARA results.
7 Conclusion
In this paper, we present machine learning models that can detect participants displaying ataxia-impacted gait characteristics and can measure severity of ataxia from the SARA gait task. Our models open up new possibilities for the future development of a user-friendly, automated platform that can remotely assess ataxia in non-clinical settings. This would have various applications, including independent use by patients and use by stakeholders in patient-centric clinical trials. Moreover, the platform can be re-purposed to detect whether elderly individuals are at risk of falls, since a gait speed of less than 1 meter/second strongly predicts falls (Kyrdalen et al., 2019). As falls are one of the main reasons for fractures, physical incapacity, and even death (Terroso et al., 2014) in the elderly, our tool can be helpful in limiting fall-related accidents and providing timely care to this vulnerable population.
Institutional Review Board (IRB)
We conducted the experiments with IRB approval of the relevant institution.
References
- Bewley et al. (2016) Alex Bewley, Zongyuan Ge, Lionel Ott, Fabio Ramos, and Ben Upcroft. Simple online and realtime tracking. In 2016 IEEE international conference on image processing (ICIP), pages 3464–3468. IEEE, 2016.
- Body and staff (2021) Body and Mind staff. Ataxia sufferer faces a neurological disorder that’s often misdiagnosed. https://www.pennlive.com/bodyandmind/2011/11/positive_attitude_is_best_medi.html, November 2021.
- Breiman (2001) Leo Breiman. Random forests. Machine learning, 45(1):5–32, 2001.
- Buckley et al. (2018) Ellen Buckley, Claudia Mazzà, and Alisdair McNeill. A systematic review of the gait characteristics associated with cerebellar ataxia. Gait & posture, 60:154–163, 2018.
- Bürk et al. (2009) Katrin Bürk, Ulrike Mälzig, Stefanie Wolf, Suzette Heck, Konstantinos Dimitriadis, Tanja Schmitz-Hübsch, Sascha Hering, Tobias M Lindig, Verena Haug, Dagmar Timmann, et al. Comparison of three clinical rating scales in friedreich ataxia (frda). Movement disorders, 24(12):1779–1784, 2009.
- Dostál et al. (2021) Ondřej Dostál, Aleš Procházka, Oldřich Vyšata, Ondřej Ťupa, Pavel Cejnar, and Martin Vališ. Recognition of motion patterns using accelerometers for ataxic gait assessment. Neural Computing and Applications, 33(7):2207–2215, 2021.
- Duffy (2019) Joseph R Duffy. Motor speech disorders e-book: Substrates, differential diagnosis, and management. Elsevier Health Sciences, 2019.
- Goetz et al. (2008) Christopher G Goetz, Barbara C Tilley, Stephanie R Shaftman, Glenn T Stebbins, Stanley Fahn, Pablo Martinez-Martin, Werner Poewe, Cristina Sampaio, Matthew B Stern, Richard Dodel, et al. Movement disorder society-sponsored revision of the unified parkinson’s disease rating scale (mds-updrs): scale presentation and clinimetric testing results. Movement disorders: official journal of the Movement Disorder Society, 23(15):2129–2170, 2008.
- Grobe-Einsler et al. (2021) Marcus Grobe-Einsler, Arian Taheri Amin, Jennifer Faber, Tamara Schaprian, Heike Jacobi, Tanja Schmitz-Hübsch, Alhassane Diallo, Sophie Tezenas du Montcel, and Thomas Klockgether. Development of sarahome, a new video-based tool for the assessment of ataxia at home. Movement Disorders, 36(5):1242–1246, 2021.
- Hartley et al. (2015) H Hartley, B Pizer, S Lane, C Sneade, R Pratt, A Bishop, and R Kumar. Inter-rater reliability and validity of two ataxia rating scales in children with brain tumours. Child’s Nervous System, 31(5):693–697, 2015.
- Honda et al. (2020) Takeru Honda, Hiroshi Mitoma, Hirotaka Yoshida, Kyota Bando, Hiroo Terashi, Takeshi Taguchi, Yohane Miyata, Satoko Kumada, Takashi Hanakawa, Hitoshi Aizawa, et al. Assessment and rating of motor cerebellar ataxias with the kinect v2 depth sensor: extending our appraisal. Frontiers in neurology, 11:179, 2020.
- Ilg et al. (2012) Winfried Ilg, Cornelia Schatton, Julia Schicks, Martin A Giese, Ludger Schöls, and Matthis Synofzik. Video game–based coordinative training improves ataxia in children with degenerative ataxia. Neurology, 79(20):2056–2060, 2012.
- Inouye et al. (1991) Tsuyoshi Inouye, Kazuhiro Shinosaki, H Sakamoto, Seigo Toi, Satoshi Ukai, Akinori Iyama, Y Katsuda, and M Hirano. Quantification of eeg irregularity by use of the entropy of the power spectrum. Electroencephalography and clinical neurophysiology, 79(3):204–210, 1991.
- Jacobi et al. (2012) Heike Jacobi, Till-Karsten Hauser, Paola Giunti, Christoph Globas, Peter Bauer, Tanja Schmitz-Hübsch, László Baliko, Alessandro Filla, Caterina Mariotti, Maria Rakowicz, et al. Spinocerebellar ataxia types 1, 2, 3 and 6: the clinical spectrum of ataxia and morphometric brainstem and cerebellar findings. The Cerebellum, 11(1):155–166, 2012.
- Jaroensri et al. (2017) Ronnachai Jaroensri, Amy Zhao, Guha Balakrishnan, Derek Lo, Jeremy D Schmahmann, Frédo Durand, and John Guttag. A video-based method for automatically rating ataxia. In Machine Learning for Healthcare Conference, pages 204–216. PMLR, 2017.
- Kashyap et al. (2019) Bipasha Kashyap, Pubudu N Pathirana, Malcolm Horne, Laura Power, and David Szmulewicz. Automated tongue-twister phrase-based screening for cerebellar ataxia using vocal tract biomarkers. In 2019 41st Annual International Conference of the IEEE Engineering in Medicine and Biology Society (EMBC), pages 7173–7176. IEEE, 2019.
- Kashyap et al. (2020) Bipasha Kashyap, Malcolm Horne, Pubudu N Pathirana, Laura Power, and David Szmulewicz. Automated topographic prominence based quantitative assessment of speech timing in cerebellar ataxia. Biomedical Signal Processing and Control, 57:101759, 2020.
- Krishna et al. (2019a) Ragil Krishna, Pubudu N Pathirana, Malcolm Horne, Laura Power, and David Szmulewicz. Quantitative assessment of cerebella ataxia through automated upper limb functional tests. In Tenth International Conference on Signal Processing Systems, volume 11071, page 110710S. International Society for Optics and Photonics, 2019a.
- Krishna et al. (2019b) Ragil Krishna, Pubudu N Pathirana, Malcolm Horne, Laura Power, and David J Szmulewicz. Quantitative assessment of cerebellar ataxia, through automated limb functional tests. Journal of neuroengineering and rehabilitation, 16(1):1–15, 2019b.
- Krishna et al. (2019c) Ragil Krishna, Pubudu N. Pathirana, Malcom Horne, Laura Power, and David J. Szmulewicz. Quantitative assessment of cerebella ataxia, through automated limb-coordination tests. In 2019 41st Annual International Conference of the IEEE Engineering in Medicine and Biology Society (EMBC), pages 6850–6853, 2019c. 10.1109/EMBC.2019.8856694.
- Kyrdalen et al. (2019) Ingebjørg Lavrantsdatter Kyrdalen, Pernille Thingstad, Leiv Sandvik, and Heidi Ormstad. Associations between gait speed and well-known fall risk factors among community-dwelling older adults. Physiotherapy research international, 24(1):e1743, 2019.
- LeMoyne et al. (2016) Robert LeMoyne, Frederic Heerinckx, Tanya Aranca, Robert De Jager, Theresa Zesiewicz, and Harry J Saal. Wearable body and wireless inertial sensors for machine learning classification of gait for people with friedreich’s ataxia. In 2016 IEEE 13th International Conference on Wearable and Implantable Body Sensor Networks (BSN), pages 147–151. IEEE, 2016.
- Little et al. (2008) Max Little, Patrick McSharry, Eric Hunter, Jennifer Spielman, and Lorraine Ramig. Suitability of dysphonia measurements for telemonitoring of parkinson’s disease. Nature Precedings, pages 1–1, 2008.
-
Lundberg and Lee (2017)
Scott M Lundberg and Su-In Lee.
A unified approach to interpreting model predictions.
In I. Guyon, U. V. Luxburg, S. Bengio, H. Wallach, R. Fergus,
S. Vishwanathan, and R. Garnett, editors, Advances in Neural
Information Processing Systems 30, pages 4765–4774. Curran Associates,
Inc., 2017.
URL
http://papers.nips.cc/paper/7062-a-unified-approach-to-interpreting-
model-predictions.pdf. - Manto et al. (2020) Mario Manto, Nicolas Dupre, Marios Hadjivassiliou, Elan D Louis, Hiroshi Mitoma, Marco Molinari, Aasef G Shaikh, Bing-Wen Soong, Michael Strupp, Frank Van Overwalle, et al. Medical and paramedical care of patients with cerebellar ataxia during the covid-19 outbreak: seven practical recommendations of the covid 19 cerebellum task force. Frontiers in neurology, 11:516, 2020.
- Mayo-Clinic-Stuff (2021) Mayo-Clinic-Stuff. Ataxia. https://www.mayoclinic.org/diseases-conditions/ataxia/symptoms-causes/syc-20355652, 2021.
- Nguyen et al. (2020) Khoa D Nguyen, Pubudu N Pathirana, Malcolm Horne, Laura Power, and David J Szmulewicz. Entropy-based analysis of rhythmic tapping for the quantitative assessment of cerebellar ataxia. Biomedical Signal Processing and Control, 59:101916, 2020.
- Ortells et al. (2018) Javier Ortells, María Trinidad Herrero-Ezquerro, and Ramón A Mollineda. Vision-based gait impairment analysis for aided diagnosis. Medical & biological engineering & computing, 56(9):1553–1564, 2018.
- Park et al. (2015) Hyeyoung Park, Han-Joon Kim, and Beom S Jeon. Parkinsonism in spinocerebellar ataxia. BioMed research international, 2015, 2015.
- Perez-Lloret et al. (2021) Santiago Perez-Lloret, Bart Van de Warrenburg, Malco Rossi, Carmen Rodríguez-Blázquez, Theresa Zesiewicz, Jonas AM Saute, Alexandra Durr, Masatoyo Nishizawa, Pablo Martinez-Martin, Glenn T Stebbins, et al. Assessment of ataxia rating scales and cerebellar functional tests: critique and recommendations. Movement Disorders, 36(2):283–297, 2021.
- Phan et al. (2019) Dung Phan, Nhan Nguyen, Pubudu N Pathirana, Malcolm Horne, Laura Power, and David Szmulewicz. A random forest approach for quantifying gait ataxia with truncal and peripheral measurements using multiple wearable sensors. IEEE Sensors Journal, 20(2):723–734, 2019.
- Rahman et al. (2021) Wasifur Rahman, Sangwu Lee, Md Saiful Islam, Victor Nikhil Antony, Harshil Ratnu, Mohammad Rafayet Ali, Abdullah Al Mamun, Ellen Wagner, Stella Jensen-Roberts, Emma Waddell, et al. Detecting parkinson disease using a web-based speech task: Observational study. Journal of medical Internet research, 23(10):e26305, 2021.
- Ren et al. (2015) Shaoqing Ren, Kaiming He, Ross Girshick, and Jian Sun. Faster r-cnn: Towards real-time object detection with region proposal networks. Advances in neural information processing systems, 28:91–99, 2015.
- Schmitz-Hübsch et al. (2006) T1 Schmitz-Hübsch, S Tezenas Du Montcel, L Baliko, J Berciano, S Boesch, Chantal Depondt, P Giunti, C Globas, J Infante, J-S Kang, et al. Scale for the assessment and rating of ataxia: development of a new clinical scale. Neurology, 66(11):1717–1720, 2006.
- Schrag et al. (2002) Aa Schrag, Yb Ben-Shlomo, and Niall Quinn. How valid is the clinical diagnosis of parkinson’s disease in the community? Journal of Neurology, Neurosurgery & Psychiatry, 73(5):529–534, 2002.
- Seladi-Schulman (2020) Jill Seladi-Schulman. Ataxia: Definition, types, causes, diagnosis, treatment, Jan 2020. URL https://www.healthline.com/health/ataxia#types-of-ataxia.
- Serrao and Conte (2018) Mariano Serrao and Carmela Conte. Detecting and measuring ataxia in gait. In Handbook of Human Motion, pages 937–954. Springer International Publishing, 2018.
- Subramony (2007) Sub H Subramony. Sara—a new clinical scale for the assessment and rating of ataxia. Nature clinical practice Neurology, 3(3):136–137, 2007.
- Summa et al. (2020) Susanna Summa, Tommaso Schirinzi, Giuseppe Massimo Bernava, Alberto Romano, Martina Favetta, Enza Maria Valente, Enrico Bertini, Enrico Castelli, Maurizio Petrarca, Giovanni Pioggia, et al. Development of sarahome: a novel, well-accepted, technology-based assessment tool for patients with ataxia. Computer methods and programs in biomedicine, 188:105257, 2020.
- Terroso et al. (2014) Miguel Terroso, Natacha Rosa, Antonio Torres Marques, and Ricardo Simoes. Physical consequences of falls in the elderly: a literature review from 1995 to 2010. European Review of Aging and Physical Activity, 11(1):51–59, 2014.
- Tran et al. (2018) Ha Tran, Pubudu N Pathirana, Malcolm Horne, Laura Power, and David Szmulewicz. Automated finger chase (ballistic tracking) in the assessment of cerebellar ataxia. In 2018 40th Annual International Conference of the IEEE Engineering in Medicine and Biology Society (EMBC), pages 3521–3524. IEEE, 2018.
- Tran et al. (2019) Ha Tran, Pubudu N Pathirana, Malcolm Horne, Laura Power, and David J Szmulewicz. Automated evaluation of upper limb motor impairment of patient with cerebellar ataxia. In 2019 41st Annual International Conference of the IEEE Engineering in Medicine and Biology Society (EMBC), pages 6846–6849. IEEE, 2019.
- Vallat (2022) Rafayel Vallat. entropy.spectral_entropy. https://raphaelvallat.com/entropy/build/html/generated/entropy.spectral_entropy.html, January 15 2022.
- Vyšata et al. (2021) Oldřich Vyšata, Ondřej Ťupa, Aleš Procházka, Rafael Doležal, Pavel Cejnar, Aprajita Milind Bhorkar, Ondřej Dostál, and Martin Vališ. Classification of ataxic gait. Sensors, 21(16), 2021. ISSN 1424-8220. 10.3390/s21165576. URL https://www.mdpi.com/1424-8220/21/16/5576.
- Wang et al. (2019) Lina Wang, Jiangbo Liu, and Jian Lan. Feature evaluation of upper limb exercise rehabilitation interactive system based on kinect. IEEE Access, 7:165985–165996, 2019.
Appendix A Selected Features
A.1 Features Used For Risk-prediction task
[mean_feet_dist, std_left_x, std_imbalance, std_nose_y, max_feet_dist, max_right_x, min_left_x, min_imbalance, range_left_x, range_imbalance, range_nose_x, height _reduction]
A.2 Features Used For Severity-assessment task:
[ ’mean_feet_dist’, ’height_reduction’, ’max_feet_dist’, ’max_right_x’, ’std_imbalance’, ’min_left_x’, ’range_imbalance’, ’range_nose_x’, ’mean_nose_y’, ’min_nose_x’, ’entropy_nose_y’, ’std_tilt’, ’std_left_x’, ’range_feet_dist’, ’range_left_x’ ]