yonder: A python package for data denoising and reconstruction
Abstract
We present a standalone implementation of a data-deconvolution method based on singular value decomposition. The tool is written in python and packaged in the open-source yonder package. yonder receives as input two matrices, one for the data and another for the errors, and outputs a denoised version of the original dataset. In this Research Note, we briefly describe the methodology and show a demonstration of the yonder on a simulated dataset.
1 Introduction
Measurement errors are ubiquitous in Astronomy. While plenty of methodologies exist to handle them on linear regression problems (Kelly, 2007), there is a shortage of ready-to-use packages to perform data pre-processing and machine learning-related tasks in the presence of measurement errors (but see, e.g. Bovy et al., 2011; Reis et al., 2018). It is of particular interest to estimate a latent matrix based on noisy observations. Here, we consider the case of tabular-like data representing different objects as rows and their particular features as columns, and a matrix of similar dimensions encodes the uncertainties of each measurement. , where is the noisy measurement, and a stochastic noise matrix with zero mean. To help alleviate this problem, we wrote yonder, a python package for data denoising and reconstruction. This report briefly introduces the package and illustrates how the method works in practice.
2 Analysis and Discussion
Given a data matrix , its singular value decomposition (SVD) is given by:
| (1) |
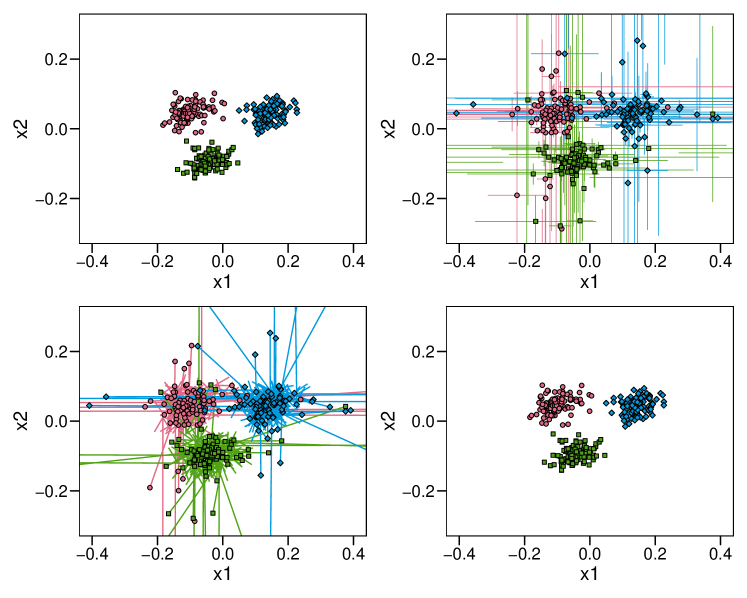
Where gives the principal components, and the columns of the corresponding coefficients of the linear combination of the original variables. In the case of a nosy matrix with respective measurement errors , there is an iterative solution described in Wentzell & Lohnes (1999); Wentzell & Hou (2012). yonder implements the case of independent and identically distributed heteroscedastic errors. To illustrate how yonder works, we simulate a noise model similar to Wentzell & Hou (2012), with errors-in-measurements sampled from a log-normal distribution. Figure 1 illustrates the workflow. The mock data consists of m = 20 columns, n = 300 rows, and three distinct groups with 100 members each. The top left panel shows the error-free data: the top right panel the noisy data and respective error bars. yonder uses as input the noisy matrix and the associated error matrix and approximates the position of the unobserved denoised data. The presence of errors blurs the discrimination of the groups, which is recovered after running yonder. The method will be more beneficial for cases of highly correlated data for which a low-rank approximation is guaranteed, for example, in multi-band photometric surveys.
The code takes an input matrix , and respective error matrix , and outputs the SVD of the latent denoised matrix .
This work showcases that accounting for uncertainties can further benefit machine learning algorithms by correcting the data projection and enhancing the distinguishability between groups. Possible applications include the use in multi-band surveys to find stellar clusters in color-color and colour-magnitude diagrams (Chies-Santos et al., 2022).
2.1 Installation and similar software
yonder is available as an open-source software package on GitHub111https://github.com/pengchzn/yonder and Zenodo222https://doi.org/10.5281/zenodo.6321520. The code can be installed via pip command333https://pypi.org/project/yonder/. Additionally to this python version, there is also a R implementation of the same algorithm available on CRAN444https://CRAN.R-project.org/package=RMLPCA.
References
- Bovy et al. (2011) Bovy, J., Hogg, D. W., & Roweis, S. T. 2011, Annals of Applied Statistics, 5, 1657, doi: 10.1214/10-AOAS439
- Chies-Santos et al. (2022) Chies-Santos, A. L., de Souza, R. S., Caso, J. P., et al. 2022, arXiv:2202.11472
- Harris et al. (2020) Harris, C. R., Millman, K. J., van der Walt, S. J., et al. 2020, Nature, 585, 357, doi: 10.1038/s41586-020-2649-2
- Kelly (2007) Kelly, B. C. 2007, ApJ, 665, 1489, doi: 10.1086/519947
- Reis et al. (2018) Reis, I., Baron, D., & Shahaf, S. 2018, The Astronomical Journal, 157, 16, doi: 10.3847/1538-3881/aaf101
- Virtanen et al. (2020) Virtanen, P., Gommers, R., Oliphant, T. E., et al. 2020, Nature Methods, 17, 261, doi: 10.1038/s41592-019-0686-2
- Wentzell & Hou (2012) Wentzell, P. D., & Hou, S. 2012, Journal of Chemometrics, 26, 264, doi: https://doi.org/10.1002/cem.2428
- Wentzell & Lohnes (1999) Wentzell, P. D., & Lohnes, M. T. 1999, Chemometrics and Intelligent Laboratory Systems, 45, 65, doi: https://doi.org/10.1016/S0169-7439(98)00090-2