Effect of AGN on the morphological properties of their host galaxies in the local Universe
Abstract
The morphological classification of active galaxies may be affected by the presence of active galactic nuclei (AGN). In this paper, we provide the most detailed analysis on how different AGN contributions, from 5% to 75%, to the total optical light may affect six commonly used morphological parameters and the final classification of AGN host galaxies at z 0. We used a local sample of 2000 visually classified non-active galaxies, to quantify how the contribution of a bright nuclear point source of different intensity could affect morphological parameters such as: asymmetry, Abraham concentration index, Gini, M20 moment of light, smoothness, and Concelice-Bershady concentration index. We found that most of the morphological parameters are affected by AGN contributions above 25%, with late-type galaxies being more affected than early-types. We found that Gini, Abraham concentration index and asymmetry are the most stable parameters even for AGN contributions above 25%, in comparison to Concelice-Bershady concentration index and M20 moment of light. Smoothness parameter shall be avoided when classifying AGN host galaxies, or at least it shall be used simultaneously in combination with several other parameters.
keywords:
Galaxies; active galactic nuclei; morphological parameters; morphological classification.1 Introduction
Morphology is a key parameter used to study the properties of galaxies hosting Active Galactic Nuclei (AGN), their connection with AGN, and their formation and evolution (e.g., Kauffmann et al., 2003; Pierce et al., 2010; Pović et al., 2012; Leslie et al., 2016; Dubois et al., 2016; Gu et al., 2018). Morphology is one of the fundamental parameters for understanding some of the open questions related to the effect of AGN on their host galaxy and vice-versa, the origin of accretion material, the triggering mechanisms that initiate an active phase in a galaxy, the duration of nuclear active phase, etc. Therefore, the study of the morphology of active galaxies can place important constraints on models of supermassive black hole (SMBH) formation and growth, as well as on the formation and evolution of galaxies across the cosmic time (e.g., Mahmood et al., 2005; Dubois et al., 2016; Fontanot et al., 2020; Setoguchi et al., 2021). It has been suggested that AGN may play an important role in the morphological transformation of galaxies from late- to early-types, being responsible for quenching (e.g., Nandra et al., 2007; Pović et al., 2012; Leslie et al., 2016; Dubois et al., 2016; Fontanot et al., 2020), but also enhancing (e.g., Mahoro et al., 2017, 2019) star formation. The dependence of the environment on AGN host galaxies in combination with morphology has been extensively studied to better understand the AGN triggering mechanisms. It has been suggested that minor and major mergers do not (e.g., Sharma et al., 2021; Silva et al., 2021, and references therein) and do (e.g., Cisternas et al., 2011; Ellison et al., 2019; Kim et al., 2020; Gao et al., 2020) contribute significantly to the nuclear activity in galaxies. In particular, the interpretation of morphology in terms of galaxy evolution still remains a problem. Since the determination of the morphology depends strongly on image resolution, morphological classification in deep surveys remains difficult, especially when dealing with faint and high redshift sources (Pović et al., 2015).
Different methods have been used to classify galaxies in terms of their morphology. These include visual classification (e.g., Hubble, 1926; de Vaucouleurs, 1959; Sandage, 1961; Buta, 2013; Lintott et al., 2008; Nair & Abraham, 2010; Simmons et al., 2017; Willett et al., 2017; ywucka et al., 2020) and parametric methods that assume an analytic model for fitting galaxy surface brightness based on its physical and mathematical parameters (e.g., Peng, 2010; Simard et al., 2011; , 2012; Jiménez-Teja et al., 2012). Non-parametric methods have been also commonly used, by measuring different galaxy properties that correlate with morphological types, such as colour, light distribution, galaxy shape, etc. (e.g., Abraham et al., 1994, 1996; Conselice et al., 2000, 2003; Huertas-Company et al., 2008; Tasca et al., 2009; Pović et al., 2013; Mahoro et al., 2019), being very often mixed with the machine and deep learning for giving galaxy a probability to be early- or late-type (e.g., Huertas-Company et al., 2008; Pović et al., 2012, 2013, 2015; Pintos-Castro et al., 2016; , 2019), and/or purely based machine and deep learning methods (e.g., Kuminski et al., 2014; Huertas-Company et al., 2015; Aniyan et al., 2017; Domínguez et al., 2018; Lukic et al., 2018; de Diego et al., 2020). Each method has its advantages and disadvantages. Visual and parametric methods are more used for nearby and well-resolved galaxies, providing a more detailed information about galaxy structure, while non-parametric and machine/deep learning methods are less time-consuming and showed to be useful when dealing with large datasets, and higher redshift sources.
There are still many inconsistencies between the results obtained regarding the morphology of active galaxies (e.g., Kauffmann et al., 2003; Pierce et al., 2007; Georgakakis et al., 2008; Choi et al., 2009; Gabor et al., 2009; Pović et al., 2009, 2012; Mahoro et al., 2019; Ramón-Pérez et al., 2019), and how AGN may affect the morphological classification of their host galaxies (e.g., Gabor et al., 2009; Cardamone et al., 2010; Pierce et al., 2010). Many previous studies found that AGN host galaxies usually reside in spheroids or bulge-dominated galaxies (e.g, Kauffmann et al., 2003; Pierce et al., 2007, 2010; Pović et al., 2009, 2012; Dubois et al., 2016), although some studies find a higher concentration of later-types (e.g., Choi et al., 2009; Gabor et al., 2009; Mahoro et al., 2019). It has been also shown that morphological properties of AGN host galaxies depend on the type of detection, where most radio detected AGN are hosted by red sequence galaxies (e.g., Hickox et al., 2009), X-ray detected AGN hosts occupy all areas of the colour-magnitude diagram, but mostly green valley (e.g., Nandra et al., 2007; Georgakakis et al., 2008; Hickox et al., 2009; Pović et al., 2009, 2012), while many of the infrared detected AGN hosts reside in slightly bluer galaxies and occupy mainly the blue cloud region with a significant fraction of peculiar galaxies, with clear signs of interactions and mergers (e.g., Hickox et al., 2009; García-Bernete et al., 2015; Mahoro et al., 2019). Although several works commented how the AGN contribution may affect the morphological classification of their host galaxies, finding insignificant contributions in most cases (e.g., Gabor et al., 2009; Cardamone et al., 2010; Pierce et al., 2010; Trump et al., 2015; Wang et al., 2017), we are still lacking detailed analysis of how different morphological parameters, commonly used in galaxy classification, are affected by the AGN contribution and therefore how the final classification of galaxies will be affected.
In this work, we go a step further and study how different AGN contributions may affect the six morphological parameters that are commonly used in non-parametric methods for galaxy classification. We carried out all the analysis by using a sample of a number of local, non-active galaxies with known visual morphological classification (Nair & Abraham, 2010). In this paper, we present the results obtained for the original sample at z 0. The simulations at fainter magnitudes and higher redshifts will be presented in a forthcoming paper (Getachew et al., in prep.).
The paper is organized as follows: in section 2 we describe the used data, along with a brief description of the generated source catalogue. The applied methodology is described in section 3, while all analysis are given in section 4. Section 5 gives the results and discussion of our work, and finally, we draw our conclusions in section 6. We assumed cosmological model with =0.7, , and = 70 kms-1Mpc-1. All magnitudes in this paper are given in the system (Oke, 2015).
2 Data
To study the effect of the AGN contribution on the morphological parameters of their host galaxies in the local Universe, we used an initial sample of 8000 local galaxies visually classified in the g-band by Nair & Abraham (2010). The authors used the data from the Sloan Digital Sky Survey111https://www.sdss.org/ (SDSS; York et al. 2000, Stoughton et al. 2002) Data Release 4 (DR4) down to an extinction-corrected apparent magnitude of and in the redshift range of (with a mean redshift of ). The galaxies were selected randomly out of sources contained in the Nair & Abraham (2010) catalogue, as explained in detail in Pović et al. (2013). To make sure that the selected sub-sample of local galaxies is a fair representation of the parent sample, we compared the two samples in terms of their general properties. In Fig. 1 we show the distributions for both samples for the absolute magnitude in g-band, morphology, star formation rate (SFR), and stellar mass, where the last two parameters have been obtained from the MPA-JHU222https://wwwmpa.mpa-garching.mpg.de/SDSS/ SDSS catalogue (Brinchmann et al., 2004; Salim et al., 2007). The Kolmogorov-Smirnov (KS) test for all comparison plots indicates that the maximum deviation (D) between the two distributions is 0, indicating that the two samples are consistent.
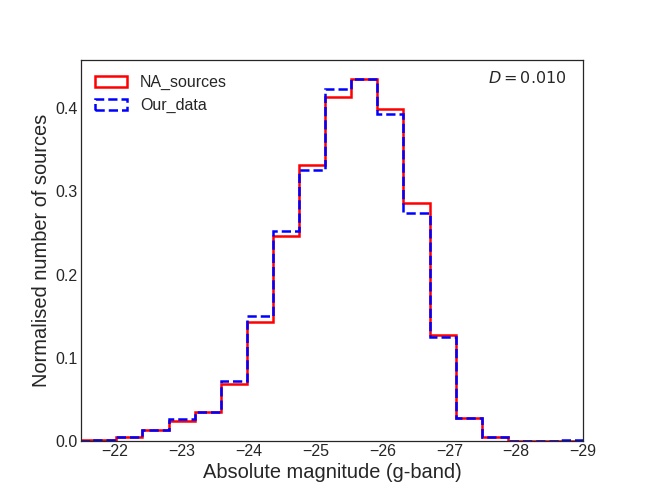
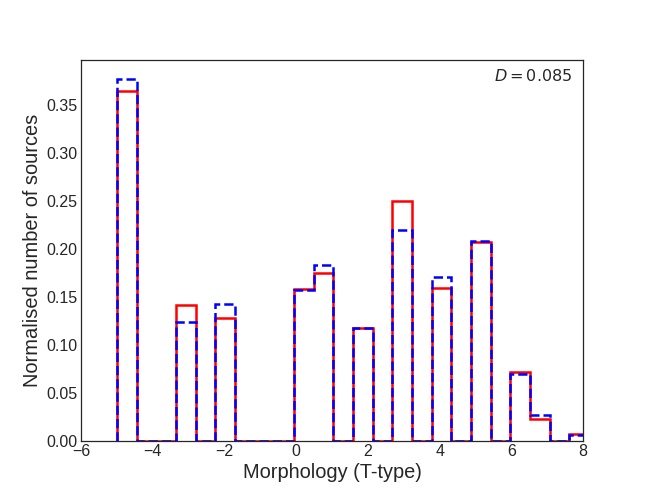
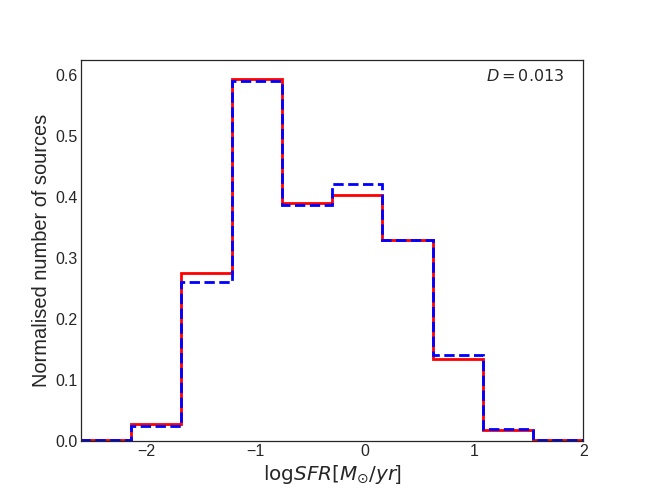

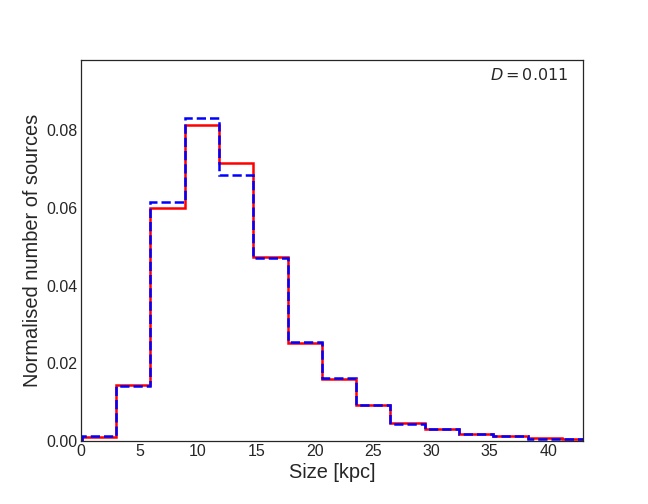
.
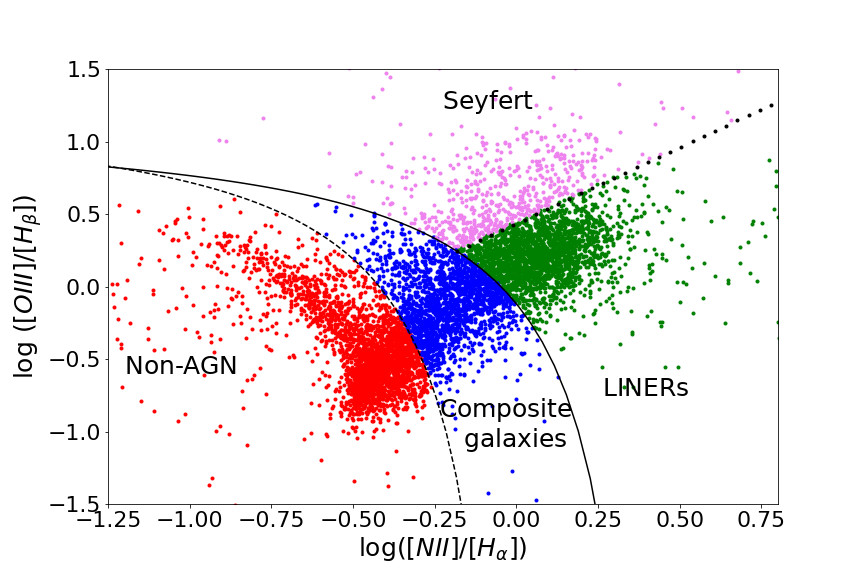
Taking into account the nature of this work, we need a sample of non-active galaxies for our analysis. To eliminate AGN hosts, we cross-matched our sample of 8000 galaxies with the MPA-JHU SDSS DR7 emission-line catalogue of 920000 sources, using a cross-matching radius of 2 arcsec. We obtained a total of 7940 counterparts with available redshifts and emission lines with signal-to-noise ratio S/N 3. For these galaxies, we plotted the Baldwin, Phillips & Terlevich (1981) BPT-NII diagram as shown in Fig. 2, using the emission-line ratios of and . To separate star-forming (non-AGN) galaxies from composite and AGN galaxies we used the separation limits given by Kauffmann et al. (2003) and Kewley et al. (2006). We also checked the number of Seyfert 2 and LINER sources using the separation limit of Schawinski et al. (2007). We found in total 2744 (35%) star-forming galaxies, 1918 (24%) composites, 594 (7%) Seyfert 2s, and 2684 (34%) LINERs.
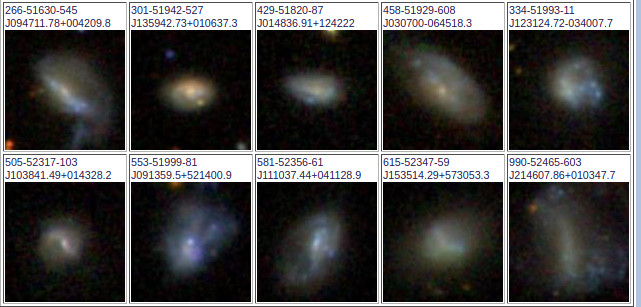
After selecting these 2744 non-AGN galaxies, we went through the visual inspection of their images and we further removed those galaxies with superposed foreground bright stars, and also galaxies with signs of interactions and mergers. Our final sample of non-active galaxies contains 2301 sources. Using the visual morphological classification of Nair & Abraham (2010) and their T-type classification scheme (see their Table 1), we have 471 early-type galaxies (elliptical and lenticular, with T-type 0), 891 early-spirals (0 T-type 4), 889 late-spirals (4 T-type 8), and 50 irregular and peculiar galaxies (T-type 8). We inspected visually the images of those galaxies with T-type 8 and found that the majority () of them are not irregular galaxies, but rather disturbed galaxies with clear signs of interactions, and therefore along this paper we will call these galaxies peculiar. An example of 10 galaxies included under this class is given in Fig. 3.
3 Methodology
In this section, we analysed six of the most used parameters in the non-parametric morphological classification of galaxies, and how sensitive they are on AGN contribution when dealing with the classification of active galaxies. We measured the six parameters for the sample of 2744 non-AGN galaxies. We then artificially added in their center different AGN contributions (from 5% - 75%), and we again measured the same parameters in a consistent way.
3.1 Morphological parameters of the local sample of non-active galaxies
The six morphological parameters analysed in this work have been used in
many previous studies to distinguish between early- (elliptical and
lenticular) and late-type (spiral and irregular) galaxies
(e.g., Scarlata et al., 2007; Huertas-Company et al., 2008, 2009; Pović et al., 2012, 2013, 2015; Licitra et al., 2016; Pintos-Castro et al., 2016; Tarsitano et al., 2018; , 2019; Mahoro et al., 2019; Baes et al., 2020; Bignone et al., 2020). These six parameters are:
Asymmetry index (hereafter ASYM; Abraham et al. 1994). This parameter describes the level of asymmetry in the shape of one galaxy. It is calculated by comparing an object flux in every pixel using an original image and the rotated one by , and taking into account the background. It can be expressed as:
| (1) |
where I and I are the fluxes in the pixel
position on the original and rotated image, while B and
B are the fluxes of the background in the original and
rotated image, respectively. Highly symmetrical sources, such as
undisturbed elliptical or lenticular galaxies, will have minimal
residuals and small values of ASYM, while the significant residuals of
spiral, irregular, and peculiar galaxies will correspond to higher
values of ASYM. In general, the allowed range of this parameter is
0 ASYM 1.
Abraham concentration index (hereafter CABR; Abraham et al. 1996). This is one of the most used light concentration parameters. It is measured as the ratio between the flux at 30% of the Petrosian radius (Petrosian, 1976) and the total flux of the galaxy:
| (2) |
The typical range of values of this parameter is , where galaxies with higher light concentration in their centers have higher values of CABR.
Gini coefficient (hereafter GINI; Abraham et al. 2003; Lotz et al. 2004). This parameter has been adopted from the economic statistics (Gini, 1912) and is now used in astronomy to describe the distribution of light among the pixels associated with a galaxy. If is the number of pixels assigned to a galaxy, the flux from pixel (ordered in such a way that increases with the pixel index), and the mean values of the pixel, GINI parameter can be defined as:
| (3) |
The values of GINI cover the range , where low values
characterise an equal distribution of light across all galaxy pixels,
while high values point to extreme inequality in light distribution
contained within a small number of pixels (e.g., in a single bright
nucleus of a galaxy or a galaxy with multiple bright nuclei). This
parameter has been suggested to be the efficient one for morphological
measurements of strongly lensed galaxies (Florian et al., 2016a).
M20 moment of light (hereafter M20; Lotz et al. 2004). The value of this parameter depends on the spatial distribution of the light in a galaxy relative to its center, summed over the 20% brightest pixels and normalised by the total second-order moment of light (Mtot):
| (4) |
while the flux in each pixel in comparison to the total flux
is ,
and where
| (5) |
with standing for the galaxy center obtained by
minimising the total light (Huertas-Company et al., 2008). This parameter in
general has values in the range . It is very sensitive to the
spatial distribution of light. For undisturbed early-type
galaxies when the brightest 20% of the light may easily be positioned
close to the galactic center, M20 approaches values of -2.5 or -3.0. On
the other hand, the presence of multiple bright sources of light that
are spatially separated from the galaxy center (e.g., bars, spiral arms,
strong star-forming regions, etc.) increase the value of M20 toward 0
(Conselice et al., 2014).
Smoothness or clumpiness (hereafter SMOOTH; Conselice et al. 2000). This parameter is sensitive to the small-scale structures in galaxies. To measure it, the original galaxy image is smoothed with a boxcar of a given width and subtracted from the original image. SMOOTH is then obtained as:
| (6) |
where , are the flux of the galaxy and background,
respectively, in the pixel position of the original image,
while and represent the same in the case of
the smoothed image. This parameter has values , where higher
values indicate a larger number of small-scale structures in a galaxy.
Conselice-Bershady concentration index (hereafter CCON; Bershady et al. 2000). Similar to CABR and GINI, this parameter gives the level of light concentration within a galaxy. It is measured as the logarithm of the ratio of the circular radii containing 80% and 20% of the total flux:
| (7) |
In general, lower CCON values correspond to lower fractions of light in the central region.
We have written an in-house IDL code for measuring all of the six described parameters of the selected sample of the non-AGN galaxies. To obtain all needed input parameters we first run SExtractor (Bertin & Arnouts, 1996) using the SDSS g-band images. When necessary, the galaxy centre is determined by minimizing ASYM (Abraham et al., 1996), while the total flux is defined as the one contained within 1.5 times the Petrosian radius (Huertas-Company et al., 2008) as measured by SExtractor.
3.2 Morphological parameters of the local sample with added AGN contributions
For analysing how the presence of an AGN may affect the different morphological parameters and hence the final morphological classification of active galaxies, we used the selected sample of star-forming (non-AGN) galaxies and simulated AGN hosts by adding in their centers different AGN contributions. For simulating the AGN contribution, for each galaxy we used its corresponding point spread function (PSF) image in the g-band obtained from the SDSS database (see Pović et al., 2013, for more details). To model the PSF we used the Moffat function (Moffat, 1969), which showed to be its good analytical approximation (e.g., Molina et al., 1992; Trujillo et al., 2001). For each galaxy we constructed five simulated images using different fractions of AGN contribution to the total galaxy flux: 5%, 10%, 25%, 50%, and 75%. The total galaxy flux was measured by running SExtractor code on the g-band images. Once we obtained simulated images of galaxies with the different AGN contributions added we repeated the steps from Sec. 3.1. We first run SExtractor on all simulated images to obtain the different input parameters needed for measuring the morphological parameters. Secondly, for each AGN contribution of 5% - 75% we measured the six morphological parameters following the procedure in Sec. 3.1.
| Object ID | RA | DEC | % | % | Total-flux | Morphology | PSF % | PSF % | PSF Total-flux |
| (deg) | (deg) | (pix) | (pix) | (counts) | (pix) | (pix) | (counts) | ||
| 535-51999-573 | 218.32646 | 2.7014122 | 5.69 | 14.30 | 387.95 | early-type | 1.73 | 3.88 | 347.51 |
| 420-51871-506 | 13.712063 | 15.278116 | 12.51 | 26.31 | 407.49 | early-spiral | 1.74 | 3.76 | 357.42 |
| 476-52314-66 | 144.95767 | -0.56153035 | 17.74 | 27.96 | 362.99 | late-spiral | 1.71 | 3.90 | 326.41 |
| 615-52347-59 | 233.80957 | 57.514824 | 11.90 | 26.03 | 382.77 | peculiar | 1.95 | 4.13 | 432.98 |
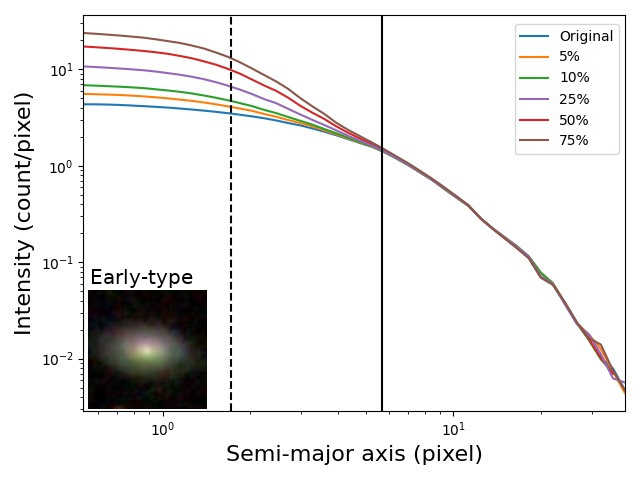
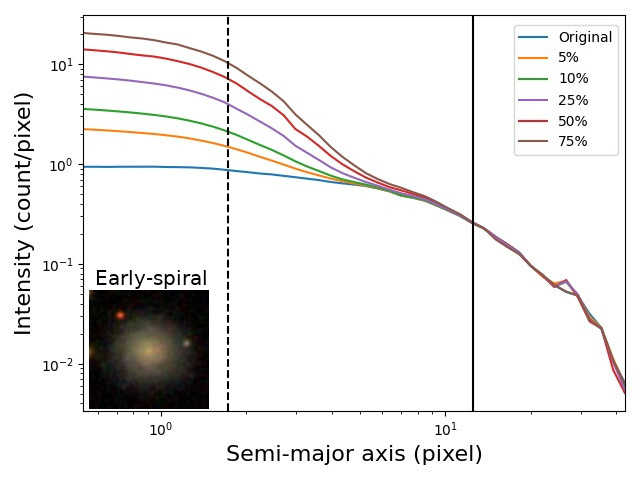
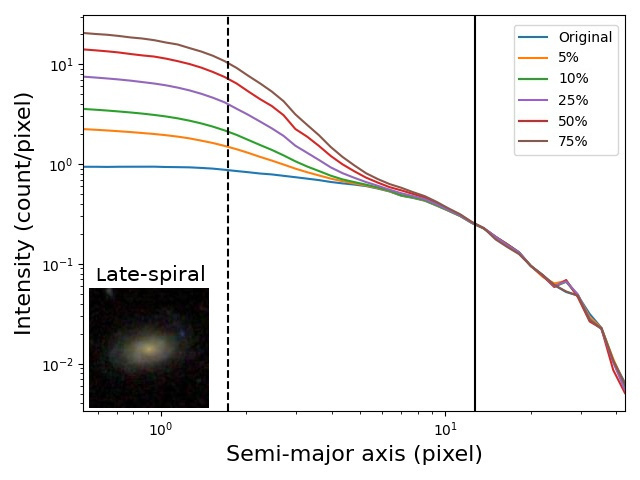
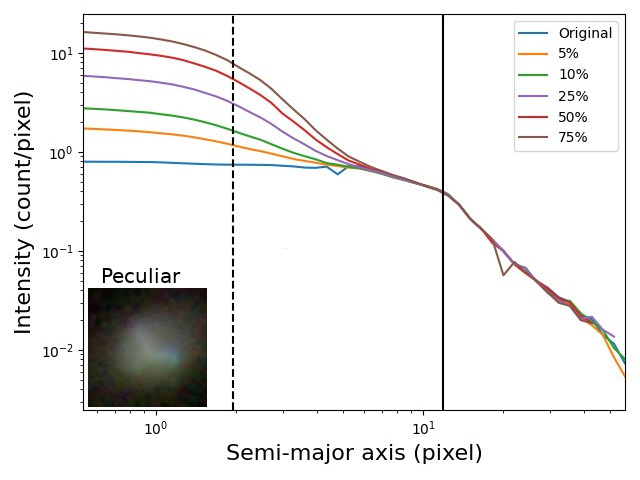
Figure 4 shows the surface brightness profiles using the original image (blue line) and the simulated images with 5% to 75% of AGN contribution, in the case of an early-type galaxy (top left), an early-spiral (top right), a late-spiral (bottom left), and a peculiar galaxy (bottom right). The two vertical lines in each plot correspond to the Petrosian half-light radius (R50%) of the PSF (dashed line) and galaxy (solid line). The size of each galaxy at 50% and 90%, its total flux and corresponding PSF values are given in Table 1 as an example.
Finally, as a result of the work described in Sec. 3.1 and here, for each galaxy and each morphological parameter we obtained six measurements: the real one using original images, and simulated ones when having 5% to 75% of AGN contribution in comparison to the total galaxy flux.
4 Analysis and results
In this section, we measure the effect of the AGN contribution on the morphological parameters when considering the total sample of selected galaxies and when taking into account their morphological type. We also test the effect of the AGN on some of the most used morphological diagrams when dealing with the classification of galaxies.
4.1 Effect of the AGN on the morphological parameters of the total sample
Using the total sample of the 2301 selected sources described in Sec. 2, we analysed in detail the effect of AGN on the six morphological parameters described in Sec. 3.1. For each parameter obtained using original and simulated images (with 5 different added AGN contributions), we measured their median values, first quarter (Q1333Q1 corresponds to 25% of sample.), and third quarter (Q3444Q3 corresponds to 75% of sample.), where the range Q1-Q3 corresponds to 50% of the sample. We used the median values of samples plus the change in the [Q1-Q3] range as indicators of the change (or scatter) in samples with AGN contribution.
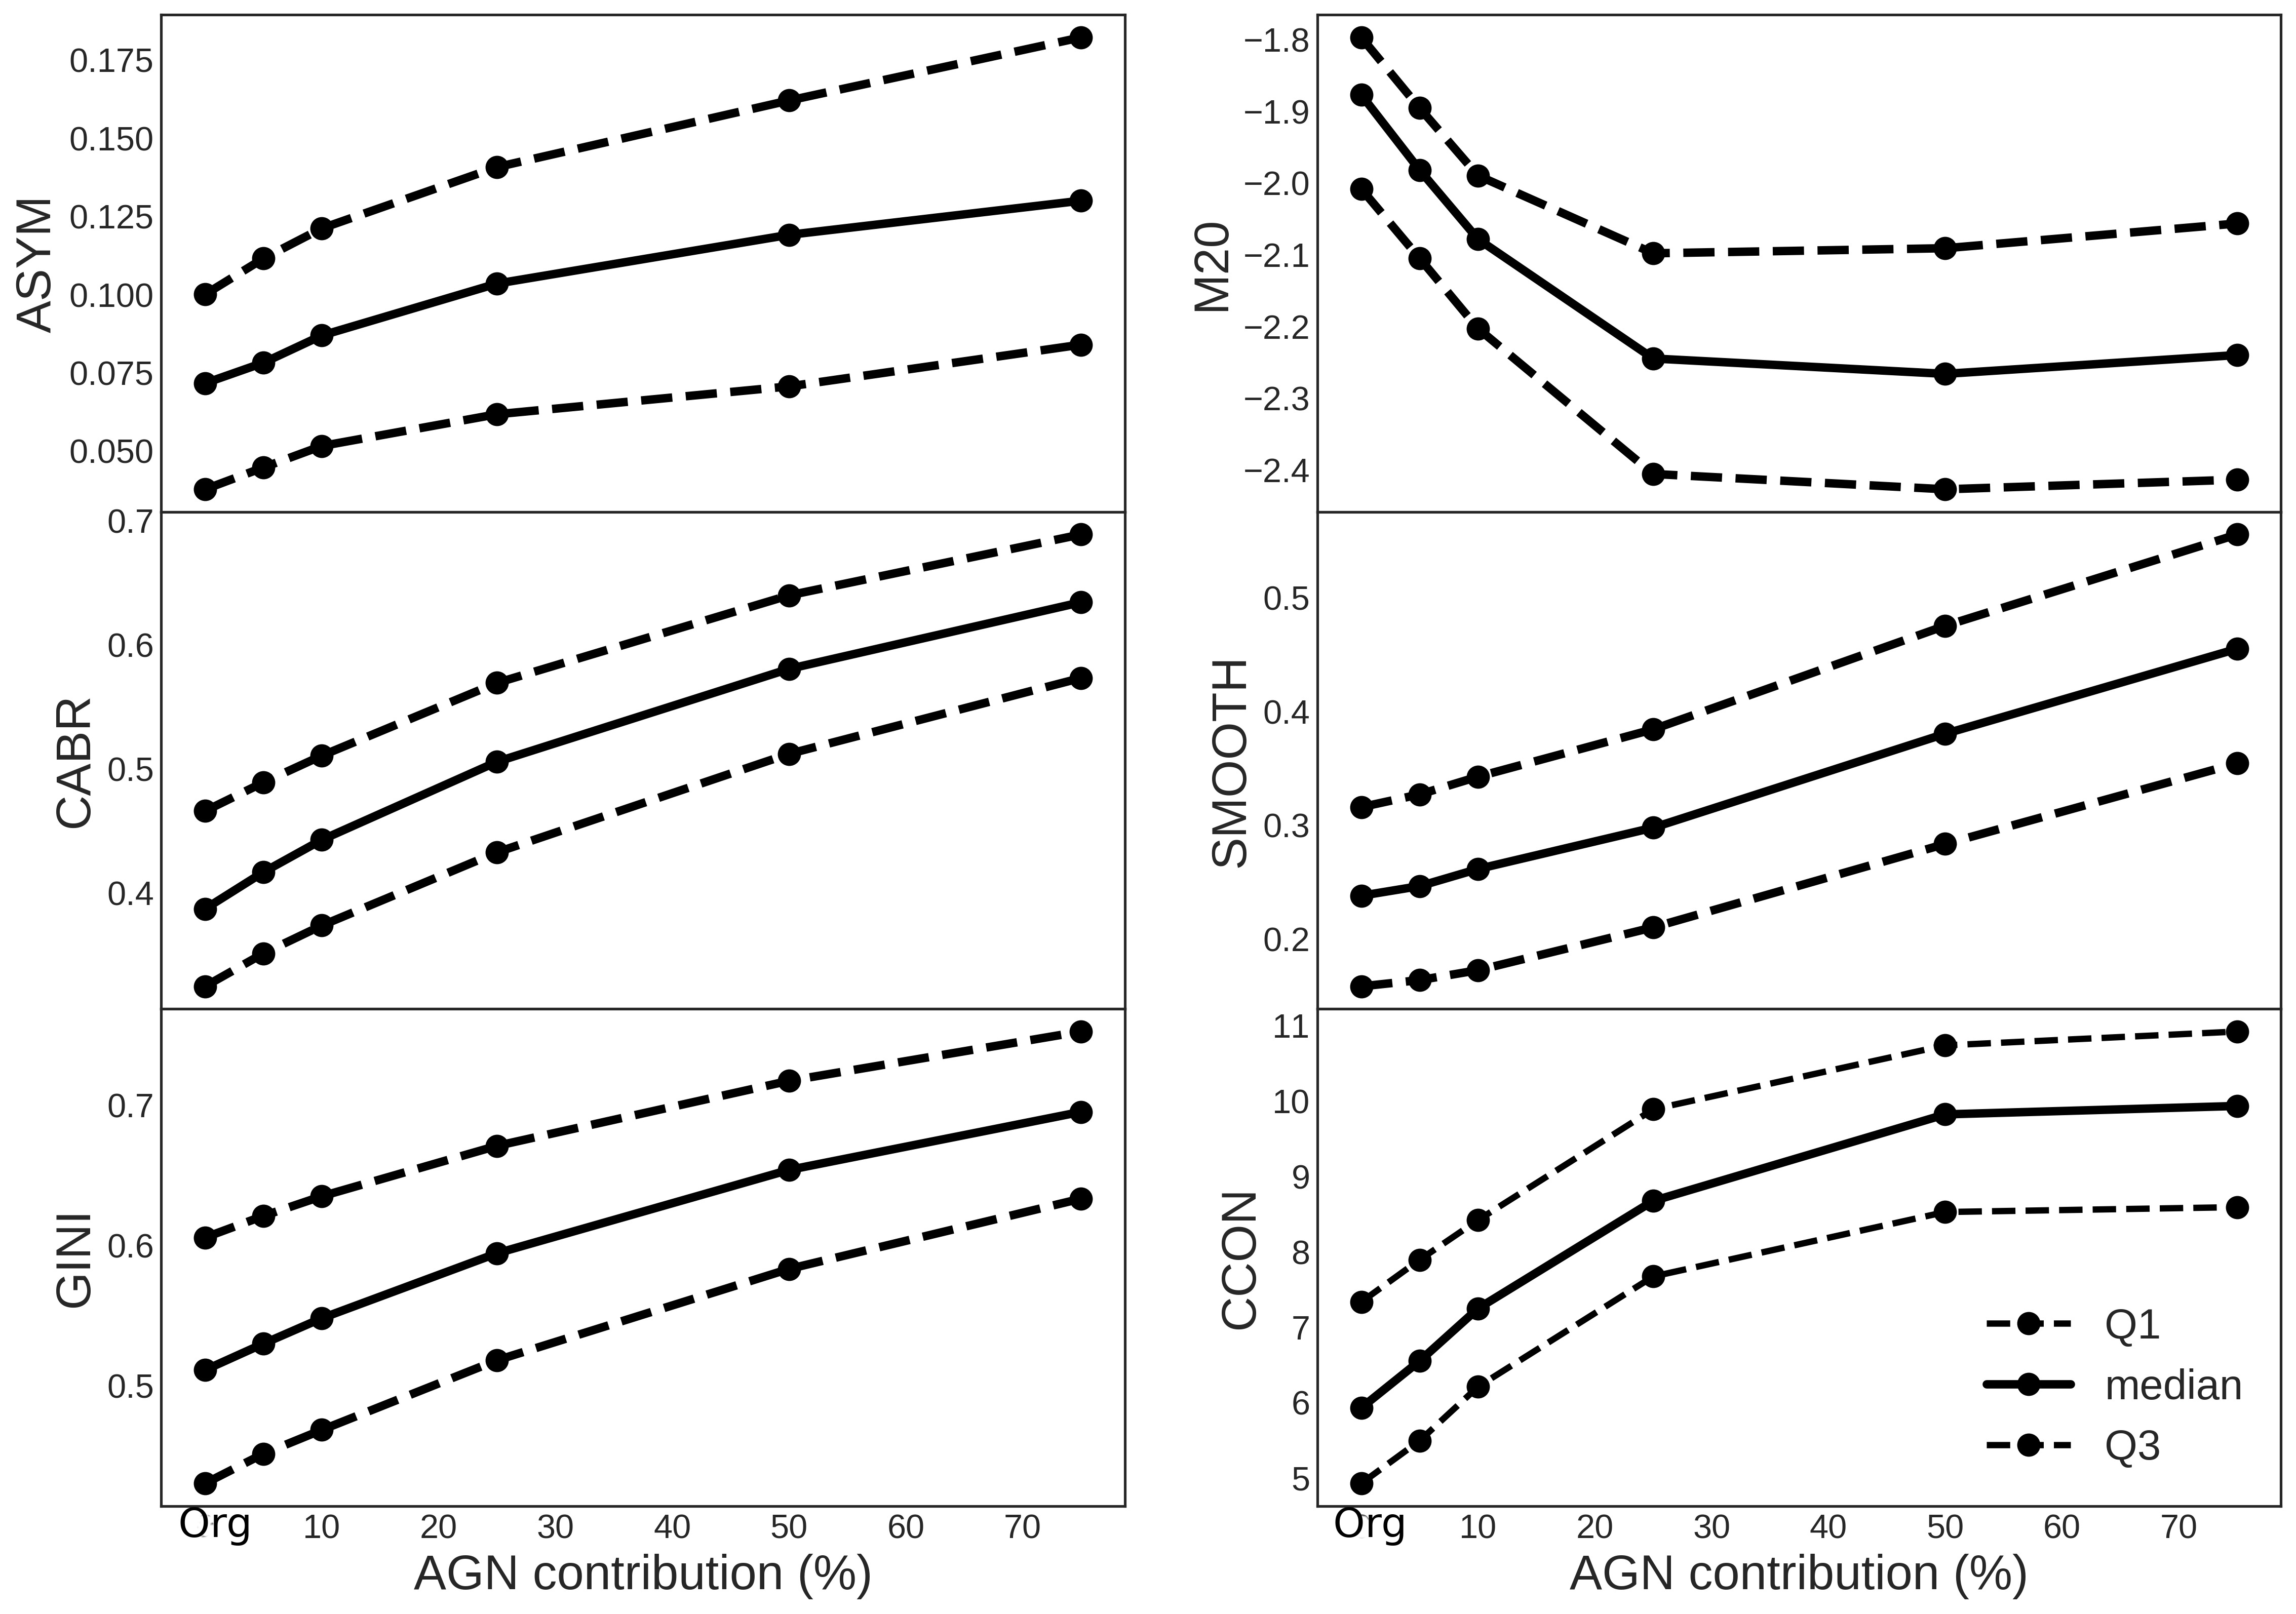
Figure 5 shows the effect of the AGN contribution on the six morphological parameters used in this work: ASYM (top left), CABR (middle left), GINI (bottom left), M20 (top right), SMOOTH (middle right), and CCON (bottom right). We represent how the median values of these parameters (solid lines) change from the values measured on the original images (without AGN being added, indicated in Fig. 5 as "Org") when 5%, 10%, 25%, 50% and 75% of AGN contribution is added. We also represent the corresponding Q1 and Q3 measurements (dashed lines), that can be considered as an indicator of the error.
Most of the parameters change with the added AGN contribution in comparison to real values, with gradually larger differences being observed as the AGN contribution to the total flux increases. In Table 2, the effect of the AGN has been measured using the median values of each parameter and each sample (total and for different morphological types), measured on original images (param_orig) and after adding different AGN contributions (param_AGN), such as: (param_AGN - param_orig)/param_orig. A total number of sources with measured parameters under each sample is also listed in the table. CCON is one of the most sensitive parameters to AGN contribution, facing 22% and 46% of change (toward higher values) in case of 10% and 25% of added AGN contribution, respectively. On the other side, ASYM is one of the parameters that almost doesn’t change independently on AGN contribution. As can be seen in Fig. 5 it takes median values between 0 and 0.13, and therefore we are not listing any values for this parameter in Table 2. This parameter has been measured for 72%, 91%, 71%, 61%, and 66% of the total sample, early-type, early-spiral, late-spiral, and peculiar galaxies, respectively. After ASYM, GINI is the least affected parameter changing only 8%, 16%, 27%, and 37% for 10% 25%, 50%, and 75% of AGN contribution, respectively. Up to 10% of AGN, CABR and M20 show 10-15% of change. Similar to CABR and M20, SMOOTH is also showing a low level of contamination below 25% of AGN contribution, however, this parameter is very sensitive to noise, as shown previously (e.g., Huertas-Company et al., 2008; Pović et al., 2013, 2015), and it could be measured properly for a very small sub-sample (44%) of the total number of galaxies (see Table 2). In general, we can observe that AGN contribution to the total flux of 25% and above produce significant changes in the parameters of 30% (or 20% in the case of GINI and M20), except in the case of ASYM.
| Measured parameter | Number of sources | 5% | 10% | 25% | 50% | 75% |
| (sample) | AGN | AGN | AGN | AGN | AGN | |
| CABR (total sample) | 2292 (100%) | 8% 2% | 13% 2% | 31% 5% | 49% 7% | 60% 8% |
| CABR (early-type) | 470 (100%) | 4% 1% | 7% 1% | 18% 2% | 27% 3% | 35% 4% |
| CABR (early-spiral) | 887 (100%) | 7% 1% | 13% 2% | 30% 3% | 49% 6% | 66% 9% |
| CABR (late-spiral) | 885 (100%) | 9% 2% | 18% 3% | 35% 2% | 55% 6% | 73% 9% |
| CABR (peculiar) | 50 (100%) | 3% 2% | 8% 2% | 24% 3% | 42% 10% | 58% 13% |
| GINI (total sample) | 2294 (100%) | 4% 1% | 8% 2% | 16% 5% | 27% 9% | 37% 12% |
| GINI (early-type) | 470 (100%) | 3% 1% | 5% 1% | 11% 3% | 20% 4% | 25% 5% |
| GINI (early-spiral) | 888 (100%) | 4% 1% | 8% 2% | 16% 5% | 27% 9% | 37% 11% |
| GINI (late-spiral) | 886 (100%) | 5% 2% | 9% 2% | 18% 4% | 33% 7% | 42% 9% |
| GINI (peculiar) | 50 (100%) | 2% 1% | 6% 2% | 12% 2% | 20% 3% | 30% 4% |
| M20 (total sample) | 2185 (95%) | 6% 1% | 11% 1% | 20% 2% | 21% 3% | 19% 3% |
| M20 (early-type) | 447 (96%) | 2% 1% | 4% 1% | 6% 1% | 4% 1% | 2% 2% |
| M20 (early-spiral) | 846 (95%) | 5% 2% | 11% 2% | 19% 2% | 21% 2% | 20% 2% |
| M20 (late-spiral) | 836 (94%) | 14% 2% | 27% 4% | 44% 7% | 47% 5% | 46% 5% |
| M20 (peculiar) | 48 (96%) | 3% 1% | 7% 1% | 19% 3% | 18% 2% | 17% 4% |
| SMOOTH (total sample) | 1023 (44%) | 4% 1% | 8% 1% | 29% 7% | 58% 15% | 87% 24% |
| SMOOTH (early-type) | 352 (75%) | 6% 5% | 16% 6% | 32% 15% | 64% 29% | 84% 33% |
| SMOOTH (early-spiral) | 347 (39%) | 6% 4% | 12% 4% | 24% 6% | 58% 5% | 87% 13% |
| SMOOTH (late-spiral) | 291 (33%) | 3% 2% | 9% 3% | 26% 2% | 78% 8% | 113% 9% |
| SMOOTH (peculiar) | 30 (60%) | 8% 4% | 13% 4% | 30% 5% | 65% 8% | 113% 29% |
| CCON (total sample) | 2186 (95%) | 10% 2% | 22% 6% | 46% 11% | 66% 14% | 67% 13% |
| CCON (early-type) | 457 (97%) | 5% 1% | 9% 1% | 17% 2% | 18% 2% | 18% 1% |
| CCON (early-spiral) | 855 (96%) | 10% 1% | 22% 3% | 53% 6% | 72% 7% | 73% 6% |
| CCON (late-spiral) | 836 (94%) | 11% 3% | 23% 3% | 50% 5% | 76% 8% | 78% 9% |
| CCON (peculiar) | 49 (98%) | 10% 3% | 19% 4% | 35% 5% | 51% 5% | 68% 8% |
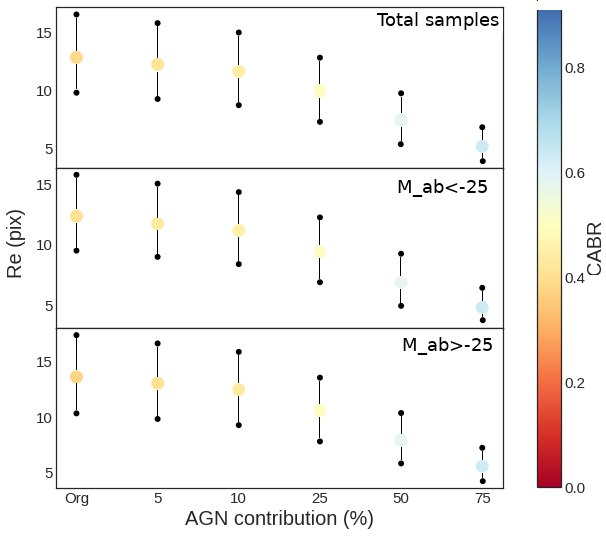
In addition to the impact of AGN on measured morphological parameters, we also checked the effect of AGN in relation to the galaxy size. In Fig. 6, we showed the median effective radius measured on original and simulated (with 5-75% of AGN) images for a total sample (top panel) and for two different ranges of absolute magnitude (g-band Mab -25 (middle panel) and Mab -25 (bottom panel)). Just as an example, we showed also the relative change of CABR parameter. We can observe that in all three cases for a total sample and the two samples with different g-band absolute magnitude, the effective radius starts to be more affected when AGN contribution is above 25%, indicating that smaller galaxies will be more affected. In all three cases, independently on brightness, the change in the effective radius is 10% up to 10% of AGN contribution and becomes of the order of 20%, 40%, and 60% for larger AGN contributions of 25%, 50%, and 75%. The median values of the effective radius obtained when adding 50% and 75% of AGN, correspond to only 7% and 1% of sources in the original sample, respectively. We also checked the effect of AGN on the Petrosian radius, finding insignificant effect of 4% up to 25% of AGN contribution, increasing to 13% and 28% of change for 50% and 75% of AGN contribution, respectively. Finally, we also checked the effect of size on morphological parameters without having an AGN. In general, we do not observe any significant effect of size on ASYM, SMOOTH, M20 (except a small effect of 20% for ET galaxies), and CCON parameters. A slight change in CABR with size has been observed for a total sample, where more compact galaxies (with CABR 0.5) have 25% smaller sizes in comparison to less compact galaxies (CABR 0.2 - 0.3). This effect is a bit stronger in the case of the GINI parameter, where more compact galaxies with GINI 0.7 have 40% smaller sizes in comparison to less compact galaxies (GINI 0.35).
4.2 Effect of AGN on the studied parameters for the different morphologies
In this section, we present a similar analysis as above, but now taking into account morphology. We use the four broad morphological classes as described in Sec. 2.
Figures 7 to 10 show how the values of the six morphological parameters change when including an AGN contribution from 0% to 75% of early-type, early-spiral, late-spiral, and peculiar galaxies, respectively. Table 2 provides the quantification of the change in these parameters for each morphological type depending on the AGN contribution.


Table 2 shows that the change in all morphological
parameters with the AGN contribution is different for different
morphological types. In general, when dealing with early-type
galaxies, light concentration parameters such as CABR, GINI, M20, and
CCON are less affected by the AGN contribution than in the case of
late-type galaxies (both early- and late-spirals and peculiar), while SMOOTH is more
sensitive to the AGN contribution when measured for early-type galaxies
than for late-types. Similar as in the case of the total sample, ASYM parameter doesn’t change much with AGN contribution, independently on morphology. Besides ASYM, GINI is the most stable parameter to be
used when dealing with morphologies of active galaxies, independently
on the morphological type. In addition to this, M20, CABR, and CCON are
also quite stable for active early-type galaxies for AGN
contributions up to 25%. In general, the morphological parameters
of late-type galaxies, in particular late-spirals and peculiar,
are more affected by the AGN, especially for AGN contribution
of 25% and above.
Finally, to show the behaviour of the
different morphological types in relation to AGN contribution, all median values are plotted in
Fig. 11.
It can be seen the distribution of early-type, early-spiral,
late-spiral, and peculiar galaxies showed previously in
Figs. 7 to 10. This figure can help us to
put constraints on each of the parameters regarding their use in
morphological classification of active galaxies, that will be
discussed in more detail in Sec. 5.

4.3 Effect of the AGN contribution on the morphological diagrams
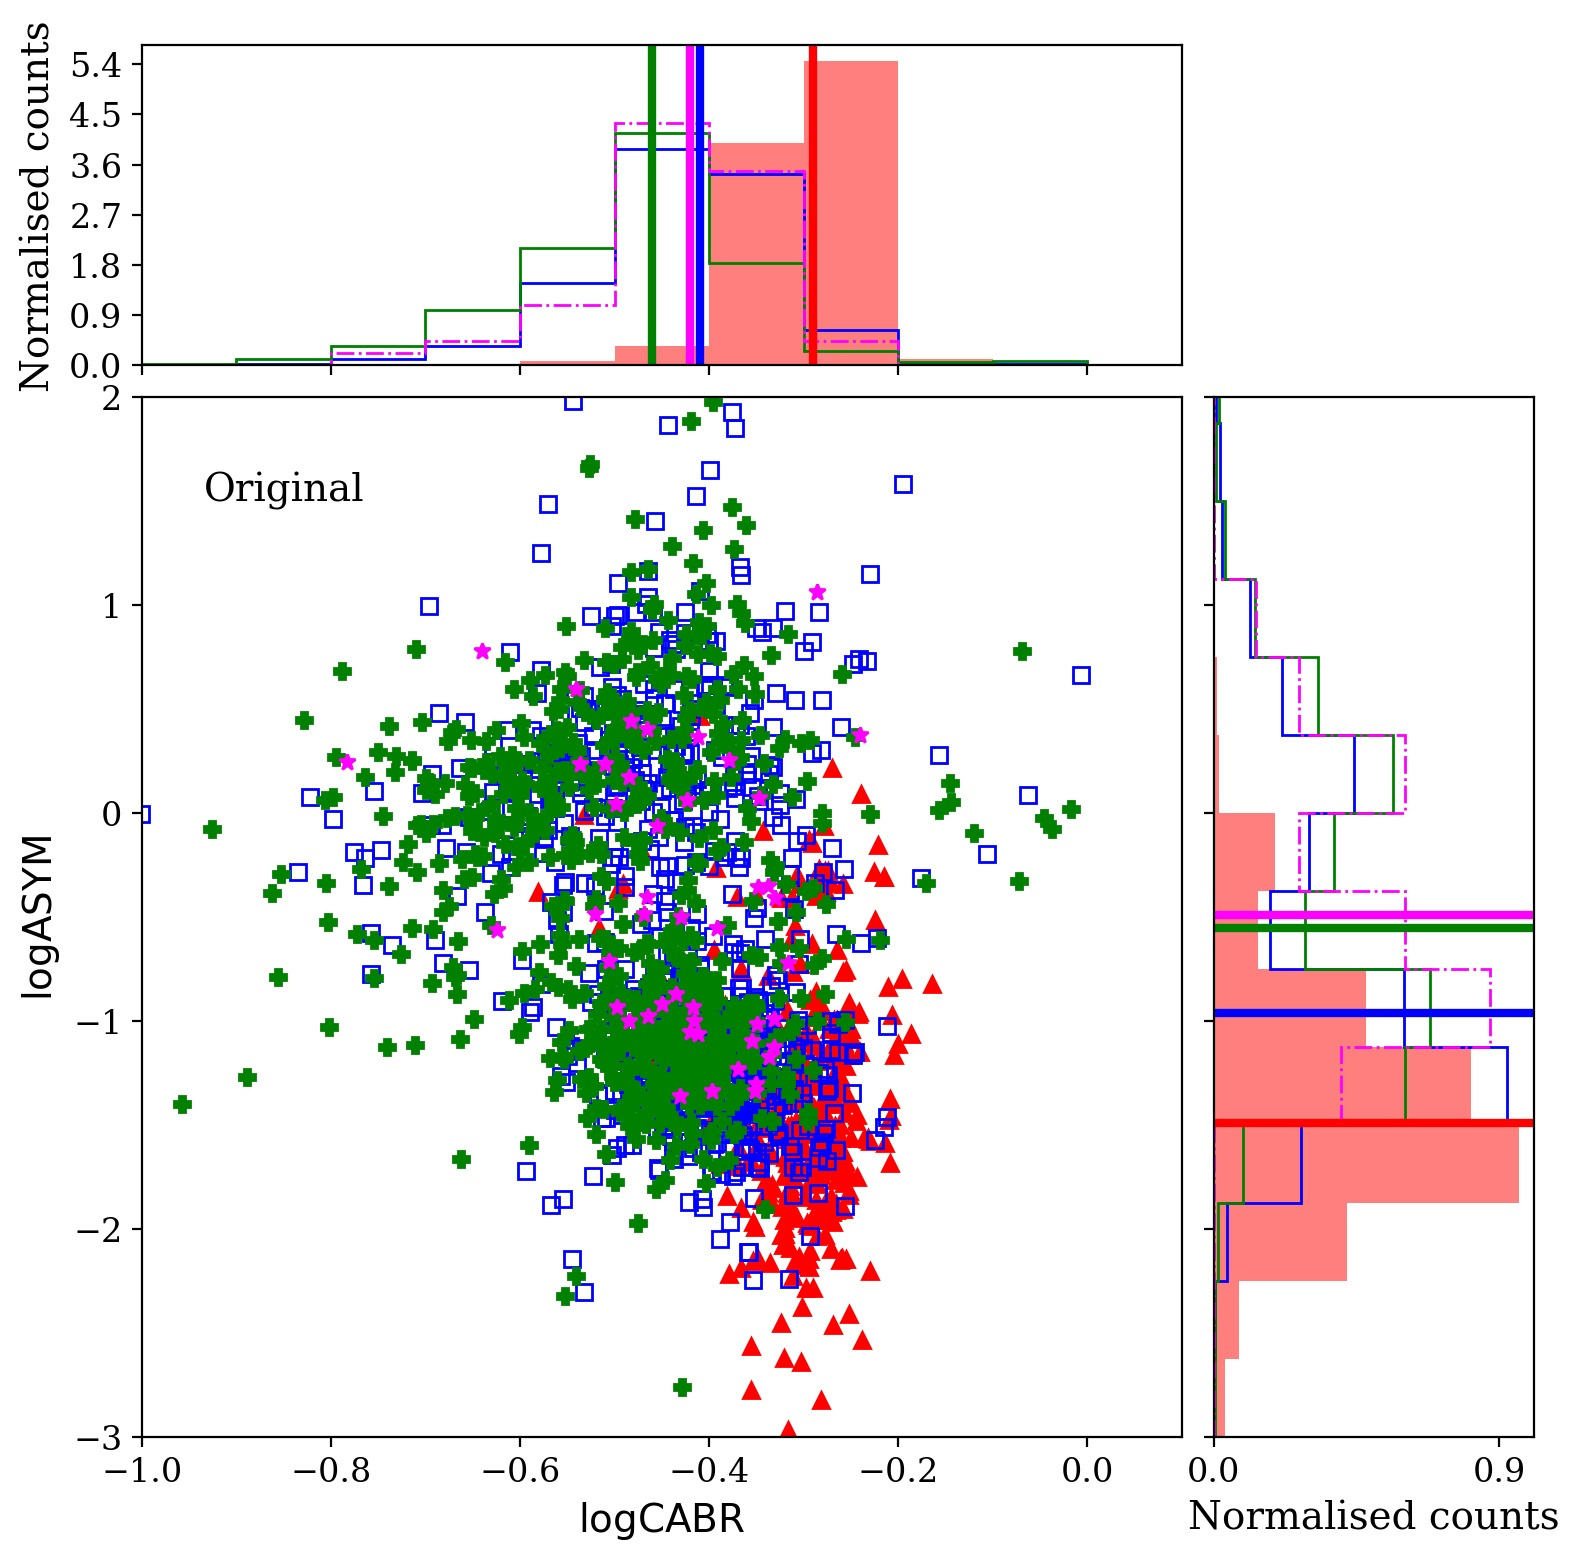
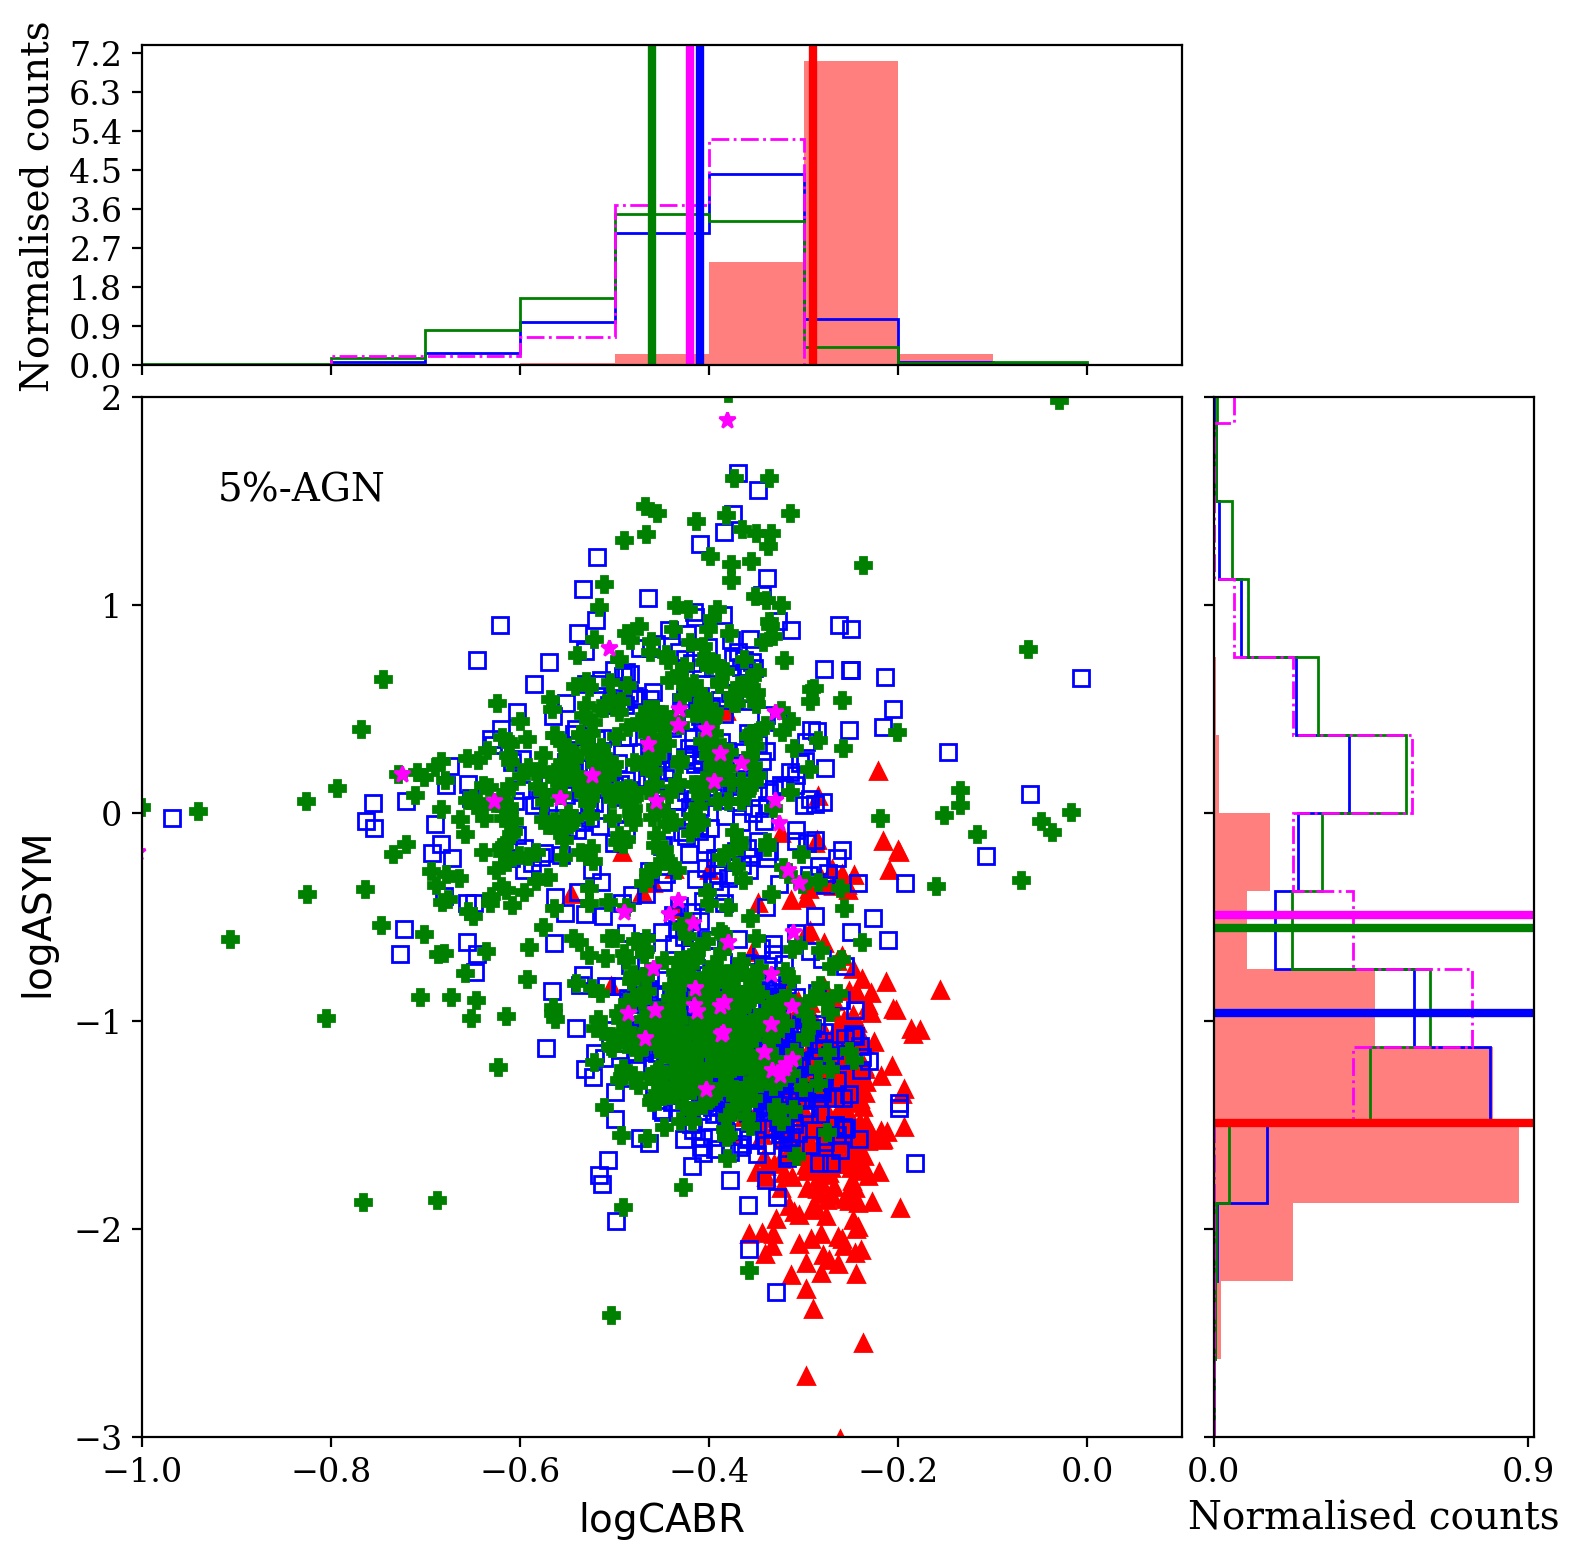
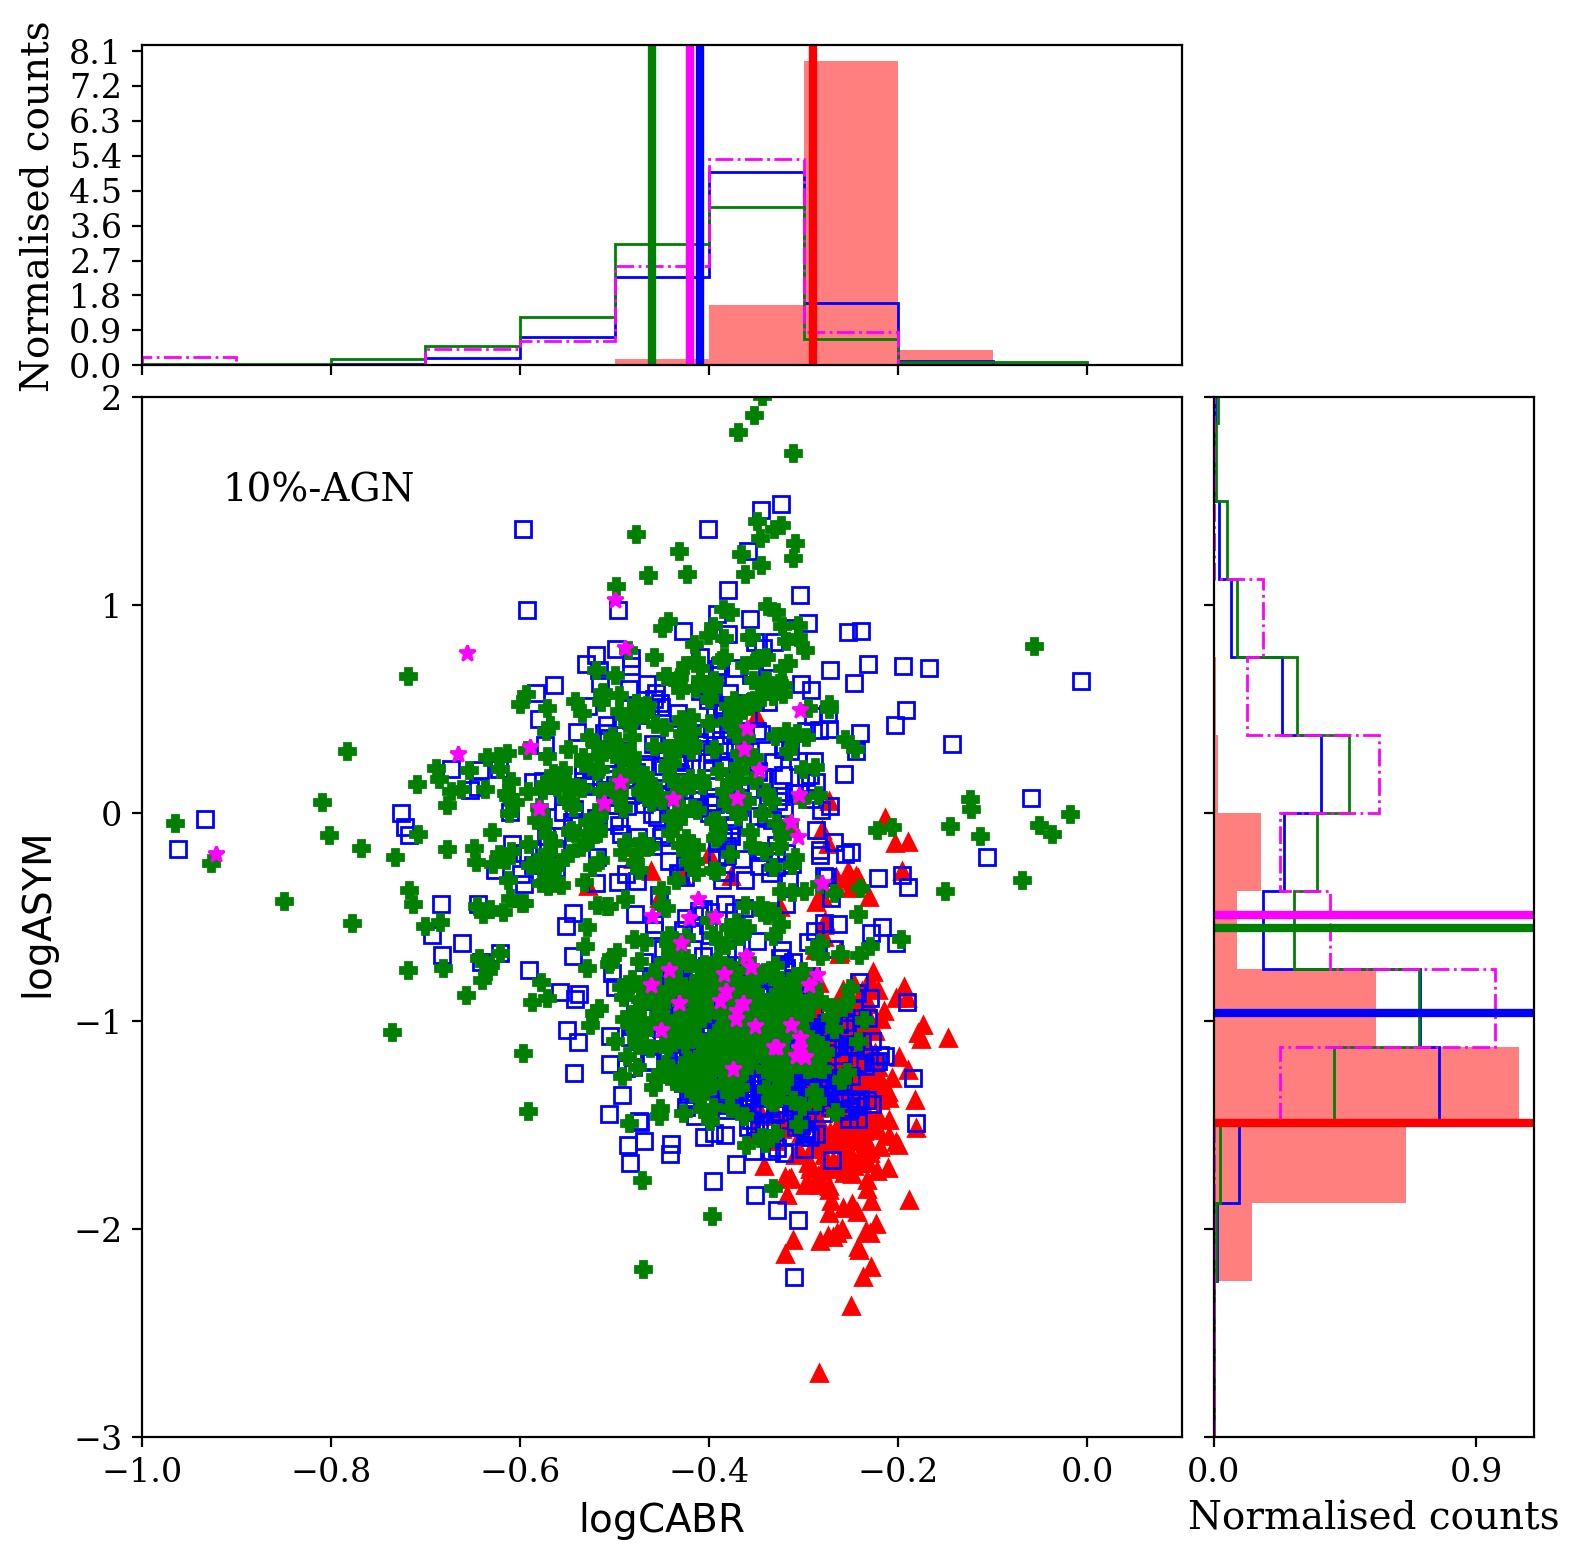
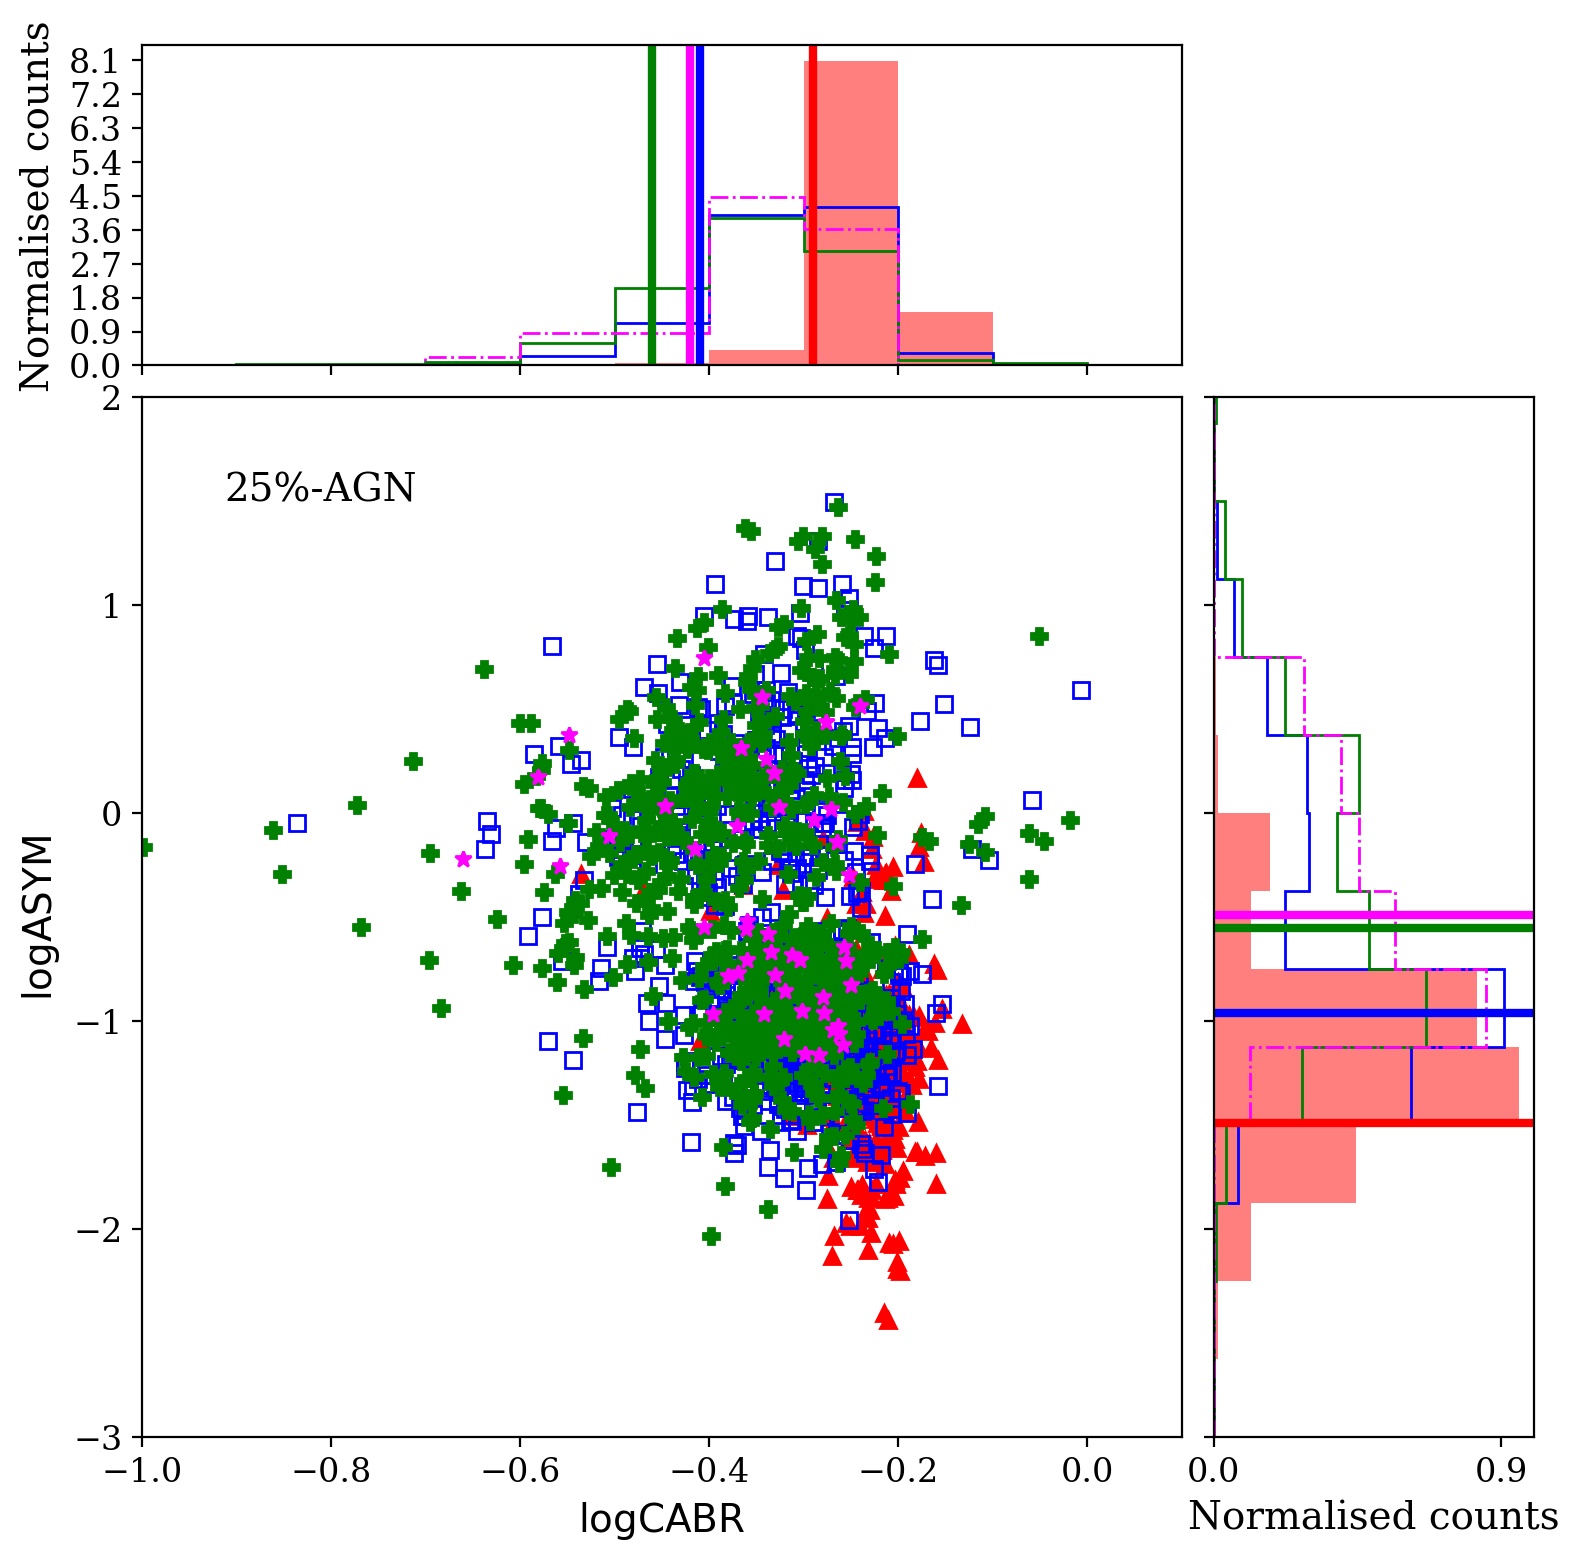
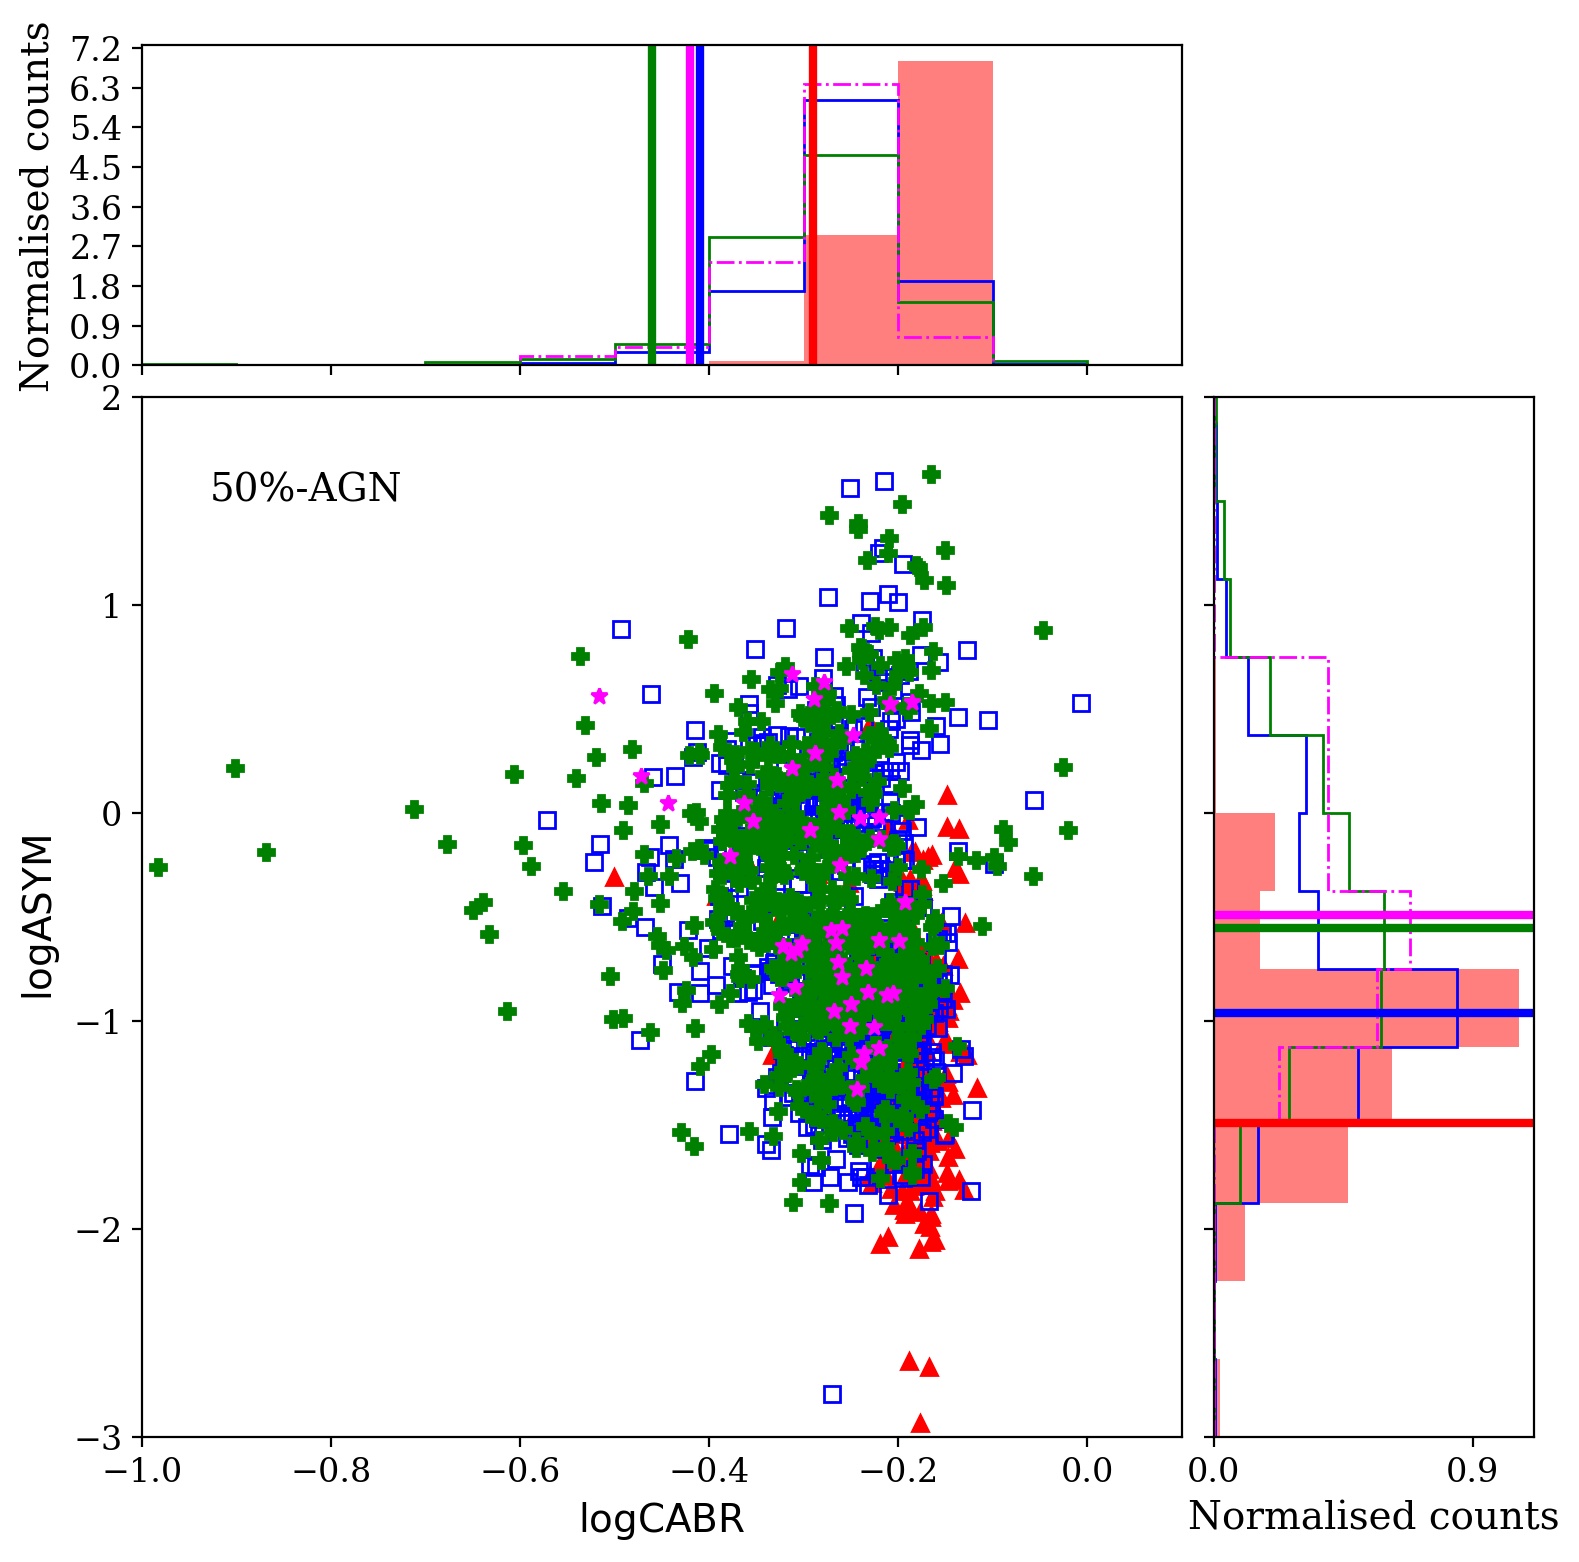
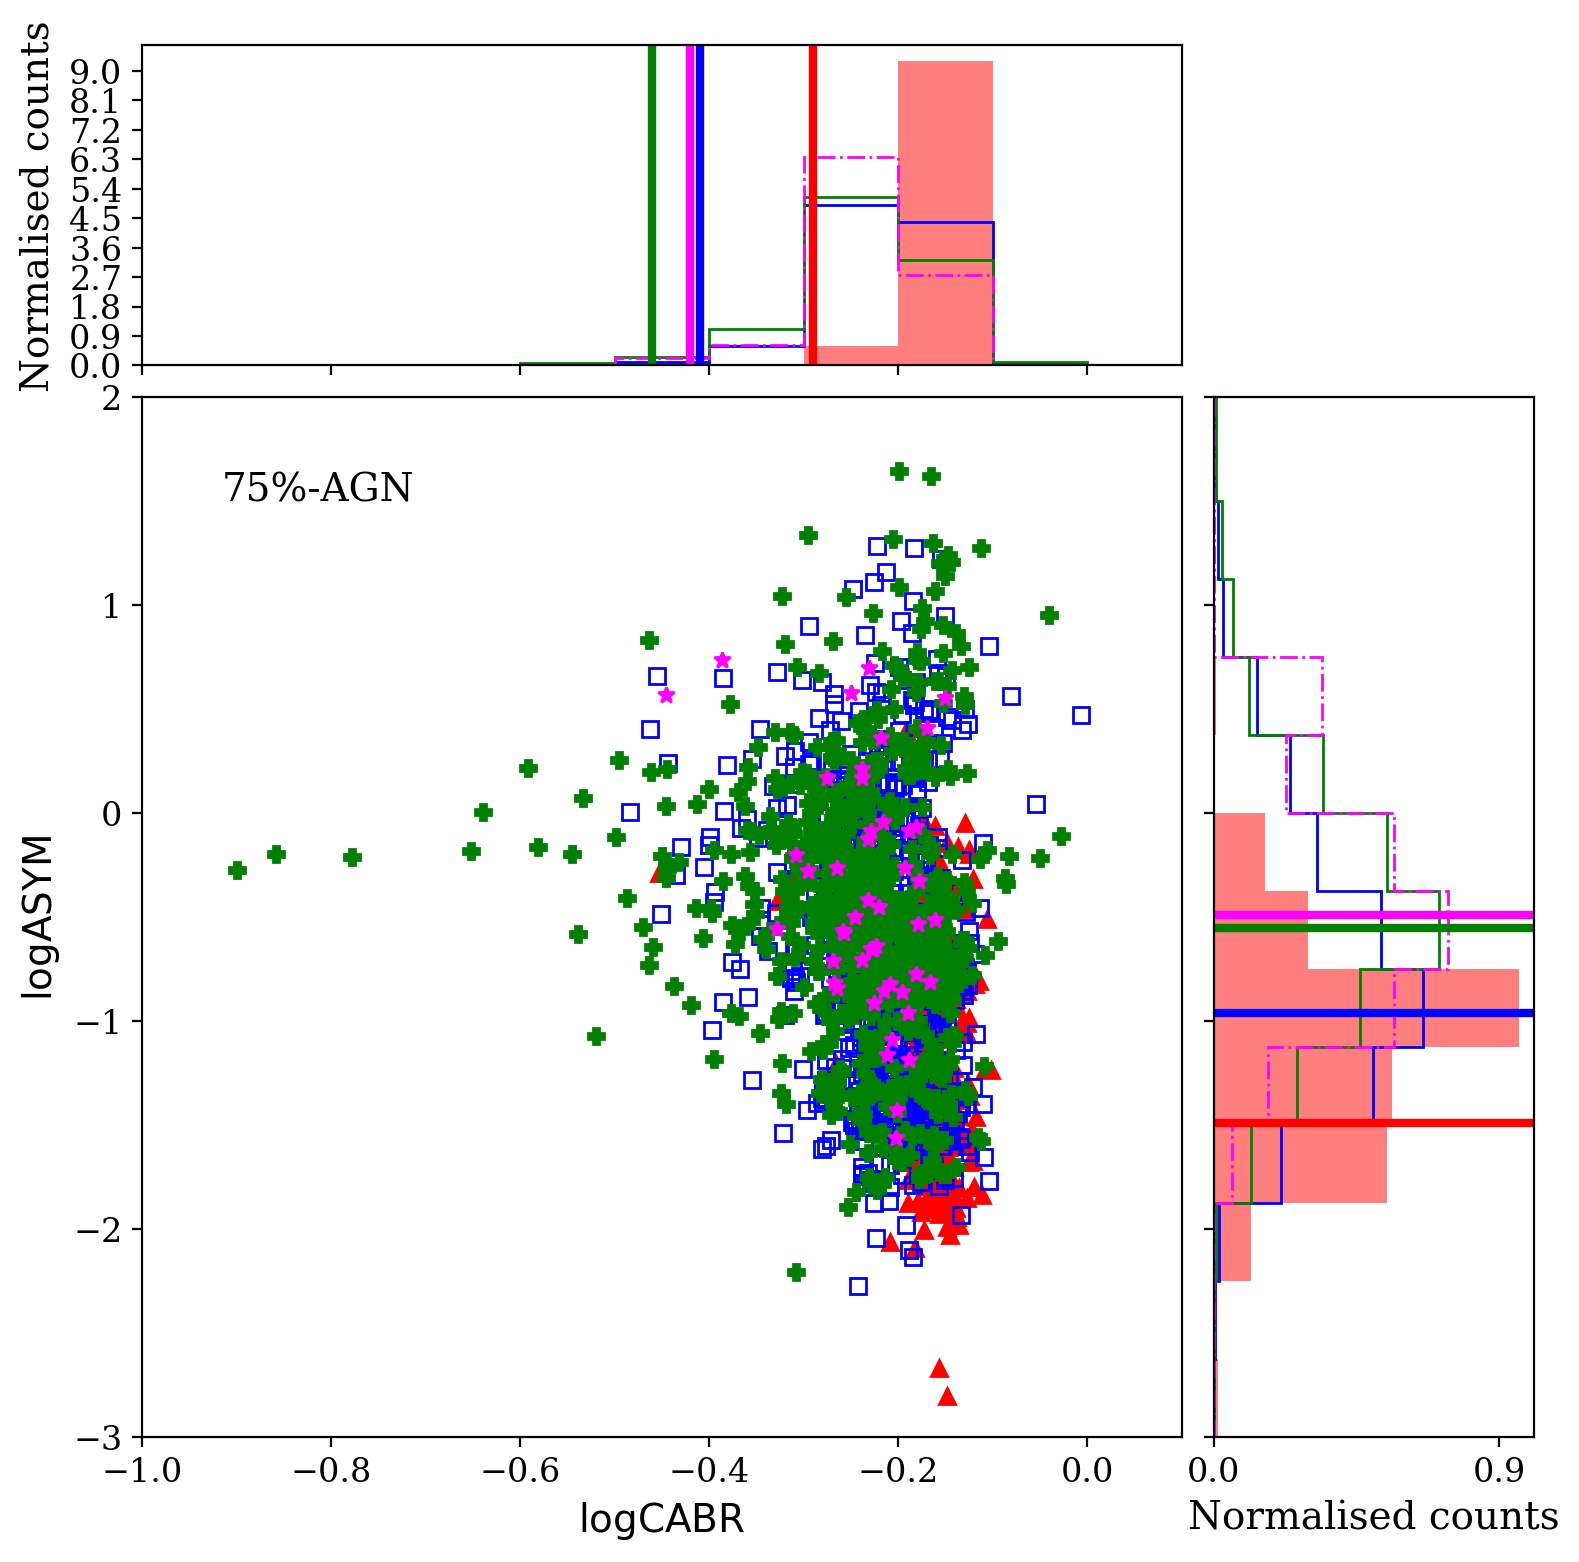
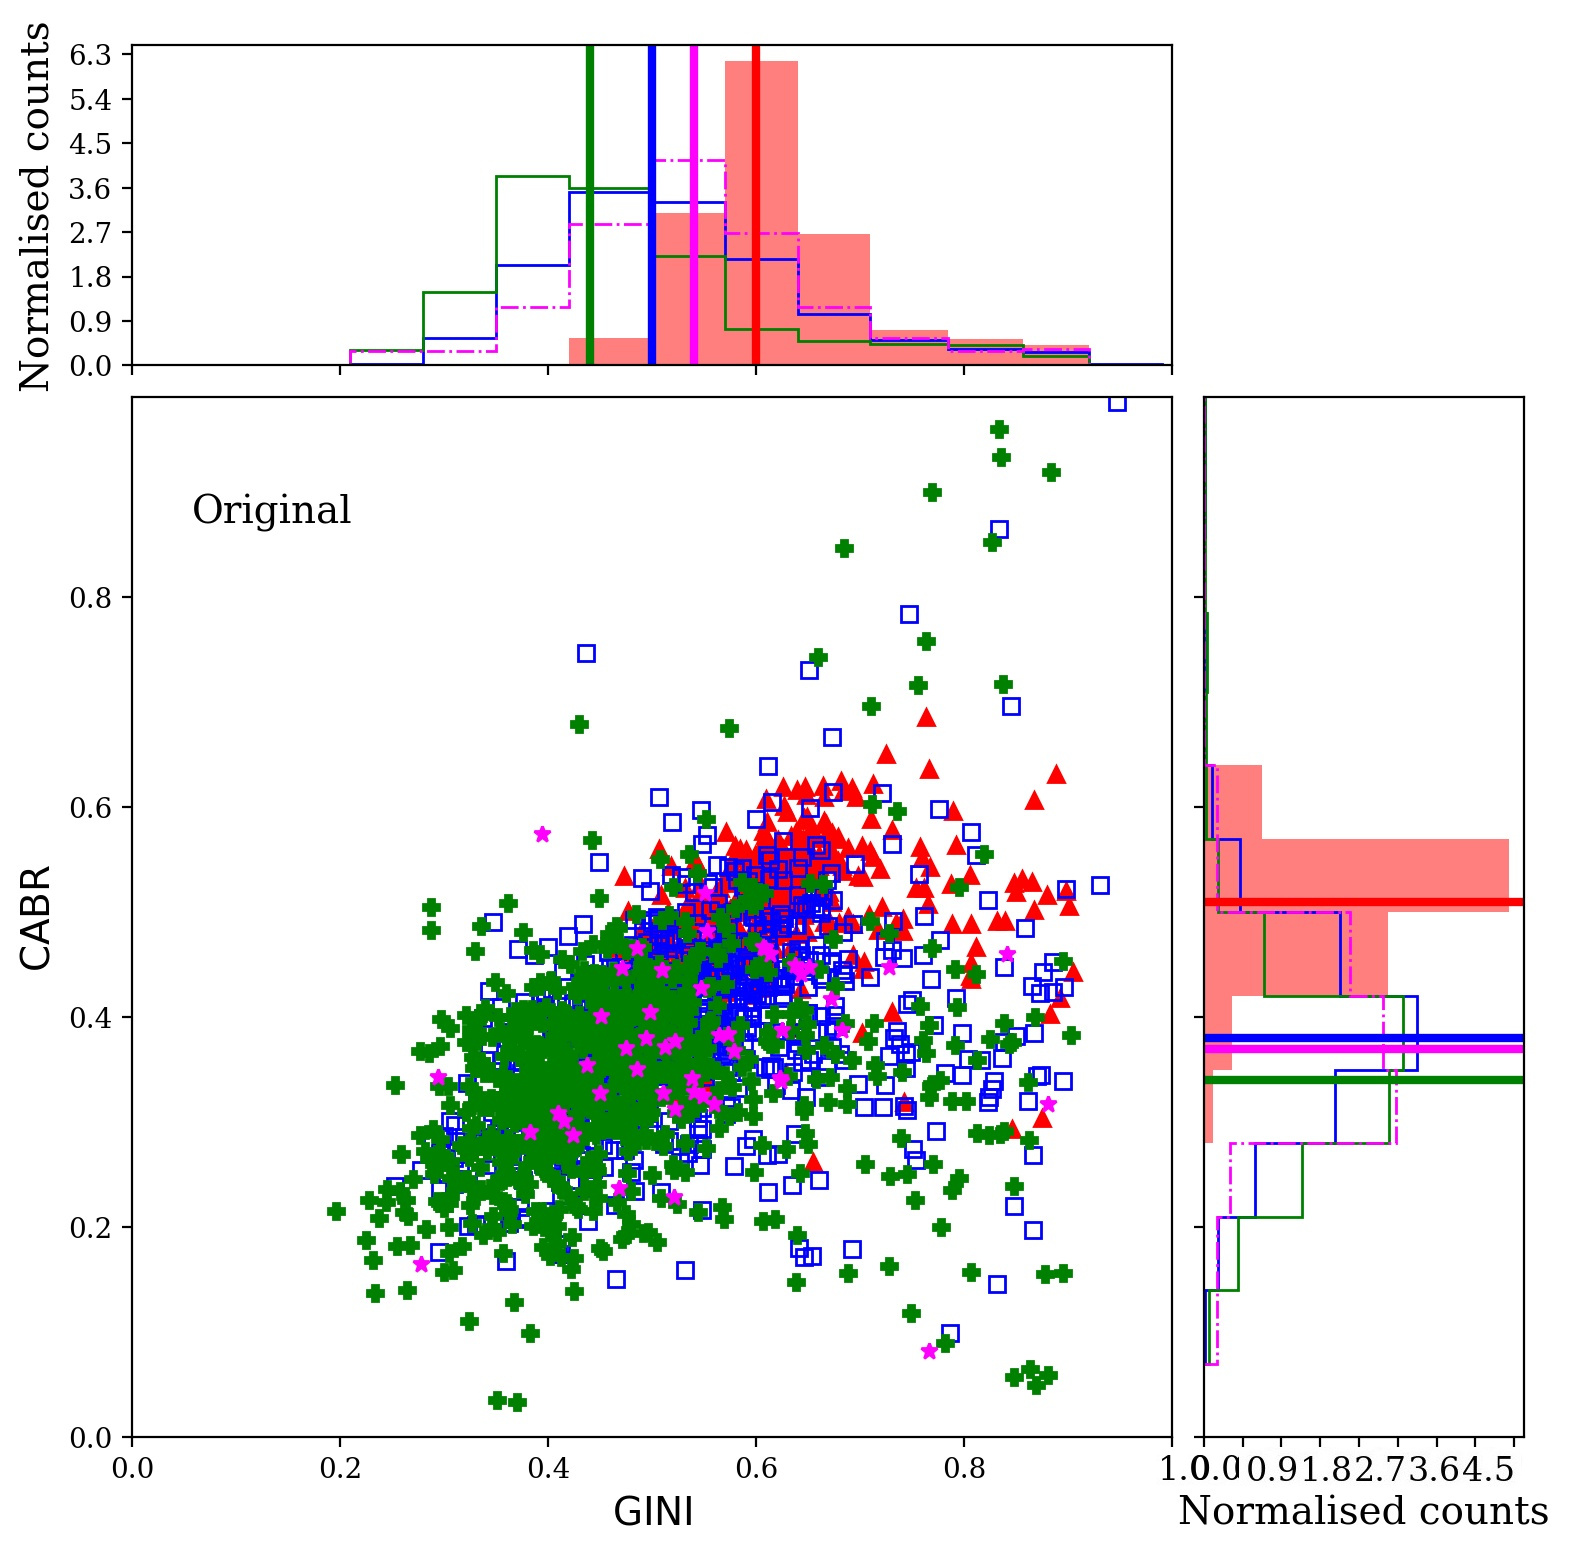
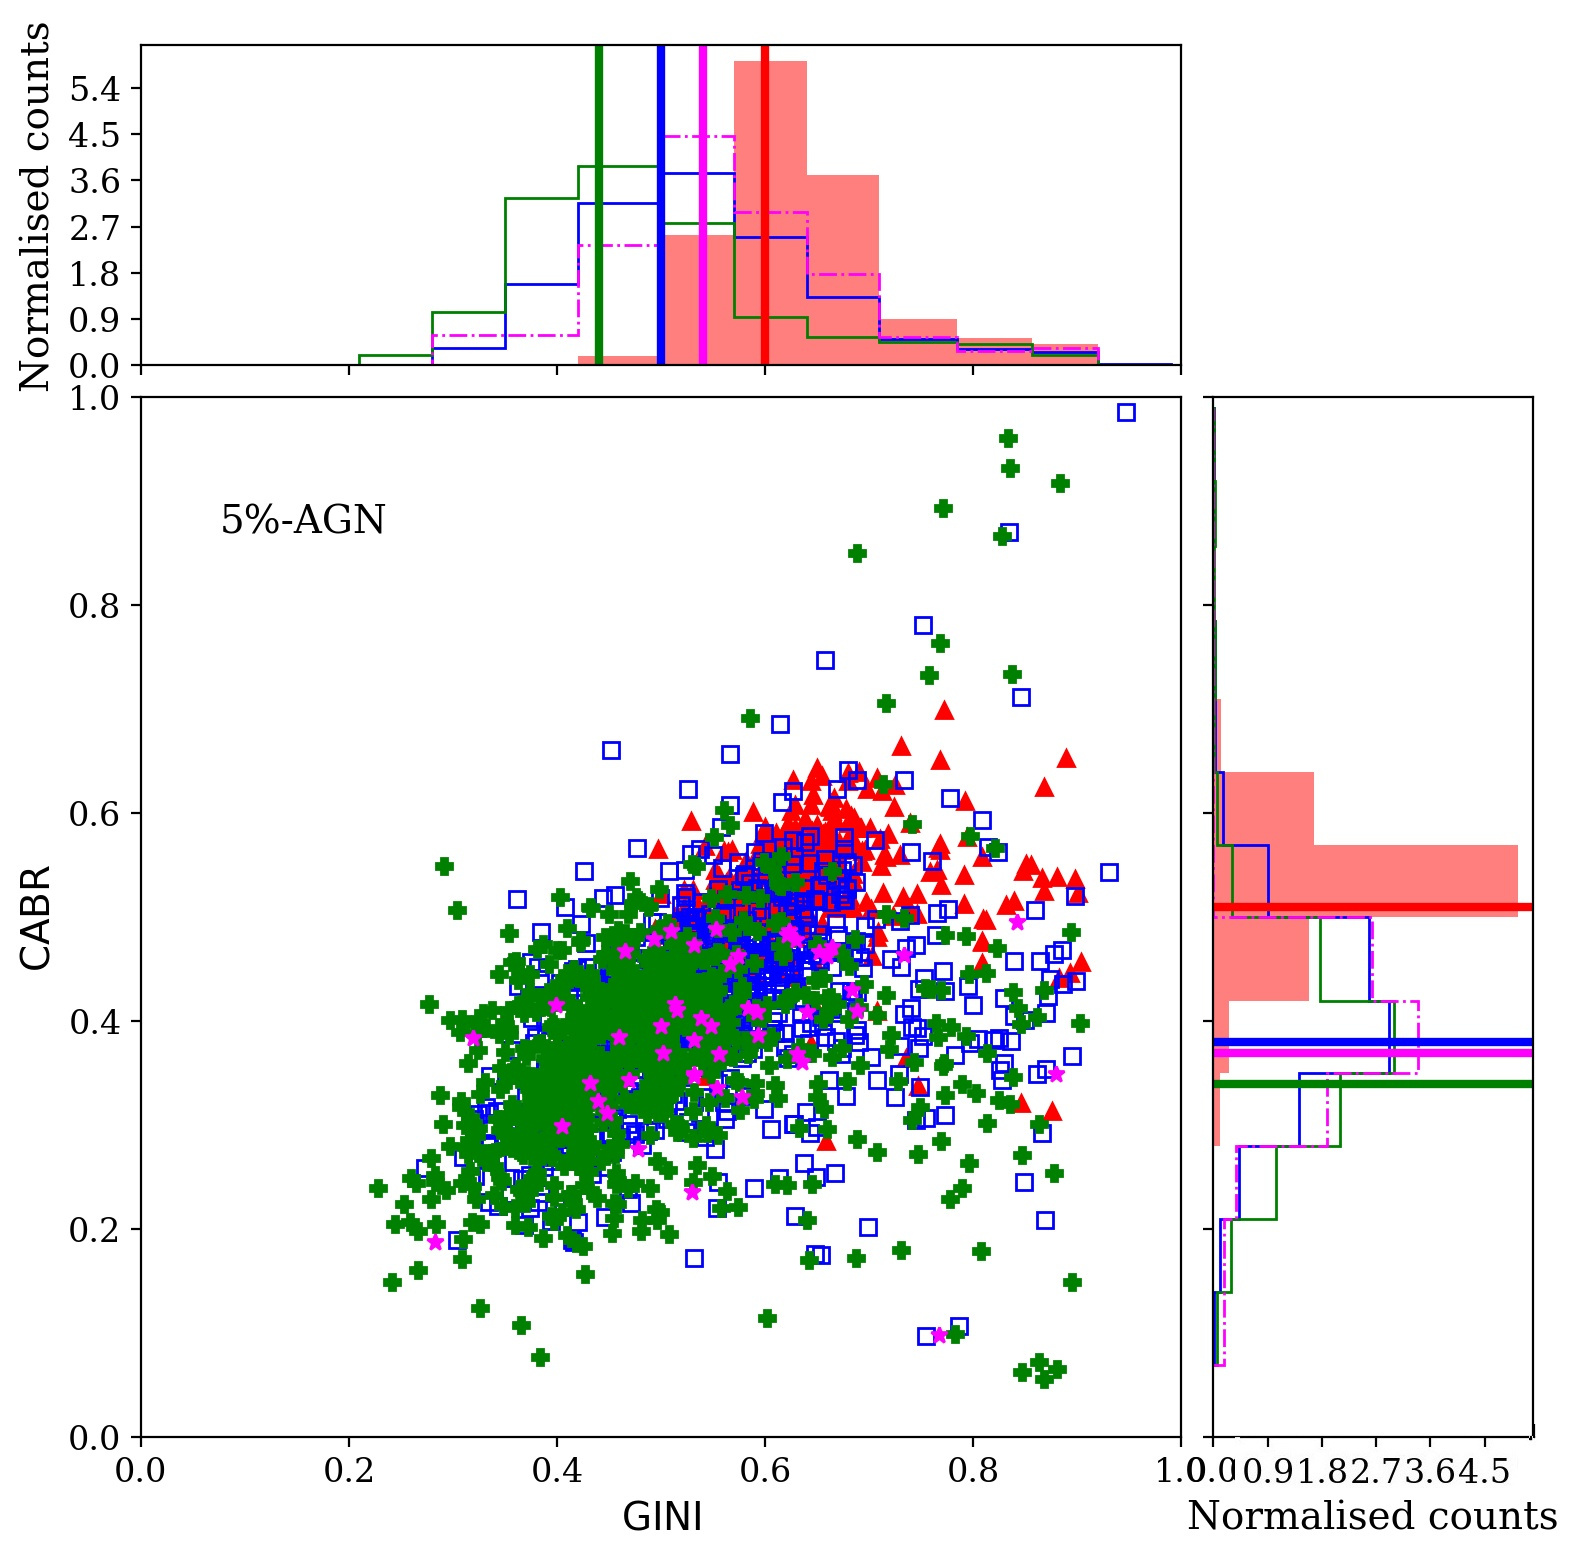
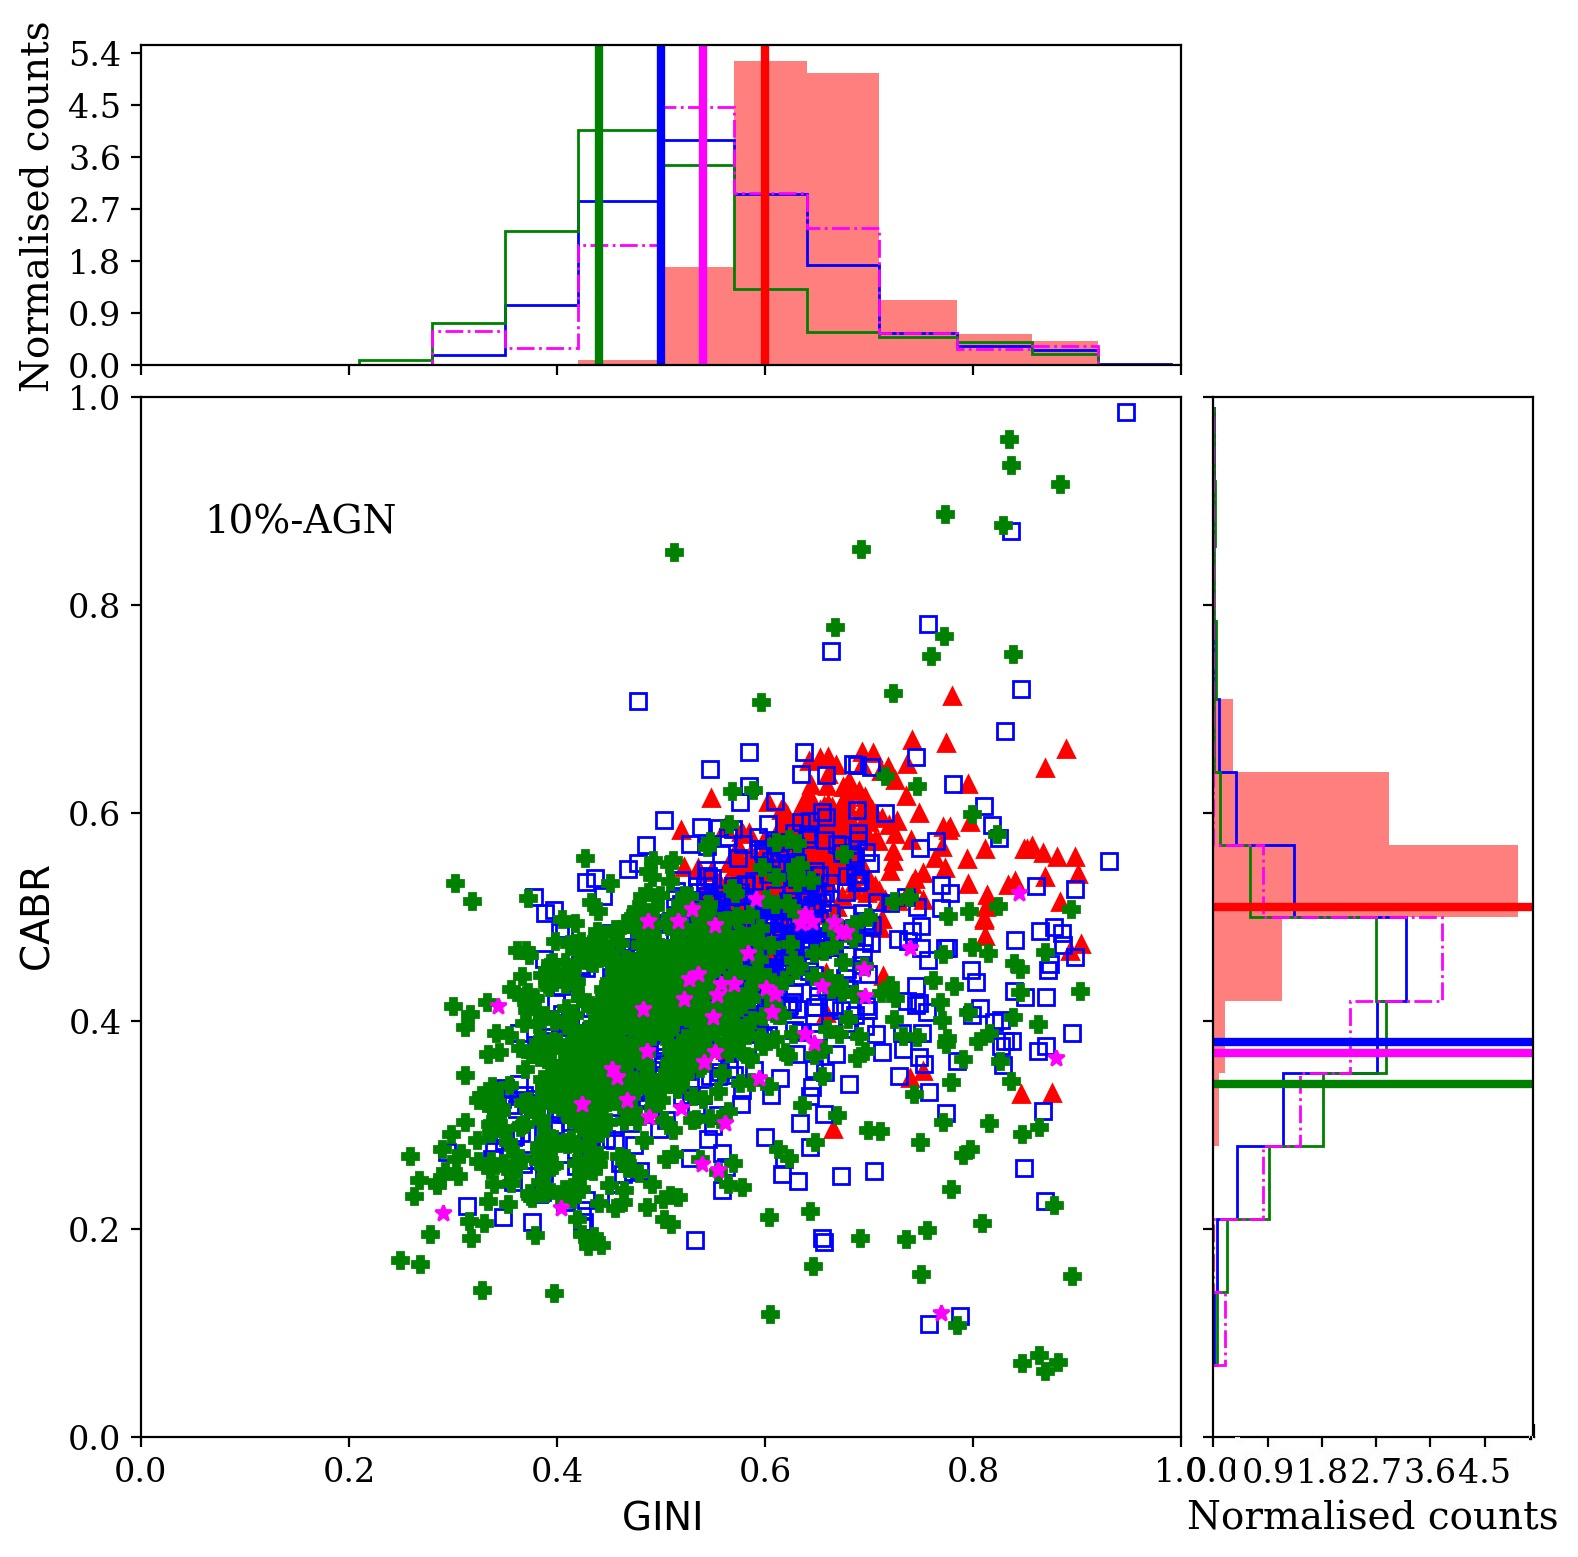
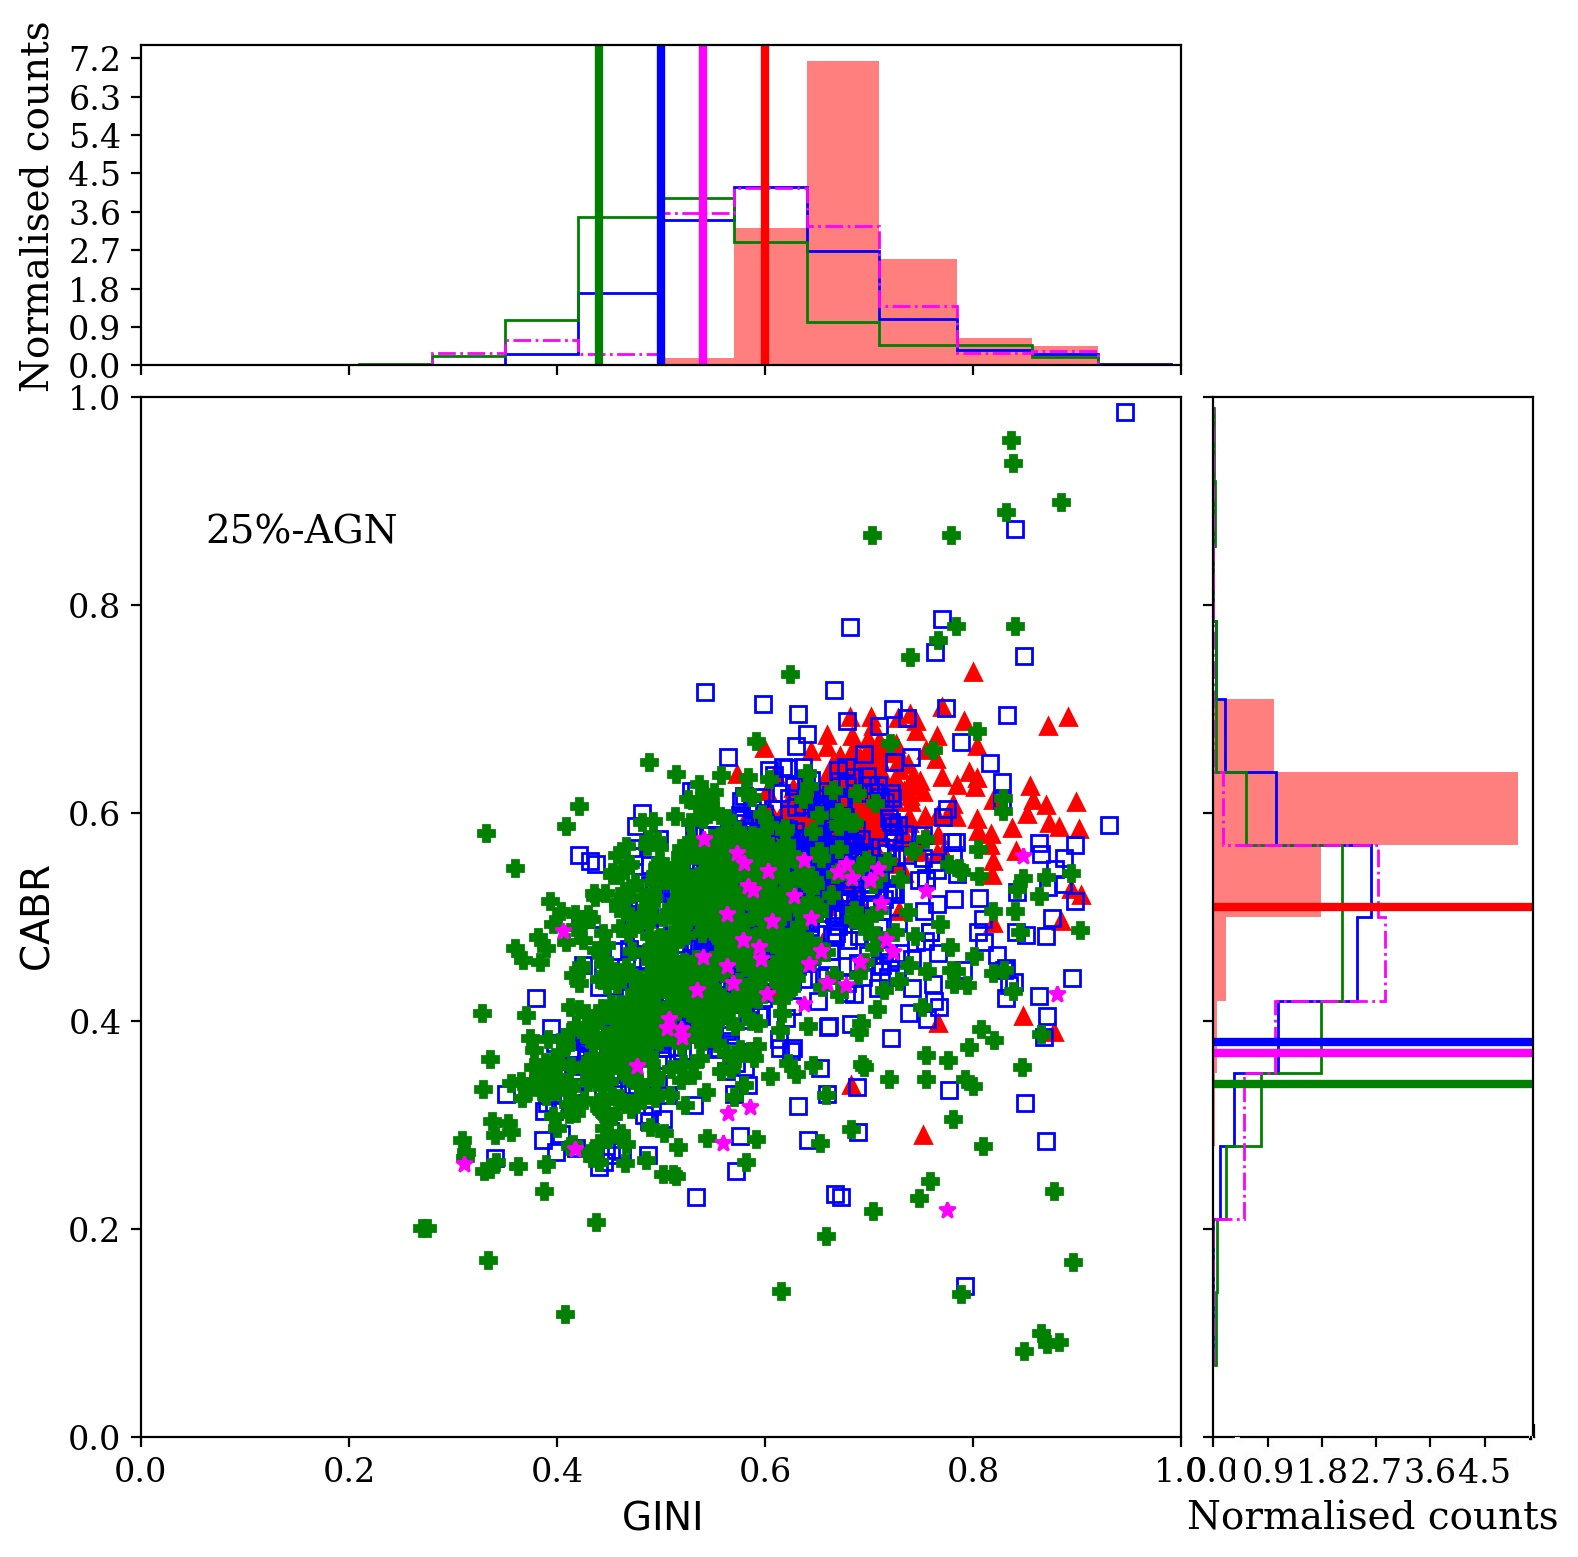
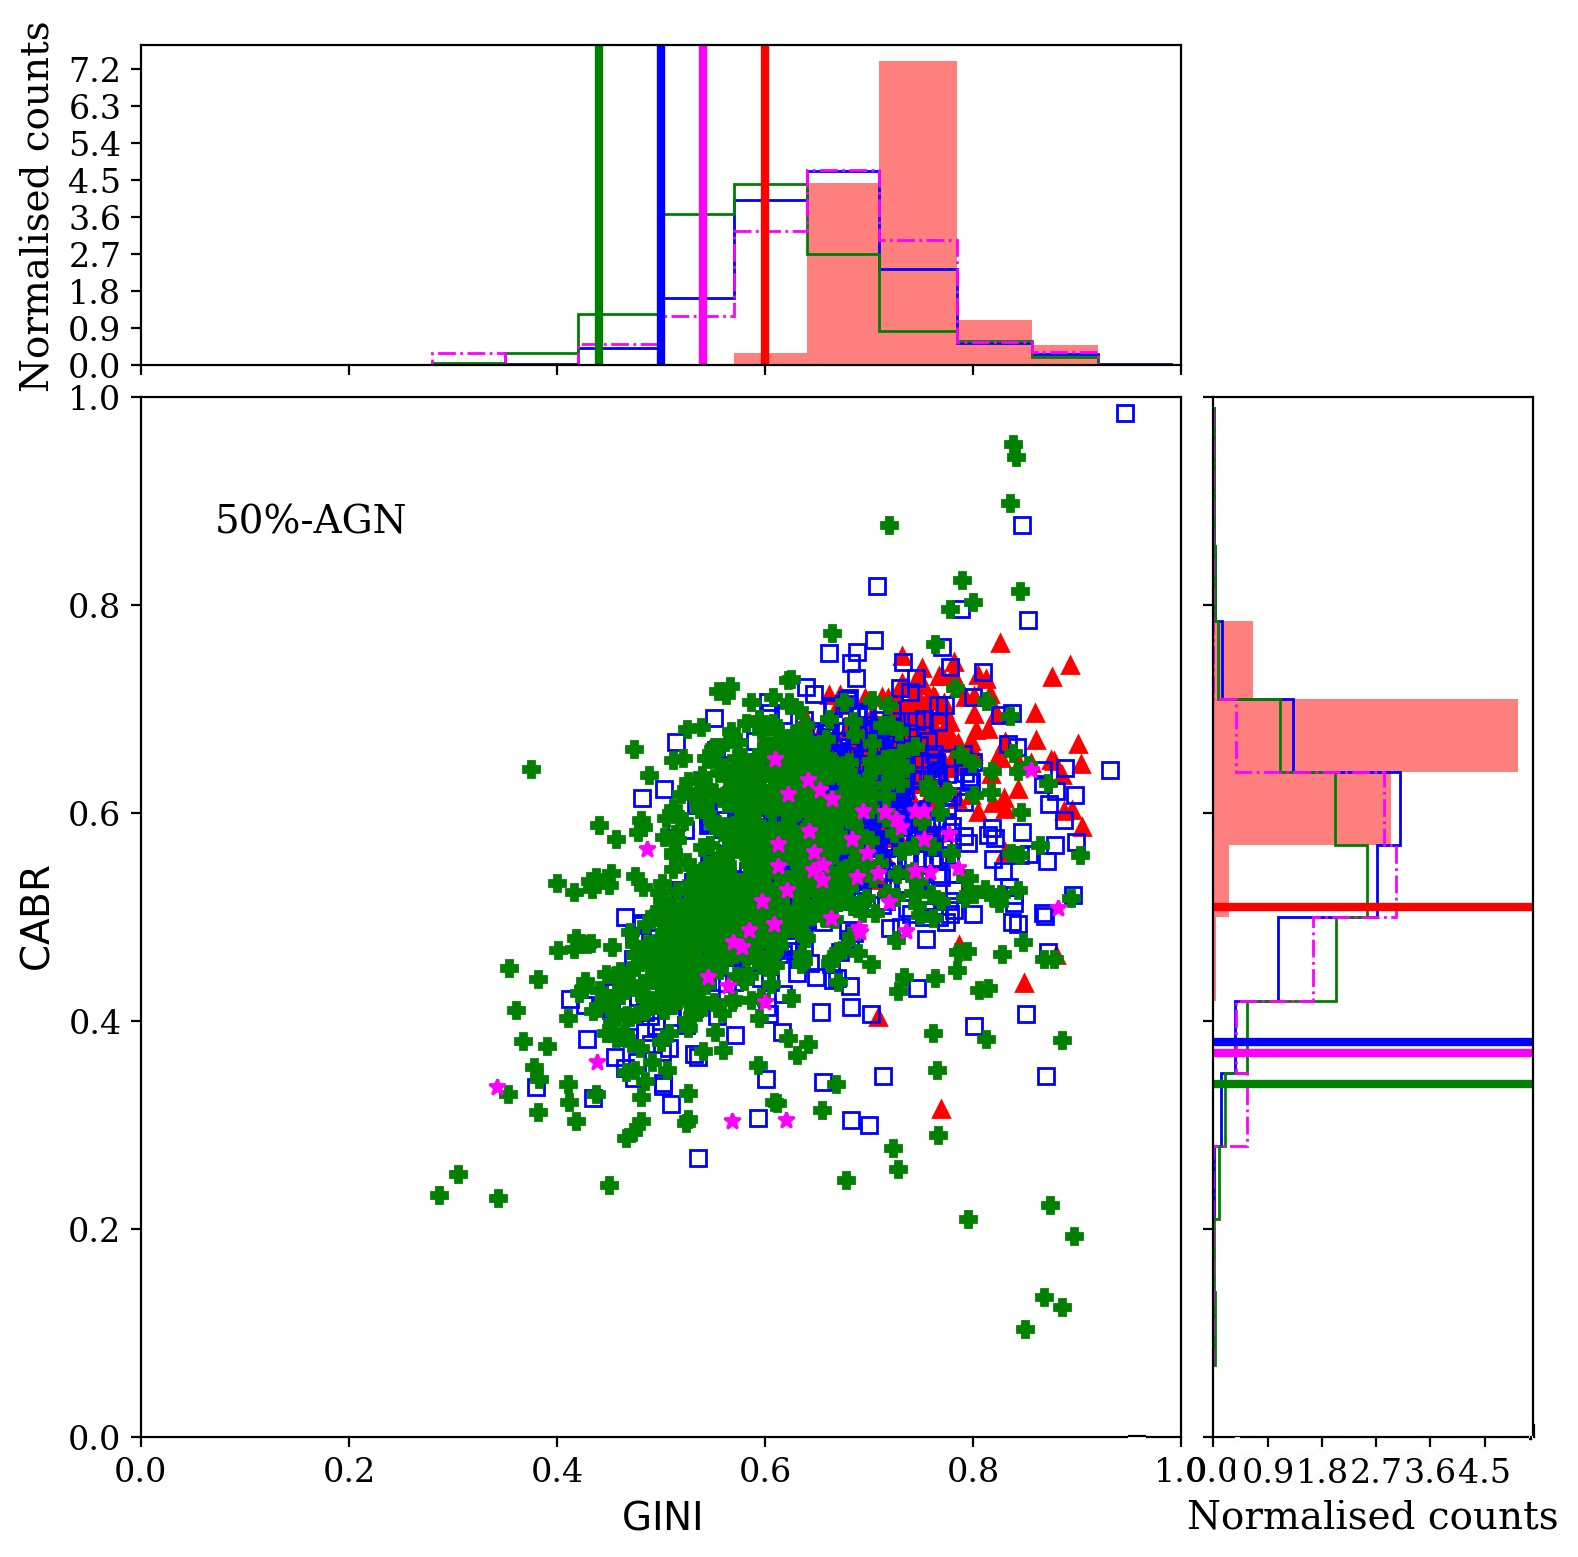
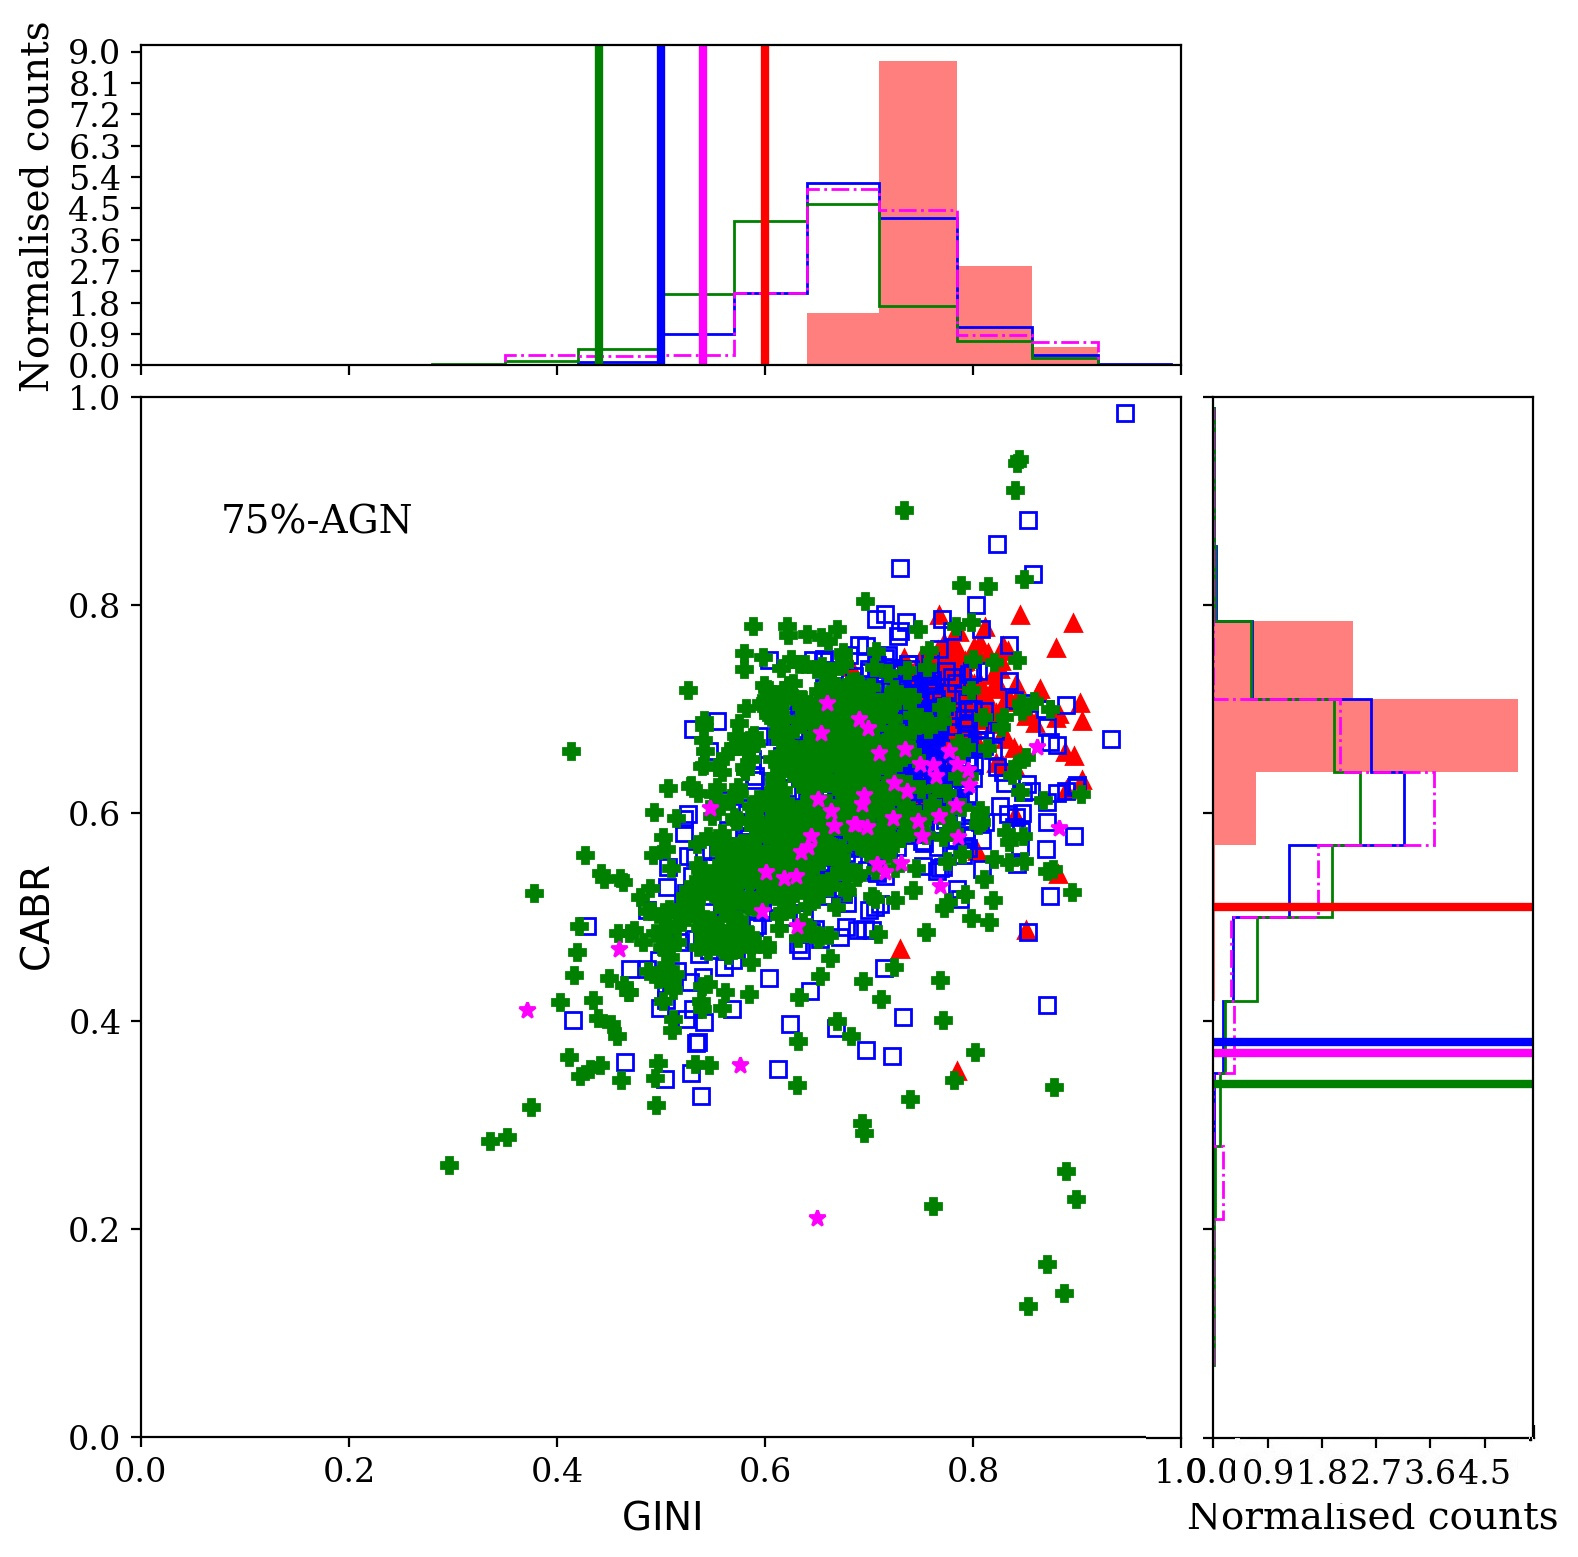
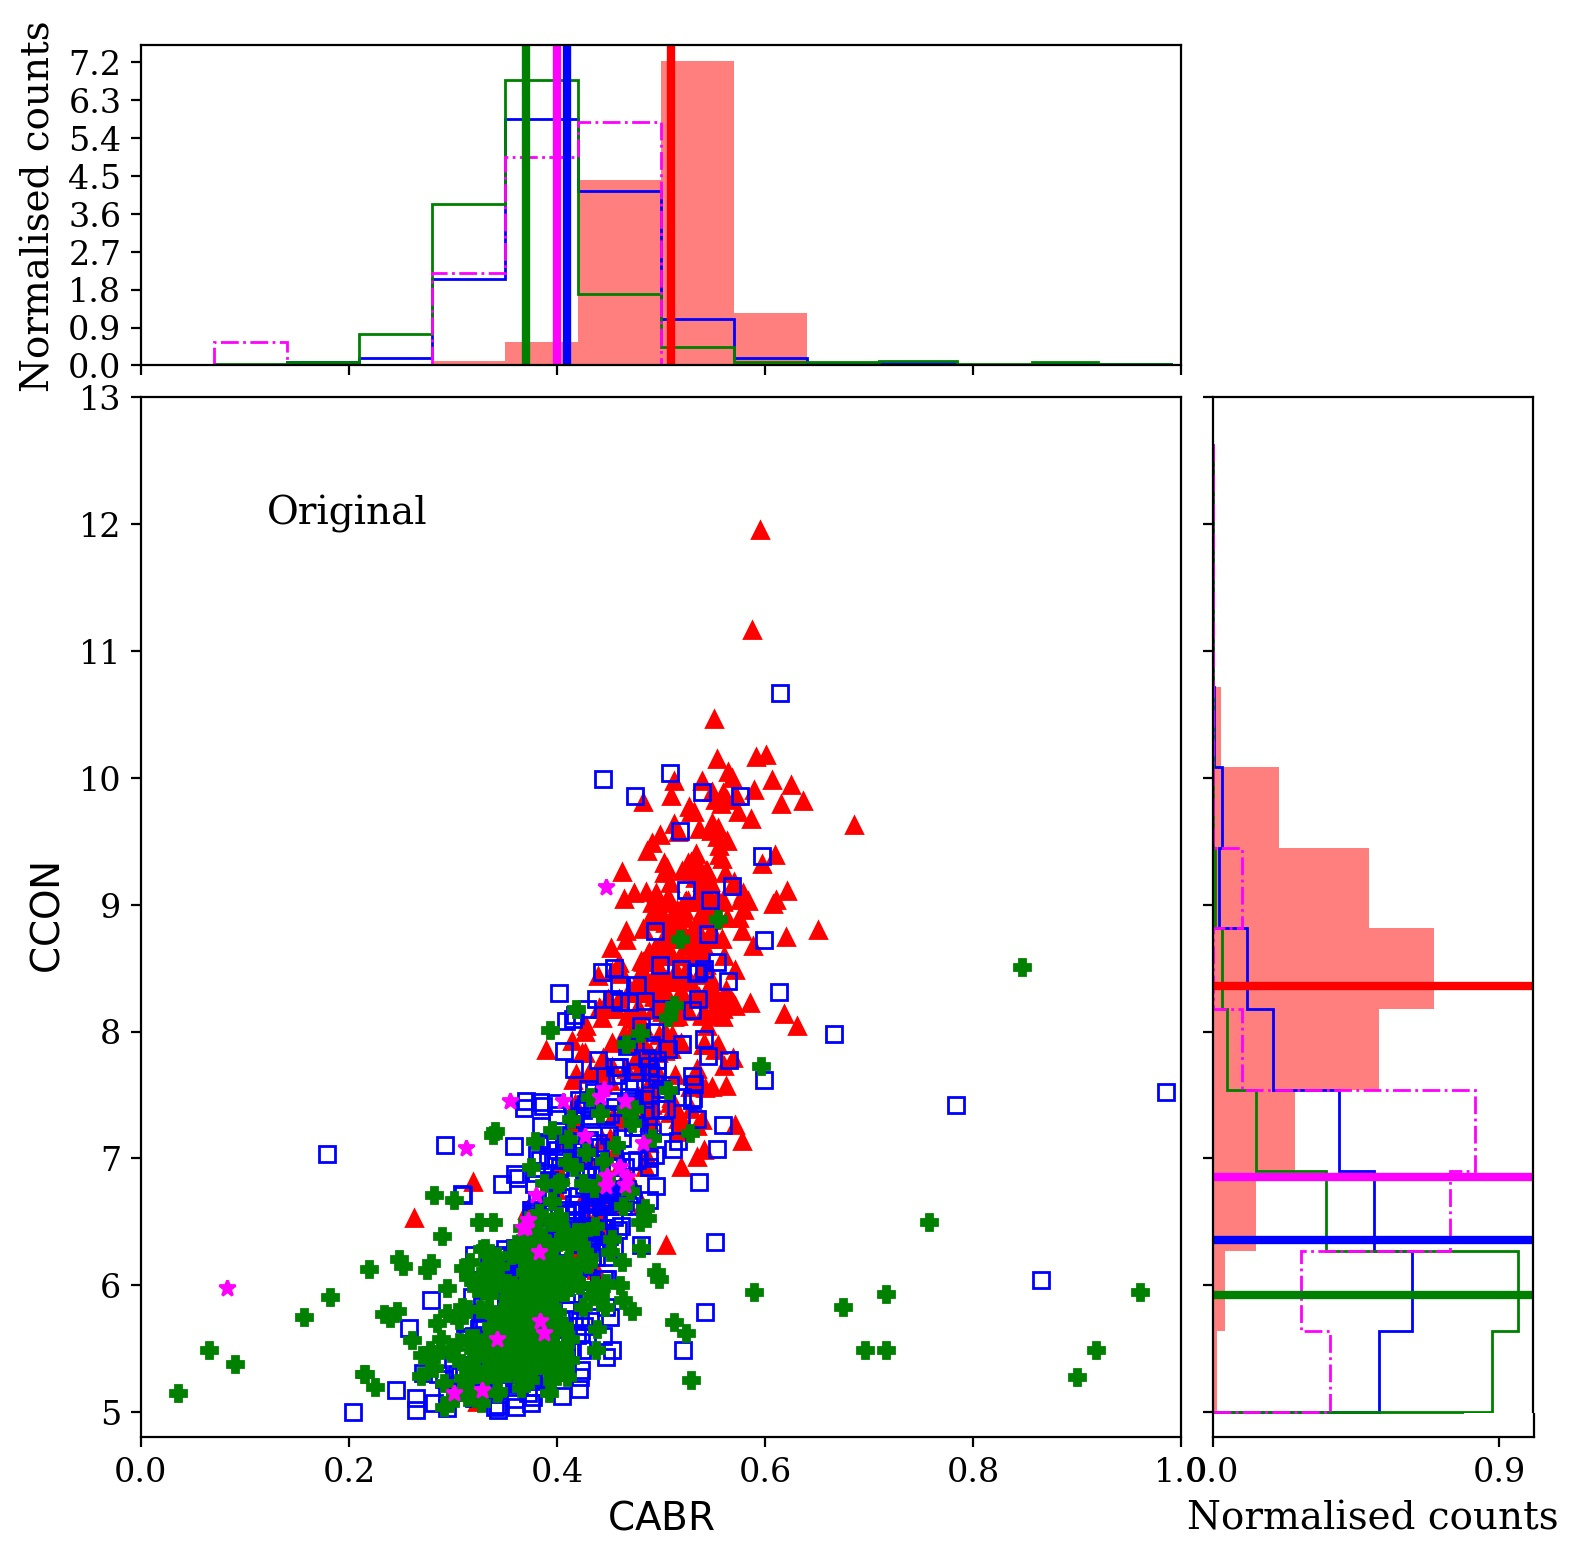
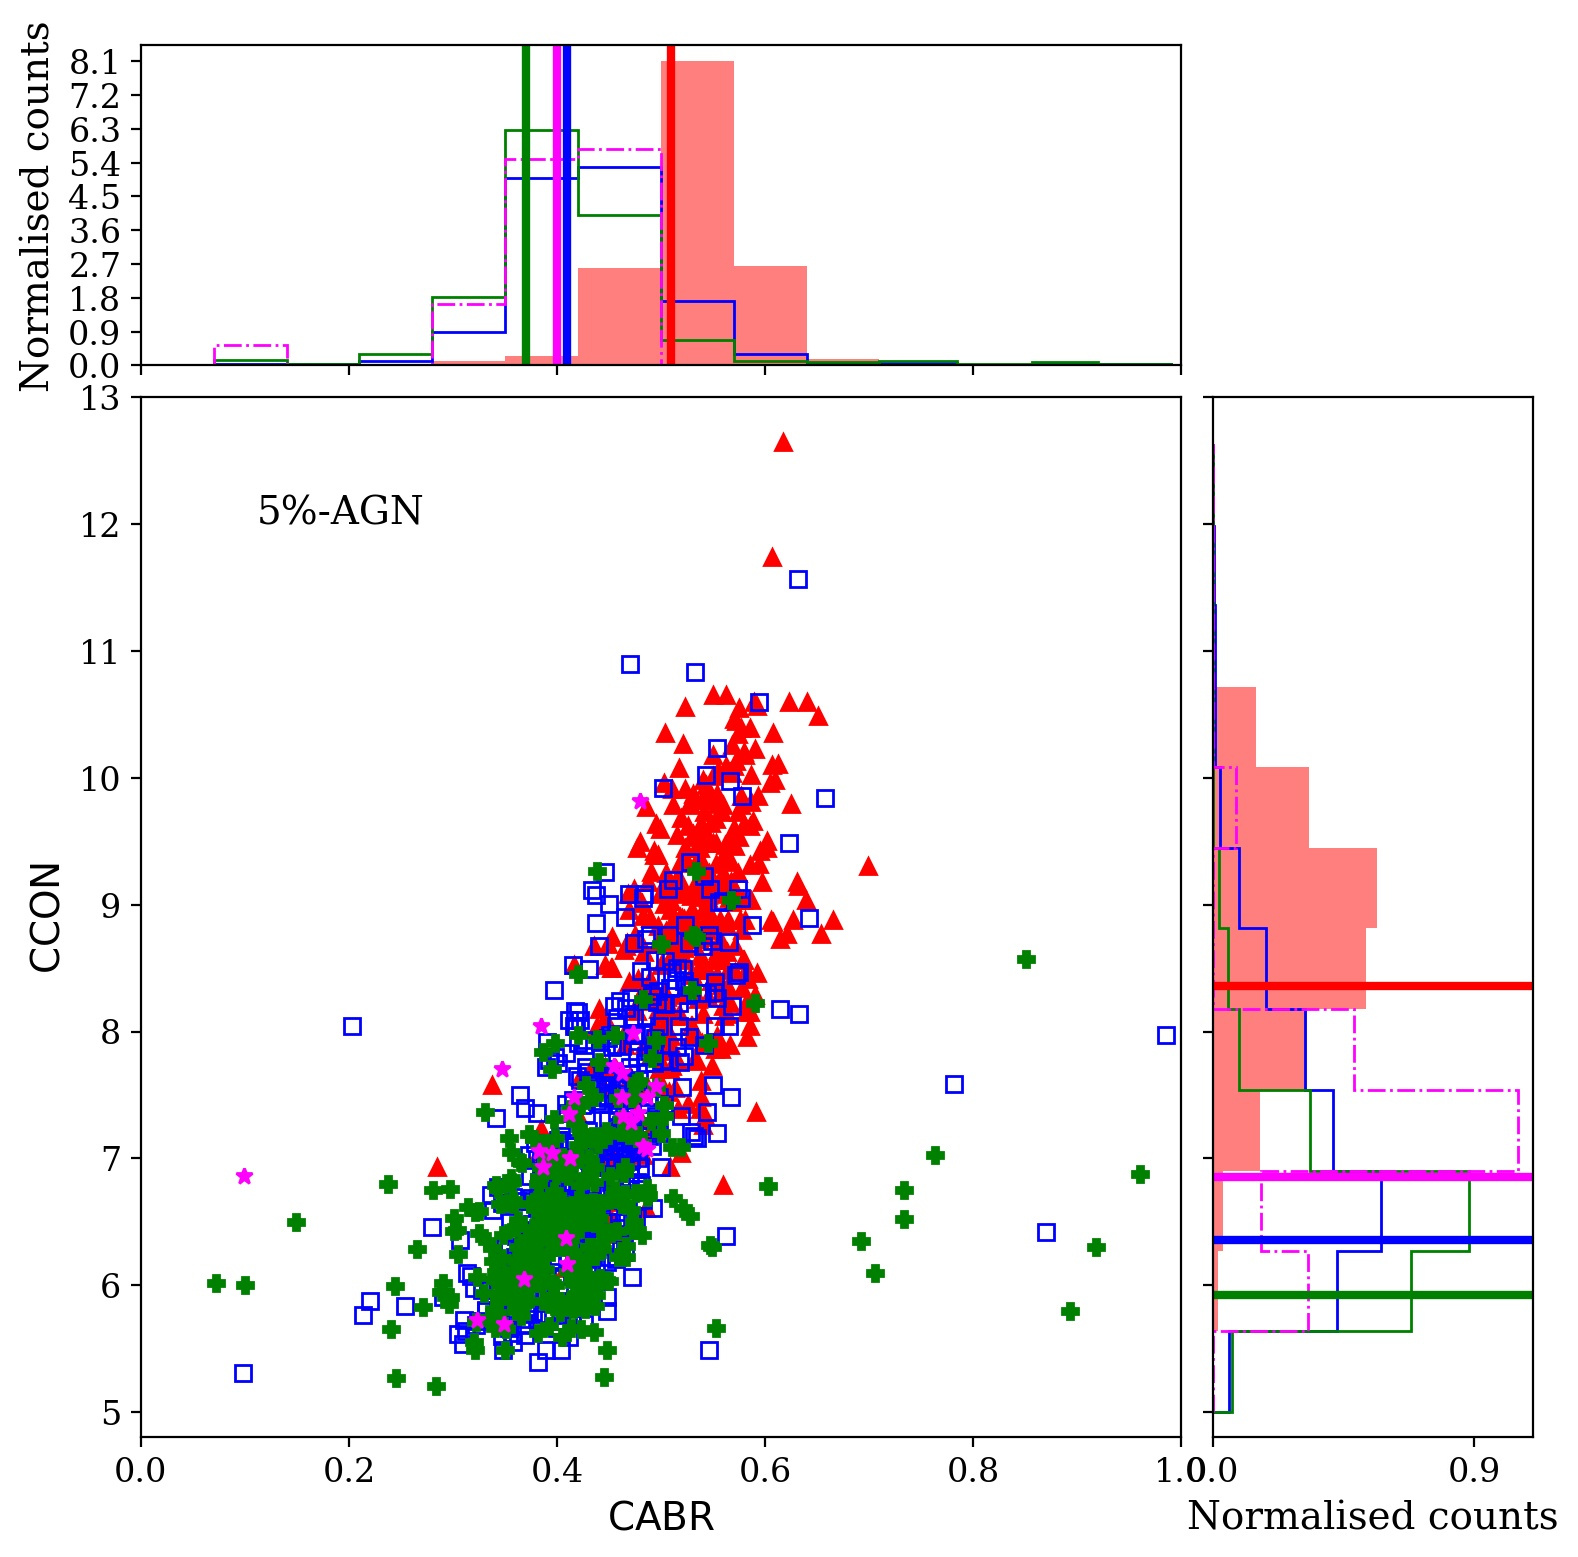
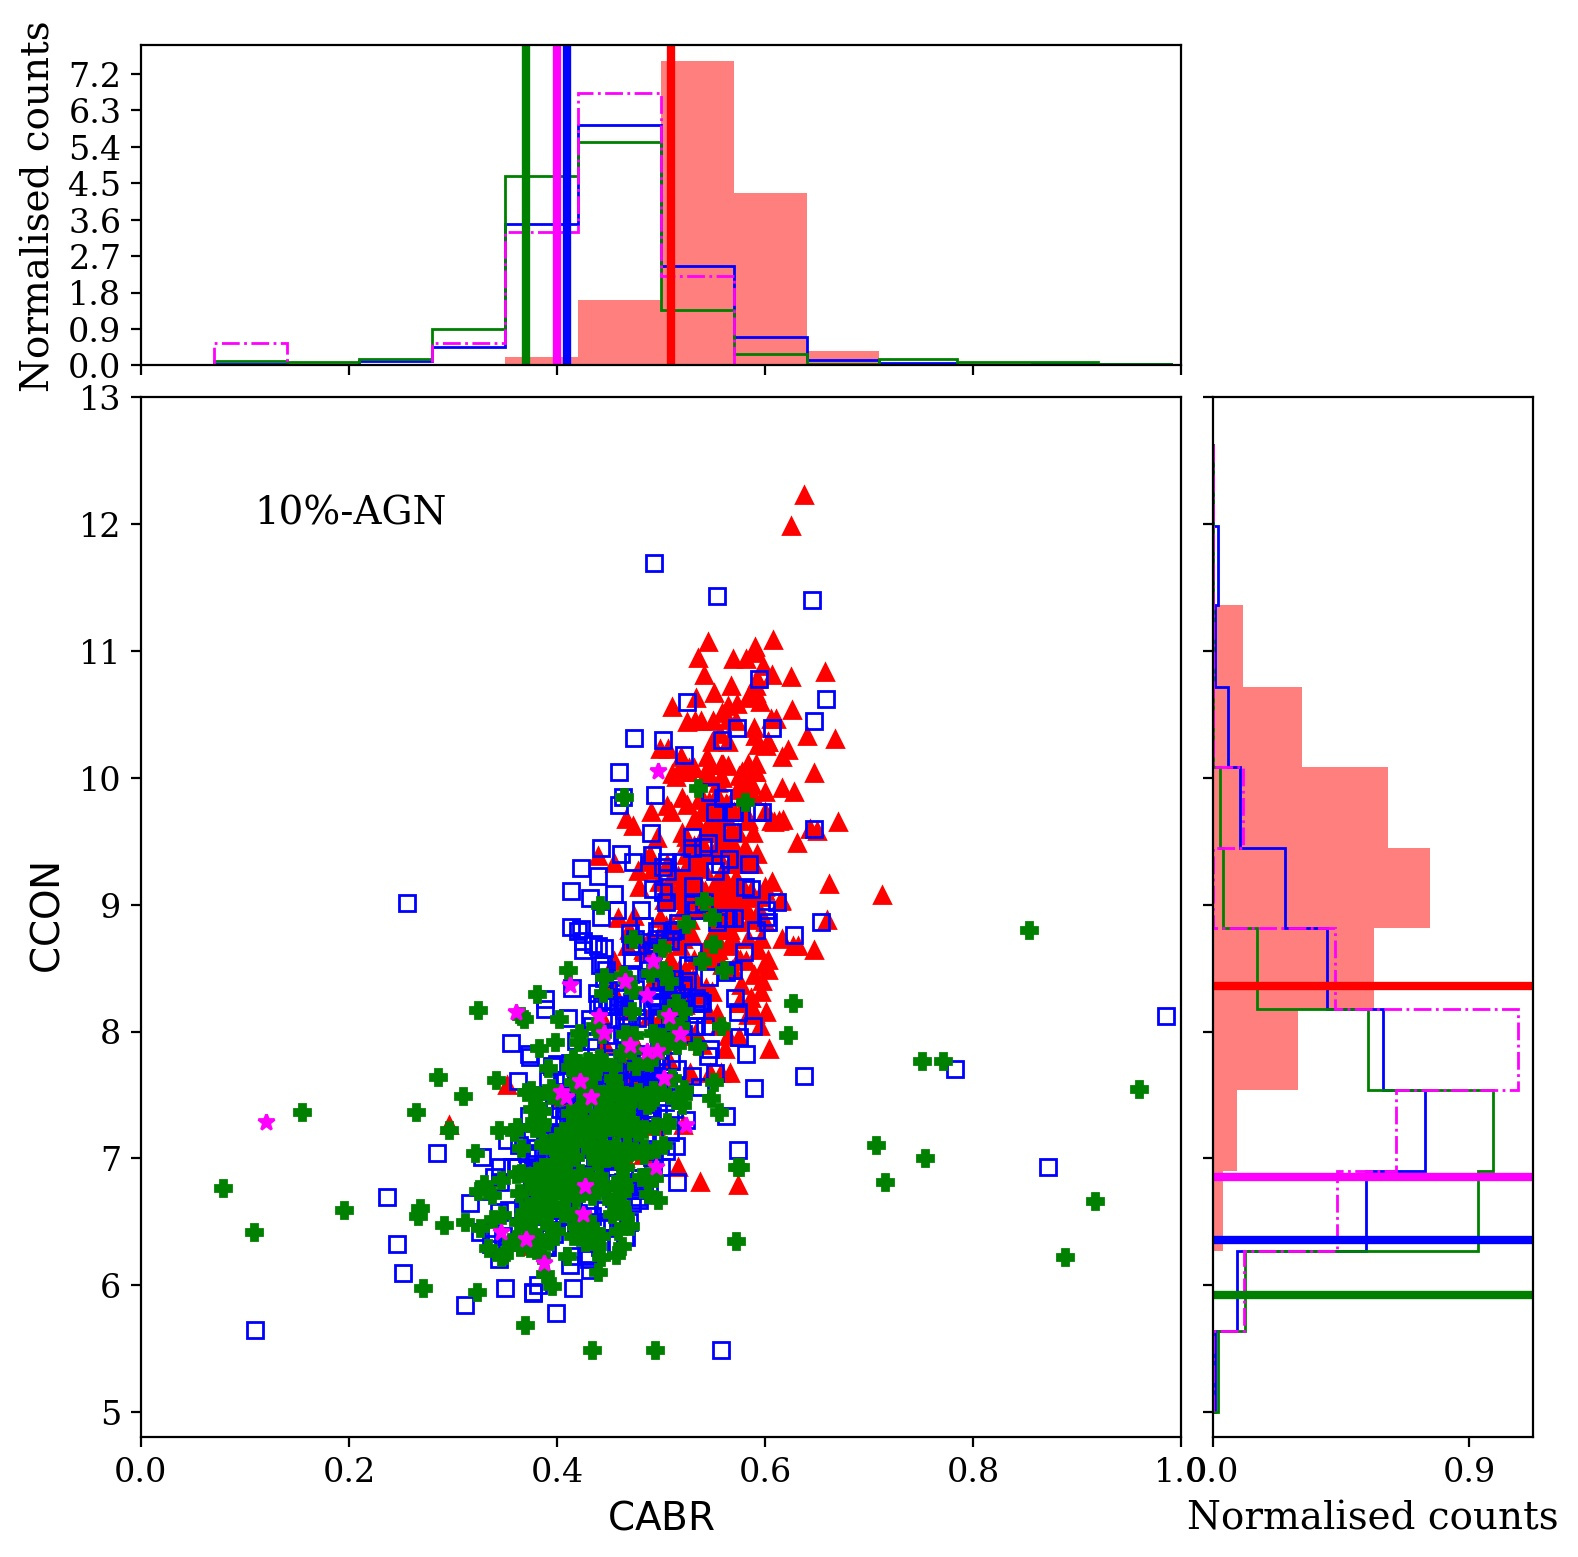
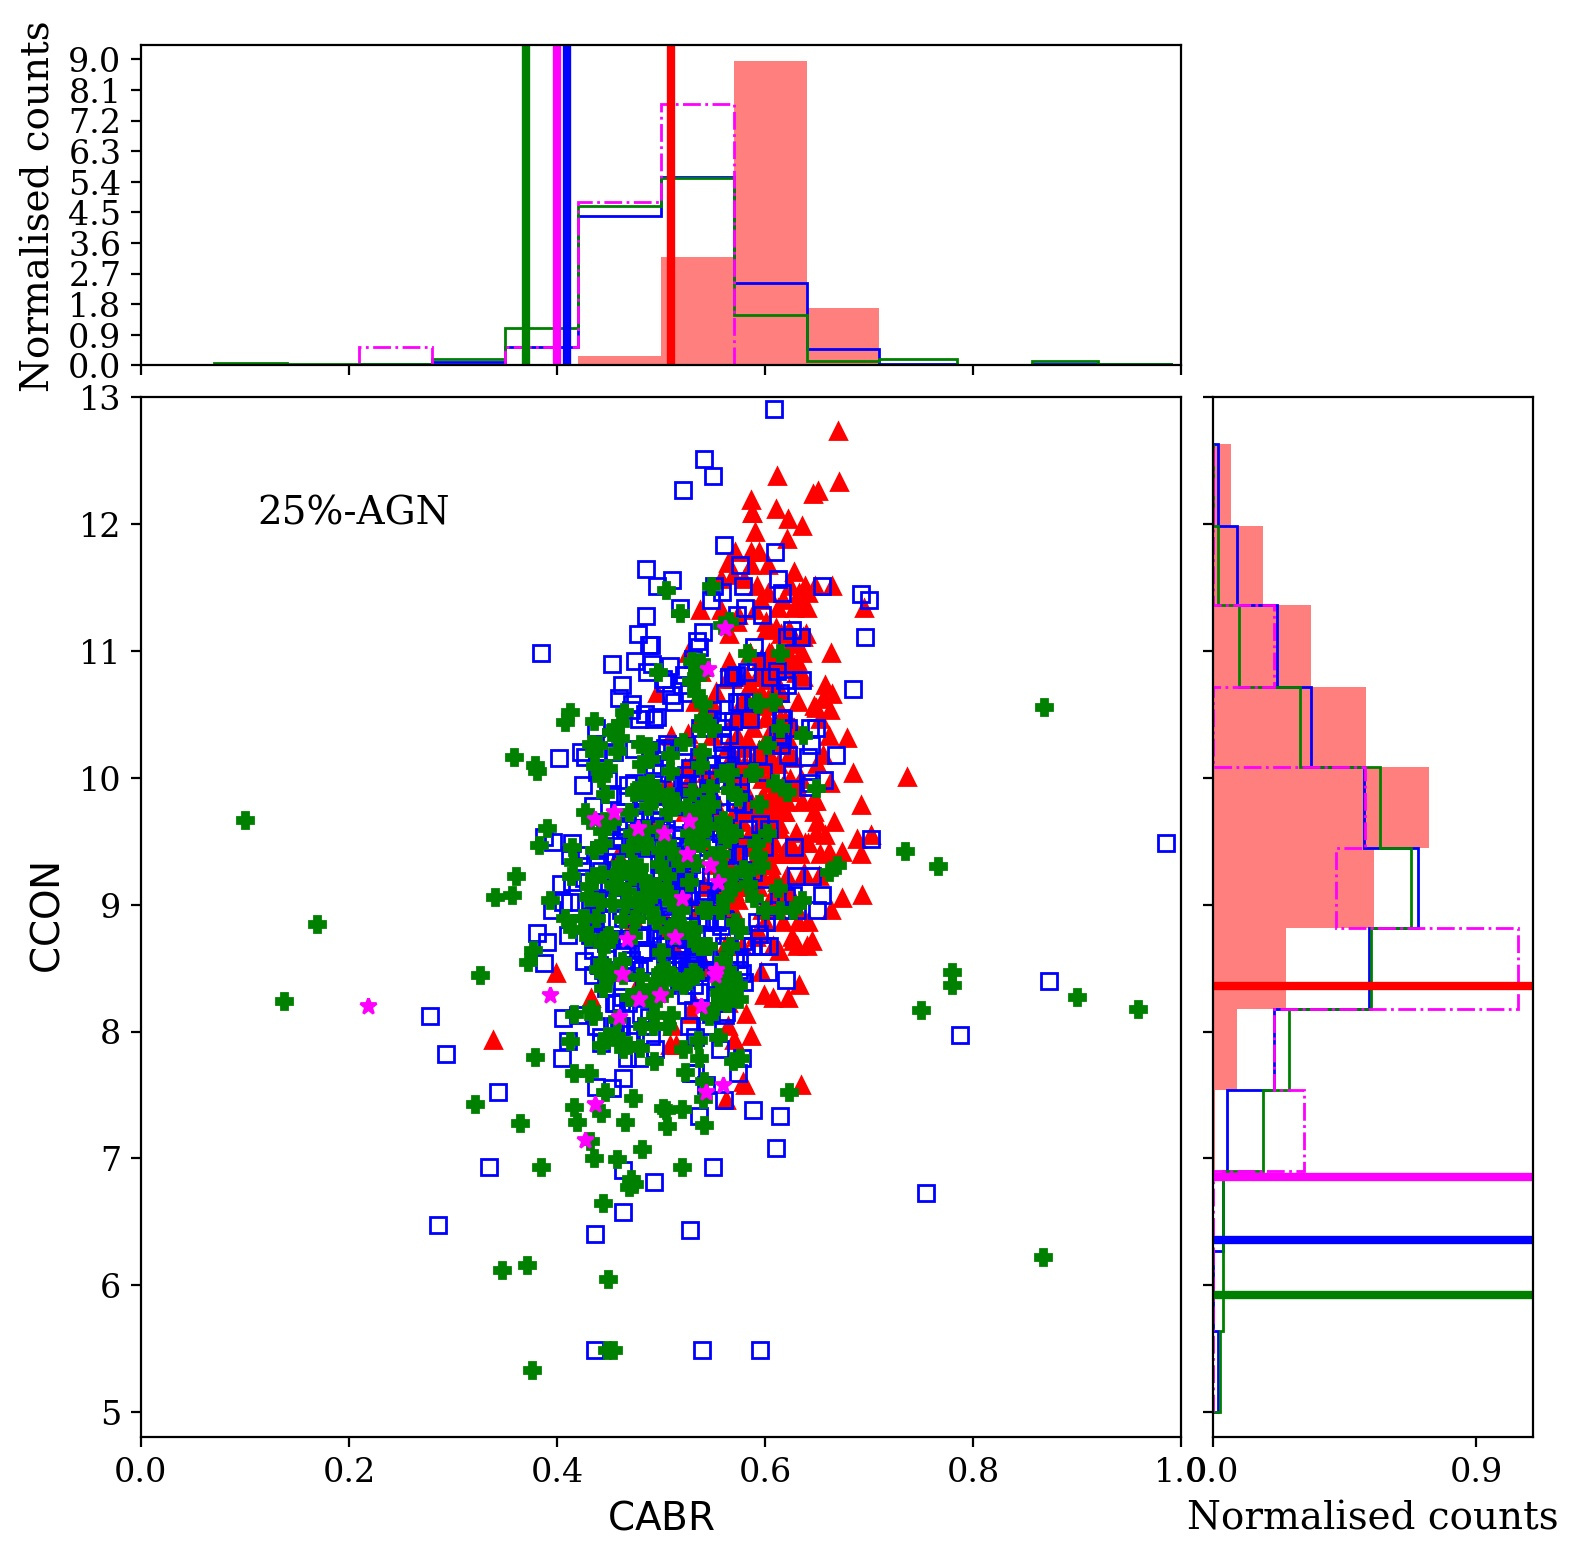
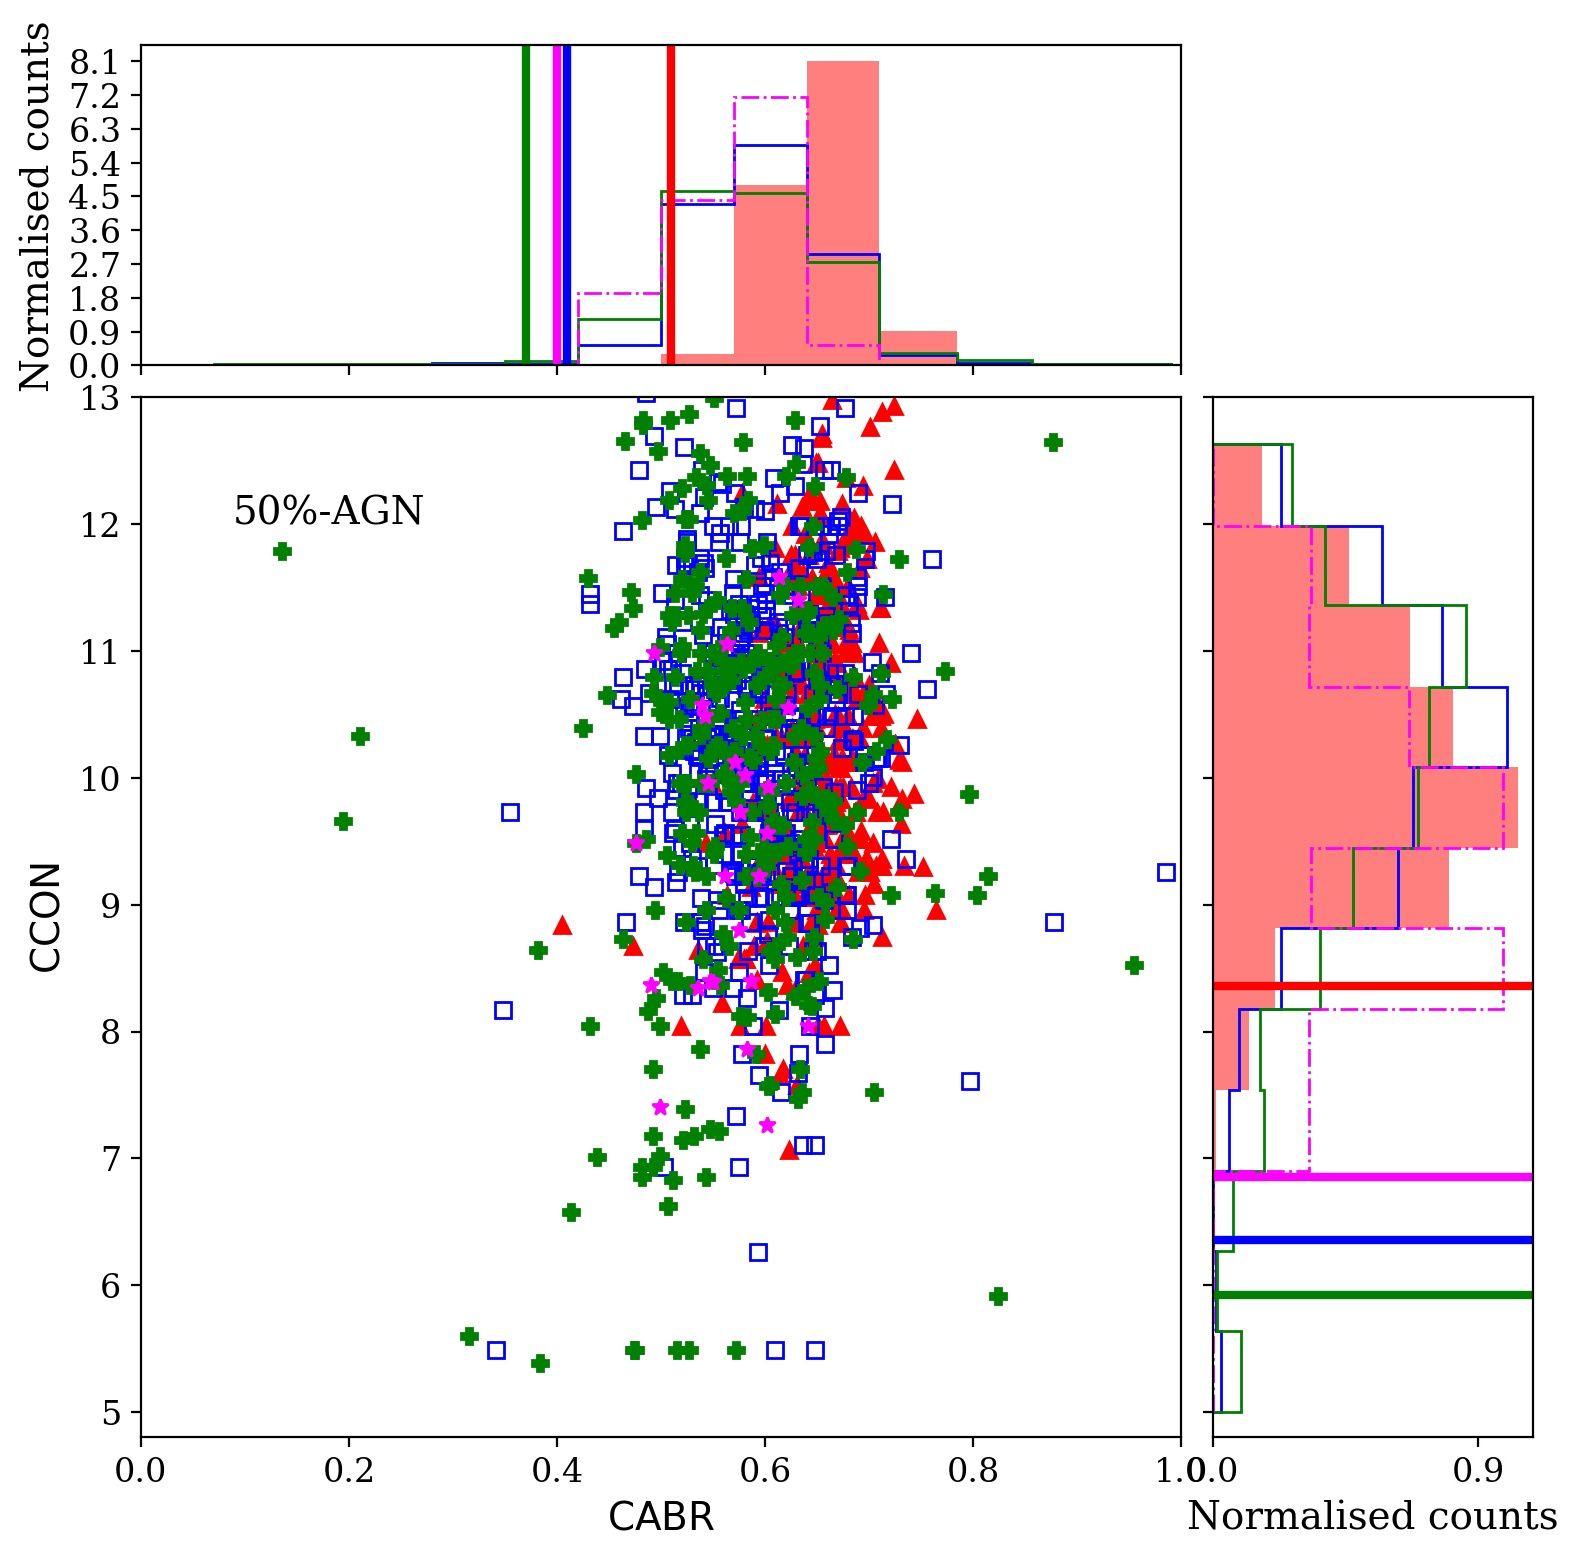
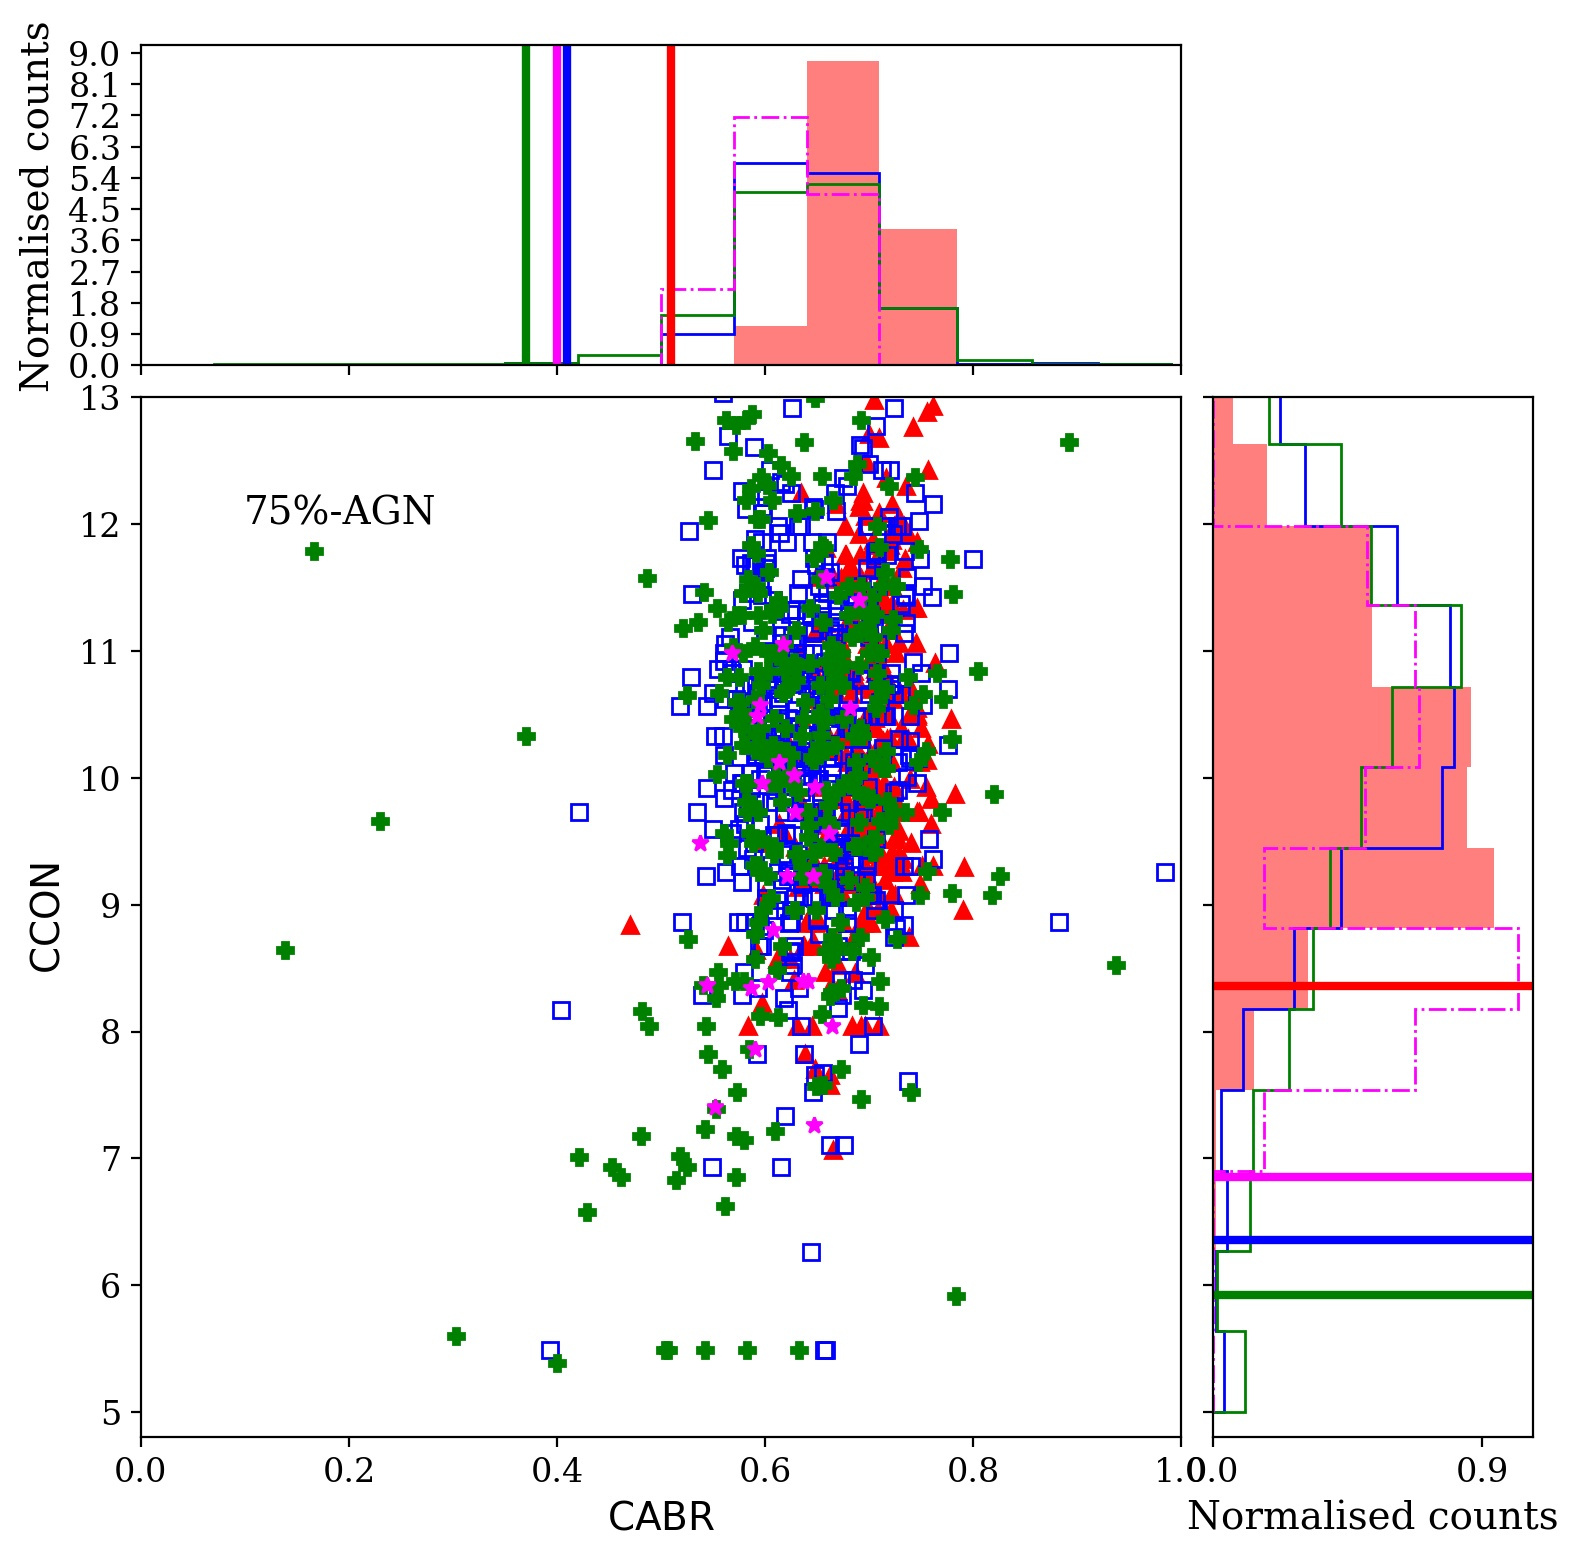
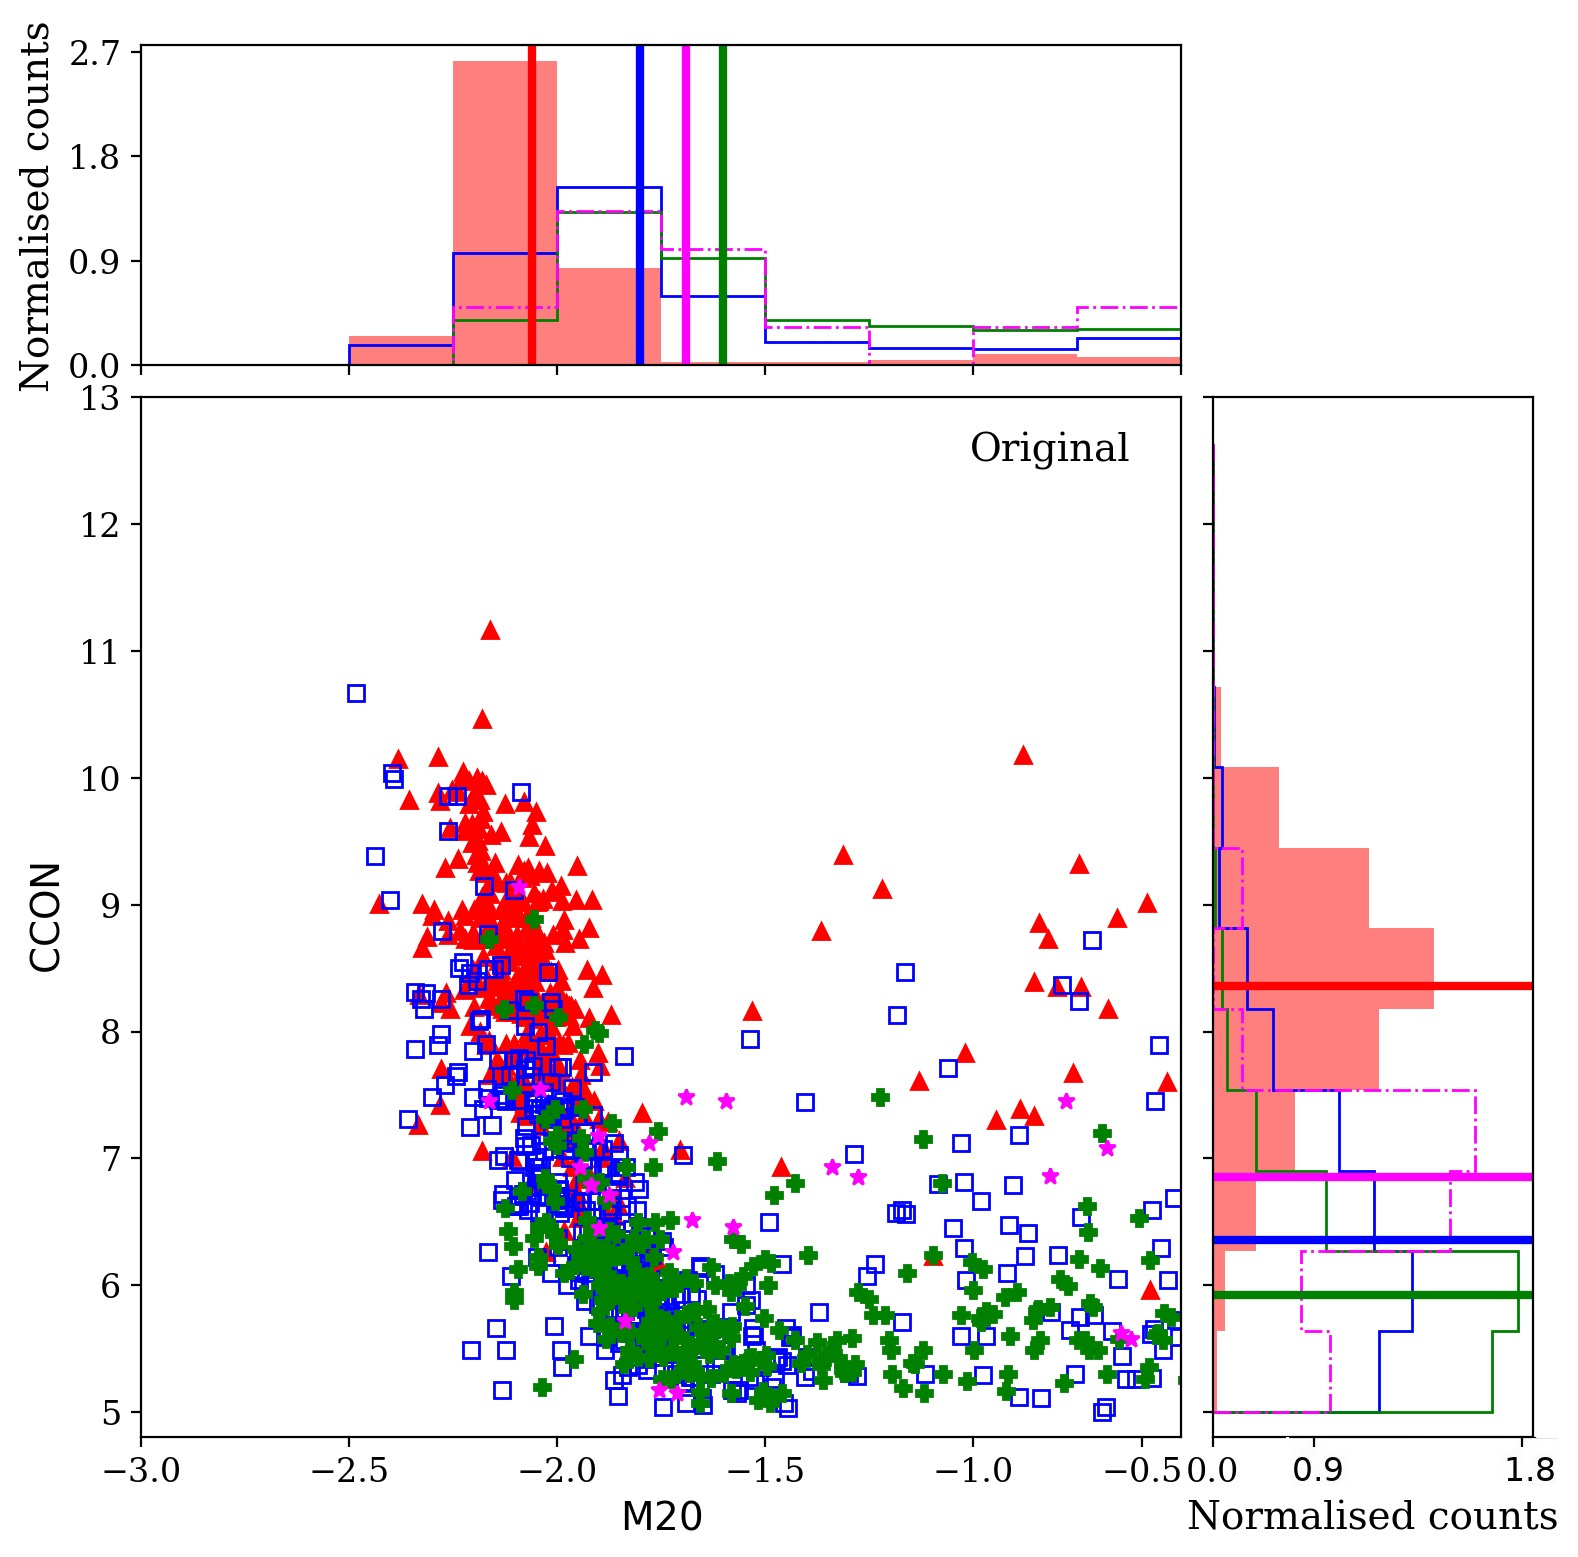
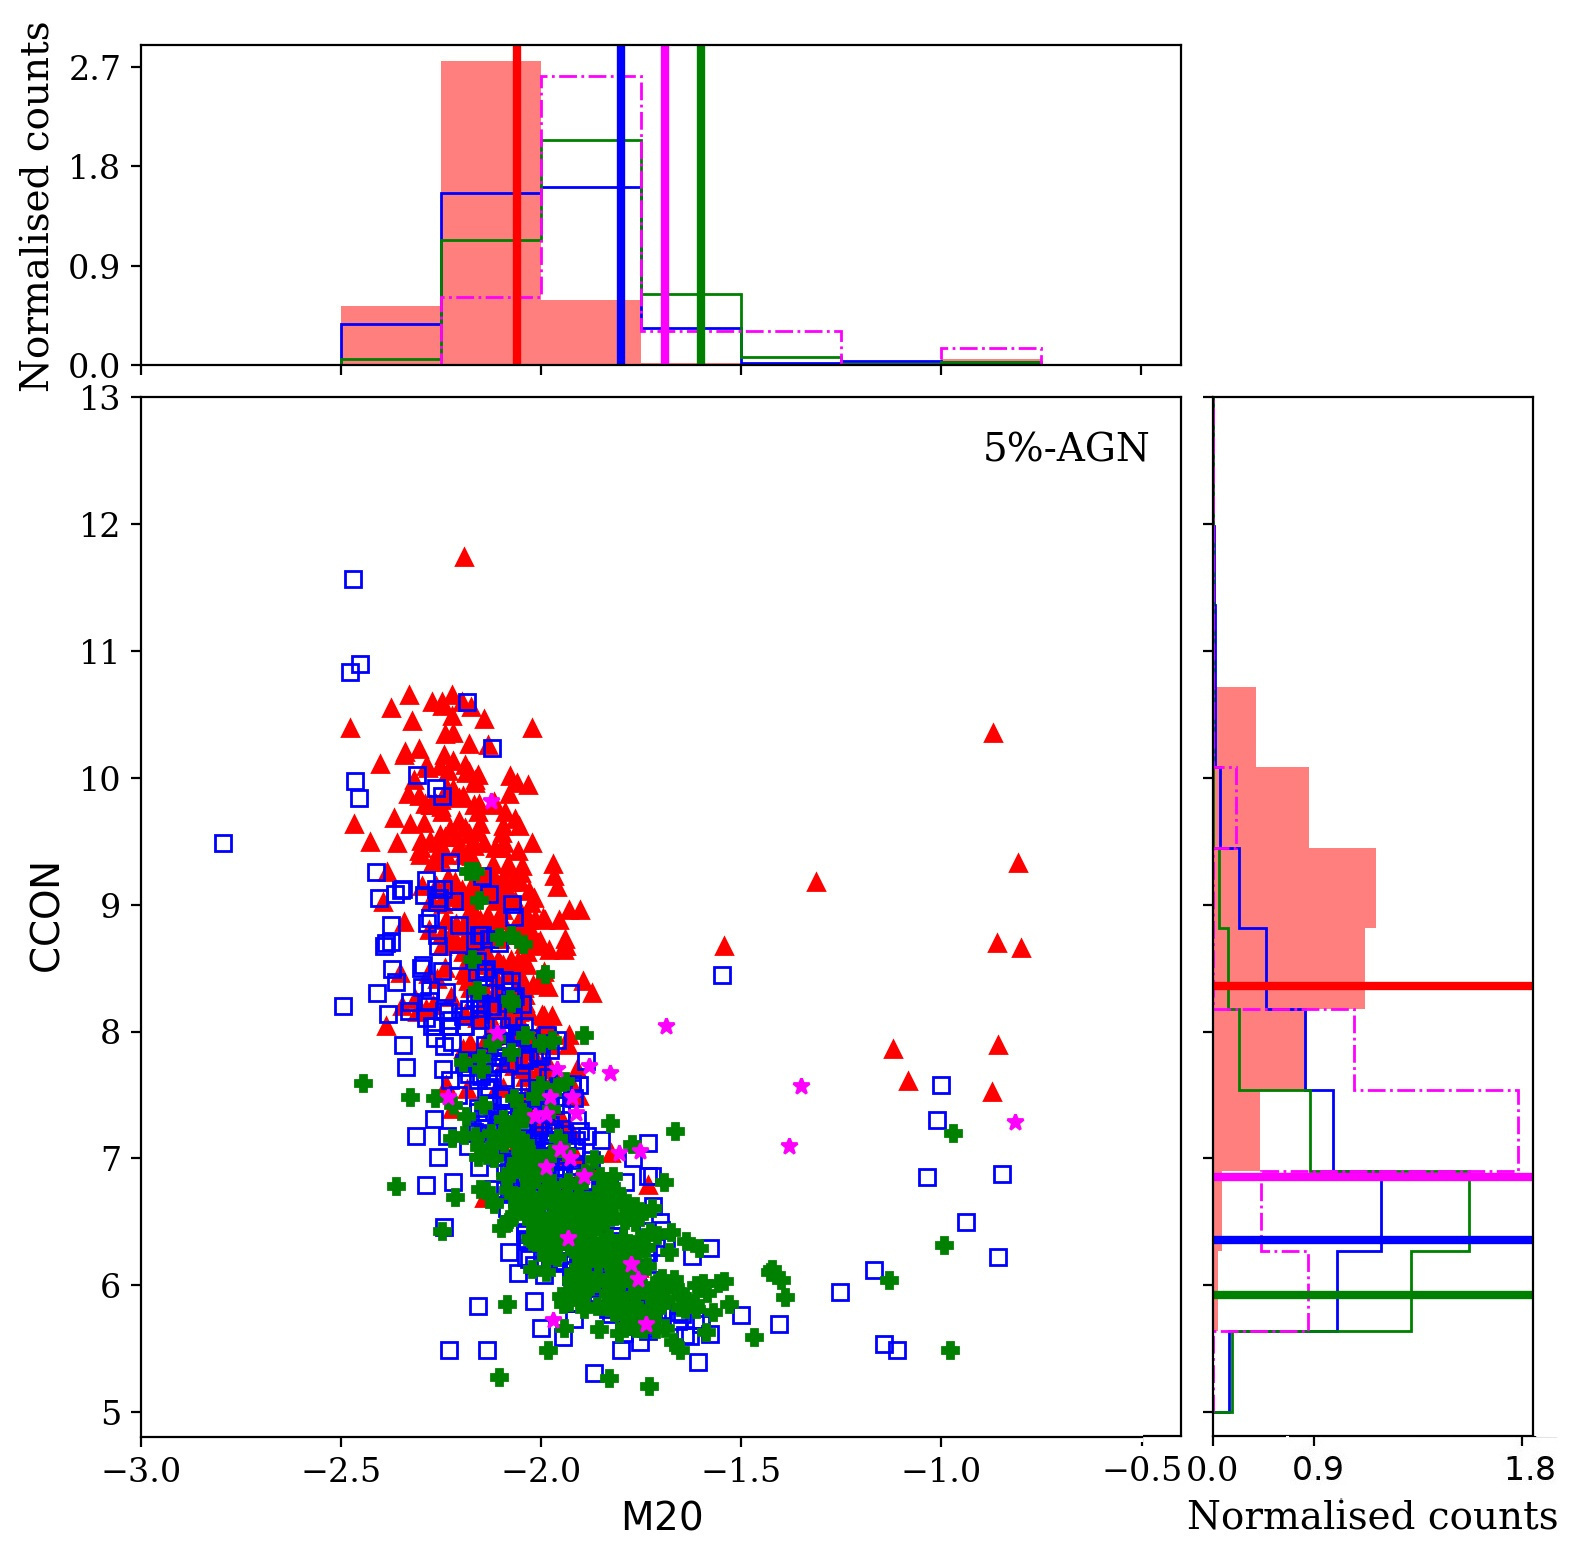
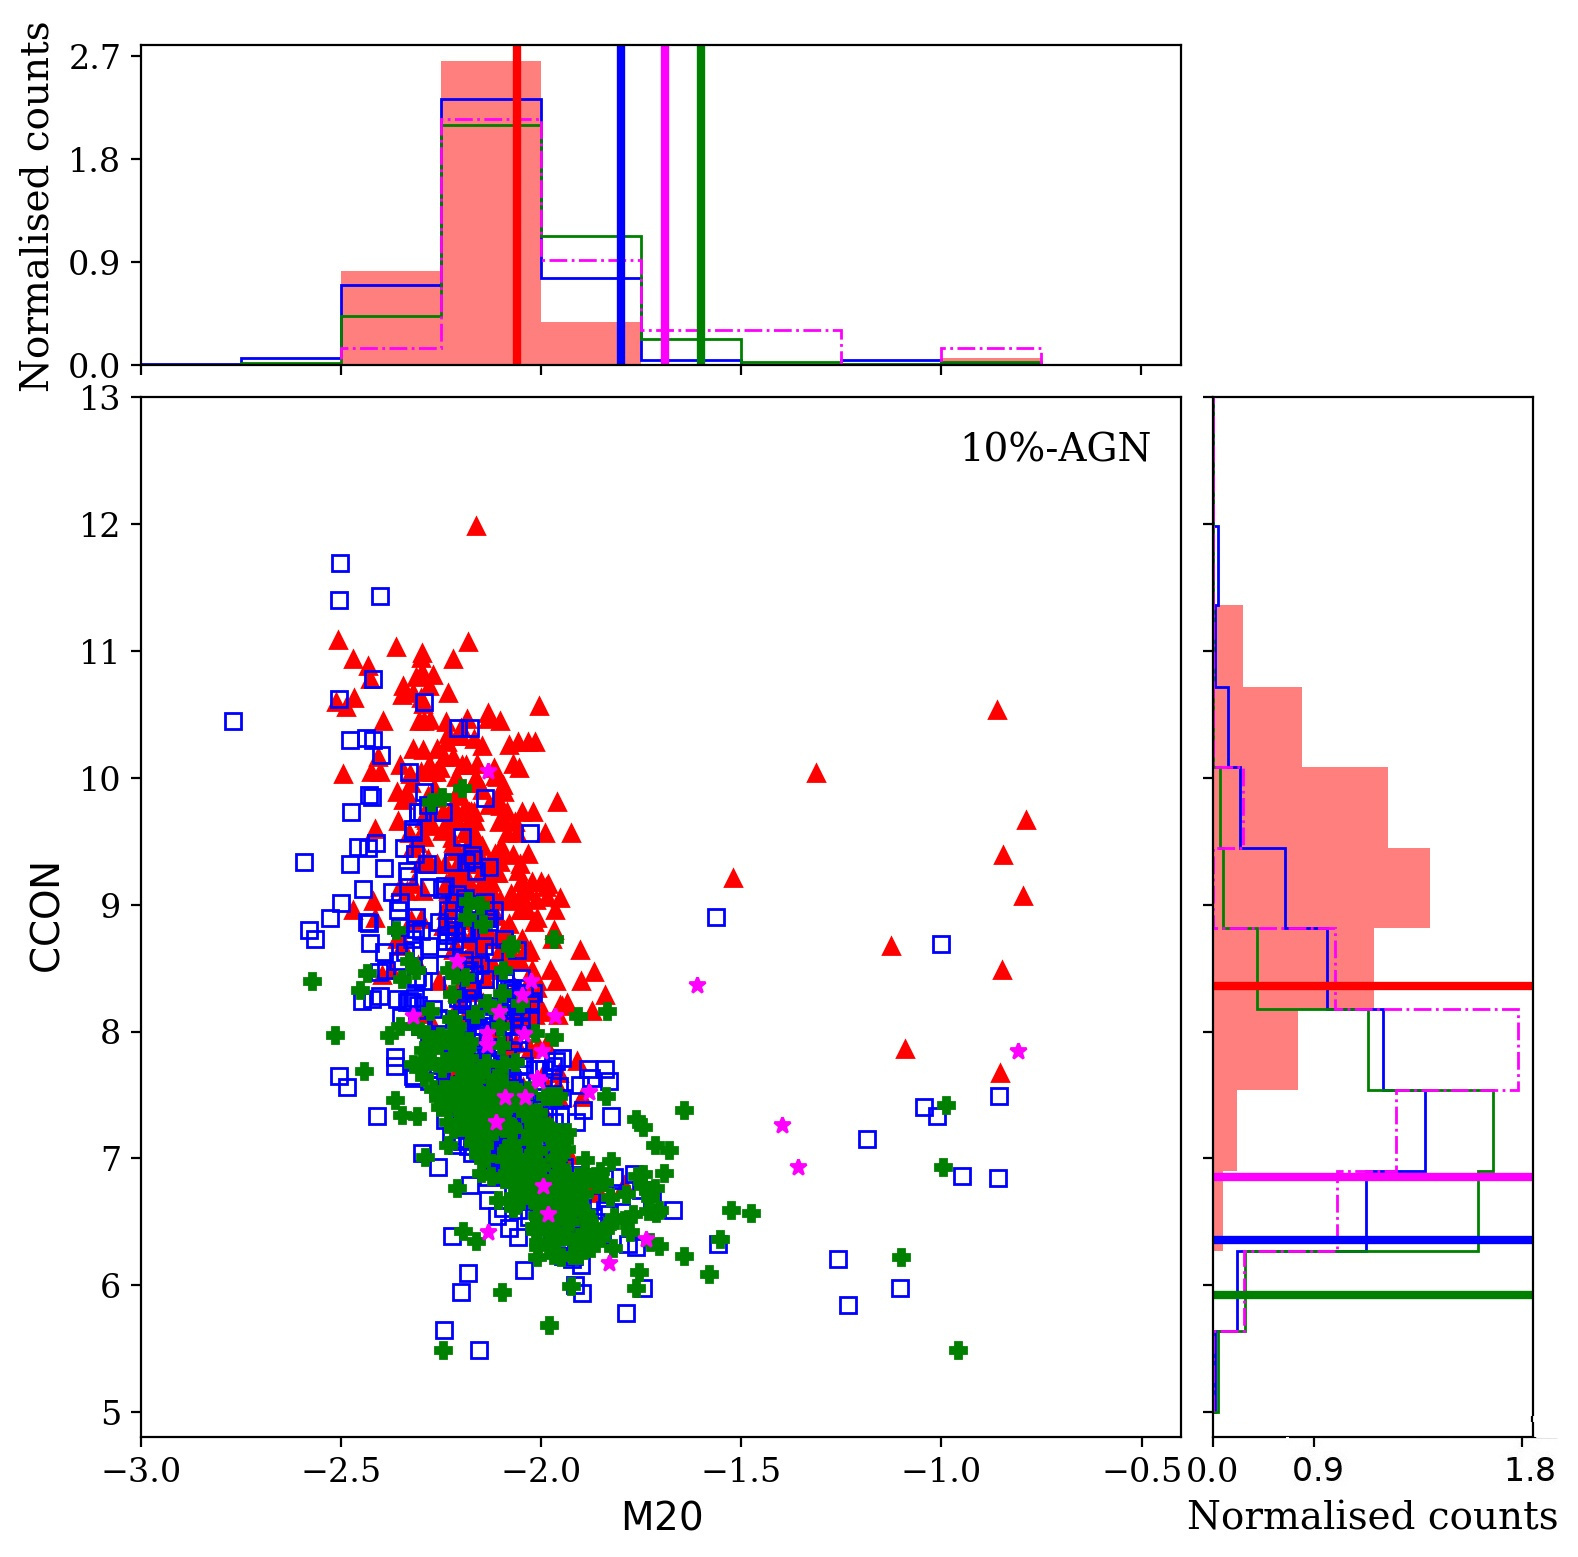
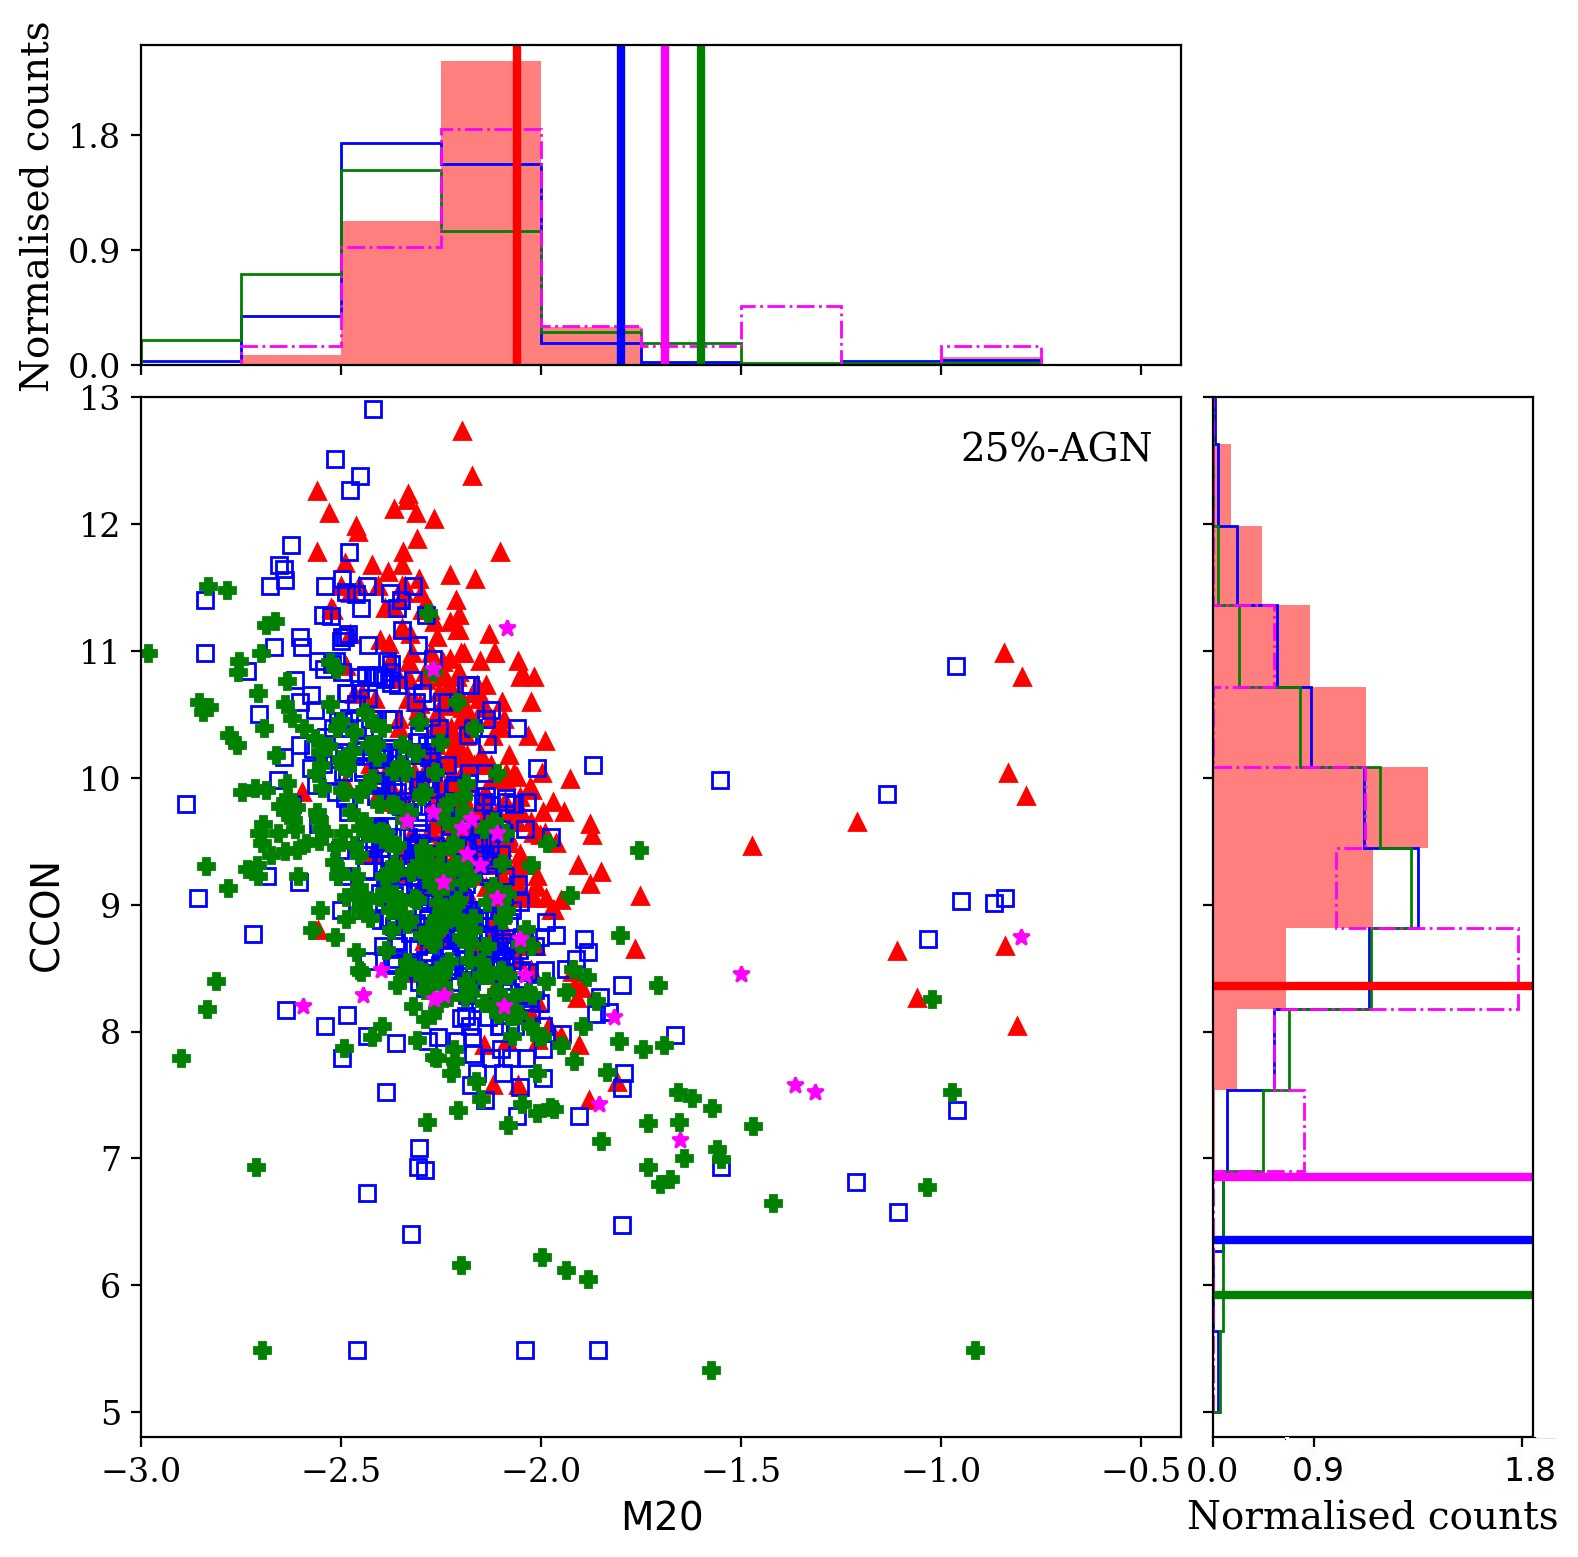
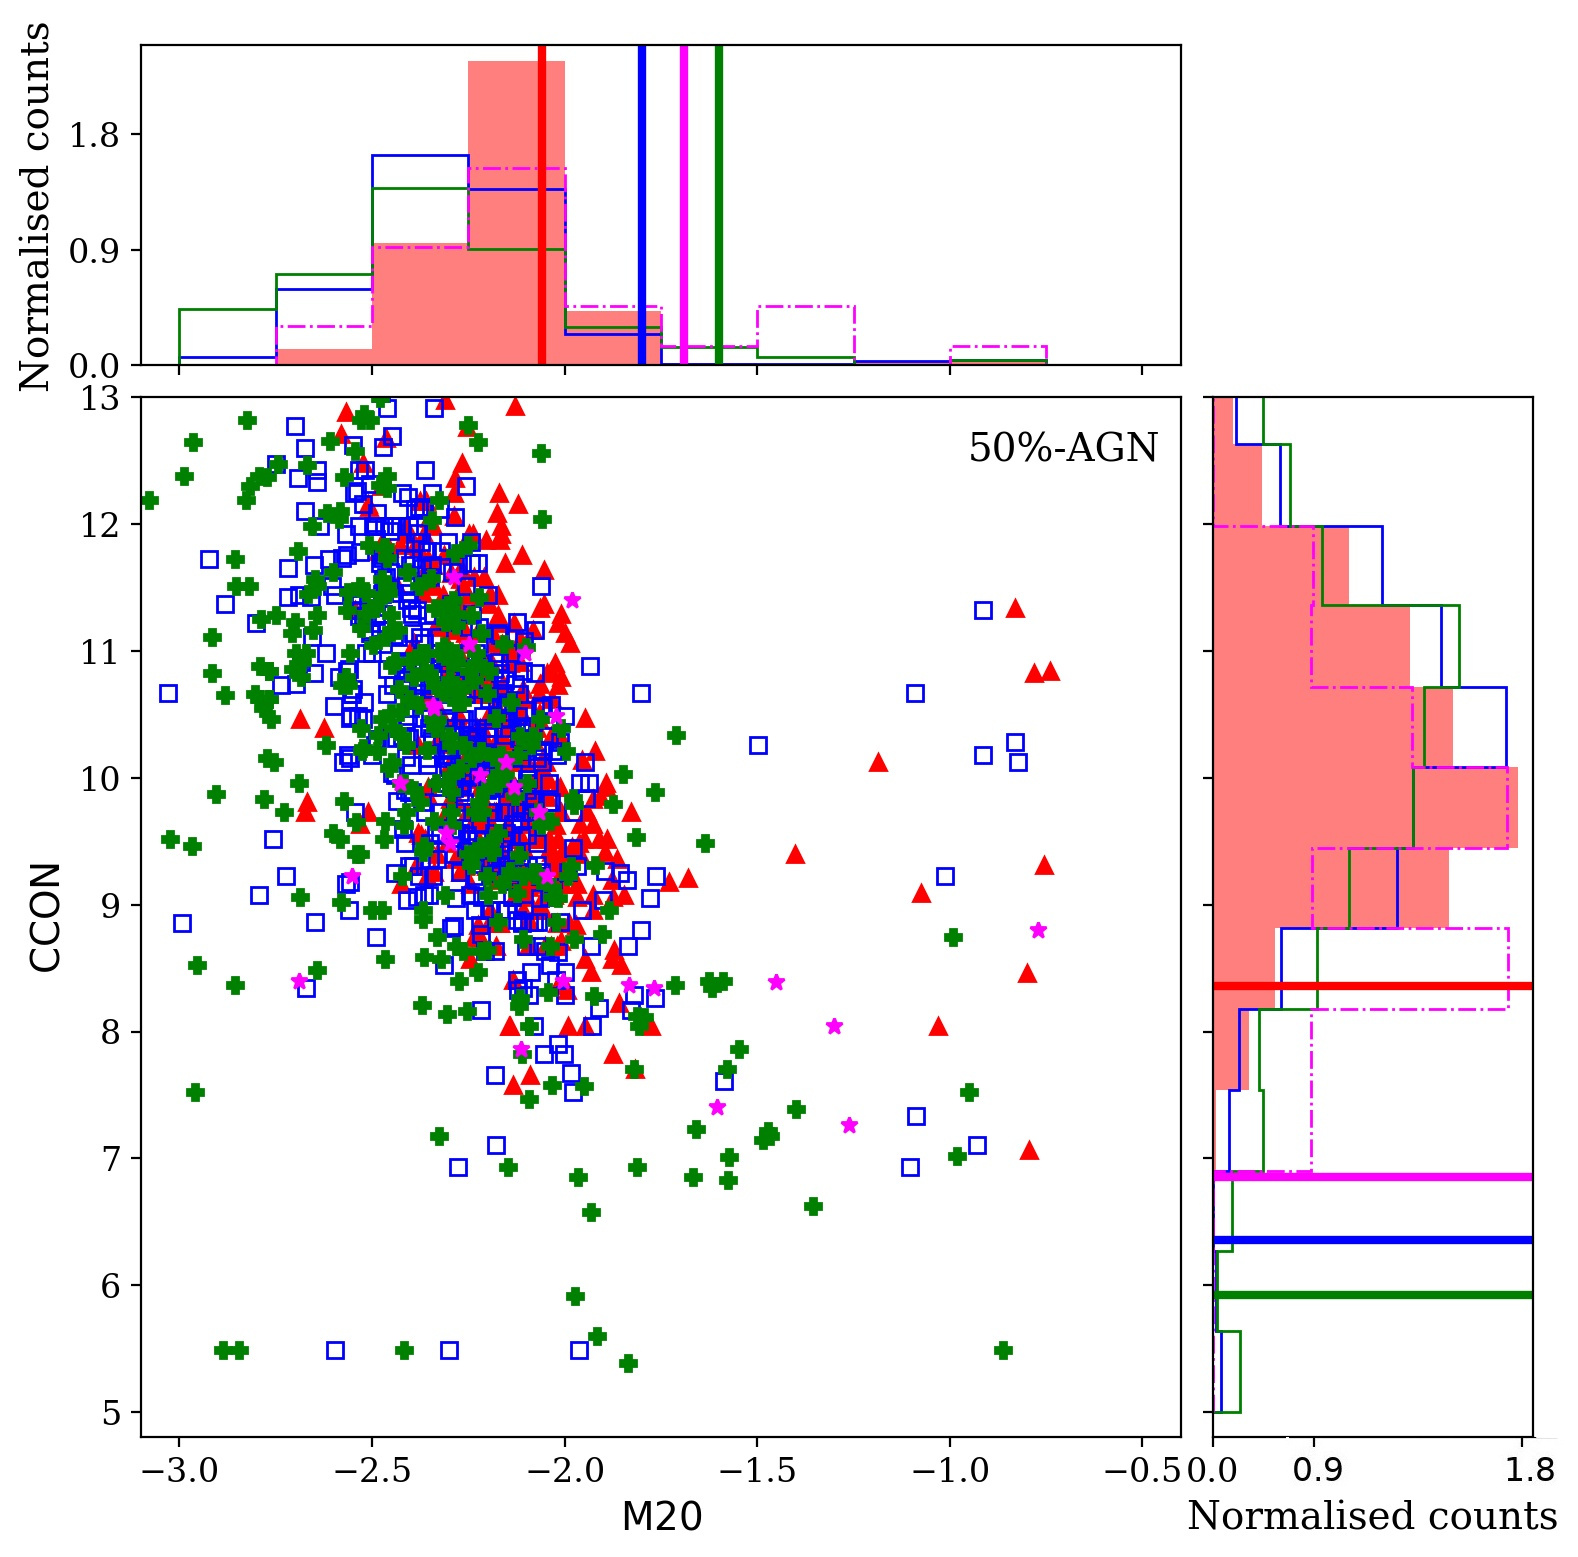
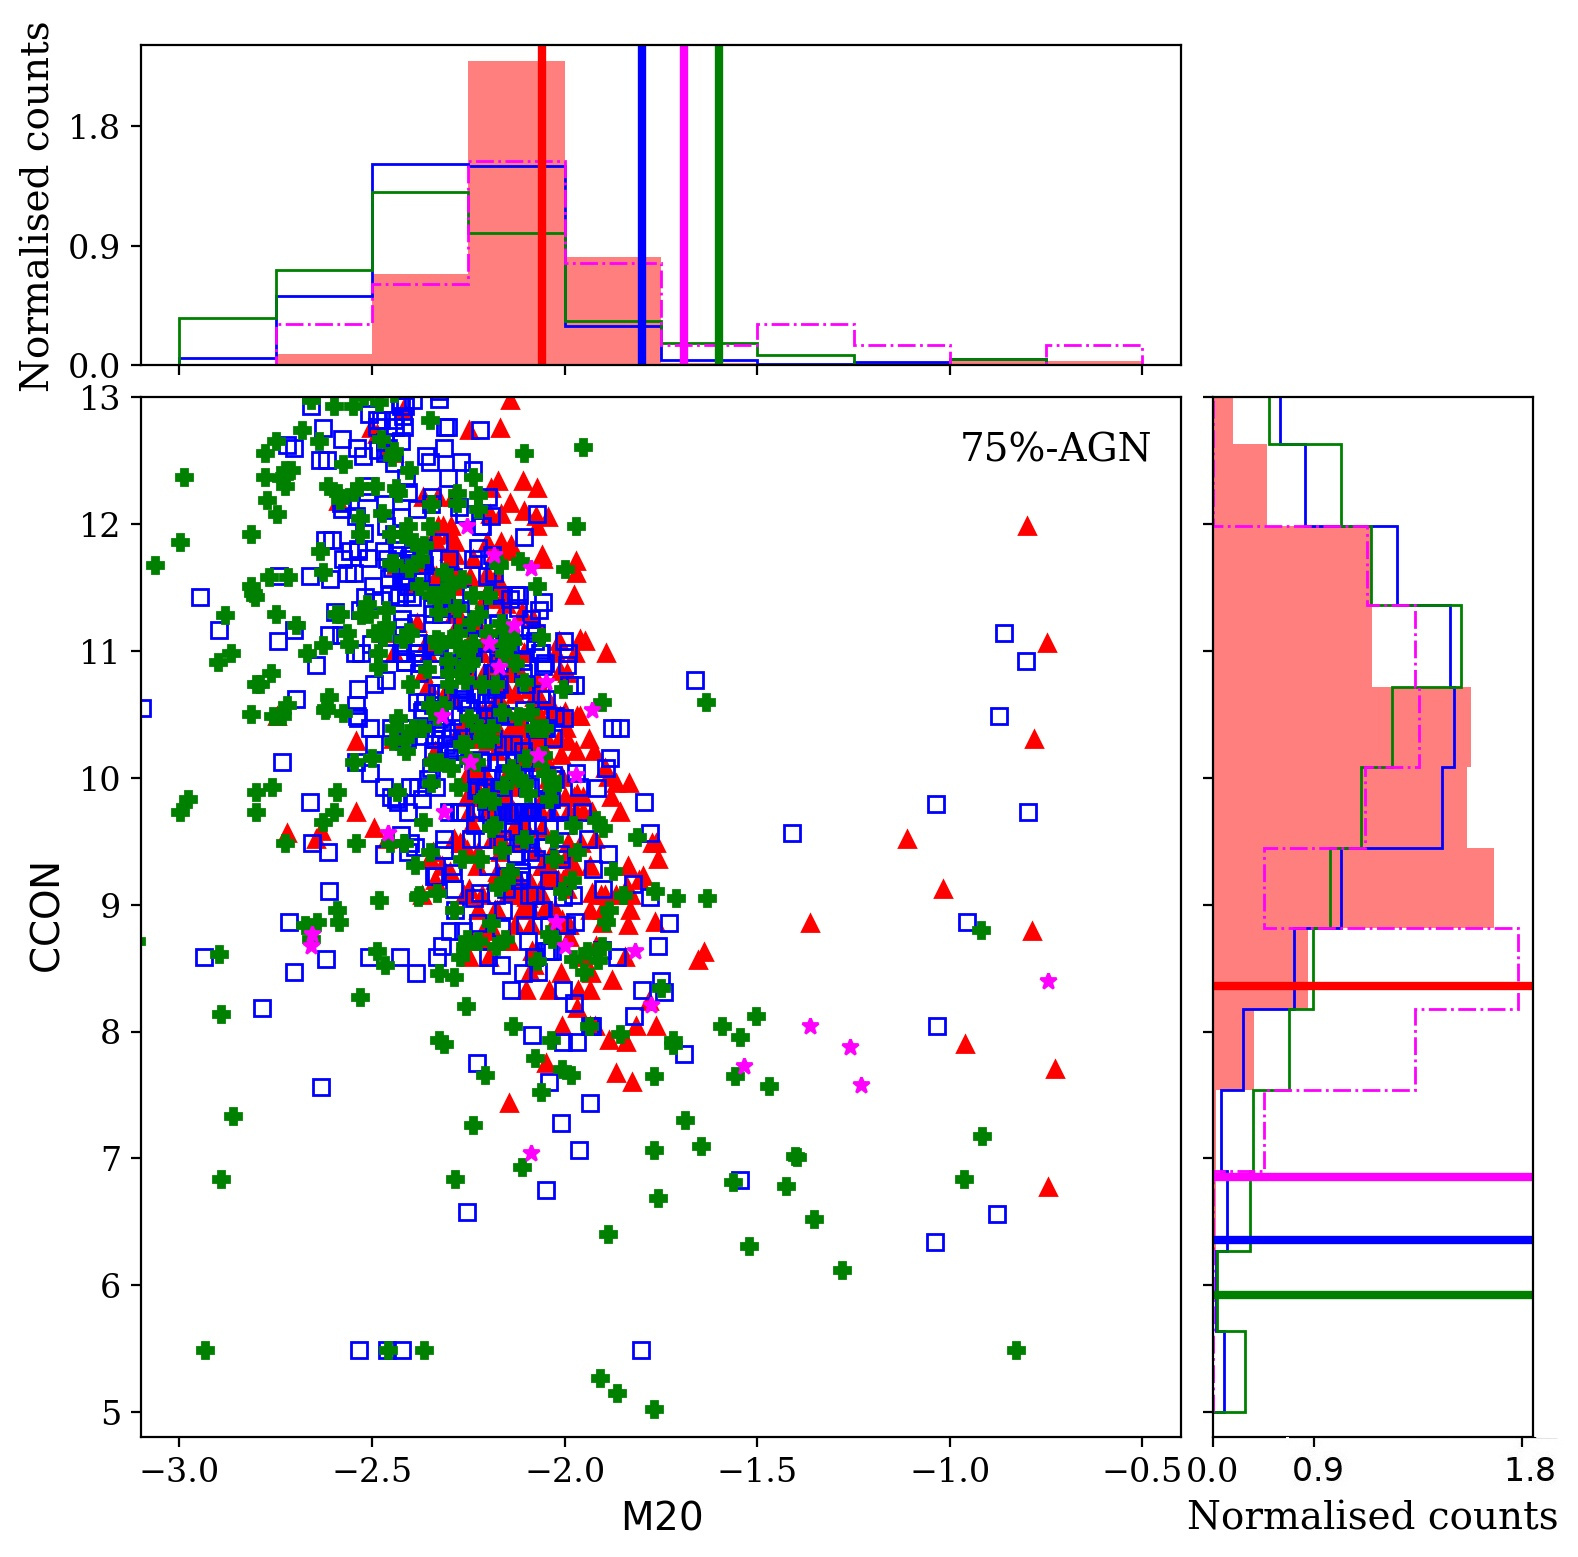
In this section, we analyse the effect of the AGN contribution on four of the most commonly used morphological diagnostic diagrams, that we selected since they have been broadly used in previous studies to separate between different morphological types (e.g., Abraham et al., 1994, 1996, 2003; Conselice et al., 2000, 2003; Lotz et al., 2004; Yagi et al., 2006; Scarlata et al., 2007; Pierce et al., 2010; Pović et al., 2013, 2015; Pintos-Castro et al., 2016; Tarsitano et al., 2018; , 2019; Mahoro et al., 2019). Figures 12 to 15 show the following diagrams: ASYM vs. CABR, CABR vs. GINI, CCON vs. CABR, and CCON vs. M20, respectively. In each figure, we represent the original local sample of non-active galaxies (top-left plot), and simulated active galaxies with added 5% (top-right), 10% (middle-left), 25% (middle-right), 50% (bottom-left), and 75% (bottom-right) of AGN contribution to the total flux. In all plots we represent the location of early-type (red), early-spiral (blue), late-spiral (green), and peculiar (magenta) galaxies. The distribution of each parameter for the four morphological types are also represented as attached histograms on the top and to the right axes of each diagram. In line with the results obtained in the previous two sections, in general, it can be observed that for up to 10% of AGN contribution the distribution of simulated galaxies does not change significantly in comparison to the original samples. However, starting from 25% of AGN contribution larger contamination can be observed between different morphological types. Mix between early- and late-types becomes significantly larger when having strong AGN contribution of 50% and 75% to the total galaxy flux, making difficult the separation between these two types as discussed more in Sec. 5. For easier comparison with the original sample, in all histograms, as a reference we introduced the vertical lines that correspond to the median values of parameters of different morphological types. Quantification for each parameter is given in Table 2.
5 Results and Discussion
As shown in Sec. 4., in general, when the light coming from an AGN is 25% of the total galaxy light, most of the used morphological parameters and therefore the morphological classification of AGN host galaxies can be significantly affected. We found that the classification of early-type galaxies (elliptical and lenticular) hosting an AGN will be more accurate than when dealing with spiral and peculiar hosts. Difficulties in classifying late-type galaxies in comparison to early-types have been already observed in the past, e.g., when studying the effect of survey resolution and depth on the morphological classification of galaxies (e.g, Pović et al., 2015, and references therein).
In general, when introducing the different AGN contributions, ASYM parameter varies very little. However, taking into account previous studies, this parameter is sensitive to noise (Pović et al., 2013) and is measured for a smaller sample of galaxies, and therefore in galaxy classification it shall be used in combination with other parameters. In addition to ASYM, we found GINI to be one of the most stable parameters in the case of both early- and late-types, showing variations 20% up to the 25% of AGN, which still permits the separation between early- and late-types. GINI has been also suggested to trace well sub-structures in galaxies (e.g., Lisker et al., 2006), mergers and interacting galaxies (e.g., Lotz et al., 2004, 2008a, 2008b), strong-lensed galaxies (e.g., Florian et al., 2016a, b), and to correlate with stellar mass tracing the overall structure of a galaxy better than any other morphological parameter (e.g., Zamojski et al., 2007). However, it has been also shown that GINI depends strongly on the signal-to-noise ratio and the choice of the aperture within which it is measured (e.g., Lisker et al., 2008; Pović et al., 2015). In addition to this, we saw that light concentration parameters in general (including CABR, CCON, and M20) are less affected by AGN in early-type than in late-type galaxies, and more stable than SMOOTH parameter which shows higher changes when an AGN is present (although lower when dealing with late-type sources), as shown in Table 2.
Previous findings refer to the observed variation in parameters when different AGN contributions are taken into account. However, not necessarily a stronger variation means that a parameter is less suitable for morphological classification. We can observe this in Fig. 11. ASYM parameter shows to have well separated median values of all four morphological types even up to 50% of the AGN contribution. CABR and GINI also shown to be efficient for separating early- and late-type (early-spiral, late-spiral, and peculiar) galaxies independently on AGN contribution, where GINI shows better separation between different late-types up to 25% of AGN. CCON can be also used in classifying early- and late-type AGN hosts up to 25% of AGN. M20 shows strong mix between morphological types, starting from 10% of AGN contribution, while SMOOTH parameter shows to be inefficient in classifying active galaxies. These findings with median distributions of parameters can be compared with those in Figs. 12 to 15 where the whole samples are represented and similar trends can be observed. Morphological diagrams based on ASYM vs. CABR (Fig. 12) and CABR vs. GINI (Fig. 13) parameters remain much more stable on AGN contribution, reaching levels of contamination of early-types by late-types of 30 - 35% for 25% of AGN contribution, with a slight increment of 5-10% when dealing with stronger AGN. We can see in both Fig. 12 and 13 that even at 50% and 75% of AGN contribution to the total optical light, these diagrams still maintain different distributions of early- and late-type galaxies. On the other hand, when using CCON and/or M20 parameters in Figs. 14 and 15 contamination is 40% for 25% of AGN contribution, while for stronger AGN, distributions of early- and late-type galaxies almost totally overlap. Therefore, taking all previous into account, we recommend GINI, CABR, and ASYM to be more suitable to be used in non-parametric methods of morphological classification of AGN host galaxies, even if combined with machine learning. However, we remind once again that for stronger AGN (above 25% of contribution to the total light), special attention should be taken into account for a reliable classification of AGN hosts at z 0, considering the possibility to quantify the AGN contribution to the total optical light of a galaxy and to remove the AGN contribution before going through any detailed morphological classification.
To our knowledge, only a few of the previous studies considered the effect of the AGN contribution on the morphological classification of their host galaxies. Cardamone et al. (2010) studied the effect of AGN on the rest-frame colours using a sample of X-ray detected obscured and unobscured AGN in the Extended Chandra Deep Field-South (ECDF-S) at 0.8 z 1.2. They found an insignificant effect of the AGN on the galaxy colour in the case of moderate luminosity, obscured AGN, with a more significant effect for very blue, very luminous AGN (sources out of the blue cloud being classified as quasars, see their Fig. 1). A similar study considering the effect of AGN on the host colours has been carried out by Wang et al. (2017) for AGN of moderate X-ray luminosity up to the redshift of z 2.5; again significant difference is found in the distribution of U - V rest-frame colour between active and non-active galaxies. These results go in line with several others showing that in moderate luminosity AGN, the AGN contribution to the total optical light is not significant (e.g., Silverman et al., 2008; Xue et al., 2010; Simmons et al., 2011).
Gabor et al. (2009) studied the effect of AGN on two morphological parameters, asymmetry, and concentration. They used the same asymmetry parameter as defined in our work, finding an insignificant difference between asymmetries of active and non-active galaxies. However, in their concentration index, defined similarly to CCON, but using instead of , the authors found much larger values of the concentration index when an AGN is present, that is in line with our findings and Fig. 11. The most similar work to ours is that by Pierce et al. (2010), where they used a sample of 600 non-active galaxies from the AEGIS survey (Davis et al., 2007) at 0.2 z 0.6, and analysed the effect of an AGN on four morphological parameters: Gini, asymmetry, Concelice concentration index, and M20 moment of light. They concluded that AGN contributions above 20% have an impact on most of the morphology measurements that depend on the morphological characteristics of the original galaxies. In comparison to Pierce et al. (2010), we provide a more detailed analysis, considering a larger sample of testing non-active galaxies, with precise known visual morphologies, testing five different AGN contributions, and adding two more parameters (CABR and SMOOTH) that were not analysed previously, and that very often are used simultaneously with other parameters in the morphological classification of galaxies (e.g., Huertas-Company et al., 2008, 2009; Pović et al., 2013; Pintos-Castro et al., 2016; , 2019; Mahoro et al., 2019)
Finally, we recall that the results obtained in this paper refer to the AGN effect on the morphological properties of their host galaxies at z 0. When going to higher redshifts and fainter magnitudes, and due to the effect that both the survey depth and resolution have on the morphological classification of galaxies, the study will be more complex, as mentioned above and analysed in detail in Pović et al. (2015). We plan to proceed with this approach in a forthcoming paper (Getachew et al., in prep.).
6 Summary and conclusions
In this paper, we provide a detailed study regarding the effect of the AGN on the morphological properties of their host galaxies and the corresponding morphological classification. We studied six parameters commonly used in non-parametric methods, often in combination with machine and deep learning, to classify galaxies in terms of their morphology. These parameters are: Abraham concentration index (CABR), Gini coefficient (GINI), Conselice-Bershady concentration index (CCON), moment of light (M20), asymmetry index (ASYM), and smoothness (SMOOTH). We used the sample of 8000 local galaxies with visual morphological classification in g-band (Nair & Abraham, 2010) to select a sample of 2301 visually classified non-active local galaxies. We simulated their AGN counterparts by adding in their centers an AGN contribution of 5%, 10%, 25%, 50%, and 75% of the total galaxy flux. For the AGN construction for each galaxy we used its corresponding PSF, described by the Moffat function. We then measured in a consistent way the six morphological parameters in both the original images and all simulated images. We finally studied how the presence and relative contribution of the AGN may affect each of the morphological parameters in relation to galaxy morphology, and the final classification of active galaxies. Our main findings are the following:
-
•
When observing the total sample of galaxies, independently on their morphology, we observe that significant change of 30% in parameters corresponds to AGN contributions to the total optical flux of 25% and above, except in ASYM which almost doesn’t vary when AGN is added.
-
•
An impact of AGN on different morphological parameters vary depending on galaxy morphology. Light concentration parameters (e.g., CABR, GINI, M20, and CCON) are less affected by AGN in early-type galaxies, while SMOOTH is less affected in late-types. However, in general, spiral and peculiar galaxies will be more affected by AGN contribution than early-type galaxies.
-
•
GINI and ASYM have been found to be some of the most stable parameters when dealing with morphological classification of active galaxies, in the case of both early- and late-types, in combination with CABR. CCON and M20 can be used for classifying both early- and late-type AGN hosts up to 10% - 25% of AGN contribution to the total optical light, but not higher. We suggest avoiding SMOOTH parameter when classifying active galaxies, or to use it at least in combination with other parameters.
-
•
In line with previous, morphological diagrams based on the combination of ASYM, CABR, and GINI parameters are much more stable, and even when dealing with 50% and 75% of AGN contribution, a significant fraction of 50% of early- and late-type galaxies can still be classified. This is not the case when either CCON and/or M20 parameters are included, when 40% contamination between early- and late-types has been obtained for 25% of AGN contribution, and 60% in case of 50% and 75% of AGN contribution to the total optical light.
Acknowledgments
We thank the anonymous referee for accepting to review this paper, giving us constructive comments that improved our manuscript. TGW acknowledges the support from Bule Hora University under the Ministry of Science and Higher Education. TGW, MP, and ZBA acknowledge financial support from the Ethiopian Space Science and Technology Institute (ESSTI) under the Ethiopian Ministry of Innovation and Technology (MInT). TGW, JM, and MP acknowledge support given through the grant CSIC I-COOP 2017, COOPA20168. MP, JM, JP, and IMP acknowledge the support from the Spanish Ministerio de Ciencia e Innovación - Agencia Estatal de Investigación through projects PID2019-106027GB-C41 and AYA2016-76682C3-1-P, and the State Agency for Research of the Spanish MCIU through the Center of Excellence Severo Ochoa award to the Instituto de Astrofísica de Andalucía (SEV-2017-0709). In this work, we made use of Virtual Observatory Tool for OPerations on Catalogues And Tables (TOPCAT).
DATA AVAILABILITY
In support of this study, no new data were generated or analyzed. The data used in this article can be obtained from the public sources cited in the article (or references therein).
References
- Abraham et al. (1994) Abraham, R. G., et al., 1994, ApJ, 432, 75
- Abraham et al. (1996) Abraham, R. G., et al., 1996, ApJS, 107, 1
- Abraham et al. (2003) Abraham, R. G., van den Bergh, S., & Nair, P., 2003, ApJ, 588, 218
- Aniyan et al. (2017) Aniyan, A. K. & Thorat, K., 2017, ApJS, 230, 20
- Baes et al. (2020) Baes, M., et al., 2020, A&A, 641, 119
- Baldwin, Phillips & Terlevich (1981) Baldwin, J. A., Phillips, M. M., & Terlevich, R., 1981, PASP, 93, 5
- (7) Barden, M., et al., 2012, MNRAS, 422, 449
- Bershady et al. (2000) Bershady, M. A., Jangren, A., & Conselice, C. J., 2000, AJ, 119, 2645
- Bertin & Arnouts (1996) Bertin, E., & Arnouts, S., 1996, Astronomy & Astrophysics Supplement Series, 117, 393
- (10) Beyoro-Amado, Z., et al., 2019, MNRAS, 485, 1528
- Bignone et al. (2020) Bignone, L. A., et al., 2020, MNRAS, 491, 3624
- Brinchmann et al. (2004) Brinchmann, J., et al., 2004, MNRAS, 351, 1151
- Buta (2013) Buta, R. J., 2013 in Planets, Stars and Stellar Systems Vol 6, by Oswalt, Terry D; Keel, William C
- Cardamone et al. (2010) Cardamone, C. N., et al., 2010, ApJ, 721, 38
- Choi et al. (2009) Choi, Y., Woo, J., & Park, C., 2009, ApJ, 699, 1679
- Cisternas et al. (2011) Cisternas, M., et al., 2011, ApJ, 726, 57
- Conselice et al. (2000) Conselice, C. J., et al., 2000, ApJ, 529, 886
- Conselice et al. (2003) Conselice, C. J., et al., 2003, AJ, 126, 1183
- Conselice et al. (2014) Conselice, C. J., 2014, ARAA, 52, 291
- Davis et al. (2007) Davis, M., et al., 2007, ApJ, 660, L1
- de Diego et al. (2020) de Diego, J. A., et al., 2020, A&A, 638, 134
- de Vaucouleurs (1959) de Vaucouleurs, G., 1959, Handbuch der Physik, 53, 275
- Domínguez et al. (2018) Domínguez Sánchez, H., et al., 2018, MNRAS, 476, 3661
- Dubois et al. (2016) Dubois, Y., et al., 2016, MNRAS, 463, 3948
- Ellison et al. (2019) Ellison, S. L., et al., 2019, MNRAS, 487, 2491
- Florian et al. (2016a) Florian, M. K., Li, N., & Gladders, M. D., 2016, AJ, 832, 168
- Florian et al. (2016b) Florian, M., Gladders, M., Li, N., & Sharon, K. 2016, ApJ, 816, 23
- Fontanot et al. (2020) Fontanot, F., et al. 2020, MNRAS, 496, 3943
- Gabor et al. (2009) Gabor, J. M., et al., 2009, ApJ, 691, 705
- Gao et al. (2020) Gao, F., et al., 2020, A&A, 637, 94
- García-Bernete et al. (2015) García-Bernete, I., et al., 2015, MNRAS, 449, 1309
- Georgakakis et al. (2008) Georgakakis A., et al., 2008, MNRAS, 385, 2049
- Gini (1912) Gini, C., 1912, https://ui.adsabs.harvard.edu/abs/1912vamu.book.G, 87, 769
- Gu et al. (2018) Gu, Y., et al., 2018, ApJ, 855, 10
- Hickox et al. (2009) Hickox, R. C., et al., 2009, ApJ, 696, 891
- Huertas-Company et al. (2008) Huertas-Company, M., et al., 2008, A&A, 478, 971
- Huertas-Company et al. (2009) Huertas-Company, M., et al., 2009, A&A, 497, 743
- Huertas-Company et al. (2015) Huertas-Company, M., et al., 2015, ApJS, 221, 8
- Hubble (1926) Hubble, E. P., 1926, ApJ, 64, 321
- Jiménez-Teja et al. (2012) Jiménez-Teja, Y., & Benítez, N., 2012, ApJ, 745, 150
- Kauffmann et al. (2003) Kauffmann, G., et al., 2003, MNRAS, 346, 1055
- Kewley et al. (2006) Kewley, L. J., 2006, in American Astronomical Society Meeting Abstracts, Vol. 209, 236.01
- Kim et al. (2020) Kim, M., et al., 2020, MNRAS, 491, 4045
- Kuminski et al. (2014) Kuminski, E., et al., 2014, PASP, 126, 959
- Leslie et al. (2016) Leslie, S. K., et al., 2016, MNRAS, 455, 822
- Licitra et al. (2016) Licitra, R., et al., 2016, MNRAS, 453, 1644
- Lintott et al. (2008) Lintott C. J., et al., 2008, MNRAS, 389, 1179
- Lisker et al. (2006) Lisker, T., 2006, MNRAS, 370, 477
- Lisker et al. (2008) Lisker, T., 2008, ApJS, 179, 319
- Lotz et al. (2004) Lotz, J. M., Primack, J., & Madau, P., 2004, AJ, 128, 163
- Lotz et al. (2008a) Lotz, J. M., et al., 2008a, ApJ, 672, 177
- Lotz et al. (2008b) Lotz, J. M., et al., 2008b, MNRAS, 391, 1137
- Lukic et al. (2018) Lukic, V., et al., 2018, MNRAS, 476, 246
- Mahoro et al. (2019) Mahoro, A., et al., 2019, MNRAS, 485, 452
- Mahoro et al. (2017) Mahoro, A., et al., 2017, MNRAS, 471, 3226
- Mahmood et al. (2005) Mahmood, A., et al., 2005, MNRAS, 359, 1363
- Moffat (1969) Moffat, A. F. J., 1969, A&A, 3, 455
- Molina et al. (1992) Molina, R., et al., 1992, AJ, 103, 666
- Nair & Abraham (2010) Nair, P. B., & Abraham, R., 2010, ApJS, 186, 427
- Nandra et al. (2007) Nandra, K., et al., 2007, ApJ, 660L, 11
- Oke (2015) Oke, J. B., & Gunn, J. E., 2015, A&A, 575, A127
- Peng (2010) Peng, C. J., et al., 2010, AAS, 139, 2097
- Petrosian (1976) Petrosian, V., 1976, ApJ, 209, L1
- Pierce et al. (2010) Pierce, C. M., et al., 2010, MNRAS, 405, 718
- Pierce et al. (2007) Pierce, C. M., et al., 2007, ApJ, 660, L19
- Pintos-Castro et al. (2016) Pintos-Castro, I., et al., 2016, A&A, 592, 108
- Pović et al. (2009) Pović M., et al., 2009, ApJ, 706, 810
- Pović et al. (2012) Pović M., et al., 2012, A&A, 541, A118
- Pović et al. (2013) Pović M., et al., 2013, MNRAS, 435, 3444
- Pović et al. (2015) Pović M., et al., 2015, MNRAS, 453, 1644
- Ramón-Pérez et al. (2019) Ramón-Pérez, M., et al., 2019, A&A, 631, 11
- Salim et al. (2007) Salim, S., et al., 2007, ApJS, 173, 267
- Sandage (1961) Sandage, A., 1961, The Hubble Atlas of Galaxies, Washington DC, Carnegie Institution
- Scarlata et al. (2007) Scarlata, C., et al., 2007, ApJS, 172, 406
- Schawinski et al. (2007) Schawinski K., et al., 2007, MNRAS, 382, 1415
- Setoguchi et al. (2021) Setoguchi, K., et al., 2021, 2101.11273
- Sharma et al. (2021) Sharma, R. S., 2021, arXiv:2101.01729
- Silva et al. (2021) Silva, A., et al., 2021, arXiv:2101.05000
- Silverman et al. (2008) Silverman, J. D., et al., 2008, ApJ, 675, 1025
- Simard et al. (2011) Simard L., et al., 2011, ApJS, 196, 11
- Simmons et al. (2011) Simmons, B. D., et al., 2011, ApJ, 734, 121
- Simmons et al. (2017) Simmons, B. D., et al., 2017, MNRAS, 464, 4420
- Stoughton et al. (2002) Stoughton, C., et al., 2002. AJ 123, 485
- Tarsitano et al. (2018) Tarsitano, W. G., et al., 2018, MNRAS, 481, 2018
- Tasca et al. (2009) Tasca, L. A. M., et al., 2009, A&A, 503, 379
- Trump et al. (2015) Trump, J. R., et al., 2015, ApJ, 811, 26
- Trujillo et al. (2001) Trujillo, I., et al., 2001, MNRAS, 328, 977
- Wang et al. (2017) Wang, T., et al., 2017, A&A, 601, 63
- Willett et al. (2017) Willett, K. W., et al., 2017, MNRAS, 464, 4176
- Xue et al. (2010) Xue, Y. Q., et al., 2010, ApJ, 720, 368
- Yagi et al. (2006) Yagi, M., et al., 2006, MNRAS, 368, 211
- York et al. (2000) York, D. G., et al., 2000, AJ, 120, 1579
- Zamojski et al. (2007) Zamojski, M. A., et al., 2007, ApJS, 172, 468
- ywucka et al. (2020) ywucka, N., et al., 2020, arXiv200310322Z