Gemini NIFS survey of feeding and feedback processes in nearby Active Galaxies: VI - Stellar Populations
Abstract
We use Gemini Near-Infrared Integral Field Spectrograph (NIFS) adaptive optics assisted data-cubes to map the stellar population of the inner few hundred parsecs of a sample of 18 nearby Seyfert galaxies. The near infrared light is dominated by the contribution of young to intermediate old stellar populations, with light-weighted mean ages 1.5 Gyr. Hot dust () emission is centrally peaked (in the unresolved nucleus), but it is also needed to reproduce the continuum beyond the nucleus in nearly half of the sample. We have analysed the stellar population properties of the nuclear region and their relation with more global properties of the galaxies. We find a correlation between the X-ray luminosity and the contributions from the , featureless continuum and reddening . We attribute these correlations to the fact that all these properties are linked to the mass accretion rate to the active galactic nuclei (AGN). We also find a correlation of the bolometric luminosity with the mass-weighted mean age of the stellar population, interpreted as due a delay between the formation of new stars and the triggering/feeding of the AGN. The gas reaching the supermassive black hole is probably originated from mass loss from the already somewhat evolved intermediate age stellar population ( 1.5 Gyr). In summary, our results show that there is a significant fraction of young to intermediate age stellar populations in the inner few 100 pc of active galaxies, suggesting that this region is facing a rejuvenation process in which the AGN, once triggered, precludes further star formation, in the sense that it can be associated with the lack of new star formation in the nuclear region.
keywords:
galaxies: stellar content, galaxies: active, galaxies: evolution1 Introduction
Since the pioneering studies linking the mass of supermassive black holes (SMBH) with the velocity dispersion of their host galaxies bulges it has become accepted that the products of active galactic nuclei (AGN) accretion and star-formation are related (e.g. Magorrian et al., 1998; Ferrarese & Merritt, 2000; Gebhardt et al., 2000). It is also accepted that nuclear star formation and AGN can coexist in the inner region of galaxies, suggesting that the growth of SMBH (by gas accretion) and galaxies (by star formation) are coupled (Heckman & Best, 2014; Madau & Dickinson, 2014, for a review). In the modern view of galaxy evolution, it is well established that AGN feedback plays a fundamental role by impacting (quenching, suppressing or triggering) star formation from nuclear to galactic scales (e.g. Di Matteo et al., 2005; Hopkins & Elvis, 2010; Harrison, 2017; Storchi-Bergmann & Schnorr-Müller, 2019; Riffel et al., 2021a; Ellison et al., 2021).
Theoretical studies and simulations of gas inflows around galactic nuclei lead to episodes of star formation in the nuclear region ( 100 pc, Kormendy & Ho, 2013, for example). In this sense, one of the most popular processes invoked to regulate star formation is the AGN feedback (Terrazas et al., 2020, and references therein). The accretion of matter into a SMBH, that leads to the triggering of an AGN, can in fact inject enough energy into the galaxy affecting its star formation by heating (or removing) the gas (e.g. Granato et al., 2004; Zubovas et al., 2013; Zubovas & Bourne, 2017; Fabian, 2012; King & Pounds, 2015; Trussler et al., 2020) or, as suggested in other studies, these outflows and jets, can in some cases (depending on the AGN luminosity), compress the galactic gas, and therefore act as a catalyzer, boosting the star formation (e.g. Rees, 1989; Hopkins, 2012; Nayakshin & Zubovas, 2012; Bieri et al., 2016; Zubovas et al., 2013; Zubovas & Bourne, 2017) and even form stars inside the outflow (e.g. Ishibashi & Fabian, 2012; Zubovas et al., 2013; El-Badry et al., 2016; Wang & Loeb, 2018, for observational examples, see Maiolino et al. (2017); Gallagher et al. (2019)).
It is also well established that cosmological simulations performed without the inclusion of feedback effects are not able to reproduce the low and high luminosity ends of the galaxy luminosity function (e.g. Springel et al., 2005; Vogelsberger et al., 2014; Crain et al., 2015), and underestimate the ages of the stars of the most massive galaxies when compared with observations (Croton et al., 2006). These results clearly show that an effective feedback is required to reproduce the galaxy properties, but simulations can only provide limited insight on the nature and source of the feedback processes (AGN or supernova dominated, Schaye et al., 2015). This is because the observations are limited and do not provide strong enough constraints to be used in the modelling. In particular, in the case of AGN hosts it is necessary to robustly quantify the star formation history in the inner region of AGN hosts to see if star formation is boosted or quenched (Riffel et al., 2021a).
Observations have clearly shown that nuclear star formation is common in AGNs (e.g. Terlevich et al., 1990; Storchi-Bergmann et al., 2001; Cid Fernandes et al., 2004; Riffel et al., 2007, 2009; Storchi-Bergmann et al., 2012; Esquej et al., 2014; Riffel et al., 2016; Ruschel-Dutra et al., 2017; Hennig et al., 2018; Mallmann et al., 2018; Riffel et al., 2021a; Burtscher et al., 2021). Since AGN activity is most likely intermittent on time scales 0.1 - 1 Myr (Novak et al., 2011; Schawinski et al., 2015), while the timescale of star formation in the host galaxy is much longer (100 Myr, Hickox et al., 2014; Burtscher et al., 2021), it is very difficult to compare the AGN life-cycle with nuclear starbursts ages (which have an uncertainty that may be larger than the time to trigger AGN activity). Therefore, these types of studies are rare and their results inconclusive.
The triggering mechanism of nuclear activity is still unclear (see Alexander & Hickox, 2012; Storchi-Bergmann & Schnorr-Müller, 2019, for a review). Over the years many mechanisms were discussed as being the drivers (or not) of AGN activity, for example: galactic environment (e.g. Mauduit & Mamon, 2007; Marshall et al., 2018; Davies et al., 2017), mergers (e.g. Villforth et al., 2014; Goulding et al., 2018; Pan et al., 2019; Gao et al., 2020; Marian et al., 2020, and references therein), bar instabilities (e.g. Knapen et al., 2000), accretion of gas clouds (e.g. Maccagni et al., 2014) and dust lanes (Lopes et al., 2007; Prieto et al., 2019).
In addition, a dusty torus, rich in molecular gas, is located in the inner parts of the host galaxy (e.g. Antonucci, 1993; Rodríguez-Ardila et al., 2004, 2005; Riffel et al., 2013a, 2021b; Ramos-Almeida & Ricci, 2017; Bewketu Belete et al., 2021; García-Burillo et al., 2019, 2021). Such a huge gas reservoir could be responsible for nuclear activity (Reichard et al., 2009), and since the most important ingredient for star formation is the availability of a large amount of cold gas (Kennicutt & Evans, 2012), the same gas fuelling the AGN could be used to form stars. However, there is no consensus on whether AGN fuelling occurs at the same time as star formation (Kawakatu & Wada, 2008), follows it during a post-starburst phase (Davies et al., 2007; Riffel et al., 2009) or there is a lack of any association with recent star formation (Sarzi et al., 2007).
Literature results trying to connect the AGN and star-formation are controversial. Studies suggest that the fraction of young stars in the vicinity of AGN is usually related with the luminosity of the AGN, with the most luminous AGNs presenting larger fractions of young stellar populations (e.g. Riffel et al., 2009; Ellison et al., 2016; Ruschel-Dutra et al., 2017; Zubovas & Bourne, 2017; Mallmann et al., 2018). Less efficient processes may be sufficient to supply lower accretion rates. Davies et al. (2007), for example, has shown that the age of the starburst is associated with the AGN luminosity. On the other hand in Burtscher et al. (2021) no relation of the X-ray luminosity with the fraction of young stellar population was found. Indeed, many of the confusing or inconclusive results about local AGN may be attributable to the luminosity being a ‘third parameter’: previous analyses of local AGN have typically been performed for objects with low luminosities (e.g. Davies et al., 2015).
It is, then, fundamental to this debate to investigate if there is an association between star formation and nuclear activity, by mapping the stellar population properties in the inner few tens of parsec around AGNs over a wide range of AGN luminosities and in a wavelength region sensitive to the AGN featureless components (accretion disc and hot dust emission) and the stellar population at the same time. The ideal spectral region for this is the near-infrared (NIR = 0.8-2.4m) where the AGN featureless continuum (FC), the hot dust (HD) and the stellar population components can be fitted together and disentangled (Riffel et al., 2009, 2011b).
Here we map the stellar population components in the inner few hundred parsecs of a volume limited, X-ray luminosity selected and adaptive optics (AO) assisted observed sample of AGNs, the Gemini NIFS survey of feeding and feedback processes in nearby Active Galaxies (Schönell et al., 2017; Riffel et al., 2017, 2018, 2021b; Bianchin et al., 2022). This paper is structured as follows: in § 2 we present the sample, observations, and data reduction. The stellar population synthesis procedures are presented in § 3. Results are presented in § 4. The discussion is made in § 5 while the conclusions are presented in § 6. We have adopted = 69.32 from the Nine-year Wilkinson Microwave Anisotropy Probe (WMAP) observations Hinshaw et al. (2013) available in astropy package (Astropy Collaboration et al., 2018).
2 Sample and observations
2.1 The sample
The present sample is composed of the galaxies in the Gemini NIFS survey of feeding and feedback processes in nearby active galaxies (Riffel et al., 2017, 2018) that have observations in the and (or ) bands. In short, the sample was selected using the Swift-BAT 60-month catalogue (Ajello et al., 2012), and selected nearby galaxies with 14–195 keV luminosities ergs s-1. Such selection guarantees a high completeness, since hard X-ray selected samples are not significantly biased against obscuration, up to column density of (see Fig. 1 of Ricci et al., 2015). As additional criteria, the object must be accessible for Gemini NIFS (), and either its nucleus must be bright/pointy enough to guide the adaptive optics system during the observations or there must be a natural guide star available in the field for the same purpose. Finally, we only have included in the sample galaxies already previously observed in the optical and with extended [O iii] emission available in the literature. This sample was completed with data already observed by the AGNIFS team in other projects. For additional details see Riffel et al. (2018). Our final sample is composed of 18 Local Universe (0.00303 0.02213; 13.10 Mpc 95.71 Mpc) sources, listed in Tab. 1. It includes six galaxies with results on the stellar populations already published by the AGNIFS team (Riffel et al., 2010, 2011c; Storchi-Bergmann et al., 2012; Schönell et al., 2017; Dahmer-Hahn et al., 2019a, b; Diniz et al., 2019). These galaxies are identified with the symbol after their names.
In order to compare the stellar population properties with more general ones, we have also collected or computed additional properties for the galaxies, as follows:
- 1.
-
2.
Intrinsic X-ray luminosities were also collected from the BASS survey DR1, except for Mrk 1157, Mrk 1066, NGC 5929 and Mrk 607 where we have calculated their values as follows. For all sources we collected archival data, which includes XMM-Newton (Mrk 607, Mrk 1066 and Mrk 1157), Chandra (NGC 5929), Swift/BAT (Mrk 1066) and NuSTAR (Mrk 607 and NGC 5929). The spectra were reduced and fitted following the same approach outlined in Ricci et al. (2017). We found that all objects are heavily obscured, with three of them (Mrk 607, Mrk 1066 and Mrk 1157) having Compton-thick () column densities.
-
3.
The bolometric luminosity was calculated using the observed X-ray luminosity together with the equation (Ichikawa et al., 2017):
- 4.
-
5.
The supermassive black hole mass was computed using the relation from Caglar et al. (2020):
-
6.
The Eddington luminosity (Rybicki & Lightman, 1979):
-
7.
Eddington ratio was obtained from and calculated using the observed () and intrinsic X-ray luminosity ()
-
8.
and H ii masses in the inner 125 pc were taken from Riffel et al. (2021b).
| Galaxy | z | d | Nuc. Act. | Hub. Type | M(Hii) | ||||||||||
|---|---|---|---|---|---|---|---|---|---|---|---|---|---|---|---|
| (1) | (2) | (3) | (4) | (5) | (6) | (7) | (8) | (9) | (10) | (11) | (12) | (13) | (14) | (15) | (16) |
| NGC 788 | 0.01365 | 59.03 | Sy2 | SA0/a?(s) | 42.13 | 43.02 | 43.33 | 44.42 | 1874 | 8.040.07 | 46.14 | 1.55E-03 | 1.91E-02 | 12.810.46 | 19.540.6 |
| NGC 1052 | 0.00446 | 19.29 | Sy2 | E4 | 41.36 | 41.52 | 42.45 | 42.63 | 2454 | 8.440.06 | 46.54 | 8.13E-05 | 1.23E-04 | 11.021.14 | 5.671.63 |
| Mrk 79 | 0.02213 | 95.71 | Sy1.5 | SBb | 42.93 | 43.10 | 44.30 | 44.52 | 13010 | 7.510.21 | 45.61 | 4.90E-02 | 8.13E-02 | 52.92.09 | 23.862.49 |
| NGC 1125 | 0.01128 | 48.78 | Sy2 | (R’)SB(r)0/a? | 41.06 | 42.76 | 42.10 | 44.10 | 1189 | 7.370.21 | 45.47 | 4.27E-04 | 4.27E-02 | 21.260.69 | 64.110.83 |
| NGC 1068 | 0.00303 | 13.10 | Sy2 | (R)SA(rs)b | 41.00 | 42.74 | 42.05 | 44.07 | 1625 | 7.830.09 | 45.93 | 1.32E-04 | 1.38E-02 | 202.282.19 | 191.953.84 |
| NGC 2110 | 0.00739 | 31.96 | Sy2 | SAB0- | 42.48 | 42.65 | 43.75 | 43.96 | 2385 | 8.400.07 | 46.50 | 1.78E-03 | 2.88E-03 | 41.710.84 | 16.750.98 |
| NGC 3227 | 0.00329 | 14.23 | Sy1.5 | SAB(s)a pec | 41.95 | 41.95 | 43.12 | 43.13 | 1307 | 7.510.14 | 45.61 | 3.24E-03 | 3.31E-03 | 52.111.3 | 11.521.23 |
| NGC 3516 | 0.00871 | 37.67 | Sy1.5 | (R)SB00?(s) | 42.67 | 42.72 | 43.98 | 44.04 | 1863 | 8.030.06 | 46.13 | 7.08E-03 | 8.13E-03 | 8.692.19 | 1.970.34 |
| NGC 4151 | 0.00314 | 13.58 | Sy1 | SAB(rs)bc | 42.02 | 42.27 | 43.20 | 43.50 | 973 | 7.080.07 | 45.18 | 1.05E-02 | 2.09E-02 | 36.891.31 | 54.771.54 |
| NGC 4235 | 0.00757 | 32.74 | Sy1 | SA(s)a edge-on | 41.56 | 41.56 | 42.66 | 42.66 | 18312 | 8.010.20 | 46.11 | 3.55E-04 | 3.55E-04 | 3.980.5 | 0.190.07 |
| NGC 5506 | 0.00609 | 26.34 | Sy1.9 | Sa pec edge-on | 42.89 | 42.98 | 44.25 | 44.37 | 18020 | 7.990.37 | 46.09 | 1.45E-02 | 1.91E-02 | 45.710.72 | 174.091.41 |
| NGC 5548 | 0.01673 | 72.35 | Sy1 | (R’)SA0/a(s) | 43.08 | 43.12 | 44.49 | 44.54 | 27622 | 8.610.28 | 46.71 | 6.03E-03 | 6.76E-03 | 33.295.54 | 32.066.76 |
| NGC 5899 | 0.00844 | 36.50 | Sy2 | SAB(rs)c | 41.91 | 42.21 | 43.07 | 43.42 | 1479 | 7.690.17 | 45.79 | 1.91E-03 | 4.27E-03 | 17.790.8 | 6.581.09 |
| NGC 5929 | 0.00831 | 35.94 | Sy2 | Sab? pec | 40.10 | 41.58 | 41.08 | 42.69 | 1345 | 7.550.10 | 45.65 | 2.69E-05 | 1.10E-03 | 17.10.9 | 11.40.5 |
| Mrk 607 | 0.00888 | 38.40 | Sy2 | Sa? edge-on | 41.83 | 43.73 | 42.98 | 45.32 | 1324 | 7.530.08 | 45.63 | 2.24E-03 | 4.90E-01 | 7.10.41 | 11.30.74 |
| Mrk 766 | 0.01292 | 55.88 | Sy1.5 | (R’)SB(s)a? | 42.69 | 42.72 | 44.01 | 44.04 | 786 | 6.760.18 | 44.86 | 1.41E-01 | 1.51E-01 | 23.281.95 | 112.213.69 |
| Mrk 1066 | 0.01202 | 51.98 | Sy2 | (R)SB0+(s) | 40.72 | 42.63 | 41.74 | 43.94 | 1034 | 7.170.09 | 45.27 | 2.95E-04 | 4.68E-02 | 57.330.44 | 68.860.73 |
| Mrk 1157 | 0.01517 | 65.61 | Sy2 | (R’)SB0/a | 40.29 | 42.87 | 41.28 | 44.22 | 924 | 7.000.10 | 45.10 | 1.51E-04 | 1.32E-01 | 9.801.9 | 53.31.3 |
-
Stellar population studies previously published by the ANGIFS team. (1) Galaxy’s name; (2) Distance in Mpc; (3) Redshift taken from the BASS survey DR1 (Ricci et al., 2017; Koss et al., 2017; Oh et al., 2018, http://www.bass-survey.com/); (4) Nuclear activity; (5) Hubble type as quoted in NED111The NASA/IPAC Extragalactic Database (NED) is funded by the National Aeronautics and Space Administration and operated by the California Institute of Technology.; (6) Logarithm of the observed hard X-ray luminosity (14-195 keV, in erg s-1) from the BASS survey DR1, except for Mrk 1157, Mrk 1066 and NGC 5929 that are from Cardamone et al. (2007) and Mrk 607 that are from LaMassa et al. (2011); (7) Logarithm of the intrinsic hard X-ray luminosity (14-195 keV, in erg s-1) from the BASS survey DR1, except for Mrk 1157, Mrk 1066, NGC 5929 and Mrk 607 where we have calculated their values; (8) Logarithm of the bolometric luminosity calculated using the observed hard X-ray luminosity (in erg s-1); (9) Logarithm of the bolometric luminosity calculated using the intrinsic hard X-ray luminosity (in erg s-1); (10) taken from Riffel et al. (2017) except for: NGC 1068 (Storchi-Bergmann et al., 2012), NGC 4151 (Ho et al., 2009), NGC 1125 (Garcia-Rissmann et al., 2005), NGC 5506 (Oliva et al., 1999) and Mrk 79 (Greene & Ho, 2006); (11) Logarithm of the supermassive black hole mass in M computed using the relation from Caglar et al. (2020); (12) Logarithm of the Eddington luminosity (Rybicki & Lightman, 1979); (13) Edditngton ratio computed with ; (14) Edditngton ratio computed with ; (15) mass (in ) in the inner 125 pc taken from Riffel et al. (2021a). (16) H ii mass (in ) in the inner 125 pc taken from Riffel et al. (2021a).
2.2 Observations
The observations of our sample were done with the Gemini Near-Infrared Integral Field Spectrograph (NIFS, McGregor et al., 2003). All observations were performed using the Gemini North Adaptive Optics system ALTAIR from 2006 to 2018, except for NGC 1125 that was observed in the seeing limited mode (Riffel et al., 2018, 2021b). The observations followed an Object-Sky-Object dither sequence, with sky observations made off-source since all targets are extended. Individual exposure times varied according to the target. The data comprise J and K (Kl)-band observations at angular resolutions in the range 012–020, depending on the performance of the adaptive optics module. Additional details can be found in Riffel et al. (2018).
2.3 Data reduction
The data reduction followed the standard procedure and was performed using tasks that were specifically developed for NIFS data reduction, contained in the nifs package, which is part of the gemini iraf package, as well as generic iraf tasks (Tody, 1986, 1993). The procedures included the trimming of the images, flat-fielding, sky subtraction, wavelength and s-distortion calibrations.
The telluric absorption corrections have been performed using the spectra of telluric A-type standard stars, observed just before/after the observation of each galaxy. They were also used to flux calibrate the spectra of the galaxies by interpolating a black body function to their spectra. Finally, datacubes were created for each individual exposure at an angular sampling of 015015 and combined in a final datacube for each galaxy. All datacubes cover the inner , with exception of the datacube for NGC 4151 that covers the inner , due to spatial dithering during the observations (Storchi-Bergmann et al., 2009; Storchi-Bergmann et al., 2010) and for NGC 1068, covering the inner (Storchi-Bergmann et al., 2012; Riffel et al., 2014; Barbosa et al., 2014)
We followed the steps used in previous papers of the AGNIFS group (e.g. Riffel et al., 2011c; Storchi-Bergmann et al., 2012; Diniz et al., 2019; Dametto et al., 2019; Dahmer-Hahn et al., 2019a), since the different bands of our data were acquired during different nights. We have cross calibrated the data-cubes using cross dispersed (XD) long-slit data presented by Riffel et al. (2006, 2013b); Riffel et al. (2015, 2019) and Mason et al. (2015) or unpublished XD spectra (Riffel et al., in preparation).
3 Stellar Population Synthesis
The galaxies’ integrated spectra are composed of several components, such as the underlying stellar (and gas) continuum and dust emission. In the case of active galaxies, besides the above, AGN torus and accretion disk components also need to be considered (Riffel et al., 2009; Burtscher et al., 2015). The stellar population synthesis consists of disentangling the percent contribution of these components from the integrated spectrum.
It is worth mentioning that since there is a large number of parameters (e.g. age, metallicity, kinematics and reddening, and AGN components) to be fitted, many techniques have been employed over the years to disentangle the components of a galaxy spectrum (for a review see Walcher et al., 2011; Conroy, 2013). Therefore, many fitting codes have been developed by different groups (e.g. Cid Fernandes et al., 2005; Ocvirk et al., 2006; Koleva et al., 2009; Tojeiro et al., 2007; Cappellari, 2017; Sánchez et al., 2016; Wilkinson et al., 2017; Gomes & Papaderos, 2017; Johnson et al., 2021) with their own priorities in mind (see Gomes & Papaderos, 2017, for example). Naturally, comparisons among the different codes have also been presented, and they show that in general the codes do produce consistent results when fitting the same data with the same ingredients (e.g. Koleva et al., 2008; Dias et al., 2010; Gomes & Papaderos, 2017; Goddard et al., 2017; Ge et al., 2018; Cid Fernandes, 2018).
To perform the stellar population synthesis we applied starlight222This choice was made mainly to produce self consistent results with the previous studies done by our team, allowing for easier comparisons of the results. (Cid Fernandes et al., 2004; Cid Fernandes et al., 2005; Asari et al., 2007; Cid Fernandes, 2018). The code fits the full underlying absorption and continuum in the observed spectra as a combination of different proportions of the base of elements, excluding emission lines and spurious data, mixing computational techniques originally developed for semi-empirical population synthesis with ingredients from evolutionary synthesis models (Cid Fernandes et al., 2004; Cid Fernandes et al., 2005). In summary, the code fits an observed spectrum, , with a combination, in different proportions, of simple stellar populations (SSPs). The visual extinction, , is modelled by starlight as due to foreground dust. In the fits we use the CCM (Cardelli et al., 1989) extinction law. The modeled spectrum, , is obtained through the following equation:
| (1) |
where is the population vector, is the th base element, is the reddening factor of the th component normalised at , the reddening term is represented by , is the synthetic flux at the normalisation wavelength (we have used Å in the rest frame). The convolution operator is and is the Gaussian distribution used to model the line-of-sight velocity distributions of the stars, which is centred at velocity with dispersion . The final fit is carried out through a chi-square minimisation, as follows:
| (2) |
where emission lines and spurious features are excluded from the fit by fixing =0 at the corresponding wavelengths.
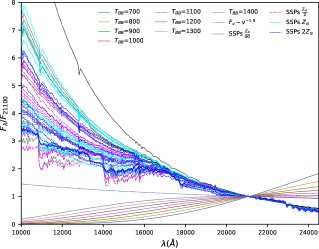
In the present paper we have followed Riffel et al. (2009, 2011b) and used as simple stellar population (SSP) the evolutionary population synthesis (EPS) models of Maraston (2005). These models are able to foresee characteristic NIR absorption features (e.g. Riffel et al., 2007; Riffel et al., 2015) and to produce consistent results when compared with properties of the emission line gas in star forming regions of galaxies (Dametto et al., 2019). The base of elements comprises SSPs with 4 metalicities ( = 0.02, 0.5, 1 and 2 ) and 12 ages (t = 0.01, 0.03, 0.05, 0.1, 0.2, 0.5, 0.7, 1, 2, 5, 9, 13 Gyr). To account for the accretion disk FC we have used a power-law of the form (e.g. Koski, 1978; Cid Fernandes et al., 2005). In order to properly account for the hot dust emission component, eight Planck distributions (black-body, BB), with temperature ranging from 700 to 1400 K, in steps of 100 K, were included in the fits. The lower limit was chosen because lower temperatues are hard to detect in this spectral range (Riffel et al., 2009) and the upper limit is very close to the sublimation temperature of the dust grains (e.g. Barvainis, 1987; Granato & Danese, 1994). For more details on the effects of these components in the NIR spectra and on the definition of our base of elements see Riffel et al. (2009). The components used in the fits are shown in Fig. 1.
4 Results
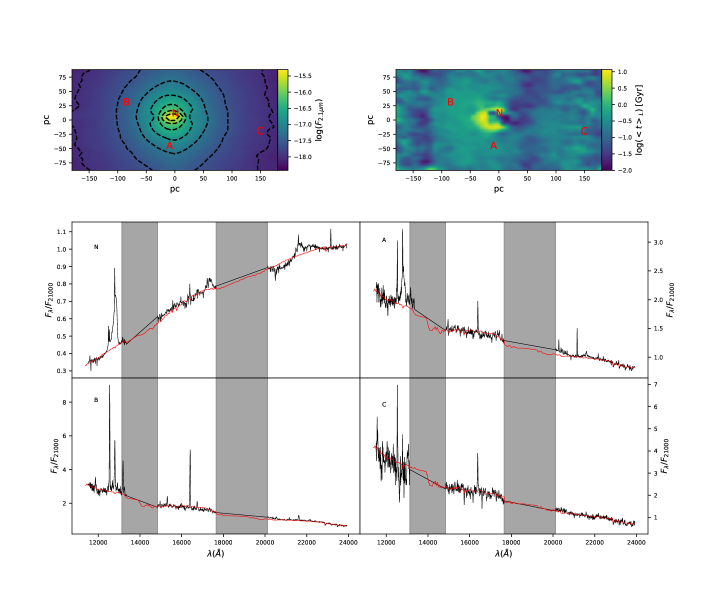
Since starlight is not designed to deal with data cubes, we have used the in-house megacube tool (Mallmann et al., 2018) as a front end for starlight fits and to produce maps for the derived quantities. Therefore each single spaxel was corrected for galactic extinction using the Schlegel et al. (1998) dust maps and redshift corrected using the values listed in Tab. 1. An example of individual spectrum fits can be seen in Fig 2.
To take into account the noise effects on the data that wash away differences between similar spectral components, as well as the age-metallicity degeneracy333The difference between two spectrally similar populations may be in the noise level of the data; by binning them in a condensed population vector, we are left with a coarser but more robust fraction for each age bin. For a detailed test see §3.2 of Cid Fernandes et al. (2004). (e.g. Worthey et al., 1994), we have followed Cid Fernandes et al. (2005); Riffel et al. (2009) and we have defined condensed population vectors and have produced maps and radial profiles for different properties, for each one of the galaxies, as follows:
- :
-
sum of the percent contribution of SSPs with ages 50 Myr;
- :
-
sum of the percent contribution of SSPs with ages in the range 100 Myr 200 Myr;
- :
-
sum of the percent contribution of SSPs with ages in the range 500 Myr 700 Myr;
- :
-
sum of the percent contribution SSPs with ages in the range 1 Gyr 2 Gyr;
- :
-
sum of the percent contribution 5 Gyr 13 Gyr;
- HD:
-
sum of the percent contribution of all Planck function components.
- FC:
-
is the featureless percent contribution.
- :
-
is the light weighted mean age, which is defined as follows (Cid Fernandes et al., 2005):
(3)
Note that all these values are in light fractions and are limited by the elements included in the base.
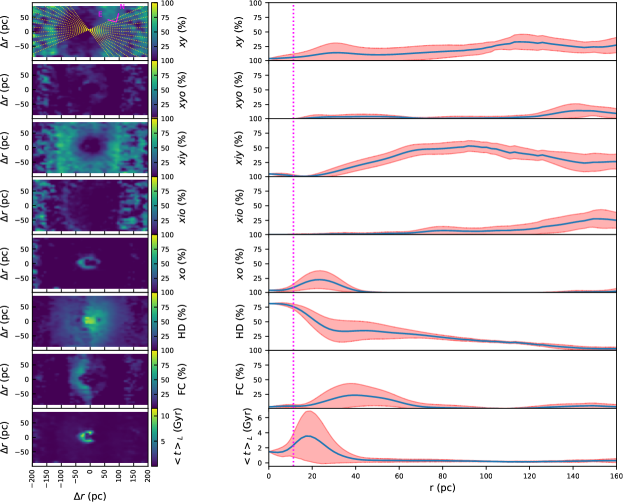
An example of the maps is shown in Fig. 3 (the remaining maps are in the supplementary material). The red cross marks the peak of the continuum at the normalisation point. In the same plot, we show radial profiles for these properties. The profiles shown in Fig. 3 were built using the megacube tool (Mallmann et al., 2018) and we used the standard 30 equally spaced (in azimuthal angle) radial profiles. These profiles, in the galaxy plane, have been limited to angular distances from the major axis of degrees, where a and b are, respectively, the mean values of the semi-major and semi-minor axis which were derived using the photutils.isophote Ellipse astropy affiliated package (Bradley et al., 2019). The solid line represents the mean value and the shaded region is its standard deviation. The dotted vertical line is the point spread function (PSF) of the full width at half maximum (FWHM) taken from Riffel et al. (2017, 2021b). To remove possible spurious data, not removed in the fits, we have recomputed the standard starlight value as follows:
| (4) |
where is the number of points used in the fits, while, and are the observed and synthesised fluxes, respectively. We have identified all points with 10 (red lines) and 20 (white lines). It is clear that almost all the spaxels in all analysed sources have 10. For the radial profiles, however, we used all spaxels, and the loose of quality on the fits is observed as a larger scatter around the mean values for large radii444The radial profiles have been obtained by averaging the individual (deprojected) profiles obtained along each one of the yellow lines (in both directions) in the top panel of the figures..
For completeness, we have refitted the SPs of the six galaxies already studied by the AGNIFS team and we present the corresponding maps and profiles as supplementary material.
4.1 Individual Results
- NGC 788:
-
The light of this galaxy shows an important contribution of the two younger ( and ) components with a maximum value of 40 percent. The radial profiles show that these two components only show up in the outer parts of the field of view (FoV). It is, however, worth mentioning that there is a “stripe” on the east side, that can be due to an instrumental fingerprint (not completely removed in the data reduction process), therefore this should just be taken as a trend. It is clear from these maps that the light of the central region of this galaxy is dominated by stars with ages in the range 500 Myr 700 Myr () with contributions 40 percent over the FoV. A fraction of 25 percent of older stars ( and stellar population component [SPC]) are detected throughout the whole FoV. Hot dust emission contributes 35 percent of the nuclear emission of this source, while no FC is required. The mean age shows a negative profile with the central region having older stellar populations than the outer parts.
- NGC 1052:
- Mrk 79:
-
A clear ring-like structure is observed in the and SPC, with a fraction reaching 50 percent for the population. Negligible contributions of the intermediate age components are observed, with a smoother central distribution of older stars () surrounded by the ring-like (r 300 pc) SPC. Hot dust emission is observed over the entire FoV showing a maximum in the nuclear region. A FC emission of 40 percent is detected in the nuclear region. In the mean age map we see that the central region of this galaxy is dominated by a 2 Gyr population.
- NGC 1125:
-
This galaxy presents a complex star formation history (SFH). Locations 100 pc from the centre towards the NW are dominated by a SPC, reaching values up to 50 percent. A ring-like structure is observed in the map starting at 100 pc from the centre with a fraction of 25 percent. This ring structure surrounds a ring of intermediate age stars (), which dominates the light in the central region of this galaxy. Fractions of 25 percent for the two older components are also observed, being located in regions from the centre towards the North. A vertical stripe can be seen in the East direction in this component (and as already mentioned before for other galaxies, it can be due to a residual instrumental fingerprint). Hot dust emission is seen in the unresolved centre (r100 pc) of the FoV reaching 20 percent, and no FC emission is detected. The mean age map shows that the central region of this galaxy is dominated by populations with ages smaller than 1 Gyr, decreasing outwards.
- NGC 1068:
-
This source has a very complex SFH, with the unresolved nuclear region being dominated by the component. Outside this region, large fractions of the are also observed. Its stellar content is dominated by young and intermediate age populations. A detailed analysis of the stellar populations of this galaxy is made in Martins et al. (2010) and Storchi-Bergmann et al. (2012).
- NGC 2110:
-
In terms of stellar content the central region of this galaxy is dominated by intermediate and old stellar populations, with a smaller fraction in the component. It also shows a large fraction of hot dust emission in the unresolved nucleus. A detailed study of the stellar populations of this galaxy is presented in (Diniz et al., 2019).
- NGC 3227:
-
Very small fractions of the two younger SPC are detected. An off-centred (x=60 pc,y=-20 pc) ring-like structure of intermediate young () stars can be seen as well as a significant fraction of SPC is detected over the entire FoV. This structure has a very good agreement with the off-centre, ring-like structure found in CO(2-1) Atacama Large Millimeter/submillimeter Array (ALMA) observations by (Alonso-Herrero et al., 2019, 2020), as well as with a low velocity dispersion stellar ring (Barbosa et al., 2009) and in emission (Bianchin et al., 2022), indicating that this gas reservoir is forming stars. We note that a vertical stripe is seen to the W side of the FoV and that this feature should be treated with caution. The old SPC is also detected over the entire FoV contributing 25 percent, except for the unresolved nucleus (r15 pc), which is dominated by hot dust emission (75 percent) together with 10 percent of FC emission. The mean age map shows that NGC 3227 is dominated by stellar populations with ages lower than 2 Gyr.
- NGC 3516:
-
A partial ring of the SPC is observed from West to East towards the South locations, starting at 30 pc out to the end of our FoV (150 pc). No population was required. A clear ring (100 pc r 150 pc) of stars is detected surrounding a ring of the component (with a smaller contribution of ). This ring surrounds a nuclear unresolved (r30 pc) HD and FC emission. The mean age map shows that this source is dominated by a population younger than 1.5 Gyr.
- NGC 4151:
-
This galaxy displays a strong contribution of young SPCs. The population is clearly detected on the west side of the FoV, summing up 50 percent contribution, as well as on the east side, starting at 100 pc from the nucleus up to the edge of the FoV. A ring-like structure (30 pc 150 pc) composed predominantly of the SPC, which is responsible in some locations for up to 75 percent of the emitted light, can be seen in the maps. Small fractions of ( 30 percent) stars can also be found in this ring-like structure. This component surrounds a nuclear (40 pc) contribution from an old population. A very strong contribution of hot dust emission is observed in the unresolved nucleus (10 pc) of this source and extends towards the full FoV. The FC component is also seen up to 60 pc. With the nucleus being dominated by hot dust emission, the mean age map shows a “hole", with a peak of 5 Gyr SPC at 20 pc from the centre, beyond which it has a strong negative gradient out to 40 pc and then is nearly constant (t500 Myr) in the rest of the FoV.
- NGC 4235:
-
This galaxy shows a very complex SFH over the full FoV. A (partial) ring of is clearly present, with values reaching 50 percent to northern ( 130 pc) and western (100 pc) locations, where a vertical stripe can also be seen, and which may be attributed to a residual fingerprint. Small fractions ( 20 percent) of the SPC are detected in NW and SE directions (130 pc), while a partial ring of intermediate population ( and ) is detected towards E-S-W directions surrounding the centre (50 pc 150 pc). The component shows up on the full FoV with values reaching 50 percent. A clear dominance (75 percent) of hot dust emission is seen in the unresolved nucleus ( 25pc) with a contribution of FC emission of less than 20 percent. The component shows a steep gradient decreasing out to the edge of the FoV ( 200 pc), while the seems to reach its maximum (20 percent) for 40 pc towards SE directions. The mean age map shows the light is dominated by a 500 Myr population with a flat gradient, raising up again outwards of 200 pc.
- NGC 5506:
-
The two youngest SPC show a negligible contribution to the integrated spectrum emission of this galaxy. A ring-like structure (90 pc 120 pc) is observed for the component, while for the two oldest components an arc structure is observed towards the west direction (90 pc) with a maximum value of 25 percent for the . The dominant feature we have detected in this source is the hot dust emission, completely dominating the nuclear emission. Meanwhile, no contribution of the FC component was found in the nuclear region, although it reaches up to 50 percent in the outer regions of the FoV (90 pc). We interpret this as due to hot dust emission instead of scattered light from the AGN. The mean age map also shows the ring signature pointing to very young ages in the centre. This, however, seems to be a fitting artefact, since the nuclear emission reaches 100 percent for the hot dust emission.
- NGC 5548:
-
The FoV of this galaxy is dominated by the population, with a ring (200 pc) of populations. and are detected along the full FoV. A detailed analysis is made by Schönell et al. (2017).
- NGC 5899:
-
The two youngest components show a small contribution over the FoV, with an enhancement to the West/NW side ( 75 percent for 100 pc in this side). The intermediate age components are clearly the dominant ones with being enhanced on the East side of the FoV (where it reaches a 75 percent contribution). The SPC is well distributed over the FoV with a mean value of 40 percent in the inner 100 pc radius. For the old SPC we can see a flat distribution over the entire FoV, with a contribution of 20 percent. Very small fractions of and are required in the central region and the mean age shows a small gradient with values dropping from 1.3 Gyr to 0.7 Gyr in the outer regions.
- NGC 5929:
-
A very small fraction of SPC is observed SE of the nucleus (110 pc) of NGC 5929, while no signs of the component are seen. The dominant emission of the central region is due to the SPC reaching 75 percent in most locations of the FoV, and presenting a value of 25 percent in the unresolved nucleus ( 25 pc), which is dominated by the population (up to 50 percent). No hot dust and emission are detected. The mean age shows a decreasing gradient with ages between 1.5 Gyr in the nucleus and 0.6 Gyr in the outermost locations ( 100 pc).
- Mrk 607:
-
The SFH of the central region of this galaxy is very complex and all the SPCs are necessary to explain the continuum emission of this galaxy. The two youngest SPCs ( and ) when taken together present a partial ring, from south towards west up to north (130 pc 150 pc). The SPC shows another ring-like structure (100 pc 150 pc), reaching up to 50 percent of the emission. The SPC is spread over the FoV, and summed with contributes up to 40 percent of the stellar emission in the nuclear region (50 pc). The clear dominant nuclear emission in this galaxy is due to the hot dust emission, reaching more than 50 percent in the centre, and falling to zero in the outer locations. A tiny fraction ( 5 percent) of a is also detected in the unresolved nucleus. The mean age shows a decreasing gradient, with a peak of 2.5 Gyr in the centre falling to values 1 Gyr in the outer locations.
- Mrk 766:
-
This source also shows a very complex SFH, with a ring of very young () stars dominating the emission in the outer regions of the FoV (200 pc). In this same ring there is a coexistence of all other SPCs, in smaller fractions. The centre is dominated by hot dust (60 percent) and ( 30 percent) emission. The mean age map indicates that slightly older stars are located in a SE direction.
- Mrk 1066:
-
The FoV of this galaxy is dominated by the population. and emission is clearly observed in the unresolved nucleus, decreasing outwards over the full FoV. A detailed analysis is made by Riffel et al. (2010).
- Mrk 1157:
-
The FoV of this galaxy is dominated by the intermediate age populations ( and ) with a smaller contribution of . Small fractions of and emission are observed in the unresolved nucleus. A detailed study of the stellar populations for this galaxy is made in Riffel et al. (2011c).
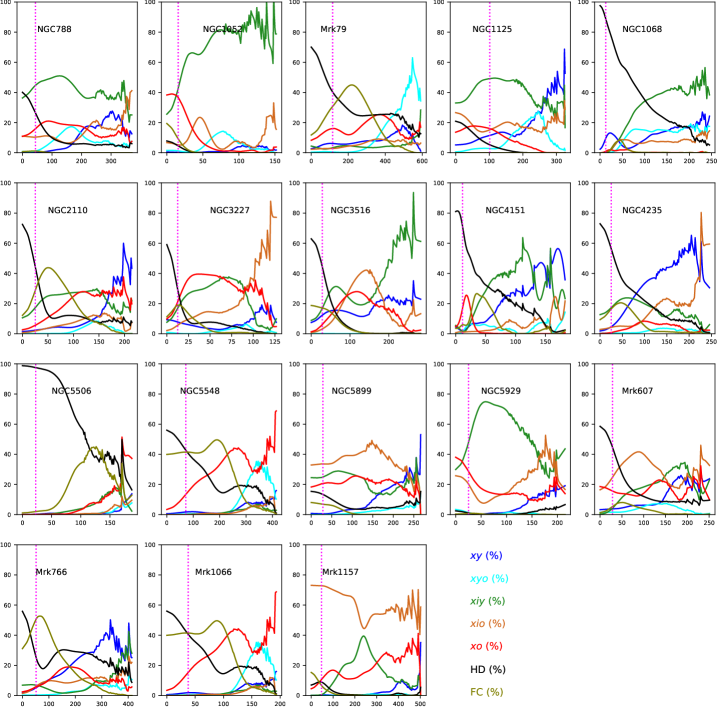
To summarise the individual results, we have plotted in Fig. 4 the individual profiles of the binned population vectors. These figures show the results for all the 18 galaxies, including the 6 objects previously studied by our group. It is clear from this figure that the inner region has centrally peaked hot dust emission in the unresolved region (dotted line). On the other hand, for the contribution we found that for nearly half of our sample this component reaches the highest values outside the unresolved nucleus (see § 4.3).
In terms of stellar populations, the galaxies show a considerable fraction of young (+) stellar populations; however, the central region is dominated by an intermediate age population (+), as well as a significant fraction of old stars. In general, the galaxies display a very complex star formation history in the central region.
4.2 Sample Results
In order to compare the stellar population results for our sample with the properties listed in Tab. 1 we have followed Riffel et al. (2021b) and have computed the mean values of the derived stellar population properties inside a 125 pc radius. These values are listed in Tab. 2. It is worth mentioning that since we are taking the mean value over the 125 pc in centre of the galaxies, the possible fingerprints left on the borders of the FoV do not play an important role on the obtained values.
| Source | ||||||||||||
|---|---|---|---|---|---|---|---|---|---|---|---|---|
| NGC 788 | 2.234.72 | 8.913.54 | 48.7719.72 | 15.5219.77 | 15.6611.6 | 8.910.53 | 0.00.02 | 0.940.43 | 3.212.14 | 0.030.01 | 0.020.01 | 0.410.39 |
| NGC 1052 | 3.287.77 | 11.3614.84 | 73.1821.53 | 7.6617.77 | 3.87 9.8 | 0.211.35 | 0.443.43 | 0.60.46 | 1.271.75 | 0.030.01 | 0.030.01 | 0.110.45 |
| Mrk 79 | 5.437.45 | 19.0829.08 | 8.3810.92 | 2.913.49 | 11.5514.26 | 28.4523.73 | 24.2127.1 | 1.011.14 | 3.613.21 | 0.020.01 | 0.010.01 | 2.01.36 |
| NGC 1125 | 15.917.19 | 7.5711.05 | 48.3629.79 | 15.8918.44 | 7.8713.34 | 4.426.03 | 0.0 0.0 | 0.570.55 | 1.92.83 | 0.030.01 | 0.030.01 | 0.080.23 |
| NGC 1068 | 10.667.04 | 13.058.37 | 29.4716.41 | 10.6712.11 | 0.771.94 | 34.1719.21 | 1.223.14 | 0.290.16 | 0.641.23 | 0.020.01 | 0.020.01 | 0.250.74 |
| NGC 2110 | 12.3514.77 | 1.645.08 | 24.0410.58 | 7.949.47 | 19.213.33 | 16.1115.28 | 18.7217.27 | 0.970.75 | 5.412.51 | 0.020.01 | 0.020.01 | 1.50.79 |
| NGC 3227 | 5.49.18 | 2.496.48 | 28.2121.07 | 27.2927.52 | 28.8716.73 | 5.458.54 | 2.286.19 | 1.560.93 | 5.132.51 | 0.020.01 | 0.020.01 | 1.950.69 |
| NGC 3516 | 15.8514.19 | 0.020.13 | 30.7925.01 | 21.6418.96 | 22.5915.73 | 5.6815.79 | 3.4411.53 | 0.920.71 | 4.972.81 | 0.010.01 | 0.010.01 | 1.290.94 |
| NGC 4151 | 37.3928.46 | 2.765.66 | 25.3622.26 | 9.1213.8 | 5.1212.03 | 16.5417.17 | 3.718.93 | 0.391.25 | 1.623.08 | 0.020.01 | 0.020.01 | 0.160.73 |
| NGC 4235 | 29.8423.03 | 2.385.97 | 21.9317.79 | 10.9513.6 | 4.777.93 | 22.1419.48 | 7.9813.42 | 0.33 0.4 | 1.932.19 | 0.020.01 | 0.020.01 | 2.11.06 |
| NGC 5506 | 1.062.67 | 0.74.16 | 8.9410.36 | 2.936.21 | 6.7811.57 | 56.8336.61 | 22.7626.14 | 1.371.83 | 3.233.46 | 0.010.01 | 0.010.01 | 1.832.05 |
| NGC 5548 | 5.98.85 | 9.5416.12 | 2.39 8.5 | 2.828.68 | 26.721.34 | 25.1324.12 | 27.5128.59 | 3.953.75 | 6.623.12 | 0.010.01 | 0.0 0.0 | 2.961.78 |
| NGC 5899 | 14.8423.44 | 4.8910.73 | 25.2726.85 | 28.9625.96 | 19.114.53 | 5.417.83 | 1.534.12 | 1.110.86 | 4.5 2.8 | 0.020.01 | 0.010.01 | 1.70.85 |
| NGC 5929 | 2.716.09 | 3.2510.14 | 61.0725.42 | 17.423.7 | 14.4213.33 | 0.821.81 | 0.311.64 | 0.940.48 | 3.32 2.2 | 0.020.01 | 0.010.01 | 0.610.71 |
| Mrk 607 | 13.5117.54 | 5.5610.75 | 20.9918.78 | 27.3121.68 | 14.3915.39 | 15.311.83 | 2.945.61 | 1.231.07 | 3.783.15 | 0.030.01 | 0.020.01 | 1.450.83 |
| Mrk 766 | 11.5110.5 | 2.947.15 | 4.448.54 | 18.0518.5 | 15.315.16 | 25.8720.03 | 21.8821.12 | 1.231.35 | 5.913.39 | 0.030.01 | 0.020.01 | 2.021.08 |
| Mrk 1066 | 18.8830.18 | 1.12.23 | 61.5531.87 | 6.7513.09 | 4.857.17 | 5.96 9.7 | 0.912.11 | 0.470.3 | 1.451.29 | 0.030.01 | 0.030.01 | 0.350.48 |
| Mrk 1157 | 5.6510.28 | 0.421.97 | 19.7126.67 | 55.331.6 | 15.4814.83 | 2.033.02 | 1.41 3.4 | 1.630.92 | 3.521.92 | 0.03 0.0 | 0.030.01 | 0.22 0.3 |
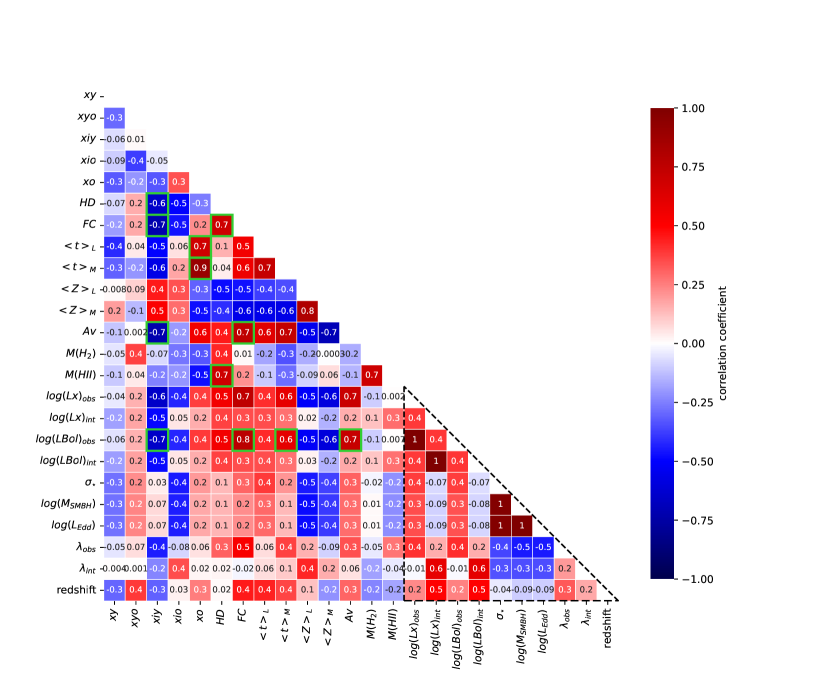
When merging Tab. 1 and Tab. 2 data together we are left with a large set of properties. To compare all the properties we have computed the Pearson standard correlation coefficient matrix using the seaborn statistical data visualisation Python package (Waskom, 2021). The diagonal correlation matrix is shown in Fig. 5 where the triangle traced by dashed lines shows the correlation coefficients of properties obtained by derivations that may depend on each other (, , , , , , , , and redshift) and therefore will not be discussed here, but are left in the figure for completeness.
4.3 Caveats on hot dust versus featureless continuum: possible degeneracies
Our analysis points towards the detection of and/or outside the unresolved nucleus in nearly half of the sources (NGC 4151, Mrk 79, NGC 3227, NGC 3516, NGC 4235, NGC 5506, Mrk 766, NGC 1068, NGC 2110, NGC 5548 and Mrk 1066).
The case of the component is a known and common problem in the study of the stellar content of Seyfert galaxies. It is related to the fact that the continuum of a reddened young starburst (t 5 Myr) is indistinguishable from an AGN-type continuum, which is why we have not added such young (t 10 Myr) components in the base of elements (for more details see Riffel et al., 2009, and references therein). This could be used to explain the fact of the component showing up outside the unresolved region, in the case of regions dominated by the very young populations (J or J+H bands dominated by young stellar populations). In this case, this fraction would no be a true AGN component, but due to a very young reddened stellar population.
As can be seen from Fig. 1 a degeneracy between and components can occur when the hot dust (or FC) dominates the K-band emission and the stellar population dominates the J-Band (or J+H). In that case, the main distinguishing characteristic will be the slope of the continuum in the K-band. In this case, the component is hardly distinguishable from dust with K. In contrast, in situations where either stellar light dominates all three bands (i.e. away from the nucleus), or the + dominate all bands (right on the nucleus), there will be no issue. The degeneracy will only show up in the transition regions. In order to test this, we performed a fit in which we only included the component in the central (=2 pixels) unresolved region. For the cases where there had been some fraction of in the outer region, this was now redistributed among the components, with very little going into the SSP components.
Complementing these tests is the fact that the and correlation is only strong for larger fractions of . We interpret this as implying that when there is a significant fraction ( 15 percent), it can be associated with the accretion disc emission. This result is in agreement with the fact that broad components in polarised light are associated with larger fractions of the component (Cid Fernandes & Terlevich, 1995; Cid Fernandes et al., 2004; Riffel et al., 2009).
These results, taken together with the fact that hot dust emission outside the unresolved region has been previously reported in AGNs (e.g. Davies et al., 2005; Dottori et al., 2005; Gratadour et al., 2006; Martins et al., 2010; Storchi-Bergmann et al., 2012; Gaspar et al., 2019), makes us to interpret the detected in the transition regions (outside the unresolved region) as due to hot dust emission (which, in that case, would be heated by young stellar populations) or to a reddened very young stellar population, and not to a true AGN component.
5 Discussion
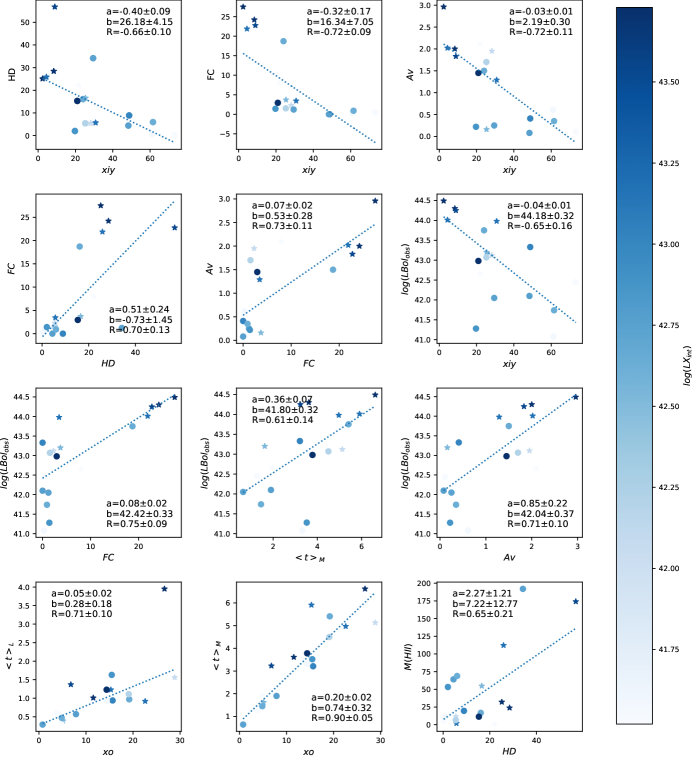
When inspecting the correlation matrix (Fig 5) we see that several quantities are well correlated (|R|0.5). After removing the possible correlations with , since they should be the same as those with (that was derived using ), we have made scatter plots for all potential correlations (|r|0.5). These are shown in Fig. 6 together with a linear fit to the data points (dotted blue line) obtained using bootstrap realisations (Davison & Hinkley, 1997) with the Huber Regressor model that is robust to outliers (Owen, 2007). The Pearson’s correlation coefficient (), slope (a) and intercept (b) are also quoted. The uncertainties on the correlation coefficients are the standard deviation of the mean after 1000 bootstrap realisations. We have only considered as statistically significant correlations where the difference between the modulus of the mean value minus the standard deviation was larger than 0.45 (0.45). From this we got the following meaningful correlations: ; ; ; ; ; ; ; ; ; ; and .
A clear anti-correlation of the intermediate young (; 500 Myr 700 Myr) stellar population component with the two featureless AGN components (HD and FC) and reddening is observed. This is further confirmed by the correlation of and as well as and , since these quantities are individually related with .
In addition, is also anti-correlated with the logarithm of the observed bolometric luminosity and there is a trend in the sense that higher intrinsic X-ray luminosity is observed for higher fractions of , and (see Fig 6).
The correlation between the X-ray luminosity (seen via the correlations with ) and , and can be tentatively attributed to the fact that all these properties are linked to the mass accretion rate onto the AGN, as follows. More means more gas, thus more fuel to the AGN, and more fuel results in increased accretion rate. This in turn leads to higher luminosity of the accretion disk, thus increased contribution of the continuum. This continuum is the source of the heating of the circumnuclear dust, and thus the contribution also increases. A closer look at these plots (third row of panels in Fig. 6) shows that the correlation is dominated by the most luminous sources (43.5) and can be understood as due to the fact that, for the low luminosity end, secondary parameters may play an important role (see Yang et al., 2015, for example).
The anti-correlation of the above properties with may be a secondary effect, resulting from the fact that all of them are correlated, meaning that, when all their contributions increase, the result is a decreased contribution of the stellar population.
The mean ages (light and mass weighted) are well correlated with the component and a tighter correlation is observed between and , due to the non-linear behaviour of the M/L fractions of stellar populations (see Riffel et al., 2009, for additional discussion). However, it is important to note that the fractions of are less than 30 percent and that the mean age is actually dominated by the younger components (see Eq. 3).
is correlated with the mass of H ii and with the fraction, suggesting that the hot dust present in the inner region of these galaxies is heated by the AGN . This is in agreement with the previous interpretation: more gas means increased accretion rate, increasing the , which increases the heating of the dust, resulting in a larger fraction.
As expected is well correlated with the fraction, since the bolometric luminosity is primarily driven by the AGN accretion disk emission. This correlation is very strong for 15 percent, while for small values of a scatter is observed (see § 4.3).
A correlation of and is also observed. This correlation remains when, instead of the mass-weighted mean ages, we use the light-weighted ones. However, it is weaker, but in the case of light weighted mean ages the values for almost all sources are 1.5 Gy. We interpret this correlation as due to a delay between the formation of new stars and the triggering/feeding of the AGN. The cold gas that reaches the SMBH most probably is originated from the mass-loss from intermediate age stars, as proposed by Davies et al. (2007) who found that star formation inhibits accretion, and that gas accretion into the SMBH is only efficient after these early turbulent phases of stellar feedback. The gas released by this intermediate age population has a low velocity (a few hundred ) and is accreted together with the gas already available in the central region (e.g. Cuadra et al., 2006; Hopkins, 2012). This extra amount of gas will trigger the AGN (or make it brighter). The intermediate age population is dominated by C- and O-rich stars (e.g. Maraston, 2005; Dottori et al., 2005; Riffel et al., 2007; Riffel et al., 2015; Salaris et al., 2014), and these short lived stars (0.2 – 2 Gyr; ) do release enriched material to the nuclear environment (fuelling the AGN). This material would remain, held back by the central potential, and may explain the that is observed outside the unresolved nucleus.
We also compared our findings with the optical stellar population results of Burtscher et al. (2021). They analyzed the inner 150 pc of nine AGN hosts from a complete volume-limited sample of targets with from the Local Luminous AGN with Matched Analogs (LLAMA) sample. Out of their nine AGNs, they detected young SPs in seven. On average, the light contribution555It is worth mentioning that the comparison of optical and NIR young stellar populations is not direct (Riffel et al., 2011b). from these young stellar populations was 4.5%, compared to 11.8% in our sample. Another difference between our results and theirs is the fact that in all their AGNs except one, the light is dominated by old SPs, whereas this is the case for only two of our galaxies (NGC 3227 and NGC 5548). A similar analysis was done by Dahmer-Hahn et al. (2021), who analyzed the stellar populations using optical IFU data of 14 AGN (being the optical counterpart of the present sample). Similarly to the results of Burtscher et al. (2021), nine of their objects have evidence of young SPs in the inner 150 pc, with an average light contribution of 7 %. Also, their sample is also dominated by old SPs, with more than 70 % of the light coming from SPs older than 2 Gyr stellar populations.
Compared to these optical works, we detected young and intermediate-age SPs in a higher fraction of galaxies, and with a higher average contribution. This is a direct consequence of the lower reddening effects in the NIR, meaning that we can access SPs which are inaccessible in the optical due to dust obscuration, together with the fact that the NIR is more sensitive to the colder bright stellar phases (Maraston, 2005; Salaris et al., 2014; Riffel et al., 2011a; Riffel et al., 2011b; Riffel et al., 2015).
As discussed above, in Fig. 6 we have obtained a mean value of the stellar population properties for the inner 125 pc of each galaxy. In order to better understand the variation of these properties as a function of distance to the nucleus, we have computed mean and median profiles inside this region (which is the full FoV in the case of NGC3227) for the full sample. The resulting profiles are presented in Fig. 7, as well as the corresponding standard deviations.
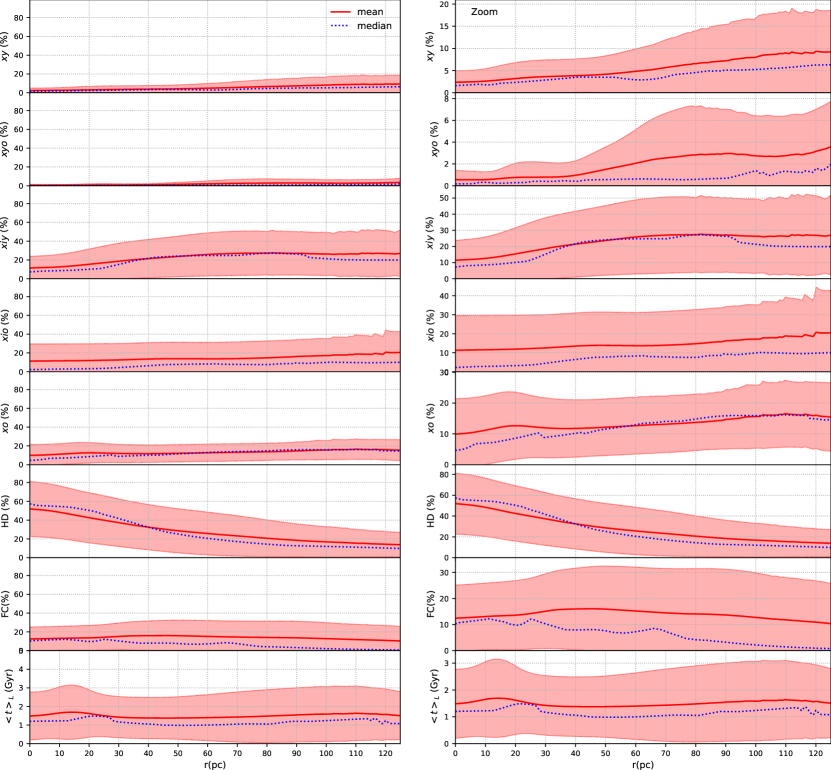
What emerges from this exercise is that the inner few parsecs (r 40 pc) of the galaxies have their emission dominated by hot dust emission () and in terms of stellar content they are dominated by intermediate age stellar populations ( and ). This is reflected by the profile, which is nearly constant ( 1 Gyr) over the inner 125 pc, reaching a maximum value of 2 Gyr.
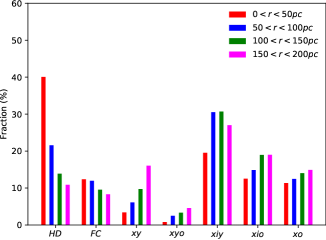
In order to better understand the radial behaviour of the SFH over our sample we have produced mean values for the SPCs of our sample in four radial bins666The mean value over the profiles shown in Fig. 7 inside the four regions.. The result of this procedure is shown in Fig. 8, where we show the mean values for the , , , , , , and for the different radial bins (in red for 50 pc, in blue for 50 pc 100 pc, in gree for 100 pc 150 pc, and in magenta for 150 pc 200 pc.). What emerges from this plot is that the and components decrease outwards; and increase from small to larger scales; while , , and are nearly constant over the FoV (showing a small trend to increase outwards).
We interpret this result as the fact that the AGN is impacting on the recent star formation, in the sense that it can be associated with the decrease of young star formation towards the nuclear region. Another interesting point is that all the components older than (t500 Myr) are nearly constant over the FoV. We speculate that this maybe because any episodic nature of the star formation rate is removed on those longer timescales. In particular, especially for and , we are looking at bulge stars along the line of sight which one would not expect to be affected by what is going on in the disk plane at small scales.
When inspecting the panel of Fig. 6 we observe that on one hand the correlation becomes weaker for higher factions of (the same regime where and shows a tight correlation). On the other hand, for the case of low ( percent), tends to be low too. As can be seen in Fig. 6 the majority of these points cover a wide range of and . We suggest that in these cases either the luminosity is low or they are very obscured, so that no leaks out and even the , in these central regions ( pc), is hidden.
This is further supported by the fact that there is only a small correlation between and (Fig. 5). We interpret this as due to the inclusion of both type one and type two sources in our analysis, and the fact that emission is more common in Sy 1 than in Sy 2s (Riffel et al., 2009). In addition Burtscher et al. (2015) showed that there is a good correlation between and AGN luminosity (Fig 9 of that paper) for Sy 1, but the Sy 2 are offset by about an order of magnitude with a larger scatter. They associate this with a general reduction in the derived apparent temperature from type 1 to type 2 sources, with both effects being due to extinction.
6 Conclusions
We present a spatially resolved stellar population study of the inner few tens of pc in a volume limited complete sample of nearby AGNs. This study was performed with adaptive optics assisted observations in the NIR. Our main results are summarised as follows:
-
•
In general, the galaxies display a very complex (e.g. many components are required to fit the underlying continuum) star formation history in the central region.
-
•
In terms of stellar populations, the light in the FoV of the galaxies is due to a considerable fraction of young (+) stellar populations. The central region is dominated by an intermediate age population (+), with a significant fraction of old bulge stars.
-
•
The inner region of the galaxies has centrally peaked hot dust emission inside the unresolved region. On the other hand, for the contribution we found that for nearly half of the sources this component reaches the highest values outside the unresolved nucleus. We have interpreted this as most likely due to dust emission rather than scattered light from the accretion disc.
-
•
We found a correlation between the X-ray luminosity and , and . We attributed this correlation to the link they all have to the mass accretion rate onto the AGN: the AGN featureless continuum is produced by the accretion of gas, which is associated with more reddening; and it is also the source of heating for the circumnuclear dust, and thus increases the contribution.
-
•
We also found an anti-correlation of , , , and with . We attribute it as a secondary effect, resulting from the fact that all of them are correlated, meaning that, when all their contributions increase, the result is a decreased contribution of the stellar population.
-
•
A correlation of with the mean age was also found. We attribute this correlation as due to the gas that is ejected by the intermediate age population (at a 100 pc scale) during the stellar evolution phases being used to feed the AGN.
-
•
We also found that and components decrease outwards, and increase from small to lager scales, while , , and are nearly constant over the analysed region.
In general, our results show that there is a significant fraction of young stellar populations in the inner region of the active galaxies, suggesting that the inner region of these sources is facing a rejuvenation process with the AGN impacting on the recent star formation, in the sense that it can be associated with the decrease of young star formation towards the nuclear region.
Acknowledgments
We thank an anonymous referee for useful suggestions which helped to improve the paper. RR thanks to Conselho Nacional de Desenvolvimento Científico e Tecnológico ( CNPq, Proj. 311223/2020-6, 304927/2017-1 and 400352/2016-8), Fundação de amparo à pesquisa do Rio Grande do Sul (FAPERGS, Proj. 16/2551-0000251-7 and 19/1750-2), Coordenação de Aperfeiçoamento de Pessoal de Nível Superior (CAPES, Proj. 0001). N.Z.D. acknowledges partial support from FONDECYT through project 3190769. CR acknowledges support from the Fondecyt Iniciacion grant 11190831 and ANID BASAL project FB210003. R.A.R acknowledges support from CNPq and Fapergs. M.B thanks to CAPES (Finance code 001).
Based on observations obtained at the Gemini Observatory, which is operated by the Association of Universities for Research in Astronomy, Inc., under a cooperative agreement with the NSF on behalf of the Gemini partnership: the National Science Foundation (United States), the Science and Technology Facilities Council (United Kingdom), the National Research Council (Canada), CONICYT (Chile), the Australian Research Council (Australia), Ministério da Ciência e Tecnologia (Brazil) and south-eastCYT (Argentina).
This research has made use of the NASA/IPAC Extragalactic Database (NED) which is operated by the Jet Propulsion Laboratory, California Institute of Technology, under contract with the National Aeronautics and Space Administration. We acknowledge the usage of the HyperLeda database (http://leda.univ-lyon1.fr).
This research made use of Photutils, an Astropy package for detection and photometry of astronomical sources (Bradley et al., 2019)
Data Availability
The NIFS data used in this paper are available in the Gemini Observatory Archive 777https://archive.gemini.edu/searchform. They can also be shared by the first author under reasonable request.
References
- Ajello et al. (2012) Ajello M., Alexander D. M., Greiner J., Madejski G. M., Gehrels N., Burlon D., 2012, The Astrophysical Journal, 749, 21
- Alexander & Hickox (2012) Alexander D. M., Hickox R. C., 2012, New Astronomy Reviews, 56, 93
- Alonso-Herrero et al. (2019) Alonso-Herrero A., et al., 2019, Astronomy & Astrophysics, Volume 628, id.A65, $<$NUMPAGES$>$17$<$/NUMPAGES$>$ pp., 628, A65
- Alonso-Herrero et al. (2020) Alonso-Herrero A., et al., 2020, Astronomy & Astrophysics, Volume 639, id.A43, $<$NUMPAGES$>$17$<$/NUMPAGES$>$ pp., 639, A43
- Antonucci (1993) Antonucci R., 1993, Annual Review of Astron and Astrophys, 31, 473
- Asari et al. (2007) Asari N. V., Cid Fernandes R., Stasińska G., Torres-Papaqui J. P., Mateus A., Sodré L., Schoenell W., Gomes J. M., 2007, Monthly Notices of the Royal Astronomical Society, 381, 263
- Astropy Collaboration et al. (2018) Astropy Collaboration et al., 2018, The Astronomical Journal, 156, 123
- Barbosa et al. (2009) Barbosa F. K. B., Storchi-Bergmann T., Cid Fernandes R., Winge C., Schmitt H., 2009, Monthly Notices of the Royal Astronomical Society, 396, 2
- Barbosa et al. (2014) Barbosa F. K. B., Storchi-Bergmann T., McGregor P., Vale T. B., Rogemar Riffel A., 2014, Monthly Notices of the Royal Astronomical Society, 445, 2353
- Barvainis (1987) Barvainis R., 1987, The Astrophysical Journal, 320, 537
- Bewketu Belete et al. (2021) Bewketu Belete A., et al., 2021, Astronomy & Astrophysics, Volume 654, id.A24, $<$NUMPAGES$>$13$<$/NUMPAGES$>$ pp., 654, A24
- Bianchin et al. (2022) Bianchin M., et al., 2022, Monthly Notices of the Royal Astronomical Society, 510, 639
- Bieri et al. (2016) Bieri R., Dubois Y., Silk J., Mamon G. A., Gaibler V., 2016, Monthly Notices of the Royal Astronomical Society, 455, 4166
- Bradley et al. (2019) Bradley L., et al., 2019, Astropy/Photutils: V0.6, Zenodo, doi:10.5281/zenodo.2533376
- Burtscher et al. (2015) Burtscher L., et al., 2015, Astronomy & Astrophysics, Volume 578, id.A47, $<$NUMPAGES$>$15$<$/NUMPAGES$>$ pp., 578, A47
- Burtscher et al. (2021) Burtscher L., et al., 2021, arXiv:2105.05309 [astro-ph]
- Caglar et al. (2020) Caglar T., et al., 2020, Astronomy and Astrophysics, 634, A114
- Cappellari (2017) Cappellari M., 2017, Monthly Notices of the Royal Astronomical Society, 466, 798
- Cardamone et al. (2007) Cardamone C. N., Moran E. C., Kay L. E., 2007, The Astronomical Journal, 134, 1263
- Cardelli et al. (1989) Cardelli J. A., Clayton G. C., Mathis J. S., 1989, The Astrophysical Journal, 345, 245
- Cid Fernandes (2018) Cid Fernandes R., 2018, Monthly Notices of the Royal Astronomical Society, 480, 4480
- Cid Fernandes & Terlevich (1995) Cid Fernandes Jr. R., Terlevich R., 1995, Monthly Notices of the Royal Astronomical Society, 272, 423
- Cid Fernandes et al. (2004) Cid Fernandes R., Gu Q., Melnick J., Terlevich E., Terlevich R., Kunth D., Rodrigues Lacerda R., Joguet B., 2004, Monthly Notices of the RAS, 355, 273
- Cid Fernandes et al. (2005) Cid Fernandes R., Mateus A., Sodré L., Stasińska G., Gomes J. M., 2005, Monthly Notices of the RAS, 358, 363
- Conroy (2013) Conroy C., 2013, Annual Review of Astron and Astrophys, 51, 393
- Crain et al. (2015) Crain R. A., et al., 2015, Monthly Notices of The Royal Astronomical Society, 450, 1937
- Croton et al. (2006) Croton D. J., et al., 2006, Monthly Notices of The Royal Astronomical Society, 365, 11
- Cuadra et al. (2006) Cuadra J., Nayakshin S., Springel V., Di Matteo T., 2006, Monthly Notices of the Royal Astronomical Society, 366, 358
- Dahmer-Hahn et al. (2019a) Dahmer-Hahn L. G., et al., 2019a, Monthly Notices of the RAS, 482, 5211
- Dahmer-Hahn et al. (2019b) Dahmer-Hahn L. G., et al., 2019b, Monthly Notices of the Royal Astronomical Society, 489, 5653
- Dahmer-Hahn et al. (2021) Dahmer-Hahn L. G., et al., 2021, Stellar Populations in Local AGNs: Evidence for Enhanced Star Formation in the Inner 100pc
- Dametto et al. (2019) Dametto N. Z., et al., 2019, Monthly Notices of the RAS, 482, 4437
- Davies et al. (2005) Davies R. I., Sternberg A., Lehnert M. D., Tacconi-Garman L. E., 2005, The Astrophysical Journal, 633, 105
- Davies et al. (2007) Davies R. I., Müller Sánchez F., Genzel R., Tacconi L. J., Hicks E. K. S., Friedrich S., Sternberg A., 2007, Astrophysical Journal, 671, 1388
- Davies et al. (2015) Davies R. I., et al., 2015, Astrophysical Journal, 806, 127
- Davies et al. (2017) Davies R. I., et al., 2017, Monthly Notices of the Royal Astronomical Society, 466, 4917
- Davison & Hinkley (1997) Davison A. C., Hinkley D. V., 1997, Bootstrap Methods and Their Application, /core/books/bootstrap-methods-and-their-application/ED2FD043579F27952363566DC09CBD6A, doi:10.1017/CBO9780511802843
- Di Matteo et al. (2005) Di Matteo T., Springel V., Hernquist L., 2005, Nature, 433, 604
- Dias et al. (2010) Dias B., Coelho P., Barbuy B., Kerber L., Idiart T., 2010, Astronomy and Astrophysics, 520, A85
- Diniz et al. (2019) Diniz M. R., Riffel R. A., Storchi-Bergmann T., Riffel R., 2019, Monthly Notices of the Royal Astronomical Society, 487, 3958
- Dottori et al. (2005) Dottori H., Díaz R. J., Carranza G., Lípari S., Santos Jr. J., 2005, The Astrophysical Journal, 628, L85
- El-Badry et al. (2016) El-Badry K., Wetzel A., Geha M., Hopkins P. F., Kereš D., Chan T. K., Faucher-Giguère C.-A., 2016, The Astrophysical Journal, 820, 131
- Ellison et al. (2016) Ellison S. L., Teimoorinia H., Rosario D. J., Mendel J. T., 2016, Monthly Notices of the Royal Astronomical Society, 458, L34
- Ellison et al. (2021) Ellison S. L., et al., 2021, Monthly Notices of the Royal Astronomical Society, 505, L46
- Esquej et al. (2014) Esquej P., et al., 2014, Astrophysical Journal, 780, 86
- Fabian (2012) Fabian A. C., 2012, Annual Review of Astronomy and Astrophysics, 50, 455
- Ferrarese & Merritt (2000) Ferrarese L., Merritt D., 2000, The Astrophysical Journal, 539, L9
- Gallagher et al. (2019) Gallagher R., Maiolino R., Belfiore F., Drory N., Riffel R., Riffel R. A., 2019, Monthly Notices of the Royal Astronomical Society, 485, 3409
- Gao et al. (2020) Gao F., et al., 2020, Astronomy & Astrophysics, Volume 637, id.A94, $<$NUMPAGES$>$16$<$/NUMPAGES$>$ pp., 637, A94
- García-Burillo et al. (2019) García-Burillo S., et al., 2019, Astronomy and Astrophysics, 632, A61
- García-Burillo et al. (2021) García-Burillo S., et al., 2021, Astronomy and Astrophysics, 652, A98
- Garcia-Rissmann et al. (2005) Garcia-Rissmann A., Vega L. R., Asari N. V., Cid Fernandes R., Schmitt H., González Delgado R. M., Storchi-Bergmann T., 2005, Monthly Notices of the Royal Astronomical Society, 359, 765
- Gaspar et al. (2019) Gaspar G., Díaz R. J., Mast D., D’Ambra A., Agüero M. P., Günthardt G., 2019, The Astronomical Journal, 157, 44
- Ge et al. (2018) Ge J., Yan R., Cappellari M., Mao S., Li H., Lu Y., 2018, Monthly Notices of the Royal Astronomical Society, 478, 2633
- Gebhardt et al. (2000) Gebhardt K., et al., 2000, The Astrophysical Journal, 539, L13
- Goddard et al. (2017) Goddard D., et al., 2017, Monthly Notices of the Royal Astronomical Society, 466, 4731
- Gomes & Papaderos (2017) Gomes J. M., Papaderos P., 2017, Astronomy and Astrophysics, 603, A63
- Goulding et al. (2018) Goulding A. D., et al., 2018, Publications of the Astronomical Society of Japan, 70
- Granato & Danese (1994) Granato G. L., Danese L., 1994, Monthly Notices of the Royal Astronomical Society, 268, 235
- Granato et al. (2004) Granato G. L., De Zotti G., Silva L., Bressan A., Danese L., 2004, The Astrophysical Journal, 600, 580
- Gratadour et al. (2006) Gratadour D., Rouan D., Mugnier L. M., Fusco T., Clénet Y., Gendron E., Lacombe F., 2006, Astronomy and Astrophysics, 446, 813
- Greene & Ho (2006) Greene J. E., Ho L. C., 2006, The Astrophysical Journal Letters, 641, L21
- Harrison (2017) Harrison C. M., 2017, Nature Astronomy, 1, 1
- Heckman & Best (2014) Heckman T. M., Best P. N., 2014, Annual Review of Astronomy and Astrophysics, vol. 52, p.589-660, 52, 589
- Hennig et al. (2018) Hennig M. G., Riffel R. A., Dors O. L., Riffel R., Storchi-Bergmann T., Colina L., 2018, Monthly Notices of the Royal Astronomical Society, 477, 1086
- Hickox et al. (2014) Hickox R. C., Mullaney J. R., Alexander D. M., Chen C.-T. J., Civano F. M., Goulding A. D., Hainline K. N., 2014, The Astrophysical Journal, 782, 9
- Hinshaw et al. (2013) Hinshaw G., et al., 2013, The Astrophysical Journal Supplement Series, 208, 19
- Ho et al. (2009) Ho L. C., Greene J. E., Filippenko A. V., Sargent W. L. W., 2009, The Astrophysical Journal Supplement Series, 183, 1
- Hopkins (2012) Hopkins P. F., 2012, Monthly Notices of the RAS, 420, L8
- Hopkins & Elvis (2010) Hopkins P. F., Elvis M., 2010, Monthly Notices of the Royal Astronomical Society, 401, 7
- Ichikawa et al. (2017) Ichikawa K., Ricci C., Ueda Y., Matsuoka K., Toba Y., Kawamuro T., Trakhtenbrot B., Koss M. J., 2017, The Astrophysical Journal, 835, 74
- Ishibashi & Fabian (2012) Ishibashi W., Fabian A. C., 2012, Monthly Notices of the Royal Astronomical Society, 427, 2998
- Johnson et al. (2021) Johnson B. D., Leja J., Conroy C., Speagle J. S., 2021, The Astrophysical Journal Supplement Series, 254, 22
- Kawakatu & Wada (2008) Kawakatu N., Wada K., 2008, Astrophysical Journal, 681, 73
- Kennicutt & Evans (2012) Kennicutt R. C., Evans N. J., 2012, Annual Review of Astronomy and Astrophysics, 50, 531
- King & Pounds (2015) King A., Pounds K., 2015, Annual Review of Astronomy and Astrophysics, 53, 115
- Knapen et al. (2000) Knapen J. H., Shlosman I., Peletier R. F., 2000, The Astrophysical Journal, 529, 93
- Koleva et al. (2008) Koleva M., Prugniel P., Ocvirk P., Le Borgne D., Soubiran C., 2008, Monthly Notices of the Royal Astronomical Society, 385, 1998
- Koleva et al. (2009) Koleva M., Prugniel P., Bouchard A., Wu Y., 2009, Astronomy and Astrophysics, 501, 1269
- Kormendy & Ho (2013) Kormendy J., Ho L. C., 2013, Annual Review of Astron and Astrophys, 51, 511
- Koski (1978) Koski A. T., 1978, The Astrophysical Journal, 223, 56
- Koss et al. (2017) Koss M., et al., 2017, The Astrophysical Journal, 850, 74
- LaMassa et al. (2011) LaMassa S. M., Heckman T. M., Ptak A., Martins L., Wild V., Sonnentrucker P., Hornschemeier A., 2011, The Astrophysical Journal, 729, 52
- Lopes et al. (2007) Lopes R. D. S., Storchi-Bergmann T., Saraiva M. d. F., Martini P., 2007, The Astrophysical Journal, 655, 718
- Maccagni et al. (2014) Maccagni F. M., Morganti R., Oosterloo T. A., Mahony E. K., 2014, Astronomy & Astrophysics, Volume 571, id.A67, $<$NUMPAGES$>$8$<$/NUMPAGES$>$ pp., 571, A67
- Madau & Dickinson (2014) Madau P., Dickinson M., 2014, Annual Review of Astronomy and Astrophysics, vol. 52, p.415-486, 52, 415
- Magorrian et al. (1998) Magorrian J., et al., 1998, The Astronomical Journal, 115, 2285
- Maiolino et al. (2017) Maiolino R., et al., 2017, Nature, 544, 202
- Mallmann et al. (2018) Mallmann N. D., et al., 2018, Monthly Notices of the Royal Astronomical Society, 478, 5491
- Maraston (2005) Maraston C., 2005, Monthly Notices of the RAS, 362, 799
- Marian et al. (2020) Marian V., et al., 2020, The Astrophysical Journal, 904, 79
- Marshall et al. (2018) Marshall M. A., Shabala S. S., Krause M. G. H., Pimbblet K. A., Croton D. J., Owers M. S., 2018, Monthly Notices of the Royal Astronomical Society, 474, 3615
- Martins et al. (2010) Martins L. P., Riffel R., Rodríguez-Ardila A., Gruenwald R., de Souza R., 2010, Monthly Notices of the RAS, 406, 2185
- Mason et al. (2015) Mason R. E., et al., 2015, Astrophysical Journal, Supplement, 217, 13
- Mauduit & Mamon (2007) Mauduit J.-C., Mamon G. A., 2007, Astronomy and Astrophysics, Volume 475, Issue 1, November III 2007, pp.169-185, 475, 169
- McGregor et al. (2003) McGregor P. J., et al., 2003, Instrument Design and Performance for Optical/Infrared Ground-based Telescopes. Edited by Iye, Masanori; Moorwood, Alan F. M. Proceedings of the SPIE, 4841, 1581
- Nayakshin & Zubovas (2012) Nayakshin S., Zubovas K., 2012, Monthly Notices of the Royal Astronomical Society, 427, 372
- Novak et al. (2011) Novak G. S., Ostriker J. P., Ciotti L., 2011, The Astrophysical Journal, 737, 26
- Ocvirk et al. (2006) Ocvirk P., Pichon C., Lançon A., Thiébaut E., 2006, Monthly Notices of the Royal Astronomical Society, 365, 46
- Oh et al. (2018) Oh K., et al., 2018, The Astrophysical Journal Supplement Series, 235, 4
- Oliva et al. (1999) Oliva E., Origlia L., Maiolino R., Moorwood A. F. M., 1999, Astronomy and Astrophysics, 350, 9
- Owen (2007) Owen A., 2007, Contemp. Math., 443
- Pan et al. (2019) Pan H.-A., et al., 2019, The Astrophysical Journal, 881, 119
- Prieto et al. (2019) Prieto M. A., Fernandez-Ontiveros J. A., Bruzual G., Burkert A., Schartmann M., Charlot S., 2019, Monthly Notices of the Royal Astronomical Society, 485, 3264
- Ramos-Almeida & Ricci (2017) Ramos-Almeida C. R., Ricci C., 2017, Nature Astronomy, 1, 679
- Rees (1989) Rees M. J., 1989, Monthly Notices of the Royal Astronomical Society, 239, 1P
- Reichard et al. (2009) Reichard T. A., Heckman T. M., Rudnick G., Brinchmann J., Kauffmann G., Wild V., 2009, The Astrophysical Journal, 691, 1005
- Ricci et al. (2015) Ricci C., Ueda Y., Koss M. J., Trakhtenbrot B., Bauer F. E., Gandhi P., 2015, The Astrophysical Journal, 815, L13
- Ricci et al. (2017) Ricci C., et al., 2017, The Astrophysical Journal Supplement Series, 233, 17
- Riffel et al. (2006) Riffel R., Rodríguez-Ardila A., Pastoriza M. G., 2006, Astronomy and Astrophysics, 457, 61
- Riffel et al. (2007) Riffel R., Pastoriza M. G., Rodríguez-Ardila A., Maraston C., 2007, Astrophysical Journal, Letters, 659, L103
- Riffel et al. (2009) Riffel R., Pastoriza M. G., Rodríguez-Ardila A., Bonatto C., 2009, Monthly Notices of the RAS, 400, 273
- Riffel et al. (2010) Riffel R. A., Storchi-Bergmann T., Riffel R., Pastoriza M. G., 2010, Astrophysical Journal, 713, 469
- Riffel et al. (2011a) Riffel R., Ruschel-Dutra D., Pastoriza M. G., Rodríguez-Ardila A., Santos Jr. J. F. C., Bonatto C. J., Ducati J. R., 2011a, Monthly Notices of the RAS, 410, 2714
- Riffel et al. (2011b) Riffel R., Bonatto C., Cid Fernandes R., Pastoriza M. G., Balbinot E., 2011b, Monthly Notices of the RAS, 411, 1897
- Riffel et al. (2011c) Riffel R., Riffel R. A., Ferrari F., Storchi-Bergmann T., 2011c, Monthly Notices of the RAS, 416, 493
- Riffel et al. (2013a) Riffel R. A., et al., 2013a, Monthly Notices of the RAS, 429, 2587
- Riffel et al. (2013b) Riffel R., Rodríguez-Ardila A., Aleman I., Brotherton M. S., Pastoriza M. G., Bonatto C., Dors O. L., 2013b, Monthly Notices of the RAS, 430, 2002
- Riffel et al. (2014) Riffel R. A., Vale T. B., Storchi-Bergmann T., McGregor P. J., 2014, Monthly Notices of the Royal Astronomical Society, 442, 656
- Riffel et al. (2015) Riffel R., et al., 2015, Monthly Notices of the RAS, 450, 3069
- Riffel et al. (2016) Riffel R. A., et al., 2016, Monthly Notices of the Royal Astronomical Society, 461, 4192
- Riffel et al. (2017) Riffel R. A., Storchi-Bergmann T., Riffel R., Dahmer-Hahn L. G., Diniz M. R., Schönell A. J., Dametto N. Z., 2017, Monthly Notices of the Royal Astronomical Society, 470, 992
- Riffel et al. (2018) Riffel R. A., et al., 2018, Monthly Notices of the Royal Astronomical Society, 474, 1373
- Riffel et al. (2019) Riffel R., et al., 2019, Monthly Notices of the Royal Astronomical Society, 486, 3228
- Riffel et al. (2021a) Riffel R., et al., 2021a, Monthly Notices of the Royal Astronomical Society, 501, 4064
- Riffel et al. (2021b) Riffel R. A., et al., 2021b, Monthly Notices of the Royal Astronomical Society, 504, 3265
- Rodríguez-Ardila et al. (2004) Rodríguez-Ardila A., Pastoriza M. G., Viegas S., Sigut T. a. A., Pradhan A. K., 2004, Astronomy and Astrophysics, v.425, p.457-474 (2004), 425, 457
- Rodríguez-Ardila et al. (2005) Rodríguez-Ardila A., Riffel R., Pastoriza M. G., 2005, Monthly Notices of the Royal Astronomical Society, 364, 1041
- Ruschel-Dutra et al. (2017) Ruschel-Dutra D., Rodríguez Espinosa J. M., González Martín O., Pastoriza M., Riffel R., 2017, Monthly Notices of the RAS, 466, 3353
- Rybicki & Lightman (1979) Rybicki G. B., Lightman A. P., 1979, New York, Wiley-Interscience, 1979. 393 p.
- Salaris et al. (2014) Salaris M., Weiss A., Cassarà L. P., Piovan L., Chiosi C., 2014, Astronomy and Astrophysics, 565, A9
- Sánchez et al. (2016) Sánchez S. F., et al., 2016, Revista Mexicana de Astronomia y Astrofisica, 52, 21
- Sarzi et al. (2007) Sarzi M., Allard E. L., Knapen J. H., Mazzuca L. M., 2007, Monthly Notices of the RAS, 380, 949
- Schawinski et al. (2015) Schawinski K., Koss M., Berney S., Sartori L. F., 2015, Monthly Notices of the Royal Astronomical Society, 451, 2517
- Schaye et al. (2015) Schaye J., et al., 2015, Monthly Notices of the Royal Astronomical Society, 446, 521
- Schlegel et al. (1998) Schlegel D. J., Finkbeiner D. P., Davis M., 1998, The Astrophysical Journal, 500, 525
- Schönell et al. (2017) Schönell Jr. A. J., Storchi-Bergmann T., Riffel R. A., Riffel R., 2017, Monthly Notices of the Royal Astronomical Society, 464, 1771
- Springel et al. (2005) Springel V., et al., 2005, Nature, 435, 629
- Storchi-Bergmann & Schnorr-Müller (2019) Storchi-Bergmann T., Schnorr-Müller A., 2019, Nature Astronomy, 3, 48
- Storchi-Bergmann et al. (2001) Storchi-Bergmann T., González Delgado R. M., Schmitt H. R., Cid Fernandes R., Heckman T., 2001, Astrophysical Journal, 559, 147
- Storchi-Bergmann et al. (2009) Storchi-Bergmann T., McGregor P. J., Riffel R. A., Simões Lopes R., Beck T., Dopita M., 2009, Monthly Notices of the RAS, 394, 1148
- Storchi-Bergmann et al. (2010) Storchi-Bergmann T., Lopes R. D. S., McGregor P. J., Riffel R. A., Beck T., Martini P., 2010, Monthly Notices of the RAS, 402, 819
- Storchi-Bergmann et al. (2012) Storchi-Bergmann T., Riffel R. A., Riffel R., Diniz M. R., Borges Vale T., McGregor P. J., 2012, Astrophysical Journal, 755, 87
- Terlevich et al. (1990) Terlevich E., Diaz A. I., Terlevich R., 1990, Monthly Notices of the RAS, 242, 271
- Terrazas et al. (2020) Terrazas B. A., et al., 2020, Monthly Notices of the Royal Astronomical Society, 493, 1888
- Tody (1986) Tody D., 1986, IN: Instrumentation in astronomy VI; Proceedings of the Meeting, Tucson, AZ, Mar. 4-8, 1986. Part 2 (A87-36376 15-35). Bellingham, WA, Society of Photo-Optical Instrumentation Engineers, 627, 733
- Tody (1993) Tody D., 1993, Astronomical Data Analysis Software and Systems II, A.S.P. Conference Series,, R. J. Hanisch, R. J. V. Brissenden, and Jeannette Barnes, eds.,, 52, 173
- Tojeiro et al. (2007) Tojeiro R., Heavens A. F., Jimenez R., Panter B., 2007, Monthly Notices of the Royal Astronomical Society, 381, 1252
- Trussler et al. (2020) Trussler J., Maiolino R., Maraston C., Peng Y., Thomas D., Goddard D., Lian J., 2020, Monthly Notices of the Royal Astronomical Society, 491, 5406
- Villforth et al. (2014) Villforth C., et al., 2014, Monthly Notices of the Royal Astronomical Society, 439, 3342
- Vogelsberger et al. (2014) Vogelsberger M., et al., 2014, Nature, 509, 177
- Walcher et al. (2011) Walcher J., Groves B., Budavári T., Dale D., 2011, Astrophysics and Space Science, 331, 1
- Wang & Loeb (2018) Wang X., Loeb A., 2018, New Astronomy, 61, 95
- Waskom (2021) Waskom M. L., 2021, Journal of Open Source Software, 6, 3021
- Wilkinson et al. (2017) Wilkinson D. M., Maraston C., Goddard D., Thomas D., Parikh T., 2017, Monthly Notices of the Royal Astronomical Society, 472, 4297
- Worthey et al. (1994) Worthey G., Faber S. M., Gonzalez J. J., Burstein D., 1994, Astrophysical Journal, Supplement, 94, 687
- Yang et al. (2015) Yang Q.-X., Xie F.-G., Yuan F., Zdziarski A. A., Gierliński M., Ho L. C., Yu Z., 2015, Monthly Notices of the Royal Astronomical Society, 447, 1692
- Zubovas & Bourne (2017) Zubovas K., Bourne M. A., 2017, Monthly Notices of the RAS, 468, 4956
- Zubovas et al. (2013) Zubovas K., Nayakshin S., King A., Wilkinson M., 2013, Monthly Notices of the Royal Astronomical Society, 433, 3079
See pages - of figures/SupMat.pdf