Simultaneous view of the FRB 180301 with FAST and NICER during a bursting phase
Abstract
FRB180301 is one of the most actively repeating fast radio bursts (FRBs) which has shown polarization angle changes in its radio burst emission, an indication for their likely origin in the magnetosphere of a highly-magnetized neutron star. We carried out a multi-wavelength campaign with the FAST radio telescope and NICER X-ray observatory to investigate any possible X-ray emission temporally coincident with the bright radio bursts. The observations took place on 2021 March 4, 9 and 19. We detected five bright radio bursts with FAST, four of which were strictly simultaneous with the NICER observations. The peak flux-density of the radio bursts ranged between mJy, the burst fluence between mJy-ms, and the burst durations between ms. The radio bursts from FRB 180301 exhibited complex time domain structure, and subpulses were detected in individual bursts, with no significant circular polarisation. The linear degree of polarisation in L-band reduced significantly compared to the 2019 observations. We do not detect any X-ray emission in excess of the background during the 5 ms, 10 ms, 100 ms, 1 sec and 100 sec time intervals at/around the radio-burst barycenter-corrected arrival times, at a confidence level. The upper limits on the X-ray a) persistent flux is , equivalent to and b) 5 ms fluence is , at the radio burst regions. Using the ms X-ray fluence upper limit, we can estimate the radio efficiency . The derived upper limit on is consistent with both magnetospheric models and synchrotron maser models involving relativistic shocks.
1 Introduction
Fast radio bursts (FRBs) are ms-duration radio pulses whose origin is still highly debated (Lorimer et al., 2007; Tendulkar et al., 2017; CHIME/FRB Collaboration et al., 2019a; Petroff et al., 2019; Zhang, 2020; Caleb & Keane, 2021). Recently, large radio surveys have detected several new FRBs, some of which have shown repeating emission, implying an origin which does not involve one-time cataclysmic events, such as neutron star mergers (CHIME/FRB Collaboration et al., 2019a). These repeating FRBs are interesting because they may be scrutinized in different parts of the electromagnetic spectrum over long periods of time, to attempt to reveal the physical nature of the FRB engine. One such repeating FRB (but apparently not periodic in activity) in the CHIME/FRB catalog is FRB 20180301A (hereafter FRB 180301), which was first detected by the Parkes 64-m radio telescope, and has a dispersion measure of . Bhandari et al. (2021a) identified PSO J093.2268+04.6703 as the putative host galaxy of FRB 180301. The host of FRB 180301 is located at a redshift of , implying a luminosity distance of . The Five-hundred-meter Aperture Spherical radio Telescope (FAST), which is the largest single dish radio telescope with high sensitivity, observed this source in July, September, and October 2019 for a total of 12 hours (Luo et al., 2020). The bursts detected from FRB 180301 had peak flux densities ranging from mJy. All the bursts exhibit a high degree of linear polarization, and no circular polarization was detected even for the highest signal to noise bursts. This property is similar to the other actively repeating FRB 121102, which exhibits linear polarization (Michilli et al., 2018).
Most interestingly, a considerable amount of diversity in the polarization angle (PA) swings across the pulse profile were detected by FAST for FRB 180301, which implies that the bursts are consistent with an origin from a neutron star magnetosphere and disfavors far-flung relativistic shocks (Luo et al., 2020). The PA change from one burst to another in the same source indicates that the radiation is produced within the light cylinder of a strongly magnetized neutron star. As the emitted radiation travels through the magnetosphere, the electric vector of the X-mode wave adiabatically rotates and stays perpendicular to the local magnetic field direction (the O mode is what is approximately a normal mode of the plasma). The PA freezes at a radius where the plasma density becomes too small to be able to turn the electric vector. At the freeze-out radius, the electric field is perpendicular to the magnetic dipole moment of the neutron star projected in the plane of the sky, independent of the radiation mechanism or the orientation of the magnetic field in the emission region. The changes in the PAs from FRB 180301 should therefore, trace the rotational period of the underlying neutron star.
Magnetars have been historically strongly suspected as progenitors of FRBs (Popov & Postnov, 2010, 2013; Kulkarni et al., 2014; Lyubarsky, 2014; Katz, 2016; Beloborodov, 2017; Kumar et al., 2017; Yang & Zhang, 2018; Metzger et al., 2019; Wadiasingh & Timokhin, 2019). The recent detection of FRB 200428 (Bochenek et al., 2020; CHIME/FRB Collaboration et al., 2020) temporally coincident with a hard X-ray () burst (Mereghetti et al., 2020; Li et al., 2021) from magnetar SGR 1935+2154 (SGR 1935 hereafter) in April 2020 confirmed that at least some of the FRBs are produced by magnetar bursts. The radio to X-ray data have been interpreted within the magnetar framework in several competing models (e.g. Lu et al., 2020; Margalit et al., 2020; Wadiasingh & Chirenti, 2020; Yang & Zhang, 2021; Zhang, 2022). On the other hand, the FRB luminosity detected from SGR 1935 is very low in comparison to its extragalactic counterparts, prompting yet another question of whether Galactic and extragalactic FRBs indeed have the same origin. Nevertheless, the association of the FRBs with magnetars have prompted several dedicated searches of X-ray counterparts with current X-ray observatories. One of the important steps to test magnetar or shocked-outflow models is to estimate the ratio of energy emitted in the FRBs over that in other bands (such as in X-rays), measured by the efficiency factor . In some magnetar models, this ratio is much less than unity, typically to (e.g. Lu et al., 2020; Margalit et al., 2020; Yang & Zhang, 2021). Therefore strong limits on can challenge or vindicate several models.
Following the discovery of the PA changes in the source FRB 180301 (Luo et al., 2020), we carried out a simultaneous radio-X-ray campaign in March 2021, with FAST and The Neutron Star Interior Composition Explorer Mission (NICER) telescopes to capture any X-ray emission temporally coincident with the radio bursts during the bursting phases of the FRB. There were five radio bursts from FRB 180301 during the multi-wavelength observational campaign and in this work we report a detailed analysis of the radio and X-ray observations. The paper is arranged as follows: Section 2 discusses the radio and X-ray observations and data analysis. Section 3 lists the main results followed by discussion and summary in Section 4, respectively.
2 Observations and data reduction
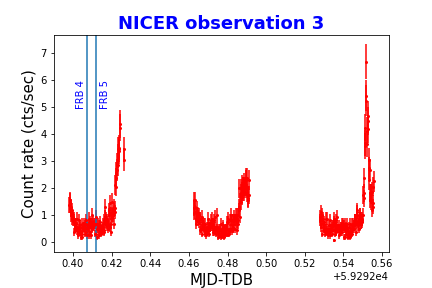
FAST (Nan et al., 2011) and NICER (Gendreau et al., 2016) observed FRB 180301 on 2021 March 4, 9, and 19. See Tables 2 and 1 for the FAST and NICER observation details, respectively. During these observations, four radio bursts were strictly contemporaneous. Below we describe the methods involved in data reprocessing and analysis of the radio and X-ray observations of FRB 180301.
2.1 FAST observations
The radio observations were carried out using FAST, of which the effective collecting area is 196,000 m2 (Nan et al., 2011). We used the central beam of the 19-beam receiver to observe. In the frequency coverage of 1000-1500 MHz, the system temperature is 20 to 25 K (Jiang et al., 2020). Observed data were recorded using the digital backend based on the Re-configurable Open Architecture Computing Hardware-2 (Roach2) board (Hickish et al., 2016), where the search data (i.e., the intensity or audio data) is formed via polyphase filterbanks and time integration on a Xilinx Virtex-6 family field-programmable gate array chip. The final temporal and frequency resolutions are 49.152 s and 122.07 kHz respectively.
We searched for the FRB candidates offline with the recorded filterbank data. The two 20-MHz band edges, i.e., 1000-1020 MHz and 1480-1500 MHz were removed due to the sensitivity loss and rapid change of signal phase. Frequency channels, which were affected by satellite RFIs in 1200-1210 MHz and 1265-1280 MHz, were also removed. The software package BEAR (Burst Emission Automatic Roger) (Men et al., 2019) is used to search for FRB candidates. Since FRB 180301 is a known repeater, we searched with a narrow DM range of 508 to 528 pc cm-3. We searched for pulses with the pulse width range of ms. Candidates with S/N larger than 6 were recorded to evaluate the red noise effects as explained in Zhang et al. (2021). Bursts with S/N larger than 7 will be visually inspected and reported in this paper. In this way, the chance of a burst being artifact is less than assuming 10% red noise power. Five bursts were detected in our observation with detailed information listed in Tab. 2.
After detection, the DM is further refined using the phase coherence spectral techniques (CHIME/FRB Collaboration et al., 2019b), which optimize the burst sharpness instead of maximising the pulse S/N.
We estimate the pulse flux assuming a 22 K system temperature, the major error of flux comes from the noise temperature variation, which is 20% as measured in the FAST engineering phase. We calculate the mean flux using radiometer equation
| (1) |
where, is the pulse width, correction factor , and = 2 is the number of polarization channels. System temperature and gain for FAST. Neglecting the intrinsic bandwidth of FRB, we calculate, hereafter, the band-averaged flux and the bandwidth is fixed to be 400MHz.
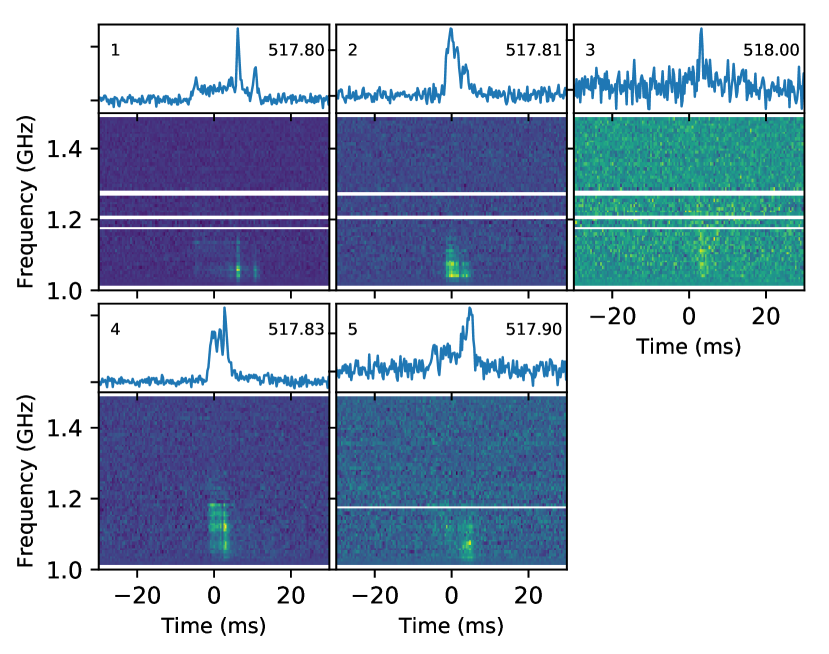
We perform polarization calibration using software Psrchive with the single-axial model(Hotan et al., 2004), i.e. we neglected the leakage terms which is measured as low as -46 dB (Dunning et al., 2017). As will be discussed shortly after, the linear polarization is very weak compared to previous observations. We plot only the total intensity pulse profiles and de-dispersed dynamic spectra as in Fig. 2.
The barycentric infinite-frequency equivalent time of arrivals are computed using Tempo2 (Hobbs et al., 2006), where Römer delay, relativity delay in Solar system, and dispersive time delay were corrected. In the process, we have adopted the position of RA , and DEC as measured with Karl G. Jansky Very Large Array (VLA) (Bhandari et al., 2021b). We understand that there may be an offset of approximately 2 mas between the The International Celestial Reference Frame (ICRF) used by VLA and solar system dynamic coordinate used by Tempo2 (Wang et al., 2017), the corresponding error in timing is 4.8 , which is negligibly small compare to the error of measured pulse width.
As in Fig 2, the radio pulse profiles of FRB 180301 can be hardly described by Gaussian-like curves. We thus measure the pulse profile using the intensity weighted width (IWW), i.e. we treat the pulse profile as the temporal intensity distribution function, and calculate the standard deviation of time. A correction factor of is multiplied to the standard derivation when we report the pulse width. The factor is introduced such that the intensity weighted width will be the full width at half maximum (FWHM) for Gaussian profiles.
2.2 NICER observations
NICER was launched in 2017 and is currently working as one of the payloads on the International Space Station (ISS). NICER consists of one instrument, the X-ray Timing Instrument (XTI), which operate in the soft X-ray band (0.2–12 keV). The data files for the three NICER observations (PI: S. Laha, see Table 1) were downloaded from HEASARC, and were reduced using the standard NICER procedure. The raw data were processed using the NICERDAS software package (version 2021-08-31_V008c) in HEASOFT (v6.29c), using the latest caldb version.
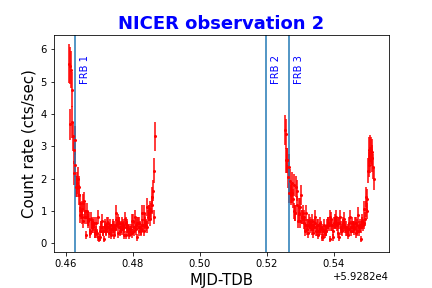
We created cleaned event files by applying the standard calibration and filtering tool, nicerl2 to the unfiltered data using the default values, and then performed barycenter corrections using barycorr. We restricted events to the 0.3–12 keV range. To remove excess background noise from the time periods surrounding NICER’s passages through the South Atlantic Anomaly (SAA), we binned the data into 16-second bins and filtered out intervals where the count rate exceeded 1.4 counts s-1 in XSELECT. This was done to obtain NICER steady background rate. Although we note that two of the bursts (burst 1 and 3) happened in the wings when the spacecraft was coming-out of the SAA. We then used XSELECT to extract light curves and spectra from the filtered data. We have used the latest response file, nixtiref20170601v002.rmf, for the spectral analysis. Note that we do not use the NICER observation 1 for further analysis in this paper because it was not simultaneous with any radio burst from FRB 180301, and also the duration was only for 700 sec, and hence the signal to noise was insufficient to carry out a detailed timing and spectral analysis.
We used Xselect to obtain the time averaged spectra for the two NICER observations. After plotting the source+background spectra, along with the modeled background spectra estimated using nicerbackgen software, we do not find any excess emission above the background.
3 Results
3.1 The radio burst properties
In the radio band, FRB 180301 exhibited complex time domain structure. Subpulses where detected in single bursts. As also detected in other repeating FRBs, subpulse frequency drifting is visible in the dynamic spectra of the burst No.4 and probably in the burst No.1 and 2.
There is no significant circular polarization in the pulse we detected as in the previous observation (Luo et al., 2020). Furthermore, we note that the linear degree of polarization in L-band reduced significantly in the March 2021 observations. The degree of linear polarization dropped to less than 10%, while it was as high as 80% in 2019. The change of the observed polarization properties may be related to the propagation effects of the FRBs, and may probe the immediate environment around the FRB source (Xu et al., 2021; Feng et al., 2022). However, no significant change in the high energy emission properties, which depend on the intrinsic radiation mechanism, is expected. The detailed analysis of polarization properties is beyond the scope of the current paper and will be published in another work.
The mean and peak flux density of our observation to FRB 180301 range from 16 to 47 mJy and 28 to 105 mJy. The pulse width runs from 1.7 ms to 12 ms. Both of the value appears quite normal for FRB 180301. All five pulses are well above 7- detection threshold. The minimal S/N of 11 indicates that the chance for any burst being spurious is less than given the total observation of 13 ks even if 10% correlated noise is included.
| NICER-obsid | Obs | Date | Exposure | FRB |
|---|---|---|---|---|
| number | (seconds) | detected? | ||
| 4533020101 | obs1 | 2021-03-04 | 1998 | No |
| 4533020102 | obs2 | 2021-03-09 | 4347 | Yes |
| 4533020103 | obs3 | 2021-03-19 | 7151 | Yes |
| Idx | Barycentric | Day | Peak | Mean | Width | S/N |
|---|---|---|---|---|---|---|
| flux density | flux density | . | ||||
| N | TOA(MJD) | mJy | mJy | ms | ||
| 1 | 59282.462719811028261 | 09March2021 | 79 | 18 | 12.30.4 | 44 |
| 2 | 59282.519910811797640 | 09March2021 | 44 | 16 | 4.10.2 | 21 |
| 3 | 59282.526543512274323 | 09March2021 | 28 | 16 | 1.70.2 | 11 |
| 4 | 59292.407031067837291 | 19March2021 | 105 | 47 | 4.100.06 | 69 |
| 5 | 59292.411839390156917 | 19March2021 | 60 | 18 | 7.90.2 | 36 |
Note: a) The major error of flux measurement comes from system temperature drift, which is approximately 20%. b) the pulse width is defined as of the intensity weighted width, which agrees with the definition of FWHM for Gaussian profiles.
3.2 NICER Persistent Emission Flux Upper Limits
We do not detect any excess counts in the spectra above the NICER modeled background, which implies that the spectra is entirely dominated by background. Given this fact, we used the following steps to estimate the upper limit on the persistent flux for the source, for the given duration of the observations: Understanding that the observed spectra (for both the observations) are background dominated, we used the following procedure to obtain the flux upper limit on a possible source detection. We note that the background count rate in the in the region of the bursts 4 and 5 is counts/s, which implies a background flux of , using webpimms, with a power law slope of , Galactic absorption column density of (Heasarc (Kalberla et al., 2005)) and intrinsic absorption column of at . A simple power law ( frozen) fit to the observed time integrated spectrum of the source for observation 2 gives a error-on-background-flux . Hence the net upper limit on the background, over which any signal registered can be confidently identified as a detection, can be estimated by: upper-limit=background-flux + 5error-on-background-flux+ of the background-flux. Note that we assumed of the background flux as systematic error, which is a conservative upper limit. Adopting the above prescription, the corresponding persistent flux upper limit is over observations 2 and 3. The corresponding upper limit on the intrinsic persistent luminosity of the source turns out to be for a luminosity distance of .
3.3 NICER Prompt Emission Flux Upper Limits
We searched carefully for any detectable X-ray counts around the radio burst arrival times, for the four strictly simultaneous bursts. NICER is the only telescope with high effective area and with high temporal resolution in X-rays capable of capturing photon events even at sub-ms timescales. We binned the light curve to 1ms (typical FRB width) and searched for any photon counts in excess of confidence for any given bin, around the burst, for time intervals of 5 ms, 10 ms, 100 ms, 1 s and 100 sec. We did not find any excess counts above the background, at confidence. In the next step we carried out a more rigorous and realistic simulation to estimate the confidence level of upper limit on detection at these five different time intervals around the burst times.
We estimated the upper limit on the X-ray fluence of the four radio bursts coincident with NICER observations using simulations which take into consideration the Poisson statistics and the average background count rate (that we have measured in each instance of the FRB). We note that the NICER background count rate of counts/s were similar for bursts 4 and 5 and this was the time range which were not affected by the SAA flaring wings, as in the cases of bursts 1 and 3. Hence, we assumed the same X-ray background count rate for the bursts 1 and 3 which are contaminated by SAA entry-exit flaring wings. Therefore, we obtained only one set of upper limits for all the four bursts (albeit for different time resolutions). See Table 3. Below we illustrate the steps.
Assuming a Poisson probability distribution we estimated the total number of source counts required in order to “detect" a burst with confidence, given a background, following the methods enumerated in Gavriil et al. (2004); Younes et al. (2020). Since we are probing the five different timescales, we assumed the corresponding values of the bursts (i.e, ): 5ms, 10ms, 100ms, 1s and 100sec, and with a time resolution of investigation of of that of the , in all the cases. This is to ensure that we are time-sampling the data adequately and not wash out the few counts in smaller time bins. We estimate the probability of the total counts in each time bin, , to be a random fluctuation around the average value (), which is the ratio of the total counts within over , as . The time bins satisfying the criterion are identified as a burst. The procedure is repeated until no more bins are identified in . From the total source count rate upper limits obtained from the simulations, we converted it to flux using webpimms, assuming a spectral powerlaw slope of . The upper limits on the fluences are quoted in Table 3. For the case of ms we kept the time resolution = 2.5 ms. For the case of =100 s we increased the background time to 100sec, and kept the time resolution 10 sec. In each case, we carried out 10,000 simulations.
| 5ms | 10ms | 100ms | 1 sec | 100 sec | |||
|---|---|---|---|---|---|---|---|
| Counts (N) | |||||||
| Count rate (counts/sec) | |||||||
| Flux () | |||||||
| Fluence upper limit () |
a For each case (5ms, 10ms, 100ms, 1000ms and 100sec) we have carried out multiple simulations step wise. Each simulation run had 10,000 simulations assuming a Poisson distribution of counts in each time bin. The input value of the simulation was the total number of counts (N), which we gradually increased in steps (for each simulation run) in order to achieve a detection probability of a possible burst at confidence for a background count rate of 0.8 counts/sec. The quoted values of counts are those needed in that time interval in order for us to detect a burst at that confidence.
3.4 The radio efficiency
Assuming a flat spectral index over a bandwidth of MHz, the FRB fluences in Table 2 are erg cm-2. The corresponding dimensionless 10 ms transient fluence ratio lower limit is adopting values in Table 3. The 10 ms transient limit represents a case similar to SGR 1935+2154, where offsets with the radio pulses (ToAs at infinite frequency equivalent) and features in the X-ray light curve were of order 7 ms (Mereghetti et al., 2020) and the width of the high-energy light curve features were ms.
On the other hand, uncertainty in the DM of order DM pc cm-3 may exist, which could impart temporal uncertainty of order ms for Figure 1. However, we detect no unusual unmodeled fluctuations over background in any of the NICER snapshots consistent with activity from a cosmological source.
The radio efficiency can in principle be used to differentiate the models involving magnetospheres or relativistic shocks, with the former models predicting a higher efficiency than the latter models (Zhang, 2020). The derived upper limit, generally of the order of , is however too loose to place a significant constraint, so that both magnetospheric models (e..g. Wadiasingh & Timokhin, 2019; Suvorov & Kokkotas, 2019; Lyutikov & Popov, 2020; Lyubarsky, 2020; Lu et al., 2020; Wadiasingh & Chirenti, 2020; Horvath et al., 2021; Yang & Zhang, 2021) and synchrotron maser models involving relativistic shocks (e.g., Popov & Postnov, 2010; Lyubarsky, 2014; Beloborodov, 2017; Metzger et al., 2019; Margalit et al., 2020) are allowed by the data.
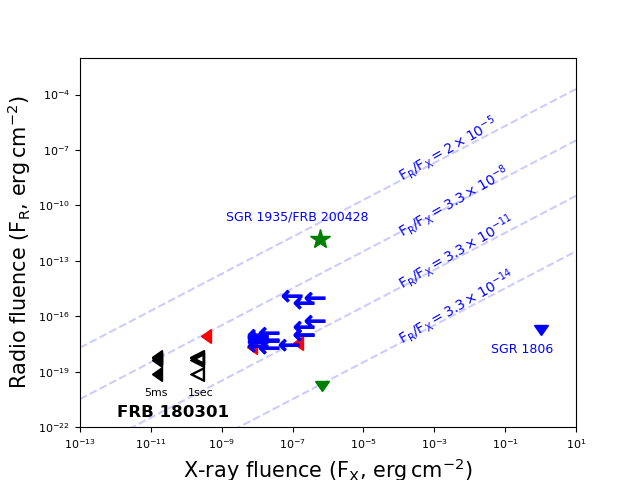
We searched the literature extensively to find cases where (1) an X-ray instrument was observing the source when the FRB was bursting, so as to obtain an X-ray upper limit contemporaneous with a radio burst, and (2) the FRB has a distance estimate or an upper limit from the dispersion measure. Table 4 shows the list of repeating and non-repeating FRBs selected from the literature using these criteria. We also include the two soft gamma repeaters (SGRs) for comparison. One is the classic case of SGR 1935, with simultaneous radio and X-ray detection (Mereghetti et al., 2020). The other is the Galactic SGR 1806 which has shown giant flares, yet no contemporaneous signatures of FRB (Tendulkar et al., 2016), hence putting an strong upper limit on the radio fluence and energy. Figures 3 and 4, we present the detections and upper limits of the various FRBs and SGR bursts with or without X-ray detections. In Fig 3 the black triangles (filled and hollow) are the X-ray upper limits on the four radio bursts from FRB 180301 obtained in this work. The filled triangles are upper-limits corresponding to ms integration time while the hollow triangles correspond to sec integration time (also see Table 3). This is to have a fair comparison between the different X-ray instruments used to obtain the upper limits, which have different integration times. For example, Scholz et al. (2020) obtained a prompt upper limit of for the FRB 180916, using Chandra which has an integration time of 3 seconds (marked as a red triangle in Fig 3). For most of the other cases in the literature, the integration time is of the order of a few ms. We plot two vertical lines in Fig 4 which corresponds to the giant X-ray burst energy of the magnetars SGR 1806 ( erg) and SGR 1900+14 ( erg), to give a perspective of the energy involved. We find that the energy upper limits obtained from our work (black solid triangles) can rule out giant magnetar flares of the type detected in SGR 1806. However, for the non-repeating FRBs in the same Fig 4 plotted as ’+’ (denoting upper limits in both X-rays and radio), the limits are not very constraining.
In Fig 3, the constant lines are also marked, and we can see that so far FRB 200428 from SGR 1935+2154 has the highest , a value that could be interpreted within both the magnetospheric (Wang et al., 2019; Lu et al., 2020; Yang & Zhang, 2021) and the external shock (Margalit et al., 2020) models. In order to make further progress to break the degeneracy between the models, simultaneous radio and X-ray observations of intrinsically bright FRBs at very small distances (in Milky Way or very nearby galaxies) are needed.
| Source-Type | SourceA | Radio fluence | Radio frequency | X-ray fluence | DistanceB | Energy(Radio) | Energy(X-ray) | |
|---|---|---|---|---|---|---|---|---|
| () | ||||||||
| Repeating | FRB 180301∗ | 1.4GHz | ||||||
| FRB | " | 1.4GHz | " | |||||
| " | 1.4GHz | " | ||||||
| " | 1.4GHz | " | ||||||
| FRB 121102A1,2 | 1.4GHz | |||||||
| FRB 1809163 | - | |||||||
| FRB 200120E4 | - | |||||||
| Nonrepeating | FRB 0107241 | 1.4GHz | ||||||
| FRB | FRB 1102201 | 1.4GHz | ||||||
| FRB 1307291 | 1.4GHz | |||||||
| FRB 0106211 | 1.4GHz | |||||||
| FRB 0110251 | 1.4GHz | |||||||
| FRB 1311041 | 1.4GHz | |||||||
| FRB 1210021 | 1.4GHz | |||||||
| FRB 0906251 | 1.4GHz | |||||||
| FRB 1107031 | 1.4GHz | |||||||
| FRB 1306261 | 1.4GHz | |||||||
| FRB 1405141 | 1.4GHz | |||||||
| FRB 1306281 | 1.4GHz | |||||||
| FRB 1106261 | 1.4GHz | |||||||
| FRB 1201271 | 1.4GHz | |||||||
| FRB 180924B5 | - | |||||||
| FRB 190714A6 | - | |||||||
| FRB 171020A6 | - | |||||||
| FRB 190523A7 | - | |||||||
| SGR | SGR 10861 | 1.4GHz | ||||||
| SGR 19358 | - | |||||||
| " 9 | - |
∗ This work.
A References for Radio and X-ray fluences. Note that we quote the X-ray fluence upper limits from those studies where they have been derived contemporaneous with a radio burst from the respective FRB, except for FRB 200120E from M81. 1 Tendulkar et al. (2016),
2 Bhandari et al. (2021a),
3Scholz et al. (2020)
4Majid et al. (2021); Mereghetti et al. (2021)
5Gourdji et al. (2020)
6Anumarlapudi et al. (2020)
7Prochaska et al. (2019),
8Mereghetti et al. (2020)
9Lin et al. (2020)
B References for Distances: FRB 180301: Bhandari et al. (2021a) , FRB 121102: Tendulkar et al. (2017) , FRB 20201124A: Fong et al. (2021), FRB 180916: Marcote et al. (2020). FRB 010724: Guidorzi et al. (2019), FRB 110220: Petroff et al. (2015) , FRB 130729: Champion et al. (2016) , FRB 010621: Keane et al. (2012), FRB 011025: Burke-Spolaor & Bannister (2014), FRB 131104: Sakamoto et al. (2021), FRB 121002: Champion et al. (2016), FRB 090625: Champion et al. (2016), FRB 110703: Thornton et al. (2013), FRB 130626: Champion et al. (2016), FRB 140514: Petroff et al. (2015), FRB 130628: Champion et al. (2016), FRB 110626: Thornton et al. (2013), FRB 120127: Thornton et al. (2013), FRBs 180924B, 190608B, 190714A, 171020A, 190523A, 18112: Bhandari et al. (2021a).
C Conversion of fluence to : We know , and we assume a bandwidth of . Hence for example, . For Parkes telescope we have used a band width of (Tendulkar et al., 2016), and a flat spectral index, to obtain the fluence in radio band at 1.4GHz. For the cases where we do not know the band width, we assume 300 MHz, and a flat spectral slope.
4 Summary and discussion
In this work, we have reported detection of five bursts from FRB 180301with FAST in L-band, four of which were contemporaneous with NICER monitoring of the source. The five bursts all exhibit no circular polarization, albeit with lower linear polarization than the previously reported epoch in 2019. No unusual X-ray emission over background is discernible for the four bursts which were strictly simultaneous (after accounting for DM) with NICER observations. Nor is any emission over background detected for possible delays associated with DM uncertainty or intrinsic temporal offsets, within the duration commensurate the NICER snapshots ( seconds). The corresponding radio-to-X-ray 5 ms fluence ratio is for the four strictly simultaneous radio bursts. An absorbed persistent X-ray flux limit of is also found.
A fluence of few erg cm-2 yields a characteristic isotropic-equivalent radio energy of erg, an energy scale that is typical for FRBs (repeaters and apparent nonrepeaters) with accurate localizations such as FRB 121102, FRB 180924, FRB 181112 and FRB 20201124A (Tendulkar et al., 2017; Bannister et al., 2019; Prochaska et al., 2019; Kilpatrick et al., 2021; Lanman et al., 2021; Piro et al., 2021). This is consistent with models which predict narrow universal luminosity function (e.g., Wadiasingh et al., 2020; Beniamini et al., 2020) for FRBs.
Our persistent and transient X-ray upper limits constrain any FRB progenitor to prompt radio efficiency . This is generally unconstraining for a large class of models involving stellar-mass compact objects and repetition. In the context of magnetar models, the persistent luminosity limit of erg cm-1 disfavors a scenario where separate magnetar giant flares are associated with each radio burst, if they produce bright quasi-thermal pulsations as known to follow the hard spike of giant flares in nearby magnetars (Mazets et al., 1979; Cline et al., 1980; Hurley et al., 1999; Palmer et al., 2005; Hurley et al., 2005; Burns et al., 2021). The derived upper limit on is consistent with both magnetospheric models and synchrotron maser models involving relativistic shocks.

References
- Anumarlapudi et al. (2020) Anumarlapudi, A., Bhalerao, V., Tendulkar, S. P., & Balasubramanian, A. 2020, ApJ, 888, 40, doi: 10.3847/1538-4357/ab5363
- Bannister et al. (2019) Bannister, K. W., Deller, A. T., Phillips, C., et al. 2019, Science, doi: 10.1126/science.aaw5903
- Beloborodov (2017) Beloborodov, A. M. 2017, ApJ, 843, L26, doi: 10.3847/2041-8213/aa78f3
- Beniamini et al. (2020) Beniamini, P., Wadiasingh, Z., & Metzger, B. D. 2020, MNRAS, doi: 10.1093/mnras/staa1783
- Bhandari et al. (2021a) Bhandari, S., Heintz, K. E., Aggarwal, K., et al. 2021a, arXiv e-prints, arXiv:2108.01282. https://arxiv.org/abs/2108.01282
- Bhandari et al. (2021b) —. 2021b, arXiv e-prints, arXiv:2108.01282. https://arxiv.org/abs/2108.01282
- Bochenek et al. (2020) Bochenek, C. D., Ravi, V., Belov, K. V., et al. 2020, Nat, 587, 59, doi: 10.1038/s41586-020-2872-x
- Burke-Spolaor & Bannister (2014) Burke-Spolaor, S., & Bannister, K. W. 2014, ApJ, 792, 19, doi: 10.1088/0004-637X/792/1/19
- Burns et al. (2021) Burns, E., Svinkin, D., Hurley, K., et al. 2021, ApJ, 907, L28, doi: 10.3847/2041-8213/abd8c8
- Caleb & Keane (2021) Caleb, M., & Keane, E. 2021, Universe, 7, 453, doi: 10.3390/universe7110453
- Champion et al. (2016) Champion, D. J., Petroff, E., Kramer, M., et al. 2016, MNRAS, 460, L30, doi: 10.1093/mnrasl/slw069
- CHIME/FRB Collaboration et al. (2019a) CHIME/FRB Collaboration, Andersen, B. C., Band ura, K., et al. 2019a, arXiv e-prints, arXiv:1908.03507. https://arxiv.org/abs/1908.03507
- CHIME/FRB Collaboration et al. (2019b) CHIME/FRB Collaboration, Andersen, B. C., Bandura, K., et al. 2019b, ApJ, 885, L24, doi: 10.3847/2041-8213/ab4a80
- CHIME/FRB Collaboration et al. (2020) CHIME/FRB Collaboration, Andersen, B. C., Bandura, K. M., et al. 2020, Nat, 587, 54, doi: 10.1038/s41586-020-2863-y
- Cline et al. (1980) Cline, T. L., Desai, U. D., Pizzichini, G., et al. 1980, ApJ, 237, L1, doi: 10.1086/183221
- Dunning et al. (2017) Dunning, A., Bowen, M., Castillo, S., et al. 2017, in 2017 XXXIInd General Assembly and Scientific Symposium of the International Union of Radio Science (URSI GASS), IEEE, 1–4
- Feng et al. (2022) Feng, Y., Li, D., Yang, Y.-P., et al. 2022, arXiv e-prints, arXiv:2202.09601. https://arxiv.org/abs/2202.09601
- Fong et al. (2021) Fong, W.-f., Dong, Y., Leja, J., et al. 2021, ApJ, 919, L23, doi: 10.3847/2041-8213/ac242b
- Gavriil et al. (2004) Gavriil, F. P., Kaspi, V. M., & Woods, P. M. 2004, ApJ, 607, 959, doi: 10.1086/383564
- Gendreau et al. (2016) Gendreau, K. C., Arzoumanian, Z., Adkins, P. W., et al. 2016, in Society of Photo-Optical Instrumentation Engineers (SPIE) Conference Series, Vol. 9905, Space Telescopes and Instrumentation 2016: Ultraviolet to Gamma Ray, ed. J.-W. A. den Herder, T. Takahashi, & M. Bautz, 99051H, doi: 10.1117/12.2231304
- Gourdji et al. (2020) Gourdji, K., Rowlinson, A., Wijers, R. A. M. J., & Goldstein, A. 2020, MNRAS, 497, 3131, doi: 10.1093/mnras/staa2128
- Guidorzi et al. (2019) Guidorzi, C., Marongiu, M., Martone, R., et al. 2019, ApJ, 882, 100, doi: 10.3847/1538-4357/ab3408
- Hickish et al. (2016) Hickish, J., Abdurashidova, Z., Ali, Z., et al. 2016, Journal of Astronomical Instrumentation, 05, 1641001, doi: 10.1142/S2251171716410014
- Hobbs et al. (2006) Hobbs, G. B., Edwards, R. T., & Manchester, R. N. 2006, MNRAS, 369, 655, doi: 10.1111/j.1365-2966.2006.10302.x
- Horvath et al. (2021) Horvath, J. E., Moraes, P. H. R. S., de Avellar, M. G. B., & Rocha, L. S. 2021, arXiv e-prints, arXiv:2106.15030. https://arxiv.org/abs/2106.15030
- Hotan et al. (2004) Hotan, A. W., van Straten, W., & Manchester, R. N. 2004, PASA, 21, 302, doi: 10.1071/AS04022
- Hurley et al. (1999) Hurley, K., Cline, T., Mazets, E., et al. 1999, Nat, 397, 41, doi: 10.1038/16199
- Hurley et al. (2005) Hurley, K., Boggs, S. E., Smith, D. M., et al. 2005, Nat, 434, 1098, doi: 10.1038/nature03519
- Jiang et al. (2020) Jiang, P., Tang, N.-Y., Hou, L.-G., et al. 2020, Research in Astronomy and Astrophysics, 20, 064, doi: 10.1088/1674-4527/20/5/64
- Kalberla et al. (2005) Kalberla, P. M. W., Burton, W. B., Hartmann, D., et al. 2005, A&A, 440, 775, doi: 10.1051/0004-6361:20041864
- Katz (2016) Katz, J. I. 2016, ApJ, 826, 226, doi: 10.3847/0004-637X/826/2/226
- Keane et al. (2012) Keane, E. F., Stappers, B. W., Kramer, M., & Lyne, A. G. 2012, MNRAS, 425, L71, doi: 10.1111/j.1745-3933.2012.01306.x
- Kilpatrick et al. (2021) Kilpatrick, C. D., Fong, W., Prochaska, J. X., et al. 2021, The Astronomer’s Telegram, 14516, 1
- Kulkarni et al. (2014) Kulkarni, S. R., Ofek, E. O., Neill, J. D., Zheng, Z., & Juric, M. 2014, ApJ, 797, 70, doi: 10.1088/0004-637X/797/1/70
- Kumar et al. (2017) Kumar, P., Lu, W., & Bhattacharya, M. 2017, MNRAS, 468, 2726, doi: 10.1093/mnras/stx665
- Lanman et al. (2021) Lanman, A. E., Andersen, B. C., Chawla, P., et al. 2021, arXiv e-prints, arXiv:2109.09254. https://arxiv.org/abs/2109.09254
- Li et al. (2021) Li, C. K., Lin, L., Xiong, S. L., et al. 2021, Nature Astronomy, 5, 378. https://arxiv.org/abs/2005.11071
- Lin et al. (2020) Lin, L., Zhang, C. F., Wang, P., et al. 2020, Nat, 587, 63, doi: 10.1038/s41586-020-2839-y
- Lorimer et al. (2007) Lorimer, D. R., Bailes, M., McLaughlin, M. A., Narkevic, D. J., & Crawford, F. 2007, Science, 318, 777, doi: 10.1126/science.1147532
- Lu et al. (2020) Lu, W., Kumar, P., & Zhang, B. 2020, MNRAS, 498, 1397, doi: 10.1093/mnras/staa2450
- Luo et al. (2020) Luo, R., Wang, B. J., Men, Y. P., et al. 2020, Nat, 586, 693, doi: 10.1038/s41586-020-2827-2
- Lyubarsky (2014) Lyubarsky, Y. 2014, MNRAS, 442, L9, doi: 10.1093/mnrasl/slu046
- Lyubarsky (2020) —. 2020, arXiv e-prints, arXiv:2001.02007. https://arxiv.org/abs/2001.02007
- Lyutikov & Popov (2020) Lyutikov, M., & Popov, S. 2020, arXiv e-prints, arXiv:2005.05093. https://arxiv.org/abs/2005.05093
- Majid et al. (2021) Majid, W. A., Pearlman, A. B., Prince, T. A., et al. 2021, ApJ, 919, L6, doi: 10.3847/2041-8213/ac1921
- Marcote et al. (2020) Marcote, B., Nimmo, K., Hessels, J. W. T., et al. 2020, Nature, doi: 10.1038/s41586-019-1866-z
- Margalit et al. (2020) Margalit, B., Beniamini, P., Sridhar, N., & Metzger, B. D. 2020, ApJ, 899, L27, doi: 10.3847/2041-8213/abac57
- Mazets et al. (1979) Mazets, E. P., Golentskii, S. V., Ilinskii, V. N., Aptekar, R. L., & Guryan, I. A. 1979, Nat, 282, 587, doi: 10.1038/282587a0
- Men et al. (2019) Men, Y. P., Luo, R., Chen, M. Z., et al. 2019, MNRAS, 488, 3957
- Mereghetti et al. (2021) Mereghetti, S., Topinka, M., Rigoselli, M., & Götz, D. 2021, ApJ, 921, L3, doi: 10.3847/2041-8213/ac2ee7
- Mereghetti et al. (2020) Mereghetti, S., Savchenko, V., Ferrigno, C., et al. 2020, ApJ, 898, L29, doi: 10.3847/2041-8213/aba2cf
- Metzger et al. (2019) Metzger, B. D., Margalit, B., & Sironi, L. 2019, MNRAS, 485, 4091, doi: 10.1093/mnras/stz700
- Michilli et al. (2018) Michilli, D., Seymour, A., Hessels, J. W. T., et al. 2018, in American Astronomical Society Meeting Abstracts, Vol. 231, American Astronomical Society Meeting Abstracts #231, 243.18
- Nan et al. (2011) Nan, R., Li, D., Jin, C., et al. 2011, International Journal of Modern Physics D, 20, 989, doi: 10.1142/S0218271811019335
- Palmer et al. (2005) Palmer, D. M., Barthelmy, S., Gehrels, N., et al. 2005, Nat, 434, 1107, doi: 10.1038/nature03525
- Petroff et al. (2015) Petroff, E., Bailes, M., Barr, E. D., et al. 2015, MNRAS, 447, 246, doi: 10.1093/mnras/stu2419
- Petroff et al. (2019) Petroff, E., Oostrum, L. C., Stappers, B. W., et al. 2019, MNRAS, 482, 3109, doi: 10.1093/mnras/sty2909
- Piro et al. (2021) Piro, L., Bruni, G., Troja, E., et al. 2021, A&A, 656, L15, doi: 10.1051/0004-6361/202141903
- Popov & Postnov (2010) Popov, S. B., & Postnov, K. A. 2010, in Evolution of Cosmic Objects through their Physical Activity, ed. H. A. Harutyunian, A. M. Mickaelian, & Y. Terzian, 129–132. https://arxiv.org/abs/0710.2006
- Popov & Postnov (2013) Popov, S. B., & Postnov, K. A. 2013, arXiv e-prints, arXiv:1307.4924. https://arxiv.org/abs/1307.4924
- Prochaska et al. (2019) Prochaska, J. X., Macquart, J.-P., McQuinn, M., et al. 2019, Science, 366, 231, doi: 10.1126/science.aay0073
- Sakamoto et al. (2021) Sakamoto, T., Troja, E., Lien, A., et al. 2021, ApJ, 908, 137, doi: 10.3847/1538-4357/abcda0
- Scholz et al. (2020) Scholz, P., Cook, A., Cruces, M., et al. 2020, ApJ, 901, 165, doi: 10.3847/1538-4357/abb1a8
- Suvorov & Kokkotas (2019) Suvorov, A. G., & Kokkotas, K. D. 2019, MNRAS, 488, 5887, doi: 10.1093/mnras/stz2052
- Tendulkar et al. (2016) Tendulkar, S. P., Kaspi, V. M., & Patel, C. 2016, ApJ, 827, 59, doi: 10.3847/0004-637X/827/1/59
- Tendulkar et al. (2017) Tendulkar, S. P., Bassa, C. G., Cordes, J. M., et al. 2017, ApJ, 834, L7, doi: 10.3847/2041-8213/834/2/L7
- Thornton et al. (2013) Thornton, D., et al. 2013, Science, 341, 53, doi: 10.1126/science.1236789
- Wadiasingh et al. (2020) Wadiasingh, Z., Beniamini, P., Timokhin, A., et al. 2020, ApJ, 891, 82, doi: 10.3847/1538-4357/ab6d69
- Wadiasingh & Chirenti (2020) Wadiasingh, Z., & Chirenti, C. 2020, ApJ, 903, L38, doi: 10.3847/2041-8213/abc562
- Wadiasingh & Timokhin (2019) Wadiasingh, Z., & Timokhin, A. 2019, ApJ, 879, 4, doi: 10.3847/1538-4357/ab2240
- Wang et al. (2017) Wang, J. B., Coles, W. A., Hobbs, G., et al. 2017, MNRAS, 469, 425, doi: 10.1093/mnras/stx837
- Wang et al. (2019) Wang, W., Zhang, B., Chen, X., & Xu, R. 2019, ApJ, 876, L15, doi: 10.3847/2041-8213/ab1aab
- Xu et al. (2021) Xu, H., Niu, J. R., Chen, P., et al. 2021, arXiv e-prints, arXiv:2111.11764. https://arxiv.org/abs/2111.11764
- Yang & Zhang (2018) Yang, Y.-P., & Zhang, B. 2018, ApJ, 868, 31, doi: 10.3847/1538-4357/aae685
- Yang & Zhang (2021) —. 2021, ApJ, 919, 89, doi: 10.3847/1538-4357/ac14b5
- Younes et al. (2020) Younes, G., Güver, T., Kouveliotou, C., et al. 2020, ApJ, 904, L21, doi: 10.3847/2041-8213/abc94c
- Zhang (2020) Zhang, B. 2020, Nat, 587, 45, doi: 10.1038/s41586-020-2828-1
- Zhang (2022) —. 2022, ApJ, 925, 53, doi: 10.3847/1538-4357/ac3979
- Zhang et al. (2021) Zhang, C. F., Xu, J. W., Men, Y. P., et al. 2021, MNRAS, 503, 5223, doi: 10.1093/mnras/stab823