Constraining decaying dark matter with BOSS data
and the effective field theory of large-scale structures
Abstract
We update cosmological constraints on two decaying dark matter models in light of BOSS-DR12 data analyzed under the Effective Field Theory of Large-Scale Structures (EFTofLSS) formalism, together with Planck, Pantheon and other BOSS measurements of the baryonic acoustic oscillation (BAO). In the first model, a fraction of cold dark matter (CDM) decays into dark radiation (DR) with a lifetime . In the second model (recently suggested as a potential resolution to the tension), all the CDM decays with a lifetime into DR and a massive warm dark matter (WDM) particle, with a fraction of the CDM rest mass energy transferred to the DR. Using numerical codes from the recent literature, we perform the first calculation of the mildly non-linear (matter and galaxy) power spectra with the EFTofLSS for these two models. In the case of DR products, we obtain the constraints (95% C.L.) for lifetimes shorter than the age of the universe, and Gyr in the long-lived regime assuming . We show that Planck data contributes the most to these constraints, with EFTofBOSS providing a marginal improvement over conventional BAO and redshift space distortions () data. In the case of DR and WDM decay products, we find that EFTofBOSS data significantly improves the constraints at 68% C.L. on the CDM lifetime with a prior from KiDS-1000. We show that, in order to fit EFTofBOSS data while lowering to match KiDS-1000, the best-fit model has a longer lifetime Gyr, with a larger kick velocity , than that without EFTofBOSS ( Gyr, ). We anticipate that future surveys will provide exquisite constraints on such models.
I Introduction
The cold dark matter (CDM) model provides outstanding explanation for a wide variety of early universe data, such as Cosmic Microwave Background (CMB) and Big Bang Nucleosynthesis (BBN), as well as late universe observations of Large Scale Structure (LSS) including the Baryon Acoustic Oscillation (BAO), and uncalibrated luminosity distance to SuperNovae of type Ia (SNIa). Despite this remarkable success, the CDM model does not teach us about the intrinsic nature of its dark sector, made up of both cold dark matter (CDM) and dark energy (DE). In addition, as the accuracy of cosmological observations has improved, the concordance cosmological model starts showing several experimental discrepancies. The most famous and important cosmological puzzle, the so-called Hubble tension Verde et al. (2019), corresponds to a large discrepancy () between the local determination of from a variety of methods – and in particular the cosmic distance ladder based on cepheid-calibrated SNIa by the SH0ES team Riess et al. (2021)–, and its determination using CMB data under the assumption that the universe is described by the CDM model Aghanim et al. (2020a). Another intriguing cosmological conundrum, the one at the heart of this study, is a less significant but older tension () between the weak-lensing111More precisely, there even exists a ‘lensing is low’ anomaly when comparing galaxy clustering and weak lensing data within the CDM cosmology Leauthaud et al. (2017); Lange et al. (2021); Amon et al. (2022). Asgari et al. (2021); Abbott et al. (2022); Hikage et al. (2019); Amon et al. (2022) and CMB Aghanim et al. (2020a); Aiola et al. (2020) determinations of the amplitude of the local matter fluctuations, parameterized as , where is the current total matter abundance, and corresponds to the root mean square of matter fluctuations on a Mpc scale, with , and is defined as follows
| (1) |
Here is the linear matter power spectrum, and is a window function describing a sphere (in Fourier space) with a (historically chosen) radius of Mpc.
Barring unknown systematic errors (see e.g. Freedman (2021); Riess et al. (2021); Amon et al. (2022) for discussion), these discrepancies might be the first clue about the intrinsic nature of the CDM dark sector. On the one hand, the resolution of the Hubble tension most likely involves new physics in the pre-recombination era222We note that recent analysis based on the equality scale seems to disfavor some of the most extreme models suggested to resolve the tension and could eventually provide a challenge to early-universe models Farren et al. (2022); Philcox et al. (2022)., through a decrease of the sound horizon before recombination Bernal et al. (2016); Aylor et al. (2019); Knox and Millea (2019); Camarena, David and Marra, Valerio (2021); Efstathiou (2021); Schöneberg et al. (2021), such as model involving dark radiation and/or new neutrino properties Kreisch et al. (2020); Berbig et al. (2020); Ghosh et al. (2020); Forastieri et al. (2019); Escudero and Witte (2020, 2021); Blinov and Marques-Tavares (2020); Ghosh et al. (2021); Archidiacono and Gariazzo (2022); Aloni et al. (2021), early dark energy Karwal and Kamionkowski (2016); Poulin et al. (2019); Smith et al. (2020); Niedermann and Sloth (2021, 2020); Ye and Piao (2020), modified gravity Renk et al. (2017); Umiltà et al. (2015); Ballardini et al. (2016); Rossi et al. (2019); Braglia et al. (2020a); Zumalacarregui (2020); Abadi and Kovetz (2021); Ballardini et al. (2020); Braglia et al. (2020b); Di Valentino et al. (2016); Bahamonde et al. (2021); Raveri (2020); Yan et al. (2020); Frusciante et al. (2020); Solà Peracaula et al. (2019, 2020); Ballesteros et al. (2020); Braglia et al. (2021); Desmond et al. (2019); Lin et al. (2019) or exotic recombination Chiang and Slosar (2018); Hart and Chluba (2020); Sekiguchi and Takahashi (2021); Jedamzik and Pogosian (2020); Cyr-Racine et al. (2021) (for review, see Refs. Di Valentino et al. (2021a); Schöneberg et al. (2021)). On the other hand, the resolution of the tension requires a suppression in the matter power spectrum for in order to reduce the value of the parameter (see Eq. 1), which can be achieved through a number of models that take into account new hypothetical properties of dark matter (DM) and/or DE Lesgourgues et al. (2016); Buen-Abad et al. (2015); Chacko et al. (2016); Buen-Abad et al. (2018); Heimersheim et al. (2020); Cyr-Racine et al. (2021); Gómez-Valent et al. (2020); Di Valentino et al. (2020); Lucca (2021); Abellan et al. (2020); Di Valentino et al. (2021b); Bansal et al. (2021).
Decaying cold dark matter (DCDM) models, in which dark matter is unstable on cosmological time-scale and decays into invisible products, have been proposed as potential resolutions to cosmic tensions Enqvist et al. (2015a); Berezhiani et al. (2015); Blinov et al. (2020); Vattis et al. (2019); Abellan et al. (2020); Abellán et al. (2021). In the past it was found that DM models with purely radiation decay products can neither resolve the Hubble tension nor the tension Chudaykin et al. (2016, 2018); Poulin et al. (2016); Clark et al. (2020); Haridasu and Viel (2020); Nygaard et al. (2020); Alvi et al. (2022), while DM models with massive decay products can resolve the tension, as the massive particle produced during the decay act as a WDM component, reducing power on scale below the free-streaming length at late-times Abellan et al. (2020); Abellán et al. (2021). Beyond recent observational tensions, the study of these models is important from the particle physics point of view, as it addresses the question of the stability of DM on long cosmological time-scales. In the literature, there are many models involving the existence of DM decays at late-times, such as models with R-parity violation Berezinsky et al. (1991); Kim and Kim (2002), super Weakly Interacting Massive particles (super WIMPs) Covi et al. (1999); Feng et al. (2003, 2003); Allahverdi et al. (2015), sterile neutrinos Abazajian et al. (2012); Drewes et al. (2017), models with an additional U(1) gauge symmetry Chen et al. (2009); Choi et al. (2020a, b); Choi and Yanagida (2021), or more recently a model of decaying warm dark matter Holm et al. (2022). Besides cosmic tensions, some DCDM models were proposed as a way to explain the excess of events in the electronic recoils reported by the Xenon1T collaboration Choi et al. (2020c); Xu and Zheng (2020); Dutta et al. (2021); Abellan et al. (2020); Abellán et al. (2021). In addition, DCDM models with massive daughters have also been suggested as a potential solution to the small (subgalactic) scales structure problem of CDM (e.g. Lin et al. (2001); Sánchez-Salcedo (2003); Cembranos et al. (2005); Kaplinghat (2005); Strigari et al. (2007); Borzumati et al. (2008); Peter et al. (2010); Peter and Benson (2010); Choi et al. (2020b)).
In this article, we deal with DCDM with two type of decay products: (i) the DCDM DR model, where the decay products is only composed of a (massless) dark radiation (DR) component, and (ii) the DCDM WDM+DR model, where the decay products are one massive WDM component and one DR component. Previous works have limited themselves to the impact of DCDM decay at the background and linear perturbations level, deriving constraints (and hints) on these models from a combination of Planck CMB, BAO and uncalibrated luminosity distance to SN1a data. Here, we go beyond previous works by making use of the Effective Field Theory of Large Scale Structures (EFTofLSS) to describe the mildly non-linear regime of the galaxy clustering power spectrum and derive improved constraints thanks to the EFTofLSS applied to BOSS data. The main objectives of this paper are: i) perform the first-ever computation of the mildly non-linear regime in DCDM models with massive and massless decay products through the EFTofLSS; ii) test whether current BOSS data can lead to stronger constraints on these models; and iii) check whether these constraints can put pressure on DCDM models that resolve the tension.
Our paper is structured as follows: in Sec. II, we briefly review the EFTofLSS formalism, the observable at hand and the public codes available to perform our analyses; in Sec. III, we introduce the models and present the non-linear power spectrum computed with the EFTofLSS; in Sec. IV, we present the results of comprehensive monte-carlo markov chain analyses of the DCDM model and discuss the implications of these constraints for the tension; we eventually conclude in Sec. V. App. A is dedicated to comparing results of the EFTofLSS with N-body simulations in the DCDMDR model, while App. B details the scope of our computation in the DCDMWDM+DR model. Finally App. C, App. D and App. E present additional results of the MCMC analyses for completeness.
II The galaxy power spectrum from the EFTofLSS formalism
Although an exhaustive review of the EFTofLSS is beyond the scope of this paper333The first formulation of the EFTofLSS was carried out in Eulerian space in Refs. Carrasco et al. (2012); Baumann et al. (2012) and in Lagrangian space in Porto et al. (2014). Once this theoretical framework was established, many efforts were made to improve this theory and make it predictive, such as the understanding of renormalization Pajer and Zaldarriaga (2013); Abolhasani et al. (2016), the IR-resummation of the long displacement fields Senatore and Zaldarriaga (2014); Baldauf et al. (2015); Senatore and Zaldarriaga (2015); Senatore and Trevisan (2018); Lewandowski and Senatore (2020); Blas et al. (2016), and the computation of the two-loop power spectrum Carrasco et al. (2014a, b). Then, this theory was developed in the framework of biased tracers (such as galaxies and halos) in Refs. Senatore (2015); Mirbabayi et al. (2015); Angulo et al. (2015); Fujita et al. (2020); Perko et al. (2016); Nadler et al. (2018)., in this section, we briefly discuss the software tools that are available in the literature making use of the EFTofLSS to analyze the full-shape of the galaxy clustering power spectrum as measured by BOSS. The relevant observables are the multipoles of the galaxy power spectrum, which are obtained through Legendre polynomials () decomposition:
| (2) |
where is the redshift, is the the angle between the line-of-sight and the wavevector of the Fourier mode , and is the redshift-space (non-linear) galaxy power spectrum at one-loop order (see the appendix of Ref. D’Amico et al. (2021) for the formal expression). This expression includes the “Alcock-Paczynski transformation” which takes into account the fact that the observation uses artificial cosmological parameters to convert redshifts as well as celestial coordinates into Cartesian coordinates. The two main contributions to are the monopole () and the quadrupole (). Currently, there are two codes in the literature that model non-linear effects on the power spectrum at one-loop (including a proper infrared resummation (IR) Senatore and Zaldarriaga (2014); Baldauf et al. (2015); Senatore and Zaldarriaga (2015); Senatore and Trevisan (2018); Lewandowski and Senatore (2020); Blas et al. (2016) and a number of observational systematics corrections beyond the Alcock-Paczynski effect Alcock and Paczynski (1979), such as window functions Beutler et al. (2019) and fiber collisions Hahn et al. (2017)) through the EFTofLSS method and which allows us to determine the monopole and the quadrupole of the galaxy power spectrum: i) the PyBird444https://github.com/pierrexyz/pybird code D’Amico et al. (2021)– a python module that determines the non-linear matter power spectrum from the linear one returned by a Boltzmann code such as CLASS555https://lesgourg.github.io/class_public/class.html Blas et al. (2011) or CAMB666https://camb.info/ Lewis et al. (2000), and ii) the CLASS-PT777https://github.com/Michalychforever/CLASS-PT code Chudaykin et al. (2020)– which is a stand-alone extension of the CLASS code. Both codes take into account the same effects with respect to a standard linear Boltzmann code, and in particular make use of the “FFTLog method” Hamilton (2000); Simonovic et al. (2018) to compute the one-loop power spectrum and the IR resummation. Given that our DCDM WDM+DR study makes use of an independent extension to the CLASS code, we will rely on the PyBird code. We provide a comparison between the two codes in the context of the DCDMDR model (already implemented in CLASS-PT) in App. A. One might wonder whether the EFTofLSS formalism must be extended to properly described the models under consideration. In App. A and App. B, we argue that the current formalism (and the codes in their standard form) is sufficient to describe the DCDM models given present constraints and precision of the data. Yet, we anticipate that the formalism will need to be developed further for future surveys such as Euclid Amendola et al. (2018) and the LSST/Vera Rubin Observatory (VRO) Alonso et al. (2018), which will reach sub-percent precision.
The data we use, in order to confront the non-linear galaxy power spectrum forecasts with the observations, are made of three different sky-cut from BOSS DR12 Alam et al. (2017); Reid et al. (2015); Kitaura et al. (2016): LOWZ NGC, CMASS NGC and CMASS SGC. LOWZ corresponds to the the BOSS DR12 data including the BAO post-reconstruction for and has an effective redshift , while CMASS corresponds to the the BOSS DR12 data also including the BAO post-reconstruction for and has an effective redshift (see Ref. Zhang et al. (2021)). This data set will be called, in the following, ‘EFTofBOSS data’. Finally, it is worth noting that the EFTofLSS method has been tested against various simulations (D’Amico et al. (2021); d’ Amico et al. (2020); Colas et al. (2020); Nishimichi et al. (2020)), and it has been highlighted that the BOSS full shape can only be evaluated up to , where the BOSS full shape corresponds to the combination of the monopoles and quadrupoles of the power spectra of LOWZ NGC, CMASS NGC and CMASS SGC. To be more precise, we consider that and . Finally, we mention that the PyBird code makes use of ten additional nuisance parameters per sky-cut to describe various aspects of the EFTofLSS (for more details see e.g.Perko et al. (2016)):
-
•
4 parameters () to describe the galaxy bias at one-loop order;
-
•
3 parameters , , and corresponding to counterterms. is a linear combination of a higher derivative bias and the dark matter sound speed, while and are the redshift-space counterterms;
-
•
3 parameters , and which describe stochastic contributions.
In practice, we make use of the analytical marginalization of Ref. D’Amico et al. (2021) (app. C) 888When discussing best-fits however, we also optimize the nuisance parameters that are analytically marginalized in the MCMC. such that only two extra parameters per sky-cut are required in the analysis.
III Non-Linear power spectrum in DCDM cosmologies
In this section, we review the models of decaying dark matter considered in this work, and present the first computation of the non-linear power spectra in these cosmologies. We consider two different DCDM models (both are limited to decay into the dark sector): one in which a fraction of dark matter decays into massless particles, and the second one in which all of the dark matter experiences two-body decay into massive and massless particles.
III.1 Dark Radiation decay products (DCDM DR model)
III.1.1 Presentation of the model
In the first model we consider, the cold DM sector is partially composed of an unstable particle (denoted as DCDM) that decays into a non-interacting relativistic particle (denoted as DR). The rest of the DM is considered stable and we refer to it as the standard CDM. In addition to the standard six CDM parameters, there are two free parameters describing the lifetime of DCDM (or equivalently the decay width ), as well as the fraction of DCDM to total dark matter at the initial time :
| (3) |
with . With these definitions, in the limit of large and/or small , one recovers the CDM model.
The evolution of the homogeneous energy densities of the decaying dark matter and dark radiation is given by (see e.g. Refs. Audren et al. (2014); Enqvist et al. (2015b); Poulin et al. (2016)):
| (4) | ||||
| (5) |
where is the conformal Hubble parameter,
| (6) |
with
| (7) |
To describe the evolution of the linearly perturbed universe, we consider the usual synchronous gauge, where the scalar part of the perturbed metric is written as Ma and Bertschinger (1995)
| (8) |
Here is the conformal time, and is defined as
| (9) |
denotes the trace of , while corresponds to the other traceless scalar degree of freedom of the metric perturbation in Fourier space. Additionally, we consider the frame co-moving with the DCDM (and CDM) fluid, such that , where is the divergence of the DCDM velocity . As a result, the energy density perturbation of the DCDM component, , follows the same evolution as standard CDM:
| (10) |
The evolution of the linear perturbations of the DR integrated phase-space distribution multipoles is governed by the following hierarchy of equations Audren et al. (2014); Enqvist et al. (2015b); Poulin et al. (2016):
| (11) | ||||
| (12) | ||||
| (13) | ||||
| (14) |
In the previous equations we have introduced following Ref. Poulin et al. (2016), where is the critical density today. In the scenario under study, we have:
| (15) |
We also note that the first three multipoles are simply related to elements of the perturbed stress-energy tensor as , , and . In order to truncate the hierarchy of Eqs. (11)-(14) at some , we adopt the scheme proposed in Ref. Ma and Bertschinger (1995) for massless neutrinos (and extended in CLASS to include non-zero curvature Lesgourgues and Tram (2014)) in order to limit the propagation of the error from to . We extrapolate the behavior of thanks to the recursion relation:
| (16) |
These equations have been implemented in the Boltzmann code CLASS, and the impact of DCDM DR decay on the (linear) CMB and matter power spectrum has been studied in details in the literature Audren et al. (2014); Enqvist et al. (2015b); Poulin et al. (2016). In App. A we present a comparison of the EFTofLSS calculation with N-body simulations performed in Ref. Hubert et al. (2021). The results obtained from these two methods agree upto sub-percent difference for and , justifying that one can safely analyze the (mildly) non-linear galaxy power spectrum with the EFTofLSS.
III.1.2 The non-linear power spectrum
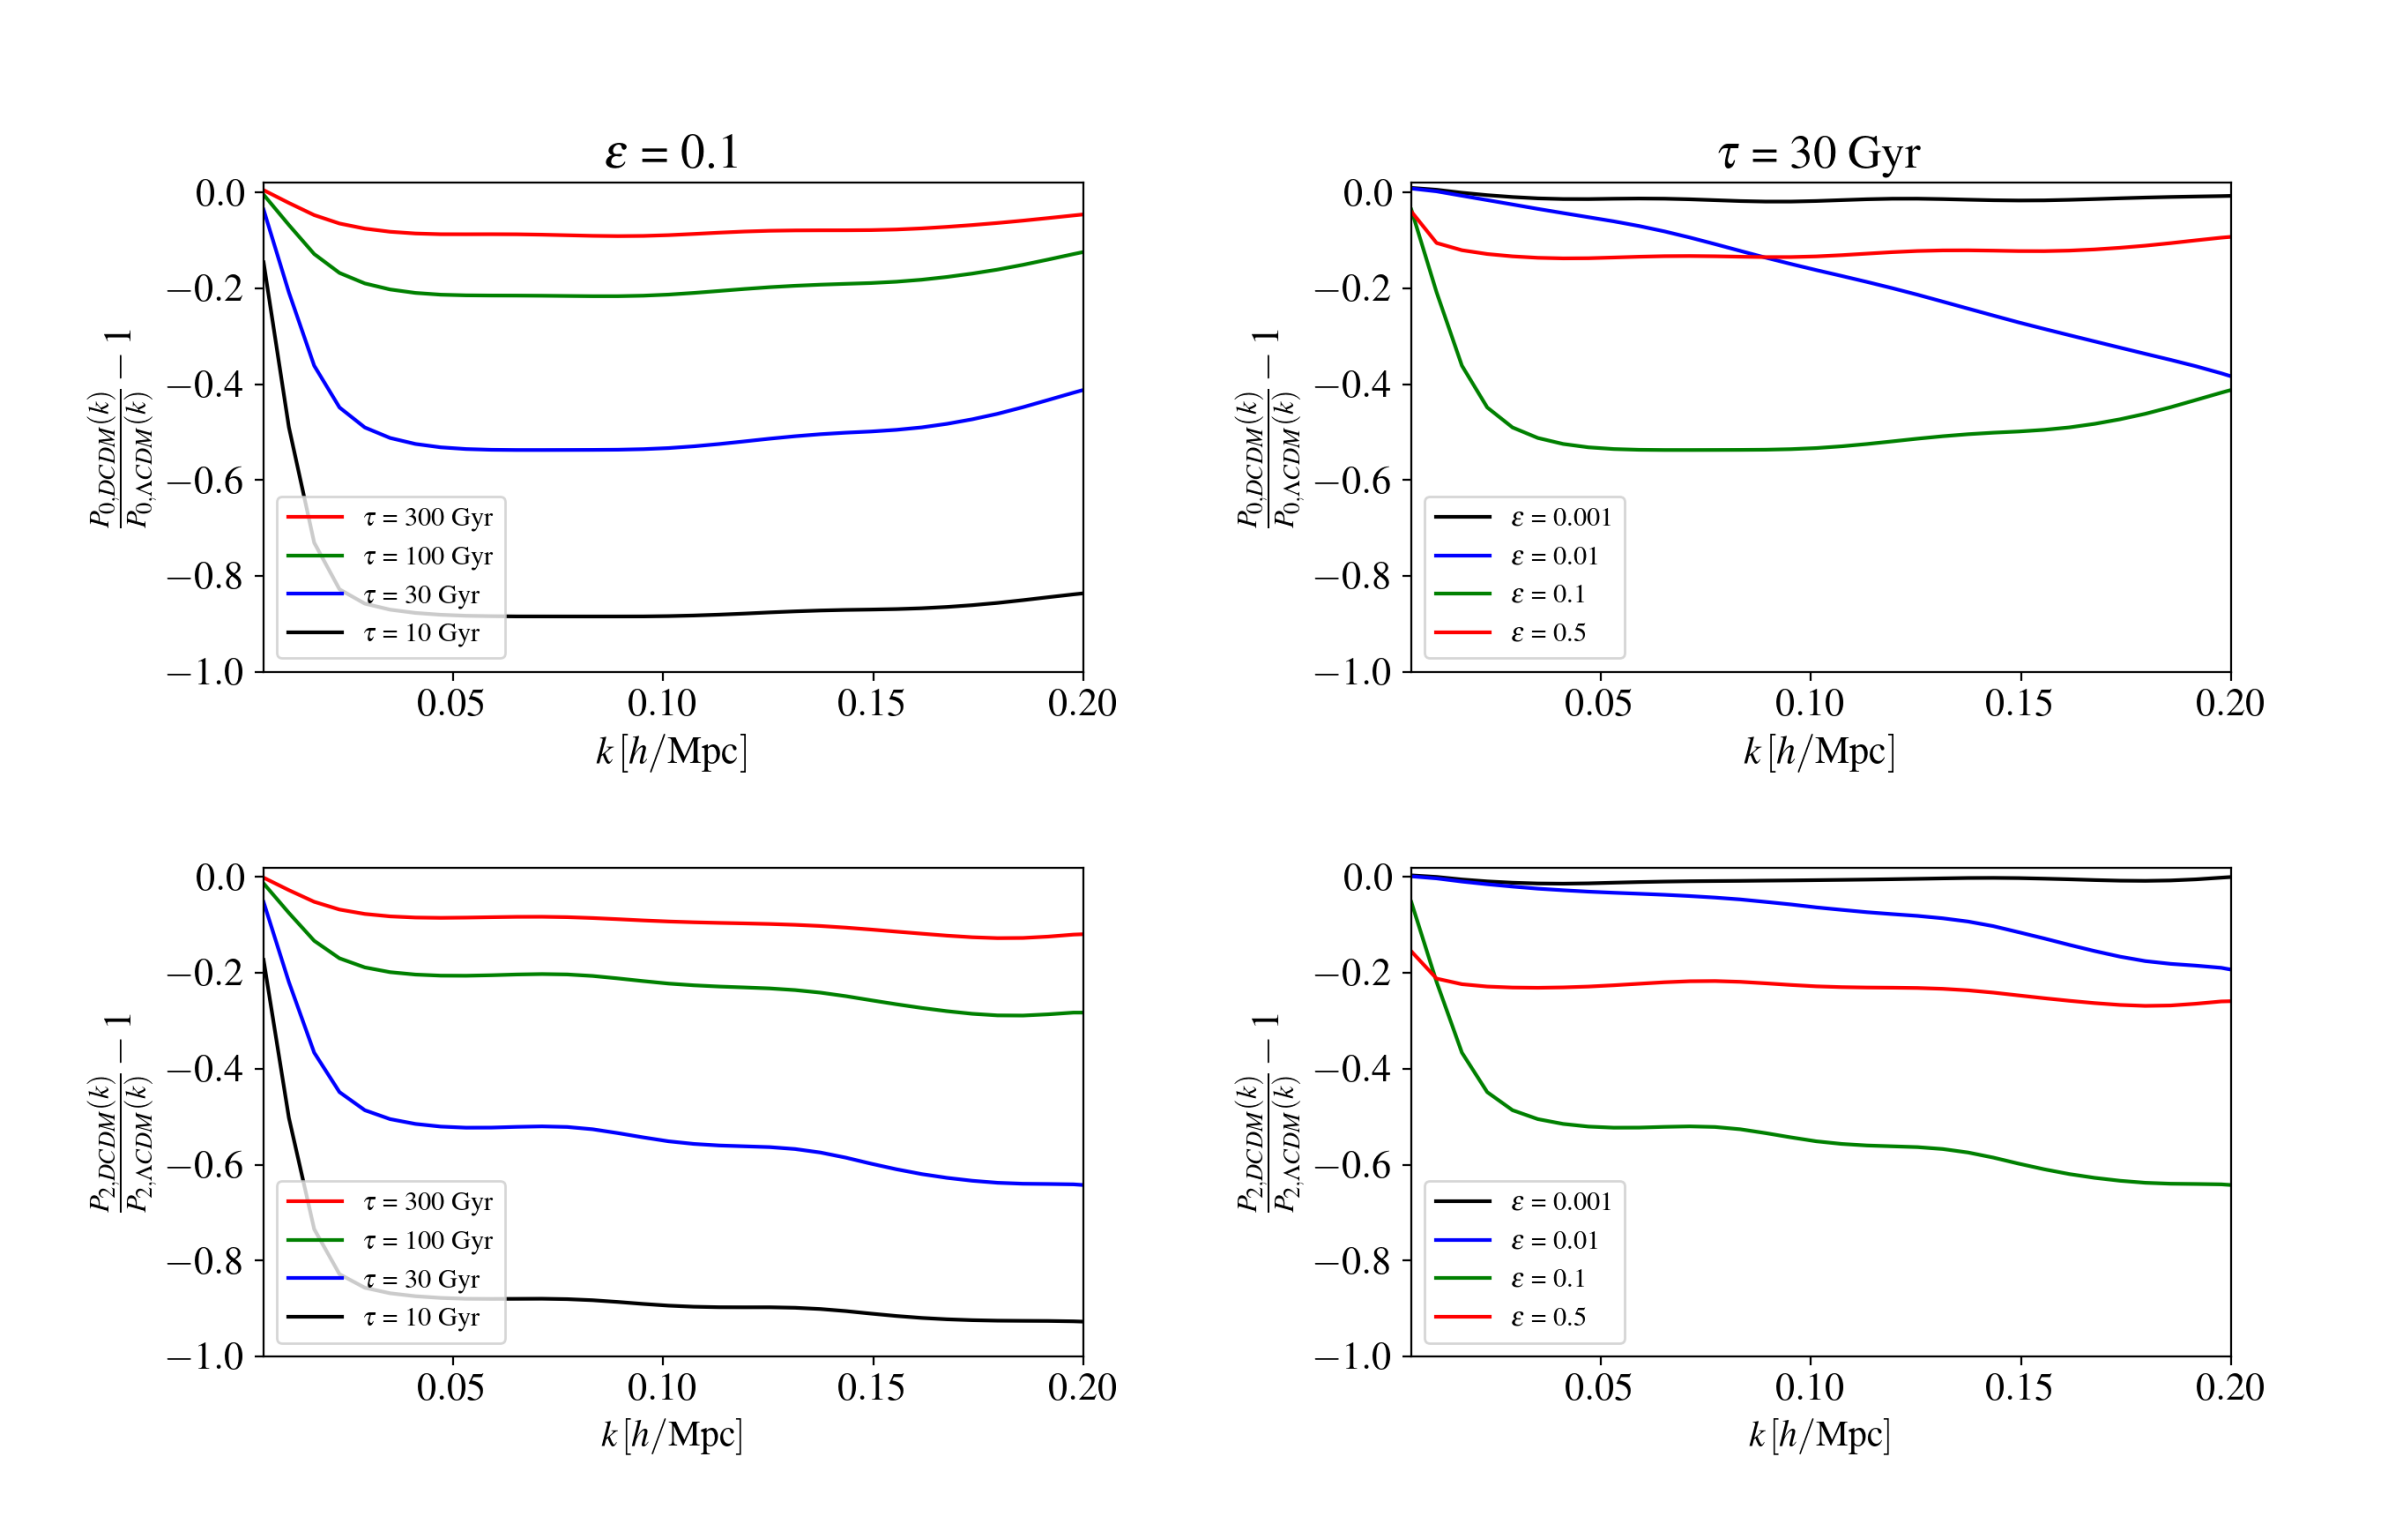
Thanks to the PyBird code, we plot in Fig. 2 the residuals of the non-linear matter power spectra of the DCDM DR model with respect to that of the CDM model at . We also represent the associated linear matter power spectra obtained from the CLASS code. In addition, we plot in Fig. 2 the residuals of the monopole and quadrupole of the galaxy power spectra of this model. In these figures, we set the CDM parameters999For completeness, note that the shape of the residuals of the galaxy and matter power spectra depend on the values of the EFT nuisance parameters, especially at large . According to the notation of Ref. D’Amico et al. (2021), for the numerical evaluation we set the effective dark matter sound speed for the matter power spectra, and , , , , , and for the galaxy power spectra. In practice, these parameters are optimized when quoting best-fits, to ensure that they take realistic values. to their best-fit values from the analysis of ‘Planck + Pantheon + EFTofBOSS + Ext-BAO’ (as described in sec. IV). Finally, we simply vary the two parameters and to isolate their cosmological effects : in the left panels, we fix and vary Gyr, while in the right panel we fix Gyr and vary .
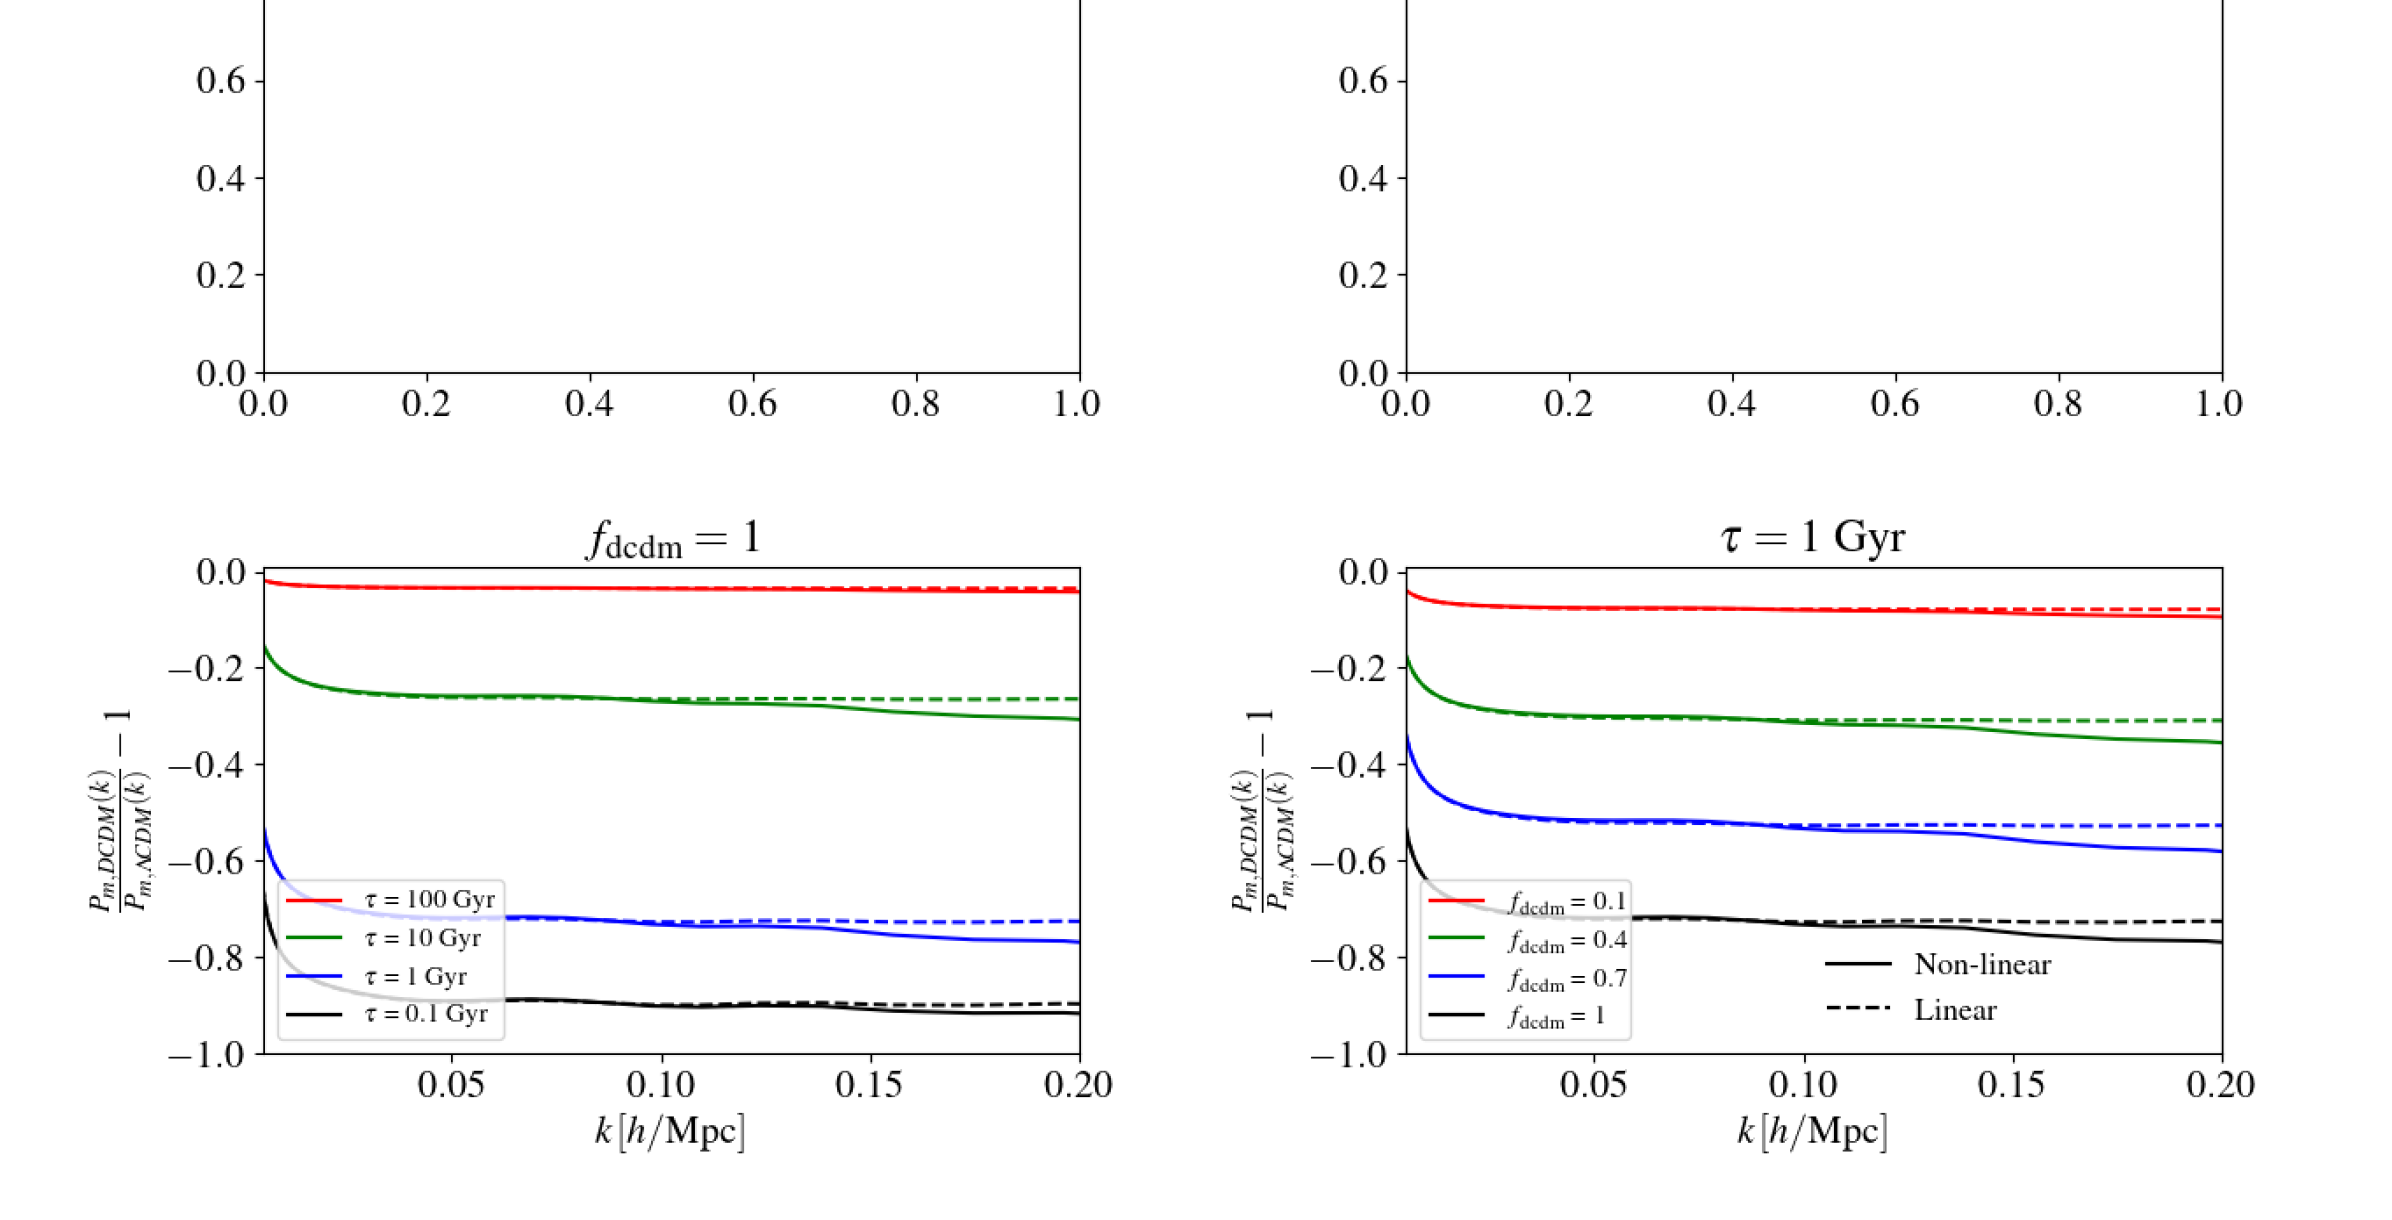
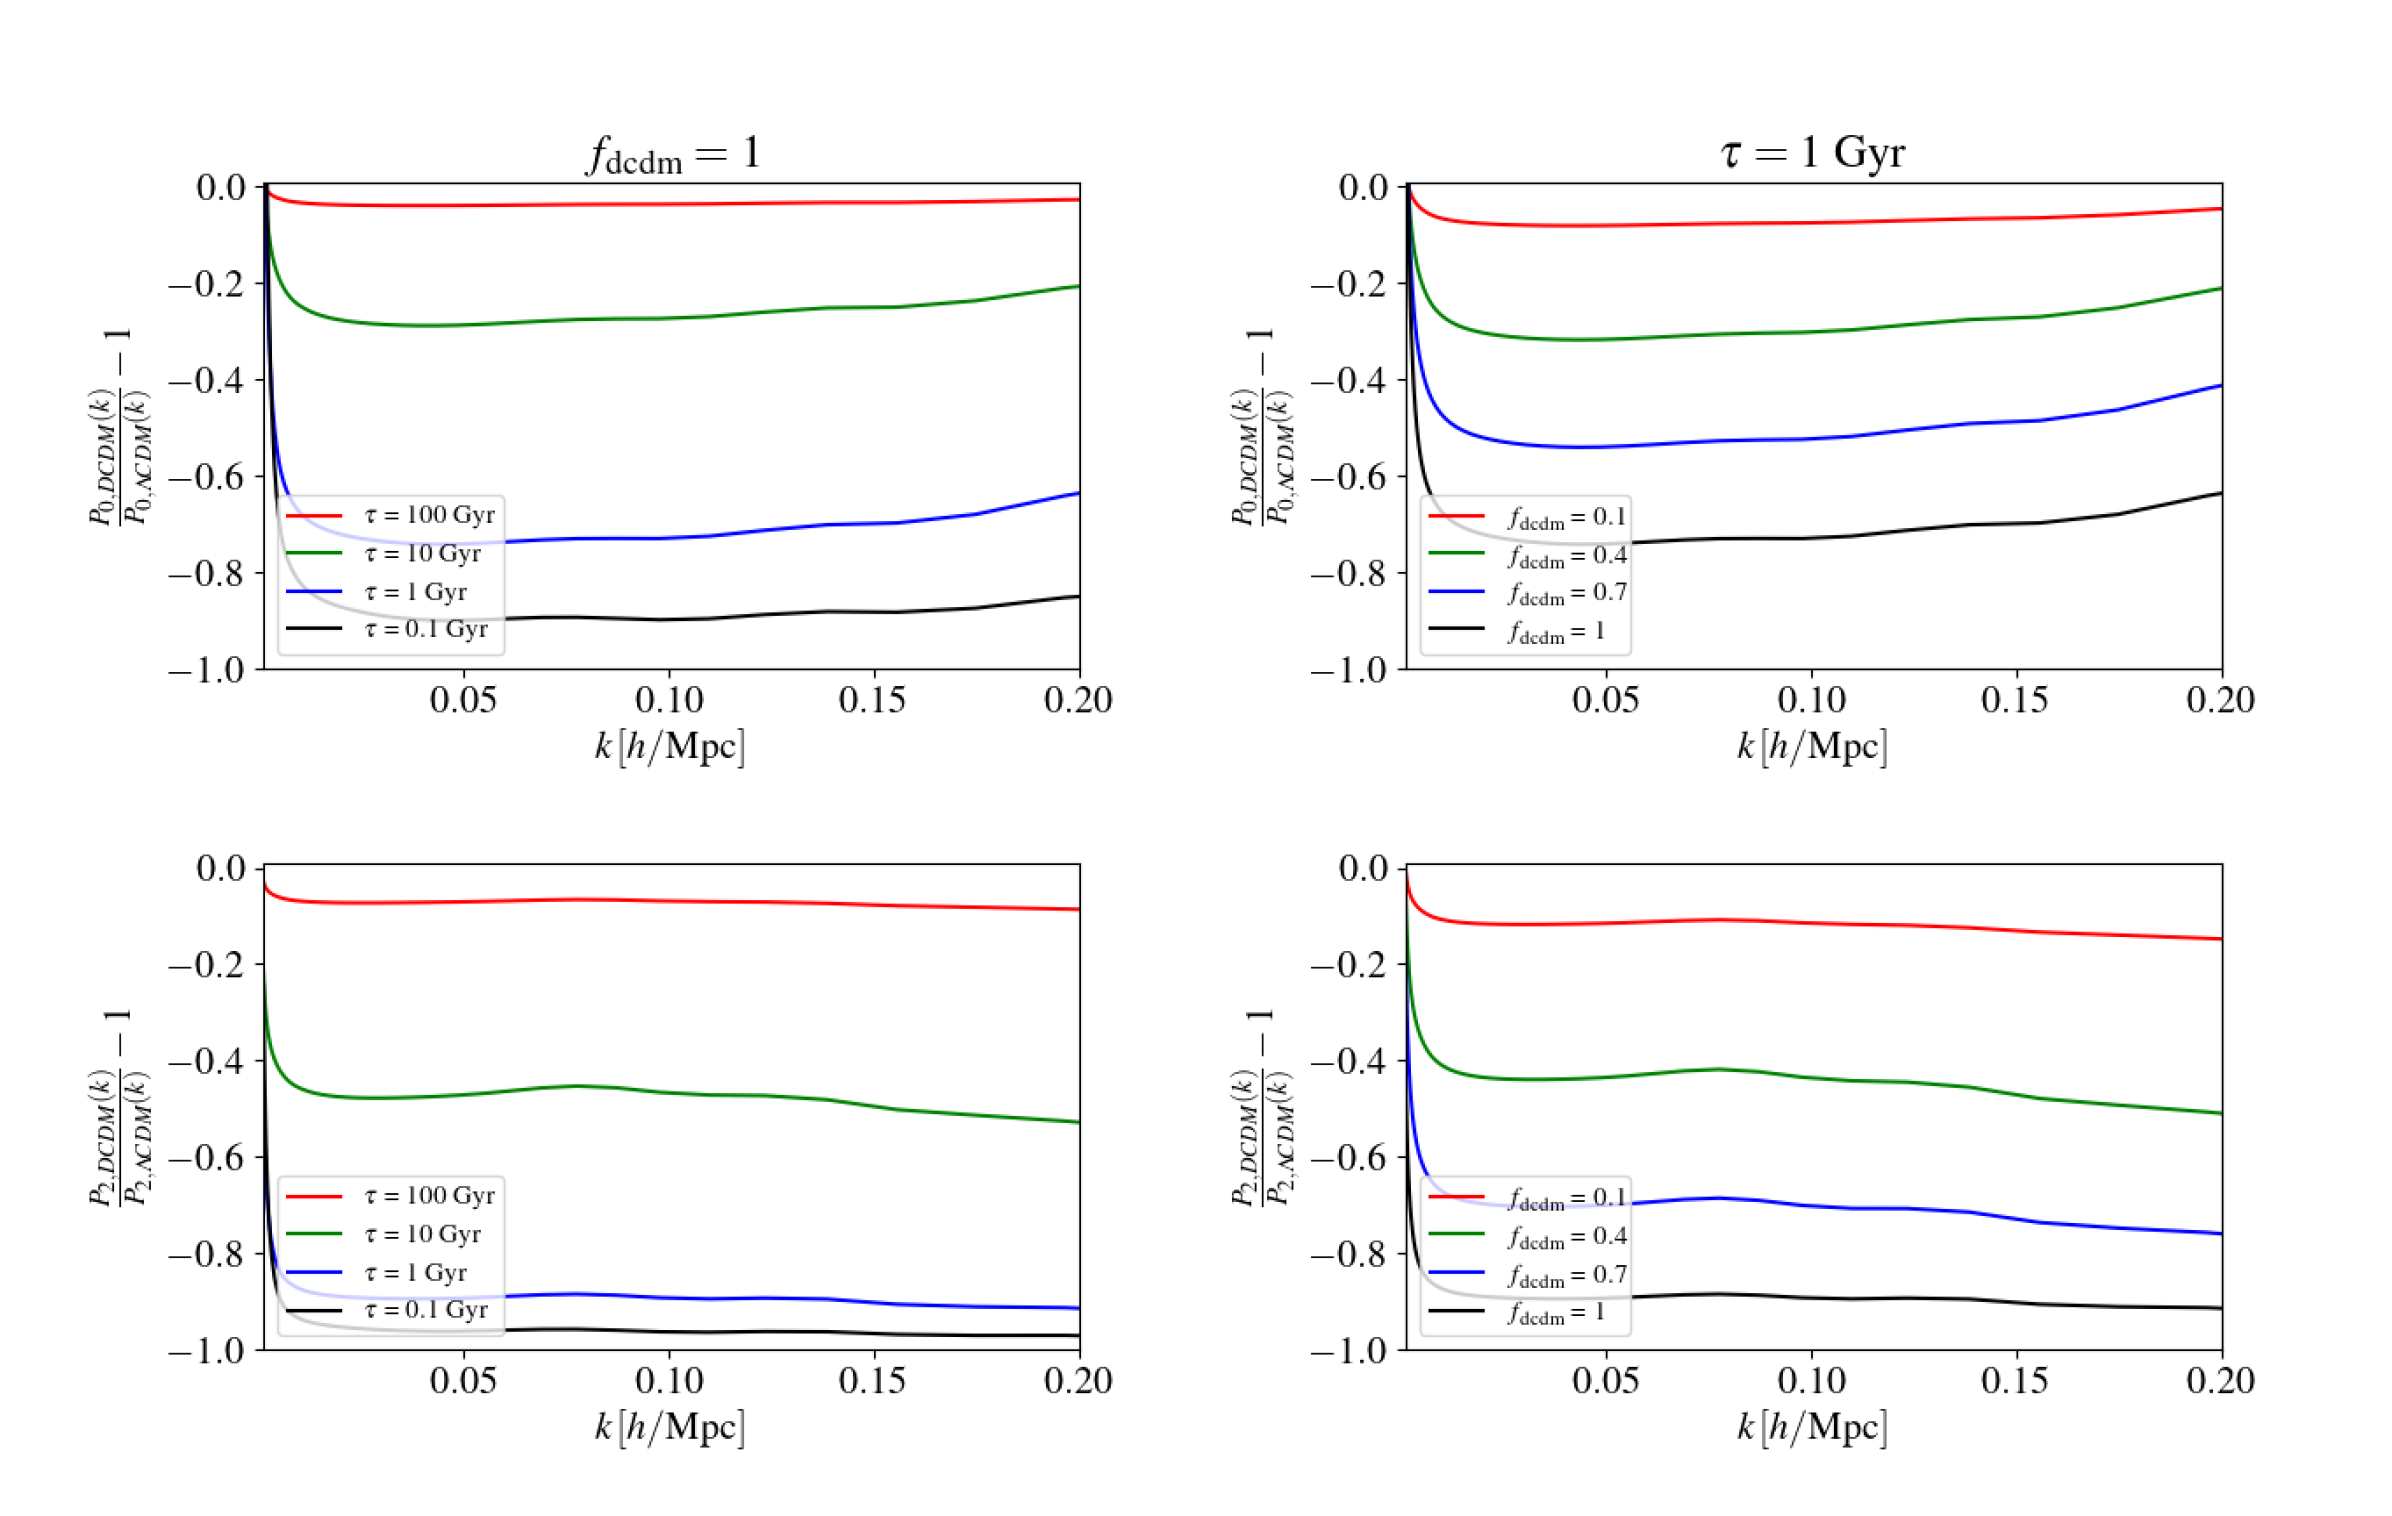
From Figs. 2 and 2, one can see that the monopole of the galaxy power spectrum shows a behavior very similar to that of the linear matter spectrum. For a realistic choice of EFT parameters, it shows an almost scale-independent power suppression due to two main reasons Audren et al. (2014); Poulin et al. (2016). First, the decay of DCDM decreases the duration of the matter dominated era (and at fix , a smaller /larger ), implying a shift of the power spectrum towards large scales, i.e. towards small wavenumbers. Second, DCDM models involve a larger ratio of compared to the CDM model due to the decay. Both effects manifests as a strong suppression of the small-scale power spectrum, and the latter effect leads to an additional modulation of the BAO amplitude visible as wiggles in Figs. 2 and 2. Moreover, we note that the non-linear matter power spectrum shows a stronger scale-dependent suppression compared to the linear power spectrum at . There is an intuitive explanation as to why the non-linear power spectrum is further suppressed, very similarly to what happens for standard neutrinos or warm dark matter, as reviewed e.g. in Lesgourgues et al. (2013). In general, non-linear growth is faster than the linear growth, and the impact of non-linearities is typically to enhance the power spectrum (this is famously the case in CDM). In the DCDM case, modes that are suppressed will enter the non-linear regime later, and therefore start experiencing their enhanced growth due to non-linearities later. This delay leads to a further suppression of the power spectrum compared to CDM when non-linear effects are included. We checked that the amplitude of the deviation from scale-independent suppression at is tied to the value of the effective dark matter sound speed , and can vary of a few for , where corresponds to the non-linear scale and determines the cut-off scale of the theory. On the other hand, the power suppression gets less strong with larger in the monopole of the galaxy power spectrum, an effect indicating an additional degeneracy with other EFT parameters. Finally, and as expected, deviations with respect to CDM increases as decreases and/or increases for the monopole as well as for the quadrupole.
III.1.3 Preliminary study
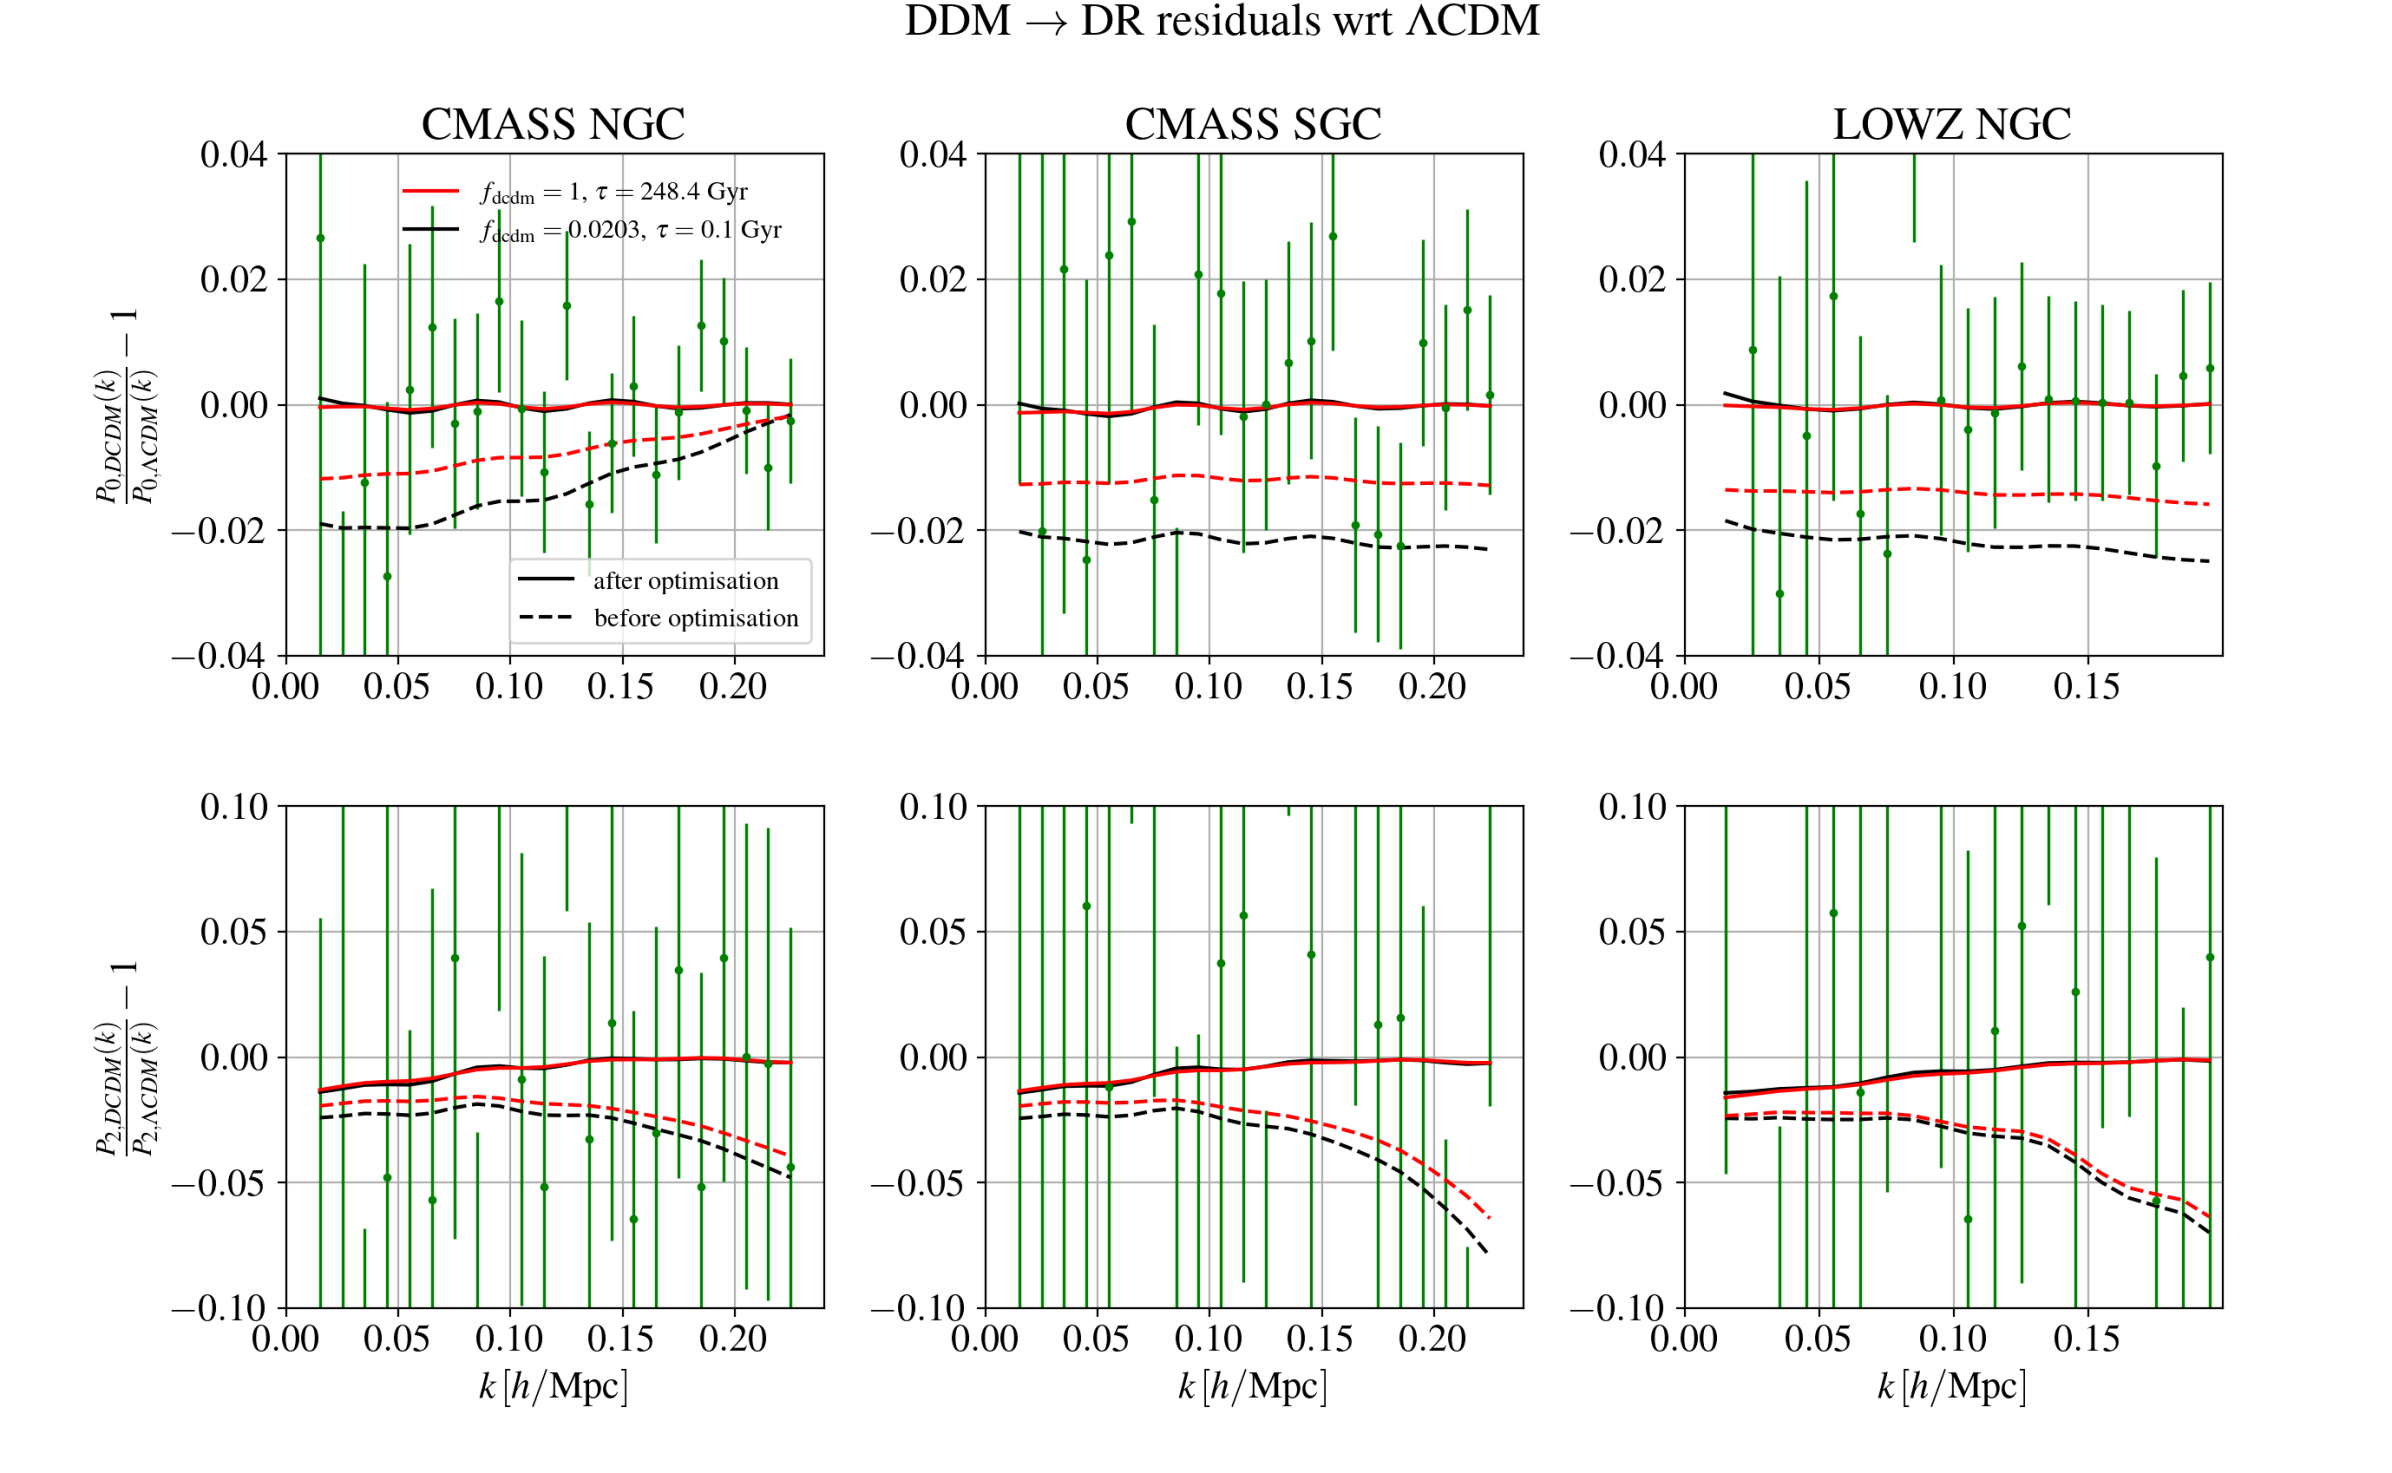
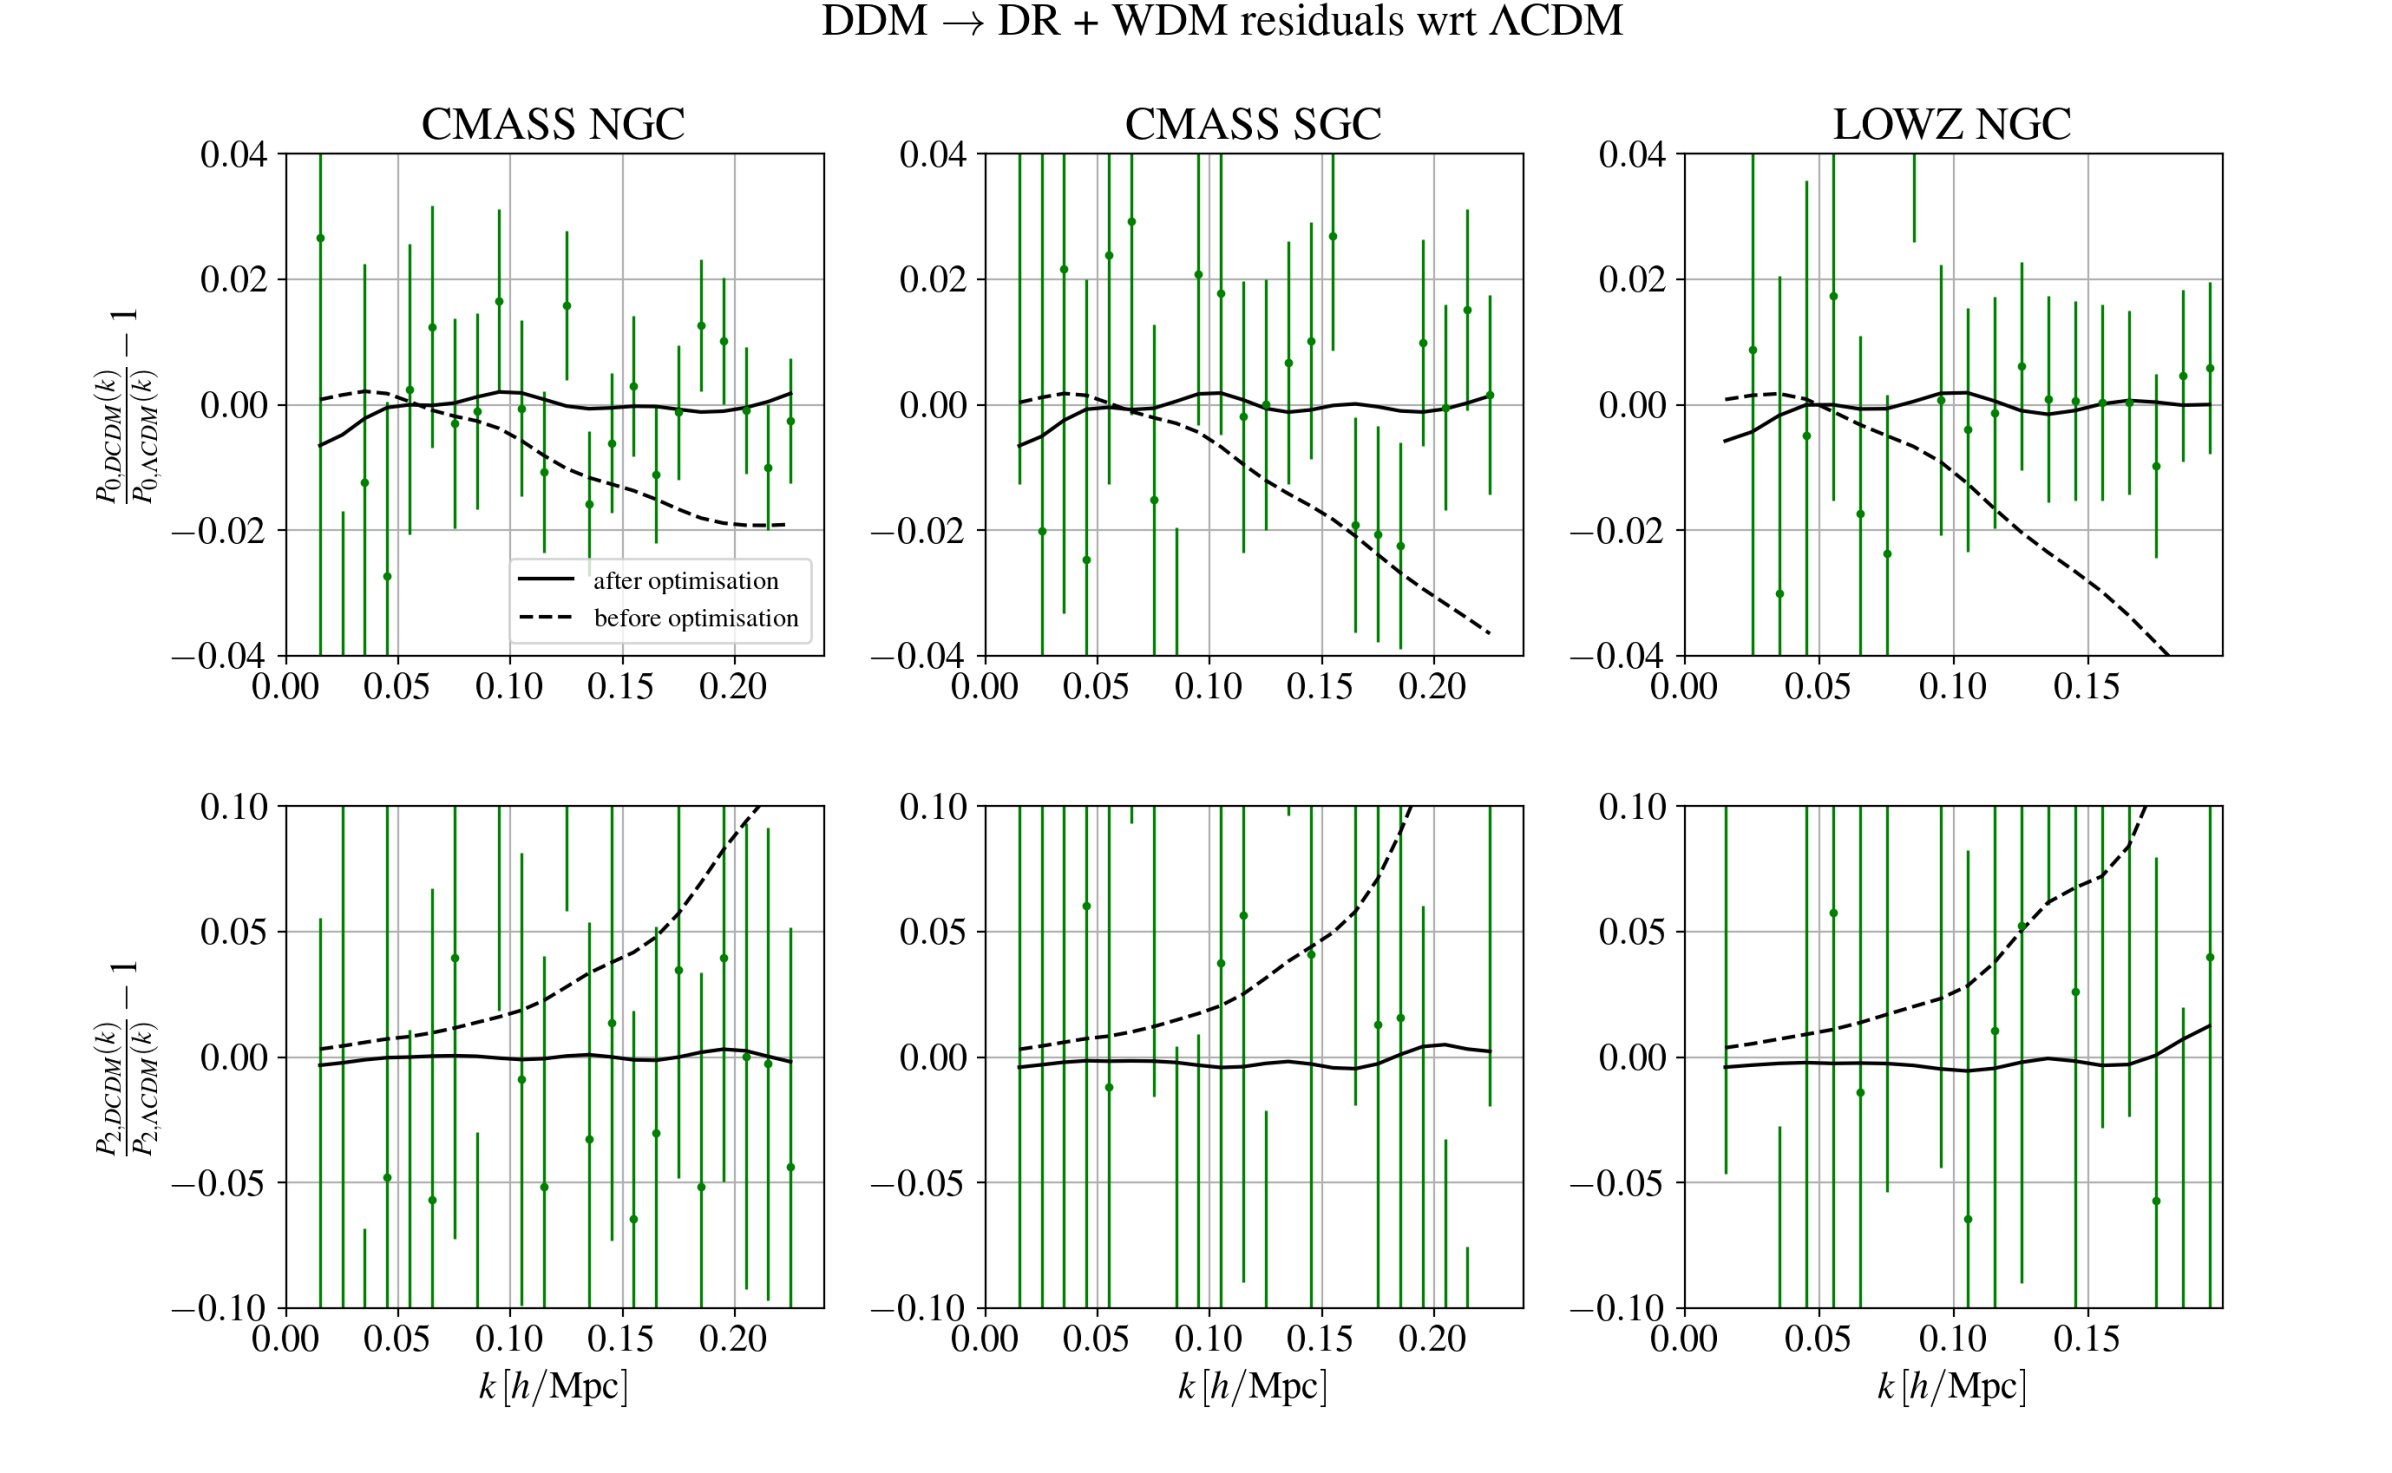
To gauge the impact of using the EFTofBOSS data in our analyses of the DCDM DR model, we first perform a preliminary study in which we consider a set of DCDM parameters laying at the 95% C.L.101010From here on, we quote one-sided bounds at 2 (95 % C.L.) and two-sided bounds at 1 (68% C.L.). derived from Planck data, and compute the of the EFTofBOSS data after optimising the EFT nuisance parameters. The goal is to check the extent to which EFT nuisance parameters can lead to effects degenerate with those of the DCDM with a quick analysis. We set all CDM parameters to their best-fit values from the analysis of ‘Planck + Pantheon + EFTofBOSS + Ext-BAO’ (see Sec. IV). We perform two analyses: (i) we set Gyr and take the upper bound on from our ‘Planck + Pantheon + Ext-BAO (no Ly-)’, i.e. (see Tab. 5), and (ii) we set (i.e. all the dark matter decays), while we take the lower bound of from our ‘Planck + Pantheon + Ext-BAO (no Ly-)’ analysis, i.e. Gyr (see Tab. 5). We show in Tab. 1 the associated to the EFTofBOSS data, and we plot in Fig 3, using the PyBird code, the residuals (with respect to CDM from the ‘Planck + Pantheon + EFTofBOSS + Ext-BAO’ analysis) of these studies. To gauge the impact of EFT nuisance parameters, in this latter figure, we show residuals with and without the optimization procedure (in the latter case, we simply set the EFT nuisance parameters to those of CDM). This preliminary study allows us to highlight two important points. Firstly, the optimization procedure has washed out the suppression due to decay, which implies that the effect of the EFT nuisance parameters are (at least partly) degenerate with that of the decay. Secondly (and consequently), for these two analyses where we have chosen DCDM parameters that are excluded at 95% C.L., we obtain a very close to that of the CDM best-fit model of the full analysis, suggesting that EFTofBOSS data may not provide strong additional constraints to this model. Naturally, it does not prevent the model to potentially yield an improved fit over CDM once all (cosmological and nuisance) parameters are optimized against the data, and we will check our naive results against a full analysis in Sec. IV.
| Parameter | & Gyr | & Gyr |
|---|---|---|
| 41.3 | 40.7 | |
| 43.9 | 44.0 | |
| 33.4 | 33.6 | |
| 118.6 | 118.3 | |
| +0.8 | +0.5 |
III.2 Warm Dark Matter decay products (DCDM WDM+DR model)
III.2.1 Presentation of the model
We now turn to a DCDM model where the entirety of the DM sector is considered unstable (i.e. in the language of the first model), decaying into dark radiation and a massive particle, which will act as WDM. As before, we assume the decay products do not interact with the standard model particles. The DCDM sector is now described by the DCDM lifetime , and the fraction of rest-mass energy carried away by the massless particle given by Blackadder and Koushiappas (2014)
| (17) |
where and are the mother and daughter particle masses respectively. The accurate computation of the cosmological impact of the DCDM sector requires to follow the evolution of the phase space distribution of the warm particle produced during the decay. The full set of equations is described in Ref. Aoyama et al. (2014); Abellán et al. (2021). We summarize here the sets of equations describing the evolution of the background energy densities of the dark components, as well as the linear perturbations in a fluid approximation, valid well within the horizon.
The background energy densities evolve as follows Aoyama et al. (2014):
| (18) | ||||
| (19) | ||||
| (20) |
where is the equation of state of the massive daughter particle. In the limit of large or small , one recovers the CDM model, while setting leads to a decay solely into massless particles.
In the synchronous gauge comoving with the DCDM fluid, the linear perturbation equations for the parent particle and DR daughter is still given by Eq. (10) and Eqs. 11-14, respectively. However, the quantity now satisfies
| (21) |
where the parameter now affects the amount of energy transferred to the DR. Regarding the WDM linear perturbations, it is unfortunately not possible to integrate out the dependency on momenta as it is done for the DR species. In general one has to follow the evolution of the full phase-space distribution, which becomes very computationally demanding (see Ref. Abellán et al. (2021) for the expression of the full Boltzmann hierarchy). Nevertheless, it was shown in Ref. Abellán et al. (2021) that, well within the horizon, the dynamics of the WDM perturbations can be well approximated by the following set of fluid equations:
| (22) | ||||
| (23) |
where is the WDM sound speed in the synchronous gauge, i.e. , and is the WDM adiabatic sound speed, i.e. , which one can write in the following form:
| (24) |
In this latter equation, is the pseudo-pressure (introduced in the context of the fluid equations for massive neutrinos Lesgourgues and Tram (2011)), which corresponds to a higher momenta integral of the WDM homogeneous phase space distribution, reducing to the standard pressure in the relativistic limit. Solving the fluid equations requires specifying the sound speed , which was found to be well described by the following formula:
| (25) |
where the free-streaming scale of the WDM is computed as:
| (26) |
The free-streaming scale corresponds to the scale at which pressure (coming from the ‘velocity kick’ received during the decay process) suppresses perturbations of the WDM compared to those of the DCDM. In other word, on scales , one has , while on scale the WDM perturbations are suppressed and exhibit oscillations over time.
To obtain the linear CMB and matter power spectrum, we make use of an extension of the CLASS code111111https://github.com/PoulinV/class_decays described in Ref. Abellán et al. (2021), and we determine the non-linear galaxy power spectrum using the PyBird code. We have argued in previous section and in App. A, through direct comparison with N-body simulations, that PyBird can safely be used to describe DM decays with massless decay products. Unfortunately, we do not have access to such N-body simulations in the case of massive decay products. A priori, the problem is not the decay per se (as we have seen for the massless decay products). Rather, contrarily to the case of massless daugthers, the massive daughter may develop perturbations whose contribution to the total matter power spectrum can be highly non-trivial. In App. B, following Refs Senatore and Zaldarriaga (2017); de Belsunce and Senatore (2019), which treated the similar case of massive neutrinos, we argue that the corrections to the EFTofLSS necessary to fully capture the model-specific effects can be neglected for most of the parameter space of interest, as the fractional contribution of the WDM to the DM density is small (in particular for the best-fit model that we derive), or the free-streaming scale exceeds the scale-cut considered in the analysis.
III.2.2 The non-linear power spectrum
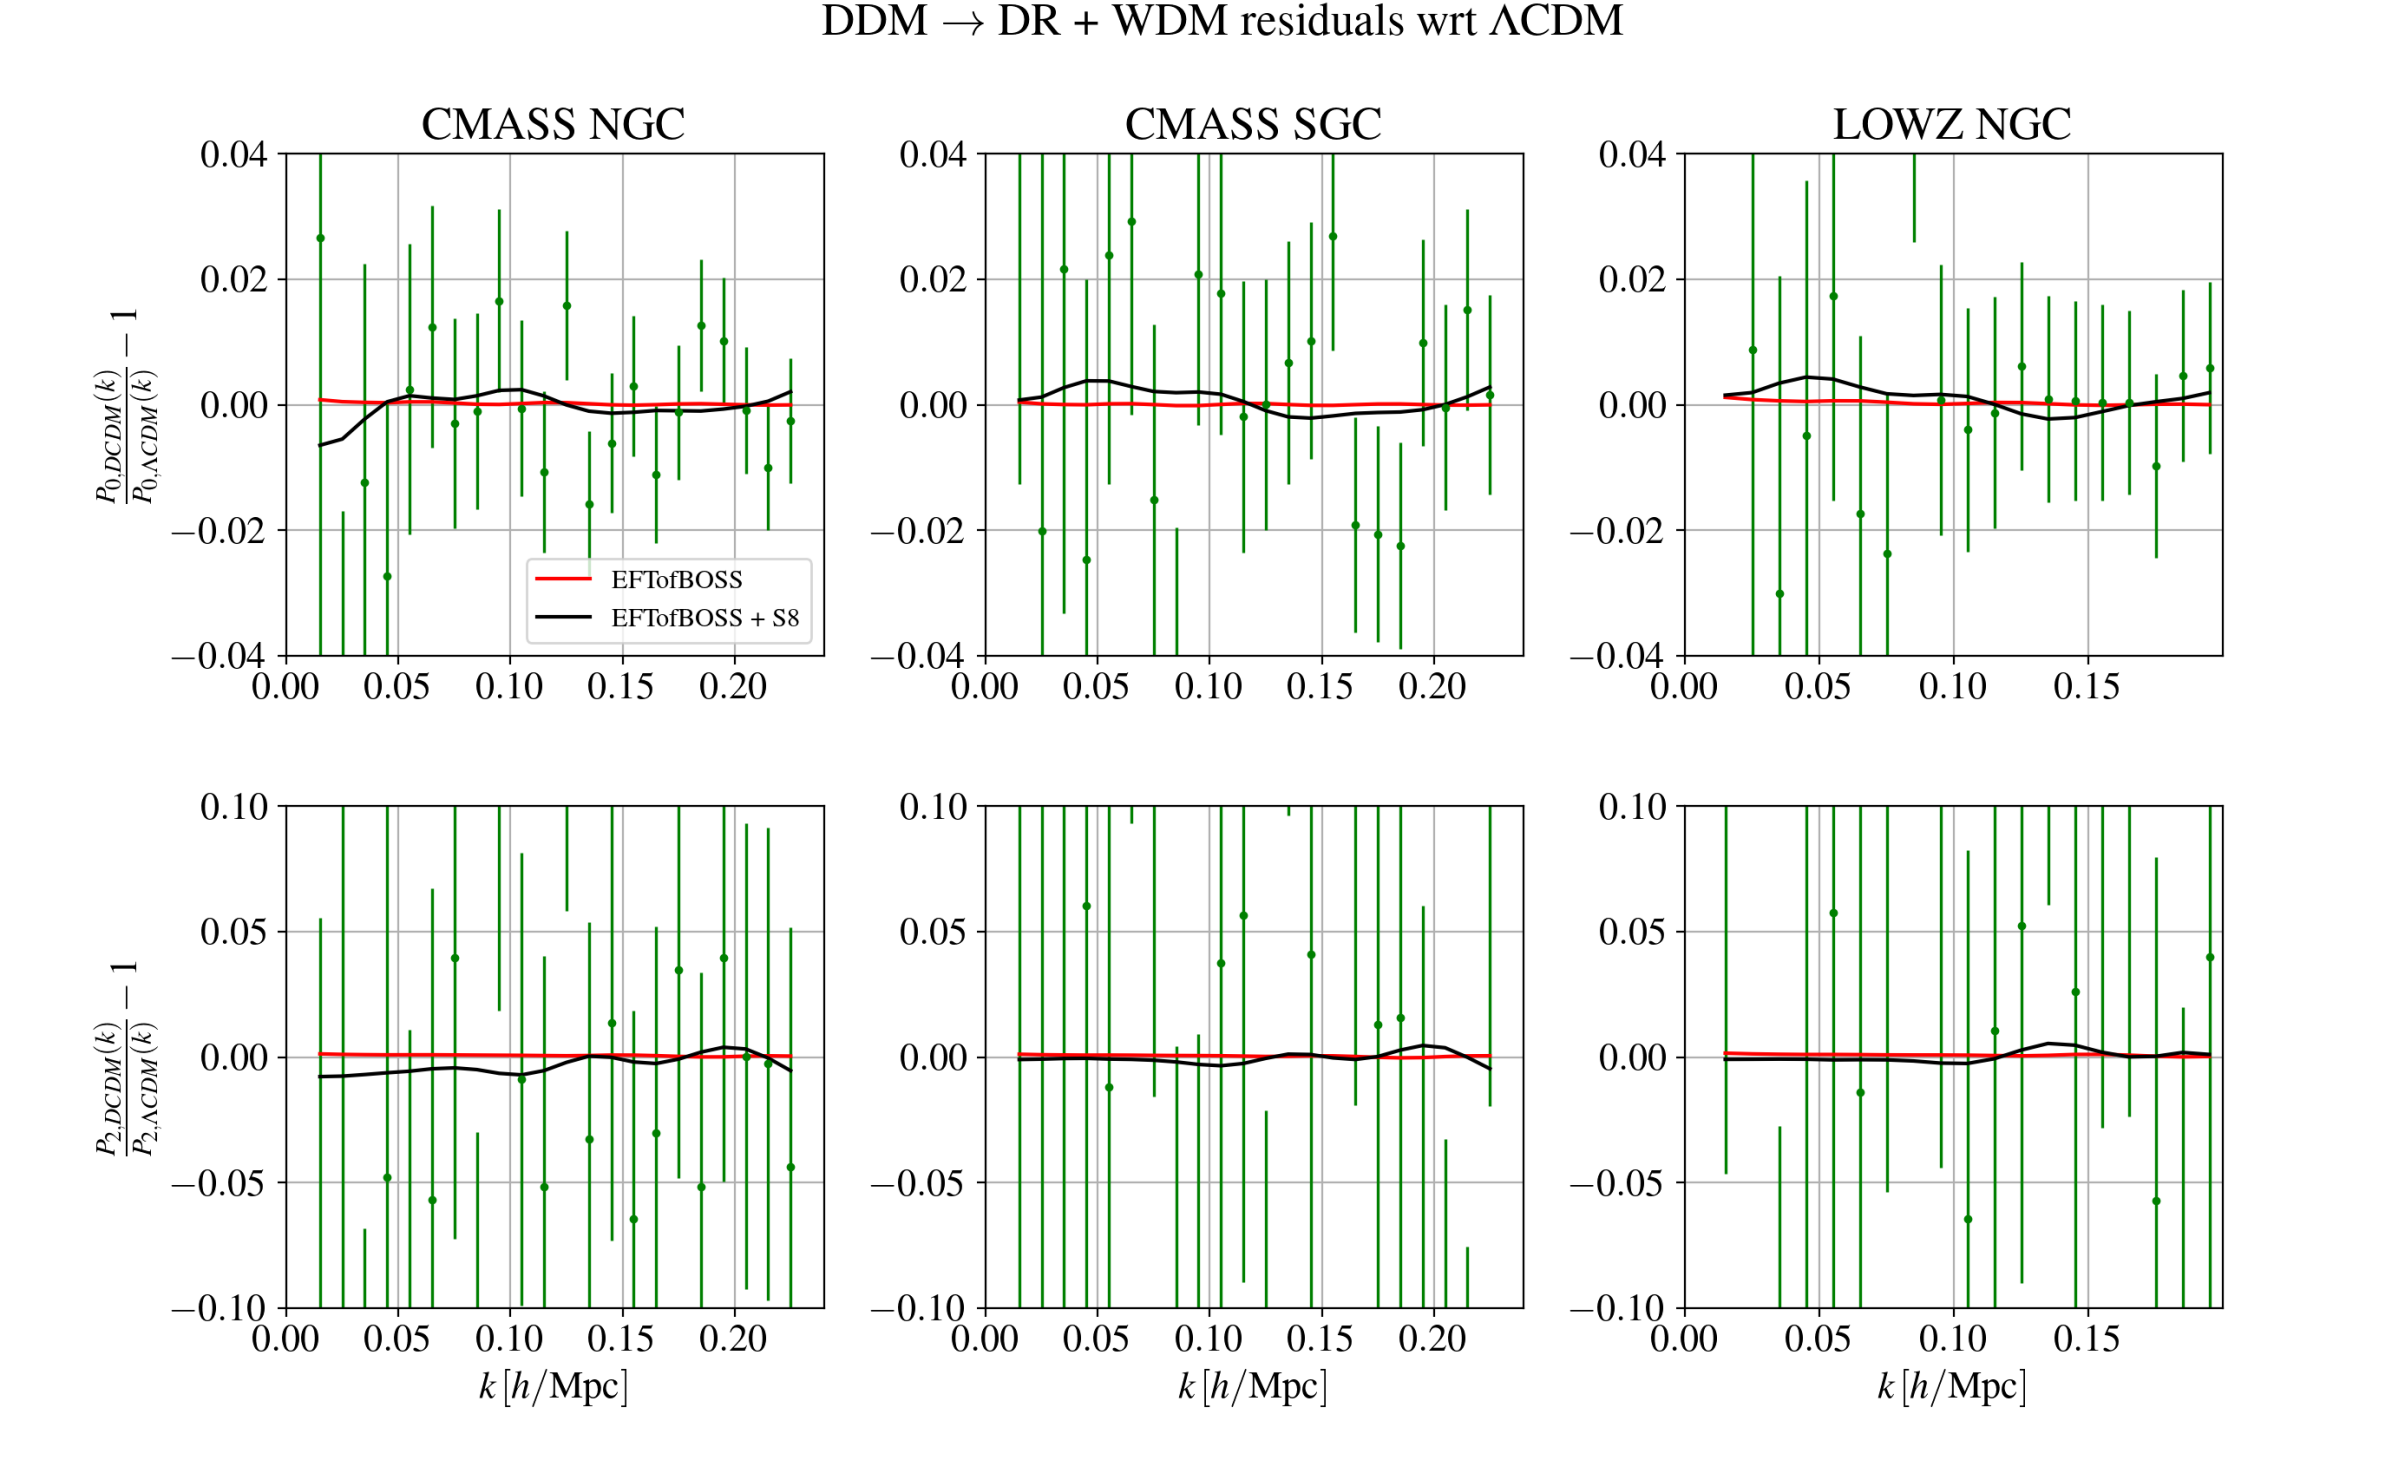
We plot in Fig. 5 the residuals of the non-linear matter power spectra of the DCDM WDM+DR model with respect to that of the CDM model at . We also represent the associated linear matter power spectra obtained from the CLASS code, exactly as in Fig. 4 of Ref. Abellán et al. (2021). In addition, we plot in Fig. 5 the residuals of the monopole and quadrupole of the galaxy power spectra of this model. In these figures, the cosmological parameters are taken from the DCDM WDM+DR best-fit model of Ref. Abellan et al. (2020), while the nuisance parameters are set as in Figs. 2 and 2. In the left panels, we fix and vary Gyr, while in the right panel we fix Gyr and vary .
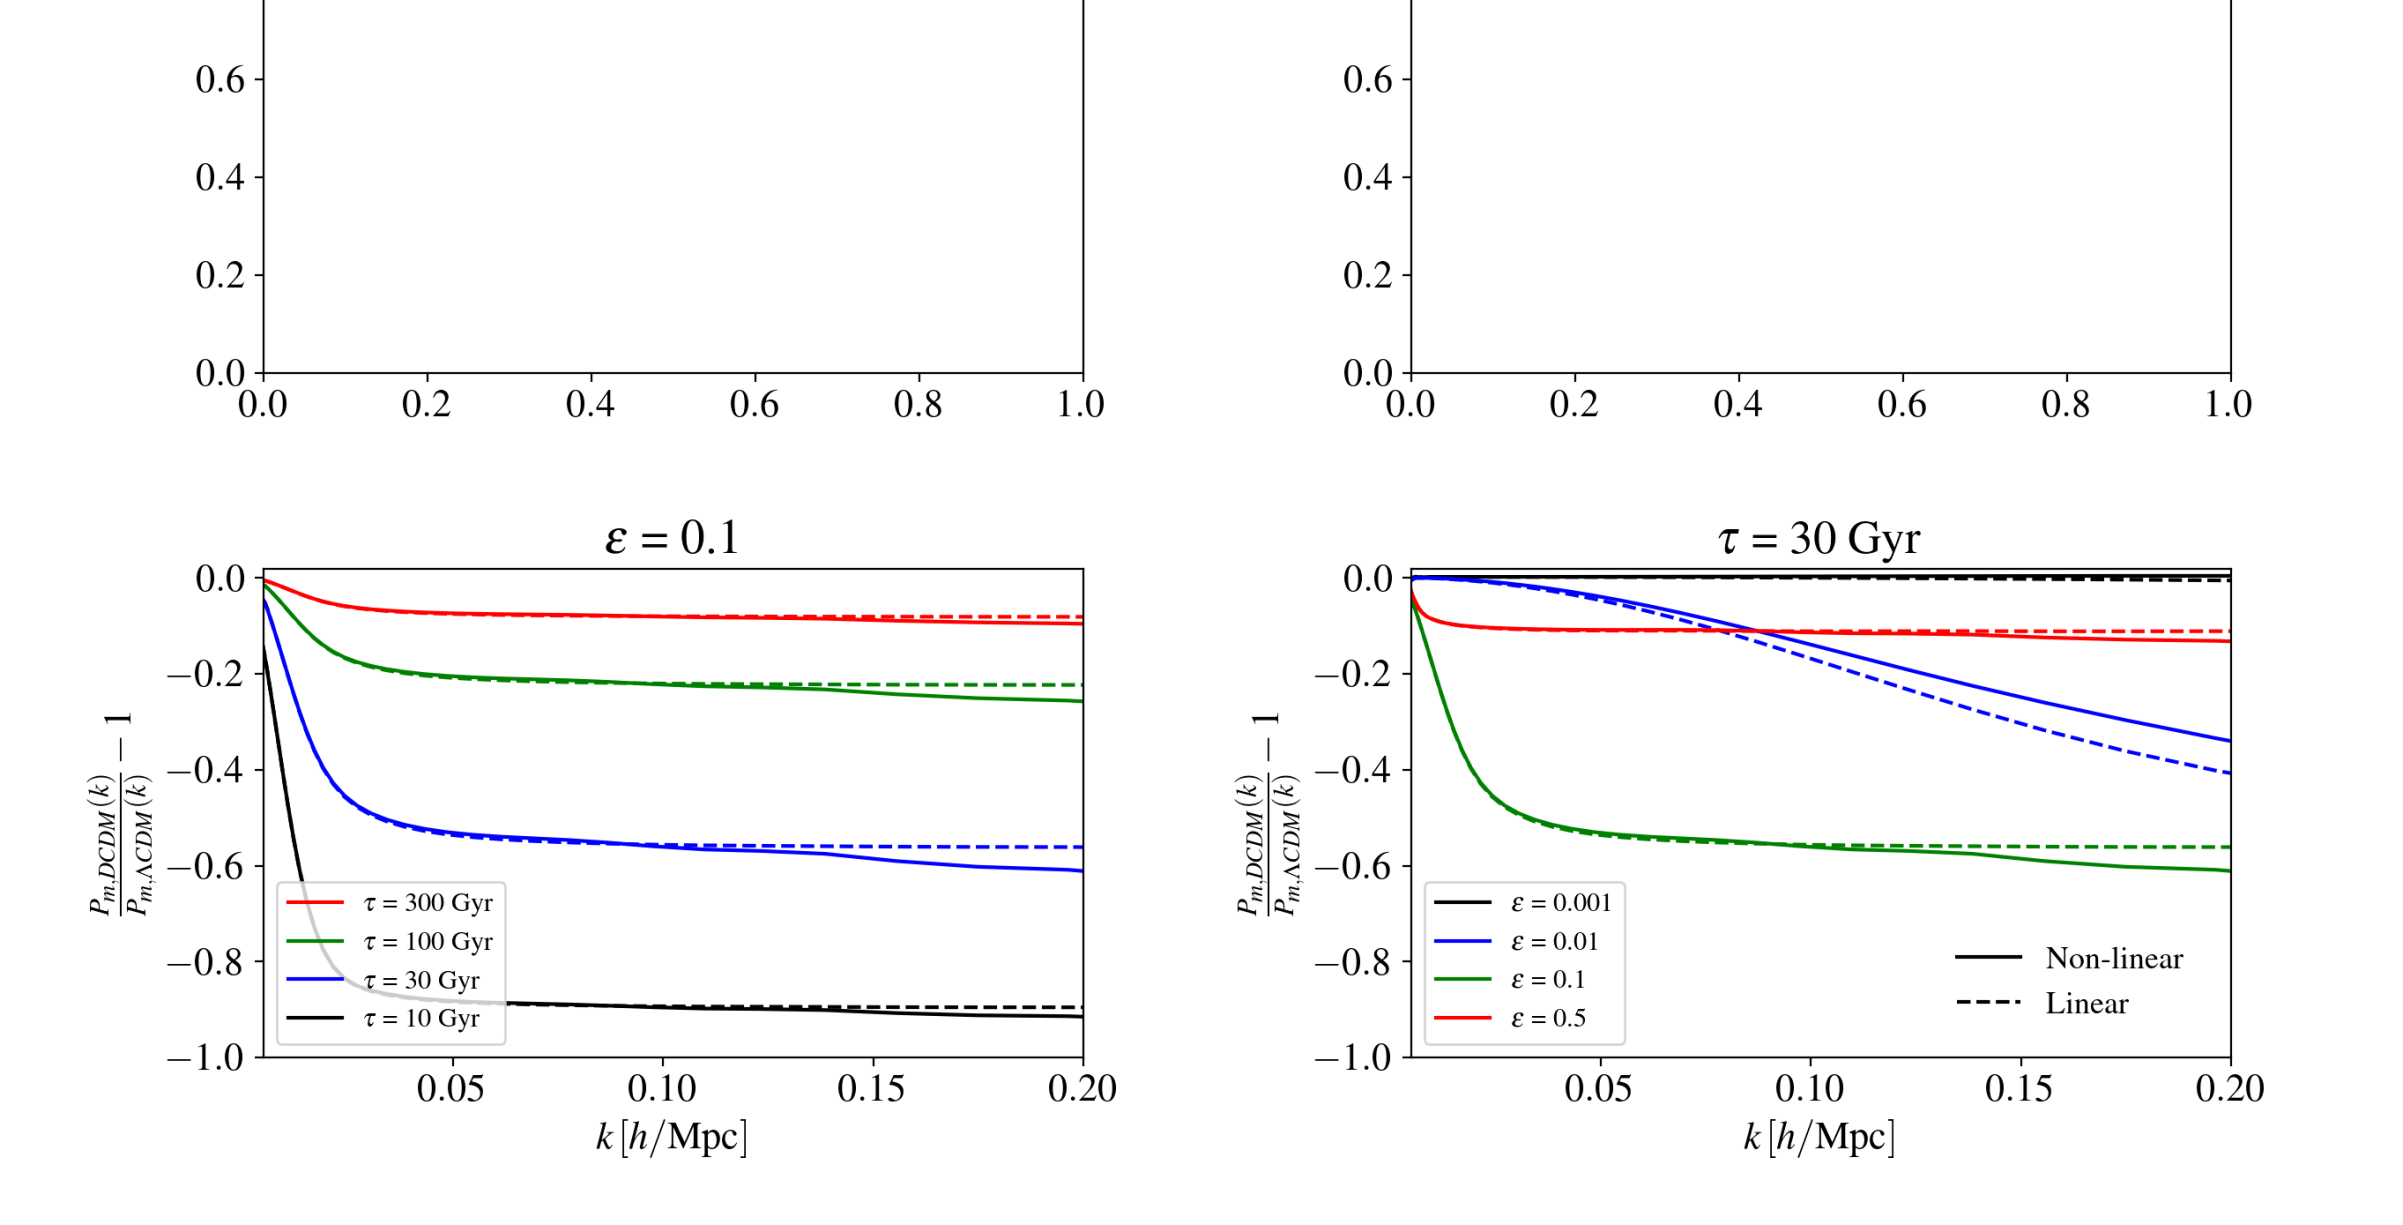
As for the case of the DCDM DR model, we obtain a very similar behaviour between the linear matter power spectrum and the monopole of the galaxy power spectrum, except for a mild monotonic reduction of the power suppression at larger ’s in the monopole of the galaxy power spectrum (due to the choice of EFT parameters, this reduction of the suppression may change for different values). The presence of a warm dark matter component which does not cluster on small scales suppresses the matter power spectrum as well as the galaxy power spectrum, and – which sets the abundance of the WDM species today – controls the amplitude of the power suppression, while controls the cutoff scale. One can see in Fig. 5 that the suppression of the galaxy spectrum increases as decreases (left panel), while the suppression starts to occur on larger scales as increases (right panel). Once , the free-streaming scale becomes equivalent to the Hubble horizon, and the effects become identical to that of the DCDM DR model presented before. Note that because of the effect of the WDM, the case has a stronger suppression than the (pure dark radiation) case. Moreover, we find (see Fig. 5) that the non-linear correction slightly modulates the slope of the power suppression compared to the linear matter power spectrum. It always leads to a stronger suppression than the linear one at large enough (for , the modulation occurs at ). However, for smaller (see the case for example), the modulation can appear as a milder power suppression compared to the linear one in the range of validity of the EFT at one-loop order.
III.2.3 Preliminary study
| Parameter | Best-fit |
|---|---|
| 41.2 | |
| 44.5 | |
| 34.4 | |
| 120.1 | |
| +3.1 |
Similarly to the case of the DCDM DR model, we perform a preliminary study to test whether the EFTofBOSS data can further constrain the DCDM WDM+DR model that resolves the tension. We fix cosmological parameters121212The analysis performed in Refs. Abellan et al. (2020); Abellán et al. (2021) made use of a prior that includes information from BOSS Heymans et al. (2020). For consistency and to avoid double counting information, we re-performed the analysis (see Sec. IV) with a prior derived from KiDS-1000 data alone. to those obtained from the joint analysis of Planck data, Pantheon SN1a data, a compilation of BAO data and the measurements by KiDS-1000 Asgari et al. (2021). We optimize the EFT nuisance parameters of the galaxy power spectrum to check the extent to which they can lead to effects degenerate with those of the DCDM. We show in Tab. 2 the associated to the EFTofBOSS data, while in Fig. 6, using the PyBird code, we plot the residuals with respect to the best-fit CDM model from the analysis of ‘Planck + Pantheon + EFTofBOSS + Ext-BAO’ (see Sec. IV). In this figure, we represent residuals with and without the EFT optimization procedure (in the latter case, we simply set the EFT nuisance parameters to those of CDM). As before, one can see that the effects of the DCDM are strongly reduced once EFT nuisance parameters are optimized, suggesting a strong degeneracy between the DCDM and the EFT parameters. Nevertheless, for this preliminary study, the is degraded by compared to the best-fit obtained in the CDM model for the full analysis. Contrary to the preliminary study of the DCDM DR model for which we obtained a close to that of the CDM model, we anticipate that the EFTofBOSS data can provide additional constraining power to this model.
IV A comprehensive MCMC analysis of the DCDM models
IV.1 Data and method
We now perform a Monte Carlo Markov Chain (MCMC) analyses, confronting these two DCDM models with recent cosmological observations. To do so, we make use of the MontePython-v3 code Brinckmann and Lesgourgues (2019); Audren et al. (2013) interfaced with our modified CLASS version. We perform various analyses from a combination of the following data sets:
- •
-
•
Pantheon: The Pantheon SNIa catalogue, spanning redshifts Scolnic et al. (2018).
- •
-
•
BOSS BAO/: The measurements of the BAO and the redshift space distortion from the CMASS and LOWZ galaxy samples of BOSS DR12 at , 0.51, and 0.61 Alam et al. (2017).
-
•
: The KIDS-1000 cosmic shear measurement of , modeled as a a split-normal likelihood Asgari et al. (2021).
-
•
EFTofBOSS: The CMASS and LOWZ data sets of the EFTofBOSS data (see Sec. II).
Our analyses always include Planck, Pantheon and Ext-BAO data. However, we quantify the impact of EFTofBOSS data and the prior by performing analyses with and without these data. When not including the EFTofBOSS data, we make use of the conventional BOSS BAO/ data. We use Planck conventions for the treatment of neutrinos and include two massless and one massive species with eV Aghanim et al. (2020a). We impose a large flat prior on the dimensionless baryon energy density , the Hubble parameter today , the logarithm of the variance of curvature perturbations centered around the pivot scale Mpc-1 (according to the Planck convention), , the scalar spectral index , and the re-ionization optical depth . We assume our MCMC chains to be converged when the Gelman-Rubin criterion Gelman and Rubin (1992). Finally, we extract the best-fit parameters from the procedure highlighted in appendix of Ref. Schöneberg et al. (2021).
| CDM | ||
|---|---|---|
| Parameter | w/ EFTofBOSS | w/ EFTofBOSS + |
| 3927.0 | 3933.0 | |
| 2.4 | ||
| DCDMDR | ||
|---|---|---|
| Parameter | w/ EFTofBOSS | w/ EFTofBOSS + |
| unconstrained (4.8) | unconstrained (5.8) | |
| 3927.0 | 3933.0 | |
| 0.0 | 0.0 | |
| 2.4 | ||
| DCDM DR | ||
|---|---|---|
| Data sets | (for ) | |
| Planck | 246.3 Gyr | |
| Planck + Pantheon + Ext-BAO (no Ly-) | 248.4 Gyr | |
| Planck + Pantheon + BOSS BAO/ + Ext-BAO (no Ly-) | 260.4 Gyr | |
| Planck + Pantheon + BOSS BAO/ + Ext-BAO | 0.0219 | 250.0 Gyr |
| Planck + Pantheon + EFTofBOSS + Ext-BAO | 0.0216 | 249.6 Gyr |
IV.2 Dark Radiation decay products
Let us recall that in the case of the DCDM DR model we have two additional parameters: , the decay rate of DCDM, and , the fraction of DCDM with respect to the total DM. In the MCMC analyses, we impose flat priors on and :
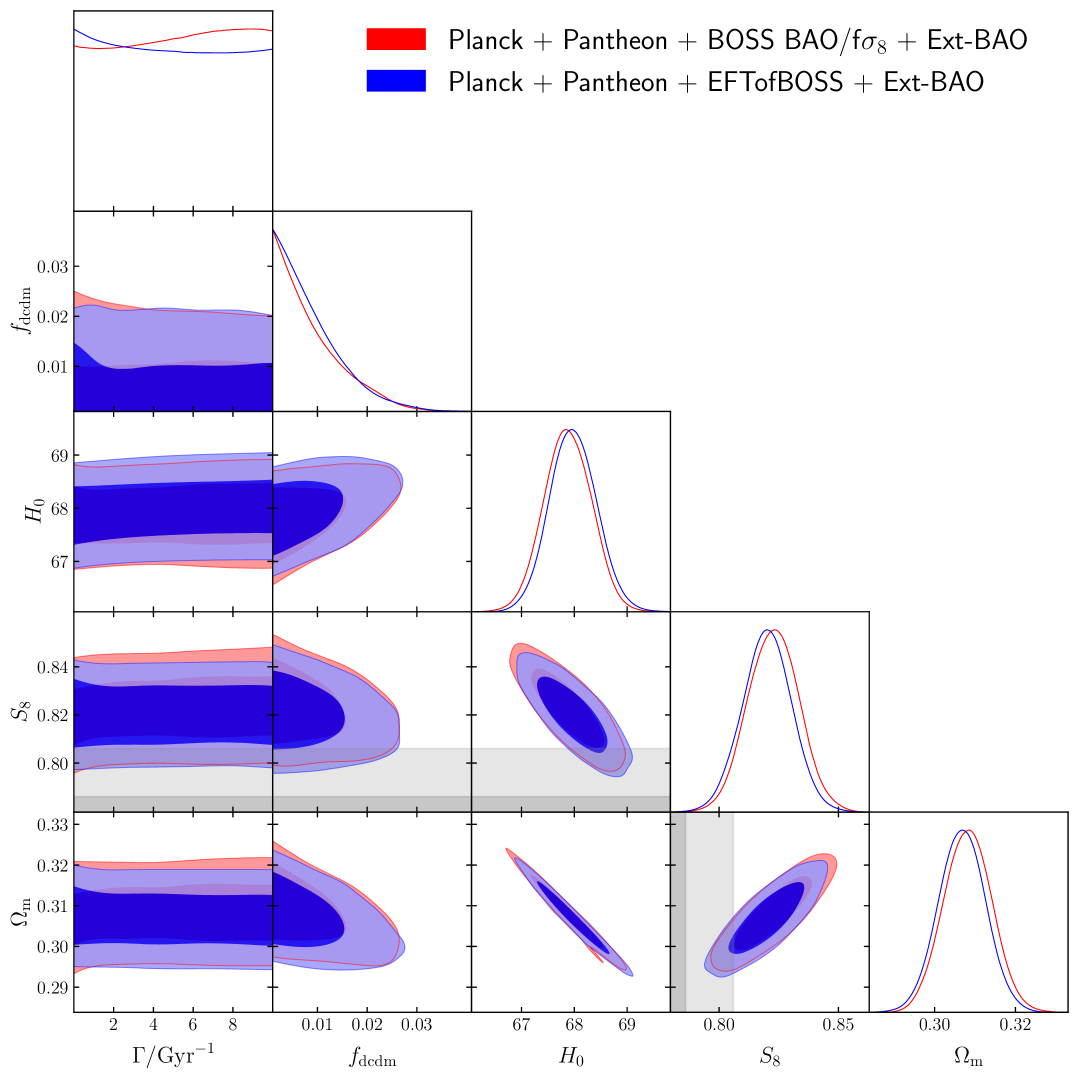
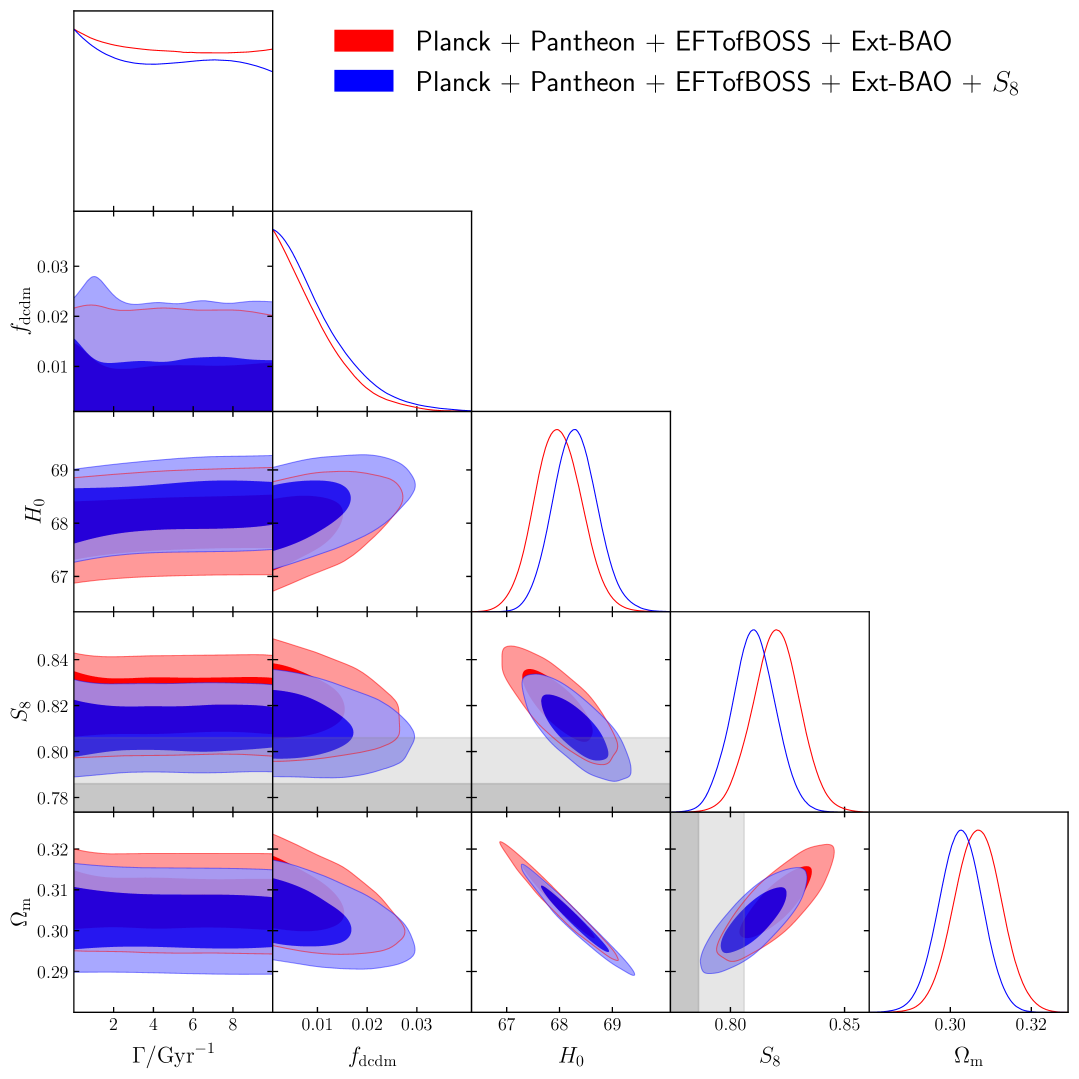
Our results for the analyses with and without prior are presented in Tab. 4, while the results of the analyses of CDM against the same data sets are given in Tab. 3. The of the EFTofBOSS data are reported in Tab. 7. In Fig. 7, we display the 1D and 2D posteriors of for the DCDM DR model with and without the EFTofBOSS data set. In App. C, we represent the same figure, but this time with and without the prior (and with the EFTofBOSS data set for both). Without the prior, the with respect to CDM is compatible with zero131313The improvement is below the precision of that we estimated on the minimization, and we therefore simply quote . Hereinafter, we follow the same approach when reporting other . (see Tab. 4), implying that the data does not favor the DCDM DR model. From Fig. 7, one can see that the inclusion of the EFTofBOSS data does not improve the constraint on this model, which is consistent with the ‘naive’ analysis presented in sec. III.1.3. Moreover, we show that when adding the prior, the with respect to CDM is still compatible with zero (and the model does not provide a good fit to the prior) while the constraints on and are largely unaffected. We conclude (as in past studies) that this model does not resolve the tension.
To summarize our results, and present the most up-to-date constraints on DCDM with massless decay products, in Tab. 5 we compare the 95% C.L. limits obtained for and when successively adding data sets. To obtain the bounds on (in the ‘short-lived’ regime), we marginalize over the parameter in the range described above. On the other hand, to obtain the limits (in the ‘very long-lived’ regime), we fix in our MCMC analyses, i.e. we assume that all DM decays. Note that, for , one can interpret our constraints as a limit on the ratio , as discussed in Ref. Poulin et al. (2016). From Tab. 5, one can deduce:
-
•
The strongest constraints are obtained when considering ‘Planck + Pantheon + BOSS BAO/ + Ext-BAO (no Ly-)’. In that case, we find (in the short-lived regime), and Gyr (for ).
-
•
On the other hand the inclusion of Ly- BAO data slightly reduce the constraints. This is consistent with the fact that these data are compatible with CDM only at the level de Sainte Agathe et al. (2019); Blomqvist et al. (2019), favoring lower energy density at high- Poulin et al. (2018). Additionally, we find that constraints with the EFTofBOSS data are the same as those with the standard redshift space distortion information. Our fiducial constraints, including all data, is therefore , and Gyr.
-
•
Our constraints are somewhat different than those derived in Ref. Nygaard et al. (2020), which considering Planck 2018 + BAO data (see Tab. 2 of this reference) found at 95 % C.L. and Gyr. Our constraints are stronger on , compatible with the fact that we include more data, but weaker on , which may be explained by the fact that their posteriors never quite reach , as necessary to derive constraints in the ‘very long-lived’ regime.
IV.3 Warm Dark Matter decay products
| DCDMWDM+DR | ||
|---|---|---|
| Parameter | w/ EFTofBOSS | w/ EFTofBOSS + |
| unconstrained (-2.98) | ||
| unconstrained (-3.84) | ||
| 3927.0 | 3929.3 | |
| 0.0 | ||
| 1.5 | ||
| CDM | DCDM DR | DCDM WDM+DR | ||||
| w/ EFTofBOSS | w/ EFTofBOSS + | w/ EFTofBOSS | w/ EFTofBOSS + | w/ EFTofBOSS | w/ EFTofBOSS + | |
| 40.3 | 39.2 | 40.4 | 39.2 | 40.2 | 40.8 | |
| 44.0 | 44.3 | 44.0 | 44.3 | 44.1 | 43.8 | |
| 33.5 | 33.5 | 33.5 | 33.5 | 33.5 | 33.7 | |
| 117.8 | 117.0 | 117.9 | 117.0 | 117.8 | 118.3 | |
| p-value | 0.54 | 0.56 | 0.49 | 0.51 | 0.49 | 0.47 |
We now turn to the case of the DCDM WDM+DR model, described by the parameters , the decay rate of DCDM, and , the fraction of DCDM rest mass energy converted into DR. Note that in this section, we trade the density of DM today, , for the initial density of DM (before decays occur) at , . For a stable particle, we simply have as defined previously. In the MCMC analyses, we imposed logarithmic priors141414For discussions about the impact of prior choices, see the appendix of Ref. Abellán et al. (2021) on and , and a flat prior on :
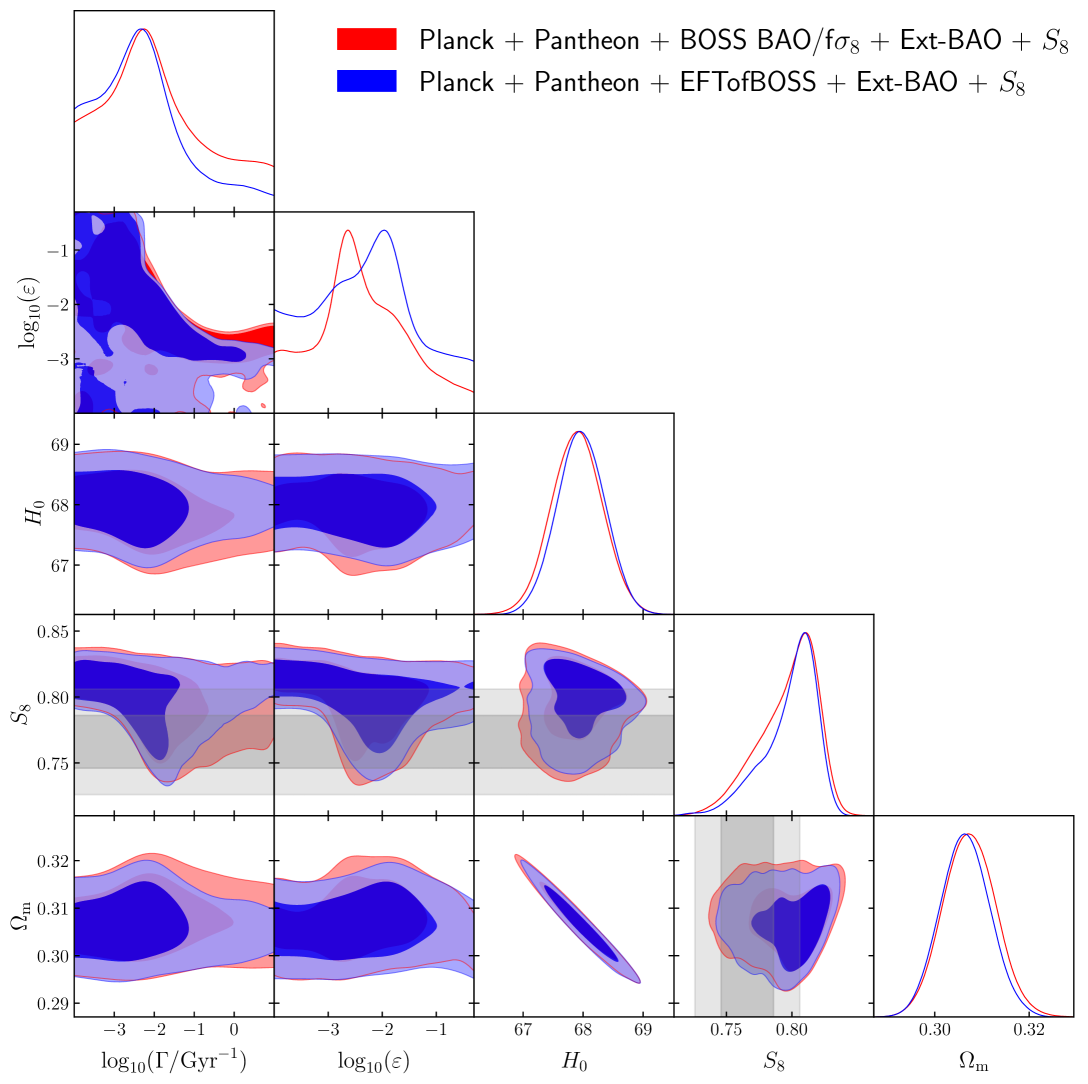
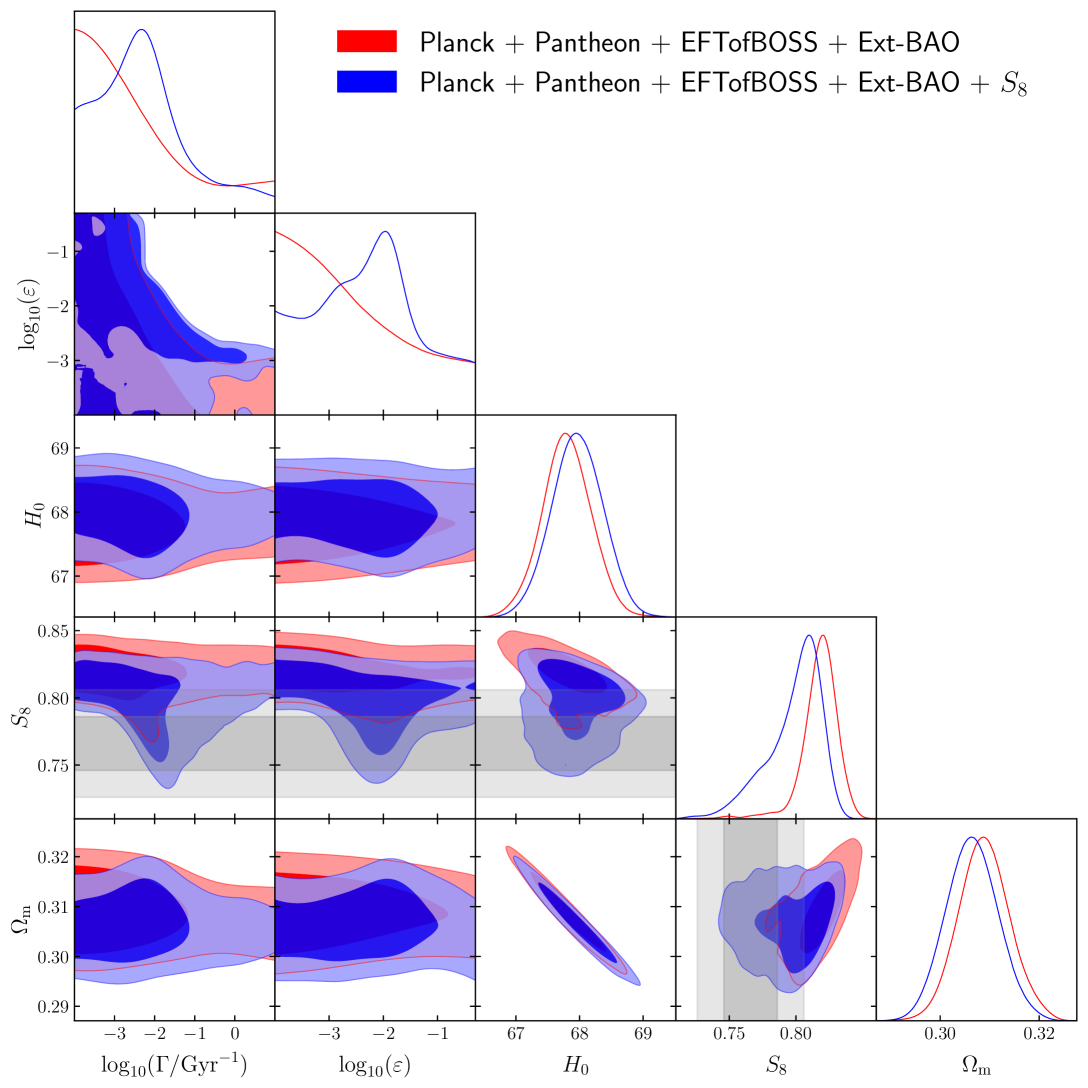
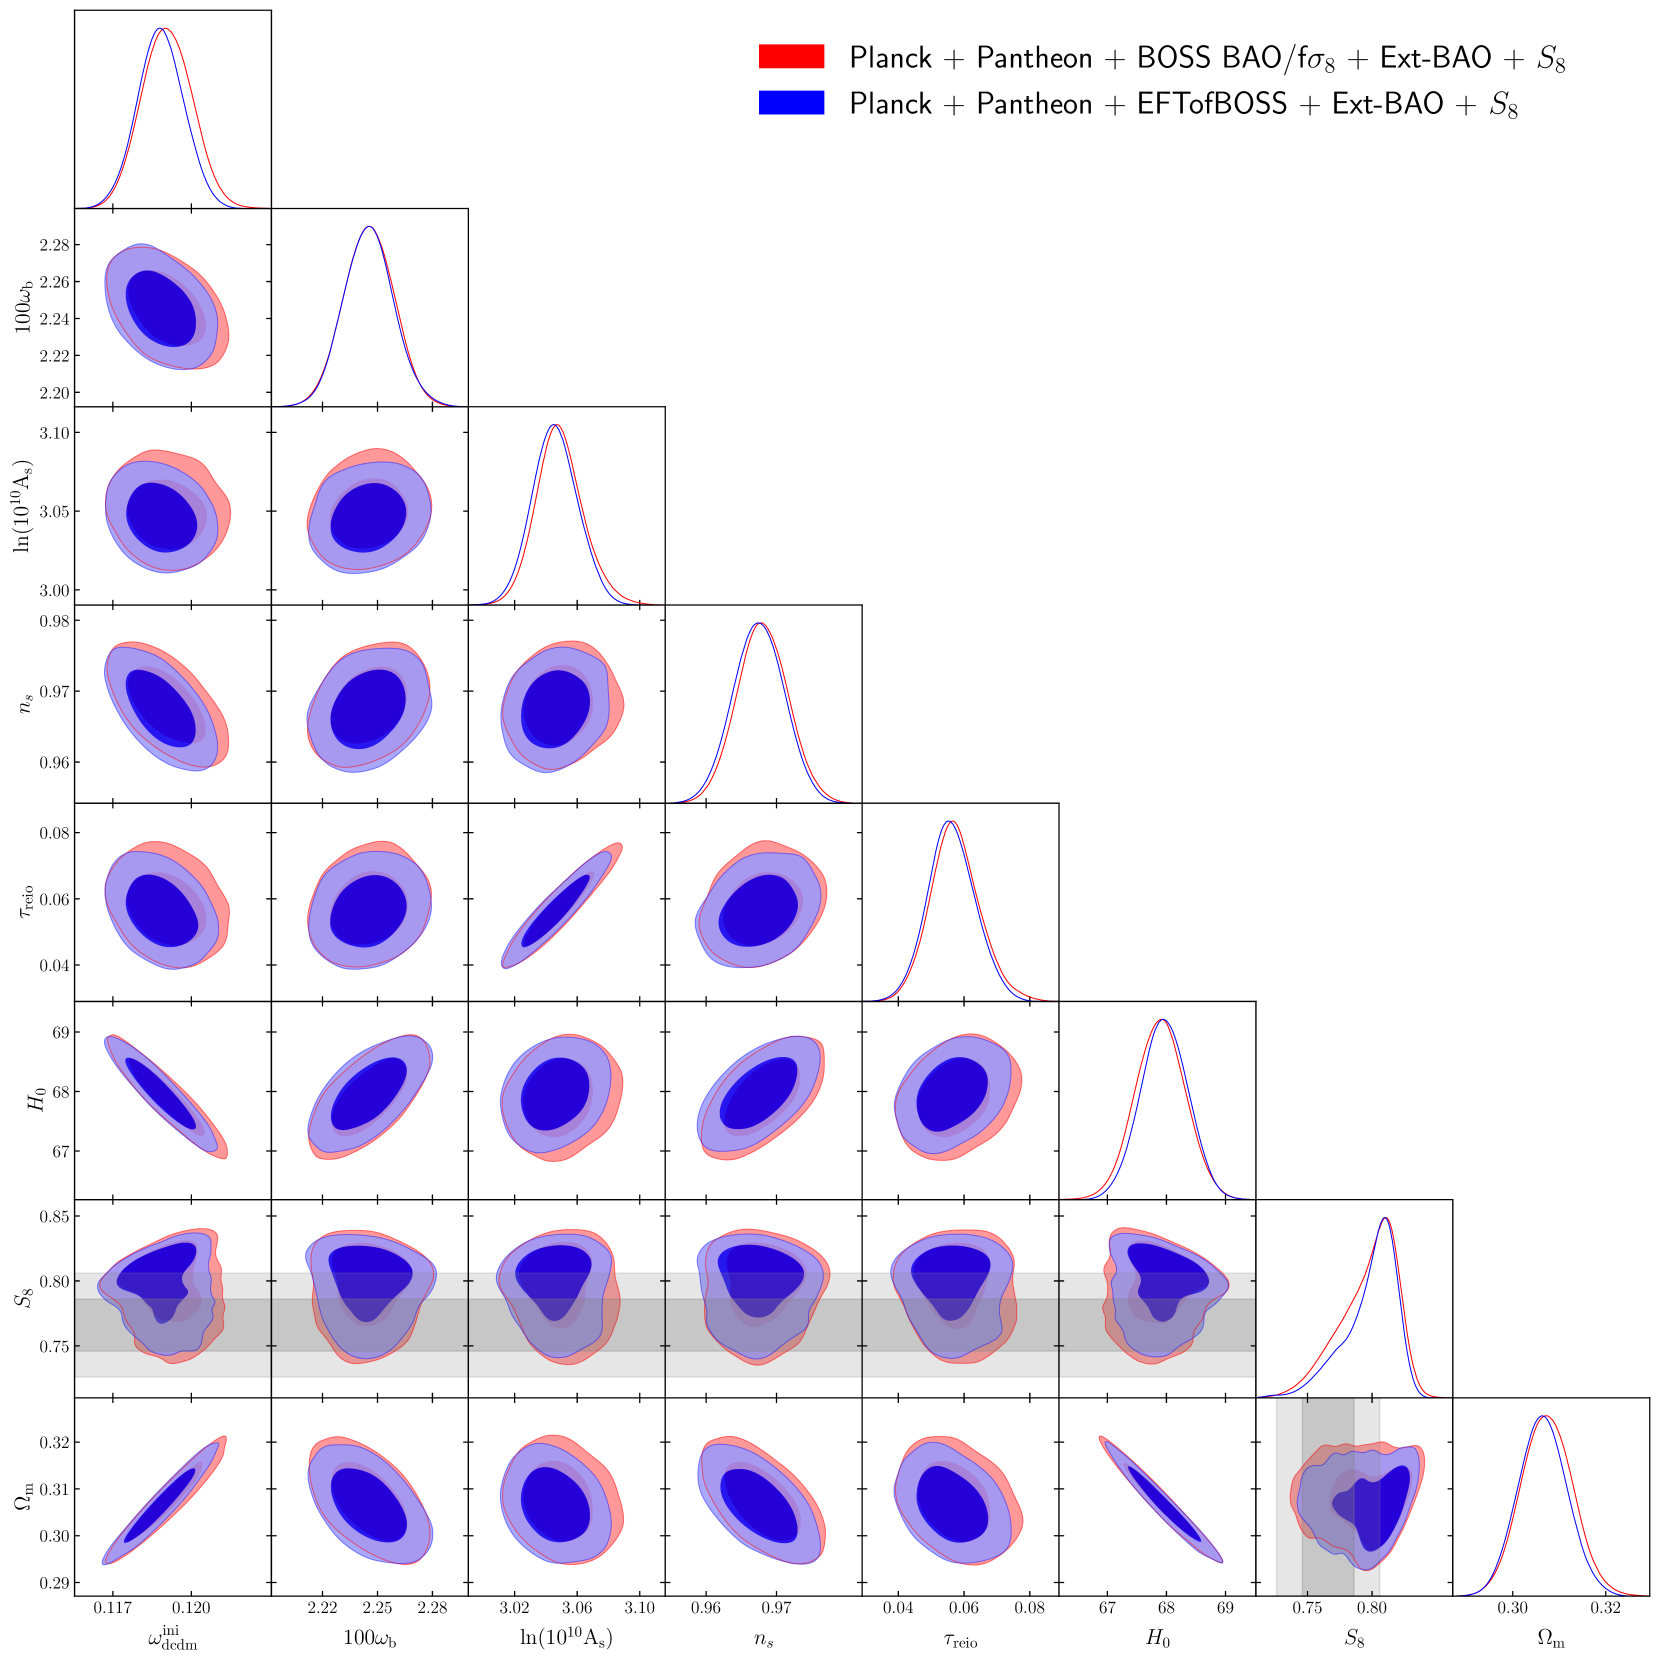
We present our results for the analyses with and without prior in Tab. 6, while the of the EFTofBOSS data of these analysis are reported in Tab. 7. All relevant per experiment are given in App. D. In Fig. 8, we display the 1D and 2D posteriors of for the DCDM WDM+DR model with and without the EFTofBOSS data set, always including the prior. Posteriors without the prior are shown in App. C.
IV.3.1 Estimating the tension with the measurement
Without the prior, the total does not show any improvement (see Tab. 6) and the data do not favor the DCDM WDM+DR model. In fact, in the absence of the prior, it seems that one could derive apparently strong constraints on these models151515In Ref. Abellán et al. (2021), it was shown through a mock data analysis that Planck data alone could not detect the best-fit model required to explain the tension, artificially leading to strong constraints on the DCDM model.. Yet, once the likelihood is included, we find (for 2 extra degrees of freedom) at virtually no cost in for other likelihoods (see App. D): the inclusion of the prior help in opening up the degeneracy with the DCDM parameters, without degrading the fit to the host of cosmological data, as stressed in Refs. Abellan et al. (2020); Abellán et al. (2021).
Nevertheless, the DCDM model is not statistically favored over CDM, as the preference over CDM is currently solely driven by the low prior, for which we have used a value only in mild tension with the CDM prediction161616Different priors would lead to different preferences. The preference could also be made stronger at fixed (see Ref. Abellán et al. (2021)).. We can estimate the residual tension between data sets within the various models by computing the ‘difference in maximum a posterior’ ( statistics Raveri and Hu (2019)) between the obtained with and without the prior. The tension estimator171717In general, is computed as the difference of effective , where is the likelihood evaluated on the maximum a posteriori , between the obtained in the combined analysis and the sum of the obtained in the individual analyses. For Gaussian , it is distributed as a distribution with degrees of freedom (d.o.f.), where refers to the number of d.o.f. in the individual and combined analysis . In the case of the combination of Planck and a Gaussian prior on , it follows a -distribution with one d.o.f., and the tension can be evaluated as . at their MAP point gives in the DCDMWDM+DR model, as compared to in the CDM and DCDMDR models.
IV.3.2 Impact of EFTofBOSS data
Comparing to results without the EFTofBOSS data, for which we get181818This number is different to that quoted in Refs. Abellan et al. (2020); Abellán et al. (2021) because we recall that we make use of a different prior from KiDS-1000 alone, that does not include information from BOSS data and therefore has larger error bars. , we find that the is only mildly degraded by the inclusion of EFTofBOSS data. More precisely, the of the total EFTofBOSS data for the DCDM WDM+DR model, given in Tab. 7, is only slightly larger than that for CDM () despite a much lower (at the best-fit) which yields a very good fit of the KiDS-1000 prior. Comparing to the analysis with the BAO/ measurement from BOSS-DR12 (also presented in App. D), we note that these ‘compressed’ data already showed a minor degradation of compared to CDM (). We conclude that BOSS-DR12 data are in good agreement with the DCDM WDM+DR model, but have a non-negligible impact, as the ‘naive’ analysis presented in sec. III.2.3 suggested.
More precisely, one can see in Fig. 8 that the main impact of EFTofBOSS data is to cut in the degeneracy, excluding too large values of . In App. E we show that including the EFTofBOSS data does not shift the CDM parameters. Therefore, the EFTofLSS significantly improves the constraints on the parameter at :
to be compared with
Additionally, we observe a notable evolution of the DCDM parameters of the best-fit model compared to the analysis without EFTofBOSS (and with the BAO/ measurement from BOSS-DR12 instead): the best-fit model, with the inclusion of the likelihood, now has ( Gyr) and , while previously ( Gyr) and . This means that EFTofBOSS data favors longer lived DM models and therefore a smaller fraction of WDM today compared to previously, but a significantly larger kick velocity (and therefore a larger free-streaming scale).
It is instructive to compare these numbers with recent constraints derived from observations of Milky Way satellites by the DES collaboration Mau et al. (2022). These constraints exclude for . The best-fit model of our EFTofBOSS analysis, and a large fraction of the 68% C.L., lie well within the allowed region, but these observations certainly provide a crucial test of the DCDM cosmology, as a deficit of satellites compared to CDM is expected in this model.
IV.3.3 Towards high-accuracy measurements of the galaxy power spectrum
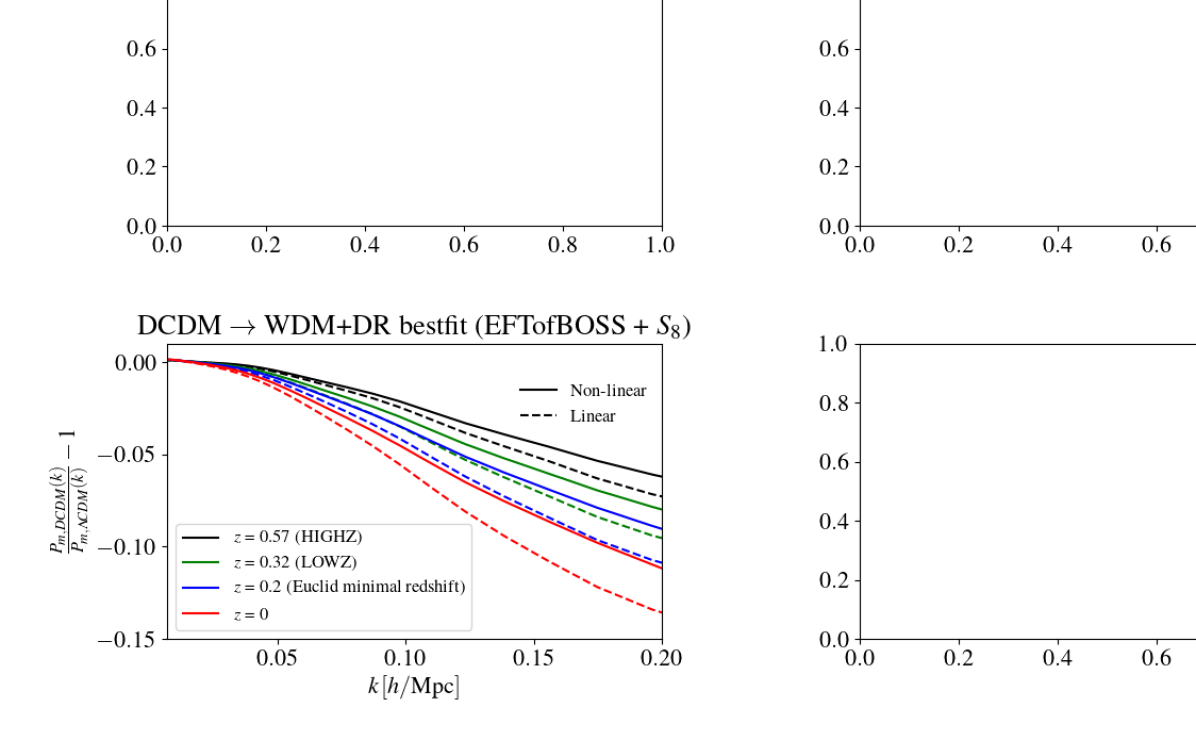
To gauge the importance of future surveys in constraining the DCDM WDM+DR model, we show in Fig. 9 the residuals of the monopoles and quadrupoles of the galaxy power spectrum between the DCDM WDM+DR and CDM models. One can see that there are sub-percent differences between the models that gives us hope to probe the DCDM model further. Indeed, future galaxy clustering power spectrum data with higher precision and measurements at additional redshift bins such as Euclid Amendola et al. (2018), VRO Alonso et al. (2018) and DESI Aghamousa, Amir and others (2016) have an expected sensitivity that should allow us to detect these mild differences. In order to estimate the impact of future observations on the preference of the DCDM WDM+DR model with respect to the CDM model, we plot in Fig. 10 the residuals of the non-linear matter power spectrum191919We set here , which is an effective parameter of the one-loop correction that can be interpreted as the effective sound speed of the dark matter. between the best-fit of the DCDM WDM+DR model (for the ‘EFTofBOSS + ’ analysis) and CDM model (for the ‘EFTofBOSS’ analysis). We represent it for different redshifts, starting at the minimal redshift probed by an experiment like Euclid Amendola et al. (2018). Note that at the level of the non-linear matter power spectrum, the suppression with respect to the CDM model at and corresponding to current observations are more than one order of magnitude stronger than what is seen in the residual of the monopole and quadrupole of the galaxy power spectrum (see Fig. 9). This is due to the impact of the degeneracy between the DCDM parameters and the EFT galaxy bias parameters, which can counteract the effect of the DCDM decay in the galaxy power spectrum. This shows that current theoretical uncertainties associated with galaxy bias parameters limit the ability to use galaxy (clustering) surveys to probe the DCDM model, and represent a potential challenge to fully exploit future surveys. Additionally, we observe that as decreases, the deviation from CDM increases significantly because of the production of WDM through the decay. We keep for future work to check through dedicated forecasts whether accumulation of low redshift data, as well as the reduction of error bars, will allow us to firmly detect or exclude the DCDM WDM+DR model that resolves the tension.
V Conclusions
In this paper, we have confronted two models of DCDM with BOSS DR12 galaxy power spectrum data Alam et al. (2017) as described by the EFTofLSS from Refs. Senatore (2015); Mirbabayi et al. (2015); Angulo et al. (2015); Fujita et al. (2020); Perko et al. (2016); Nadler et al. (2018); D’Amico et al. (2021). We focused first on a model where a fraction of dark matter decays into dark radiation, the DCDM DR model, and second on a model where all the dark matter decays into warm massive particles and dark radiation particles, the DCDM WDM+DR model. The latter model was recently suggested as a possible resolution to the tension, the mismatch between the determination of the parameter from Planck CMB power spectrum Aghanim et al. (2020a) and from weak lensing surveys by KiDS Heymans et al. (2020); Asgari et al. (2021), CFHTLenS Heymans et al. (2013) and DES Abbott et al. (2022). We presented in Sec. III the first calculation of the non-linear (matter and galaxy) power spectra in DCDM models making use of recent progresses in the EFTofLSS. We then confronted in Sec. IV these two models to a compilation of Planck TTTEEE and lensing power spectra, BAO data from BOSS and eBOSS (including Ly- data), uncalibrated luminosity distance to SN1a from the Pantheon catalogue Scolnic et al. (2018), as well as measurements of the monopole and quadrupole of the galaxy power spectrum for three different sky-cut of BOSS-DR12 (see Ref. Zhang et al. (2021)), namely LOWZ NGC, CMASS NGC and CMASS SGC Alam et al. (2017). We compared the use of either the BAO/ from that same release, or the full shape of the galaxy power spectrum. Additionally, we tested the ability of these models to resolve the tension by performing analyses with and without prior on as measured by KiDS Asgari et al. (2021). Our results can be summarized as follows:
-
•
We have derived the most up-to-date bound on the fraction of decaying dark matter , which is now for short-lived DCDM. We have also updated constraints on the lifetime of dark matter for the case where , namely Gyr. However, we have found that the EFTofLSS does not provide significantly better constraints to the cosmological parameters for the DCDM DR model, compared to the use of the standard BAO/ data. In agreement with past studies, we have found that these models do not help neither for the nor for the tension, and the inclusion of EFTofBOSS data doesn’t alter that conclusion.
-
•
The DCDM WDM+DR model can explain the low value measured by KiDS-1000 while preserving the goodness of fit to other data set, including EFTofBOSS data. The residual tension is compared to in the CDM model. Nevertheless, the model is not statistically favored over CDM ( for 2 degrees of freedom, roughly corresponding to ). The inclusion of EFTofBOSS data only marginally affects the preference.
-
•
EFTofBOSS data however do significantly improve the 1- constraint on the DCDM lifetime for the DCDM WDM+DR model, and when combined with the prior, we now obtain compared to without the EFTofBOSS. The constraints on are however slightly weaker than with BAO/ measurements.
-
•
The EFTofBOSS data also affects the best-fit model which, with the inclusion of the likelihood, corresponds to a longer lived DM with Gyr (compared to Gyr previously) and a larger kick velocity (compared to previously).
Looking forward, we expect future galaxy clustering power spectrum data, with higher precision and measurements at additional redshift bins such as Euclid Amendola et al. (2018), VRO Alonso et al. (2018) and DESI Aghamousa, Amir and others (2016), to provide us with exquisite sensitivity to DM decays into an invisible sector whether massive or massless. Moreover, as the error bars decrease, it will likely be necessary to identify and account for the corrections to be made to the EFTofLSS in order to capture all the specific effects of the DCDM WDM+DR model. Following Ref. Senatore and Zaldarriaga (2017) for the case of massive neutrinos, it will be important to determine the one-loop terms and associated counterterms of the mildly non-linear galaxy power spectrum caused by the WDM contribution to the linear matter power spectrum (which we have argued in App. B to likely be small compared to current error bars). We keep for future work to test whether these surveys will be able to firmly detect or exclude the DCDM WDM+DR model that resolves the tension.
Acknowledgements.
The authors are thankful to Pierre Zhang for his precious help with the PyBird code. His explanations and advices were essential to the success of this project. We also warmly thank Zakaria Chacko and Abhish Dev for their contribution in the early stages of this project. This work has been partly supported by the CNRS-IN2P3 grant Dark21. The authors acknowledge the use of computational resources from the Excellence Initiative of Aix-Marseille University (A*MIDEX) of the “Investissements d’Avenir” programme. This project has received support from the European Union’s Horizon 2020 research and innovation program under the Marie Skodowska-Curie grant agreement No 860881-HIDDeN. P.D. is supported in part by Simons Investigator in Physics Award 623940 and NSF award PHY-1915093. Y.T. is supported by the NSF grant PHY-2014165 and PHY-2112540.Appendix A Comparison between the EFTofLSS and N-body methods for the DCDM DR model
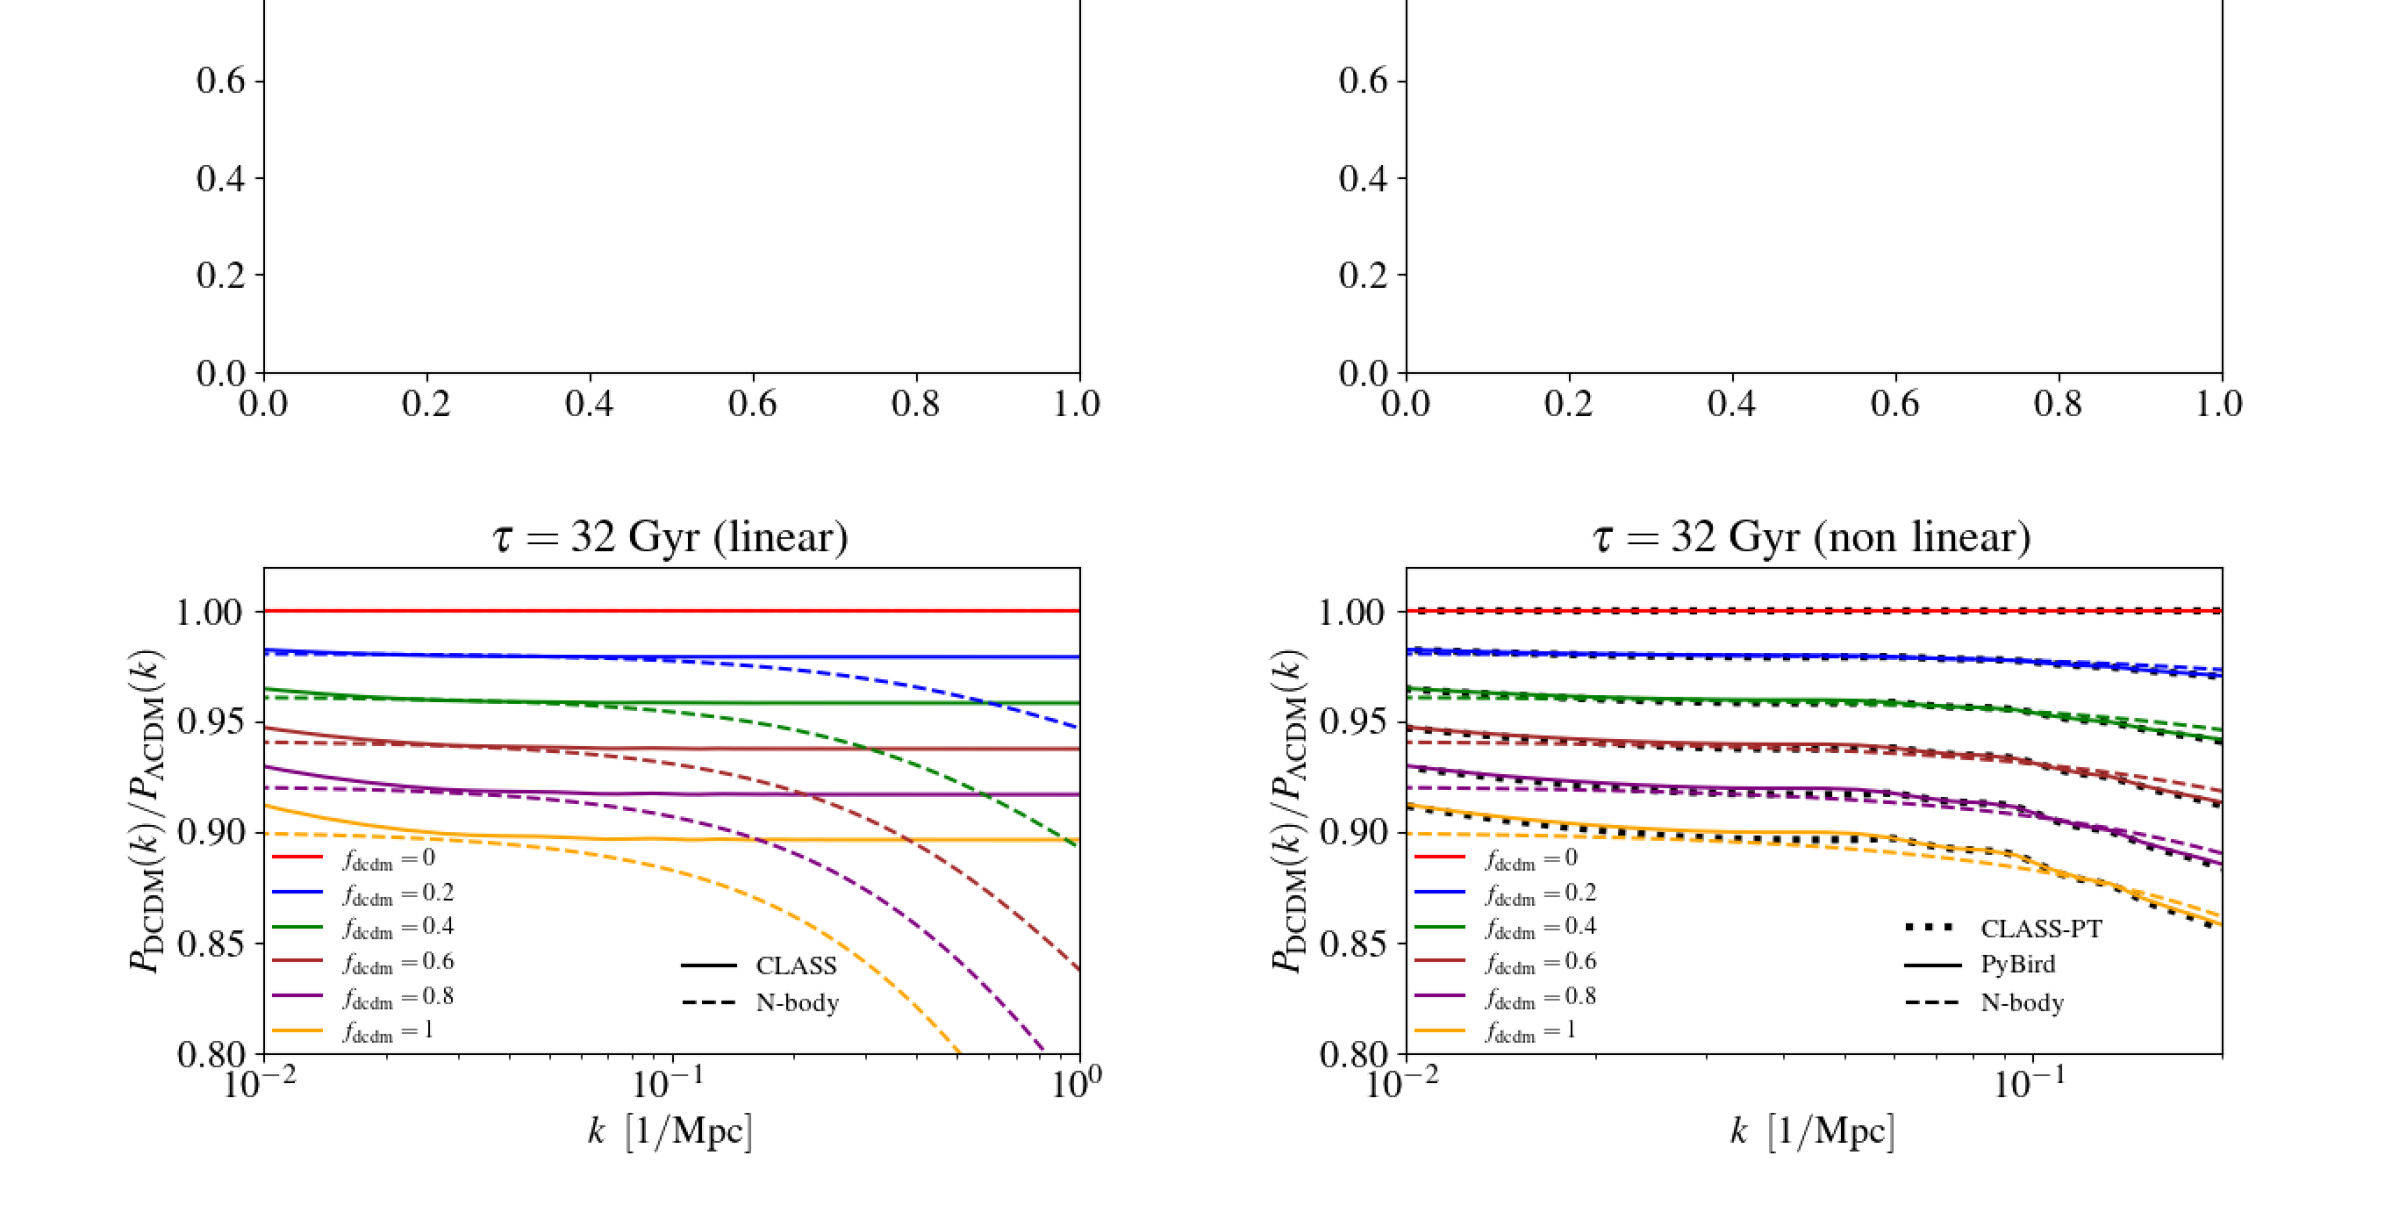
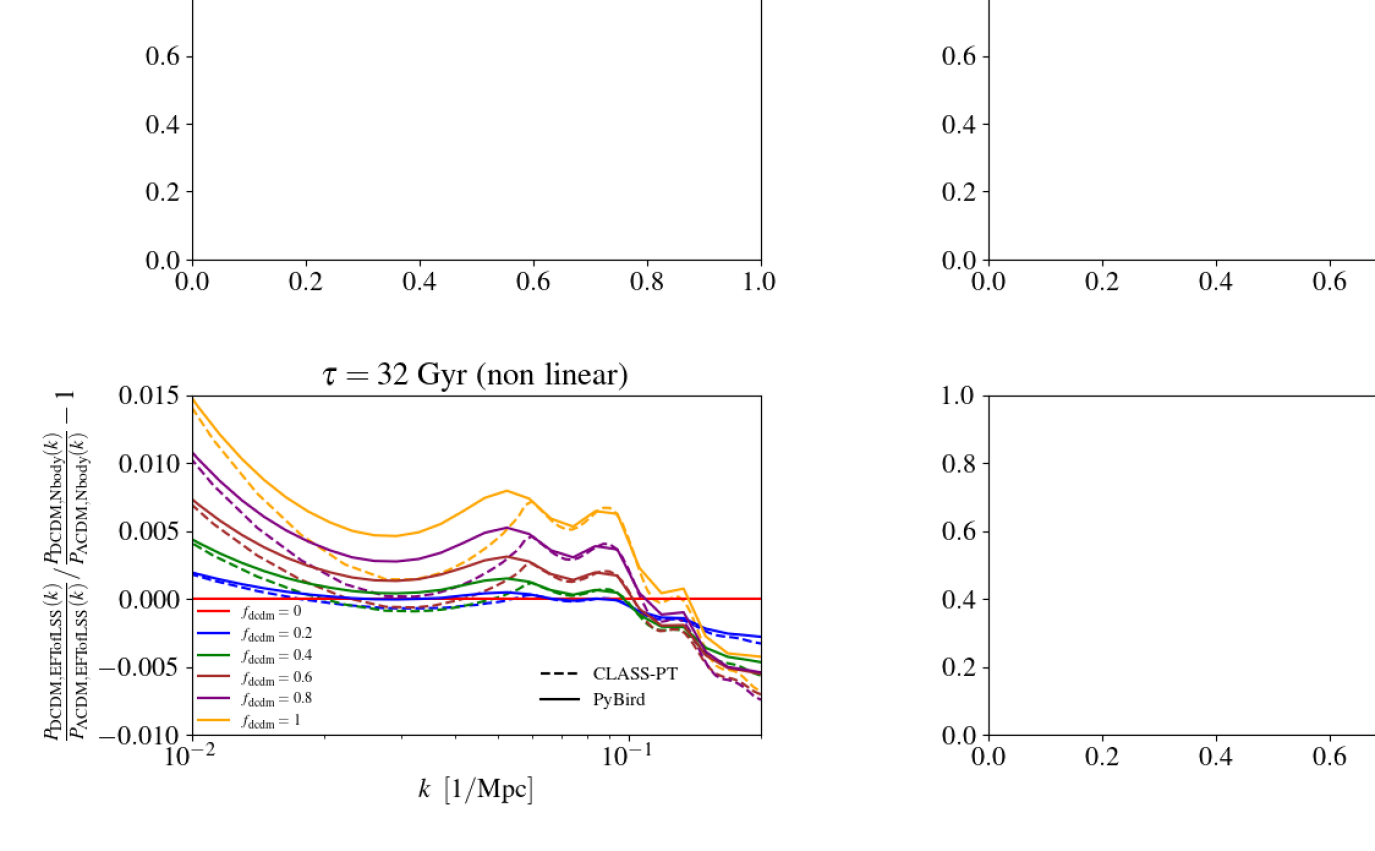
In this appendix, we compare the non-linear matter power spectrum obtained through the EFTofLSS method with the results of dedicated N-body simulations performed in Ref. Hubert et al. (2021). Authors of Ref. Hubert et al. (2021) have determined a fitting formula which describe the correction to the non-linear matter power spectrum due to the DM decay compared to the CDM model, as a function of , , and the redshift . In Fig. 12, we compare this fitting formula, where we set Gyr and and vary , with the linear matter power spectrum of the CLASS code (left panel), and with the non-linear matter power spectra from both the CLASS-PT and PyBird codes (right panel). Here, we set the CDM parameters to the values used in Ref. Hubert et al. (2021). The left panel of this figure is intended as a reproduction of Fig. 1 of this reference for direct comparison, while the right panel presents the comparison of interest. Indeed, from the right panel of Fig. 12, one can clearly see that (i) the CLASS-PT and PyBird codes give very similar power spectra for the DCDM DR model202020We set, in the PyBird and CLASS PT codes, , which is an effective parameter of the one-loop correction that can be interpreted as the effective sound speed of the dark matter., (ii) the deviation from CDM predicted in these two EFTofLSS codes is very close to that obtained through N-body simulation. In order to determine more precisely the deviations between the EFTofLSS and the N-body methods, we plot, in Fig. 12, the ratio between the residuals obtained with the N-Body simulation and those obtained with the CLASS-PT and PyBird codes. One can see that the difference is below the level until (the maximum at which the EFTofLSS is valid at one-loop order for a small ). Let us note that the difference between the N-body simulation and the EFTofLSS power spectrum for is not relevant; it is merely due to the fact that the N-body fitting formula does not encode this behavior for low (see Hubert et al. (2021)), but this -range is well within the linear regime and does not necessitate a correction. Let us also remark that the lower (or the longer ), the smaller the difference between the residuals from the N-body and those from the EFTofLSS method. Since current constraints only allow small values of or large lifetime Gyr, it is safe to use the PyBird (or CLASS-PT) code in their current form to describe the DCDMDR model. This good agreement between the EFT approach and the N-body simulation, despite having made no change to the EFT modelling, may appear surprising at first sight. However, there is a fairly intuitive argument as to why the DM equations (and therefore the EFT formalism) should receive only minor corrections from the presence of a non-zero decay term. This is because, in the synchronous gauge at linear order, the DCDM equations are strictly identical to that of CDM: the effect of the decay is happening exactly at the same rate everywhere in space, and therefore cancels out of the perturbed continuity and Euler equations which drive the DCDM perturbed dynamics. Although strictly speaking, the contribution of the decay term may appear at higher order, as we treat the mildly non-linear regime, it will be sub-dominant. This explains why we find such a good agreement between N-body simulations and the EFT computation despite not modifying the master equations, the expansion nor the counterterms. Note that this argument is valid irrespective of the mass of the daughter particles as far as the mother particle is concerned. Similarly, corrections to the massless daughter equations may appear, but will likely have only a small impact on the observables given that the massless daughter quickly redshift away compared to other species for decays happening at late-times (at times relevant for galaxy surveys).
Appendix B Assessing the validity of the EFTofLSS in the DCDM WDM+DR model
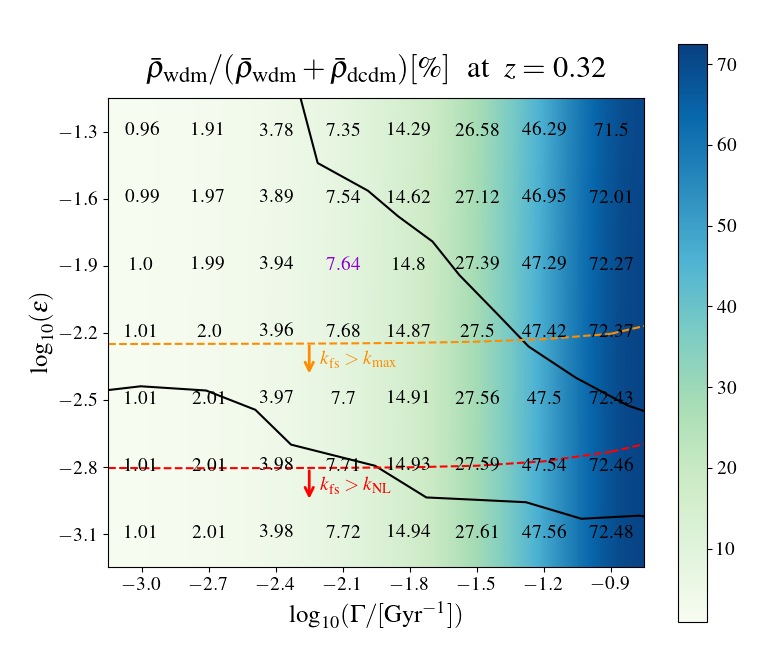
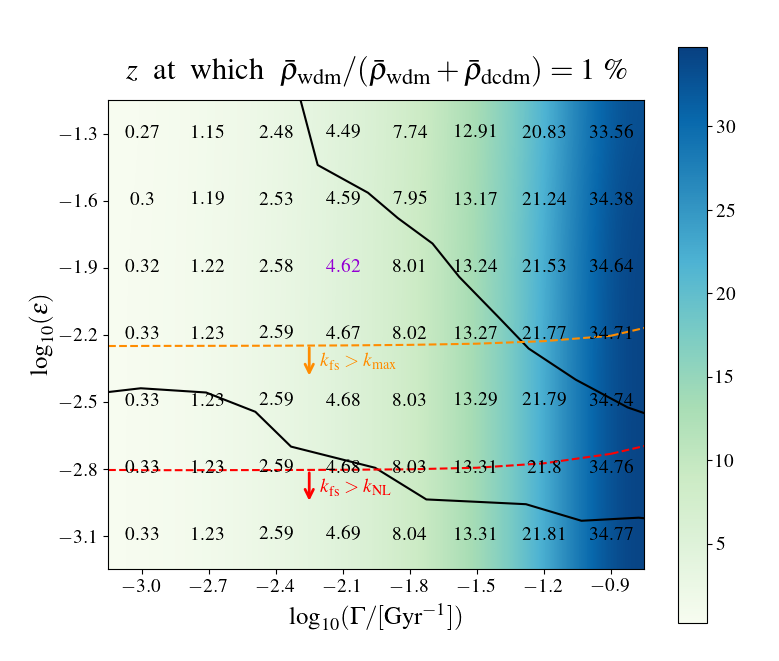
In this appendix, we discuss the validity of the EFTofLSS in the DCDM WDM+DR model. In Ref. Senatore and Zaldarriaga (2017), the EFTofLSS was extended to describe massive neutrinos, an extension to CDM with properties similar to that of the DCDMWDM+DR model. Indeed, the main issue with employing the EFTofLSS to describe the DCDMWDM+DR model does not lie in the effect of the decay itself (the effect of the decay on the perturbed equations of the DCDM is identical to that of the DCDM DR model, which is captured by our formalism as discussed in App. A), but rather in the production of a warm massive species which may contribute in a non-trivial way to the power spectrum of galaxies. At the linear level, it was found the massive decay products behave similarly to CDM at wavenumbers smaller than the free-streaming scale (with approximately given by Eq. 26), but is strongly suppressed due to pressure terms at larger wavenumbers similarly to WDM and hot DM such as neutrinos. In Ref. Senatore and Zaldarriaga (2017), the contribution of neutrinos to the total one loop power spectrum was computed, and it was found that the dominant effect is a correction to the dark matter power spectrum that scales like , where , at and roughly half of that at . The naive contribution is enhanced by twice the logarithm of the redshift of matter-radiation equality, as neutrinos are present from early times. The log-enhanced contribution represents about of the contribution to the total one loop power spectrum. Additionally, at leading order, counter-terms can be captured by simply re-scaling the effective DM sound speed and do not necessitate adding new parameters to the dark-matter-only calculation. In the case of the DCDM model, the WDM is produced at much later times. We plot in Fig. 13 (right panel) the redshift at which the WDM contribution reaches . We also represent the limit at 68% C.L. derived in our work. For the best-fit model (shown in purple in the figure), . The log-enhancement from the ratio of scale factor between and is compared to the in the neutrino study in Ref. Senatore and Zaldarriaga (2017) that gives the factor. We therefore expect the WDM correction to be comparable to the massive neutrino case even if the energy density (today) ratio is times larger than neutrinos.
We plot in Fig. 13 left panel, the fractional contribution of WDM at (the effective redshift of the low-z surveys) as a function of and . We also represent the limit at 68% C.L. derived in this work. One can see that it is under as long as . Additionally, we show the value of for which the free-streaming scale is equal to the maximum mode relevant for our analysis of BOSS data () and the maximum scale considered in the EFT computation (). In a large part of the parameter space favored by our analysis for which is not small, exceeds and therefore corrections should also be minor. An improved EFT treatment including the effect of the massive decay product would be necessary however to describe the power spectrum up to . Given current precision of the data and the large theoretical uncertainty already present, the corrections to our calculation should be negligible, but more work needs to be done to accurately describe the part of the parameter space with large (and leading to large ), in particular for future surveys which can reach sub-percent precision at larger wave-numbers.
Appendix C The role of the prior
In this appendix, we present 2D posterior distributions obtained with and without the prior (but with the EFTofBOSS data) in both DCDM cosmologies. In the case of the DCDM DR model, represented in Fig. 14, the impact of the prior is minor. However, in the case of the DCDM WDM+DR model, represented in Fig. 15, it opens up a degeneracy with which can lead to low while preserving the fit to other data sets. Without the prior, the DCDM model is not favored by Planck data. As discussed in the main text, when the prior is included, the fit to Planck data is not affected, while the DCDM model can accommodate the lower value, contrarily to the CDM model. From the statistics Raveri and Hu (2019), we can estimate the residual tension as in the DCDMWDM+DR model, as compared to in the CDM model and DCDMDR model.
Appendix D Supplementary tables of values per experiment
In this appendix, we report the best-fit per experiment for both CDM (Tab. 8) and DCDM WDM+DR (Tab. 9) models for our analyses with the ‘BAO/ + ’, ‘EFTofBOSS’ and ‘EFTofBOSS + ’ data. To help the reader gauge the goodness of fit, the number of d.o.f. is estimated to be 2287 for Planck high- TTTEEE, 25 for Planck low- EE, and 25 for Planck low- TT Aghanim et al. (2020a). Other experiments do not report the number of degrees of freedom, but it can be estimated from the number of data points , assuming uncorrelated data-points for simplicity, and the number of free parameters , as . In practice, we have and for Pantheon Scolnic et al. (2018), and for the sum of the 3 sky-cuts of the EFTofBOSS data including BAO, and for the BOSS BAO/ and Ext-BAO (the full BAO data set). Finally, we have for each model and .
| CDM | |||
|---|---|---|---|
| Data set | w/ BAO/ + | w/ EFTofBOSS | w/ EFTofBOSS + |
| Planck high- TTTEEE | 2349.0 | 2347.4 | 2349.3 |
| Planck low- EE | 396.1 | 396.7 | 396.1 |
| Planck low- TT | 22.8 | 23.0 | 22.7 |
| Planck lensing | 9.6 | 8.9 | 9.6 |
| Pantheon | 1027.0 | 1027.1 | 1027.0 |
| Ext-BAO | 6.3 | 6.2 | 6.3 |
| BOSS BAO/ | 6.0 | ||
| EFTofBOSS | 117.8 | 117.0 | |
| 5.3 | 5.0 | ||
| total | 3821.9 | 3927.0 | 3933.0 |
| DCDMWDM+DR | |||
|---|---|---|---|
| Data set | w/ BAO/ + | w/ EFTofBOSS | w/ EFTofBOSS + |
| Planck high- TTTEEE | 2347.7 | 2347.3 | 2348.0 |
| Planck low- EE | 397.2 | 396.9 | 397.0 |
| Planck low- TT | 23.1 | 23.0 | 23.2 |
| Planck lensing | 8.9 | 8.9 | 9.1 |
| Pantheon | 1027.2 | 1027.1 | 1027.2 |
| Ext-BAO | 6.1 | 6.2 | 6.2 |
| BOSS BAO/ | 7.1 | ||
| EFTofBOSS | 117.8 | 118.3 | |
| 0.2 | 0.4 | ||
| total | 3817.5 | 3927.0 | 3929.2 |
Appendix E CDM parameters of the DCDM WDM+DR model
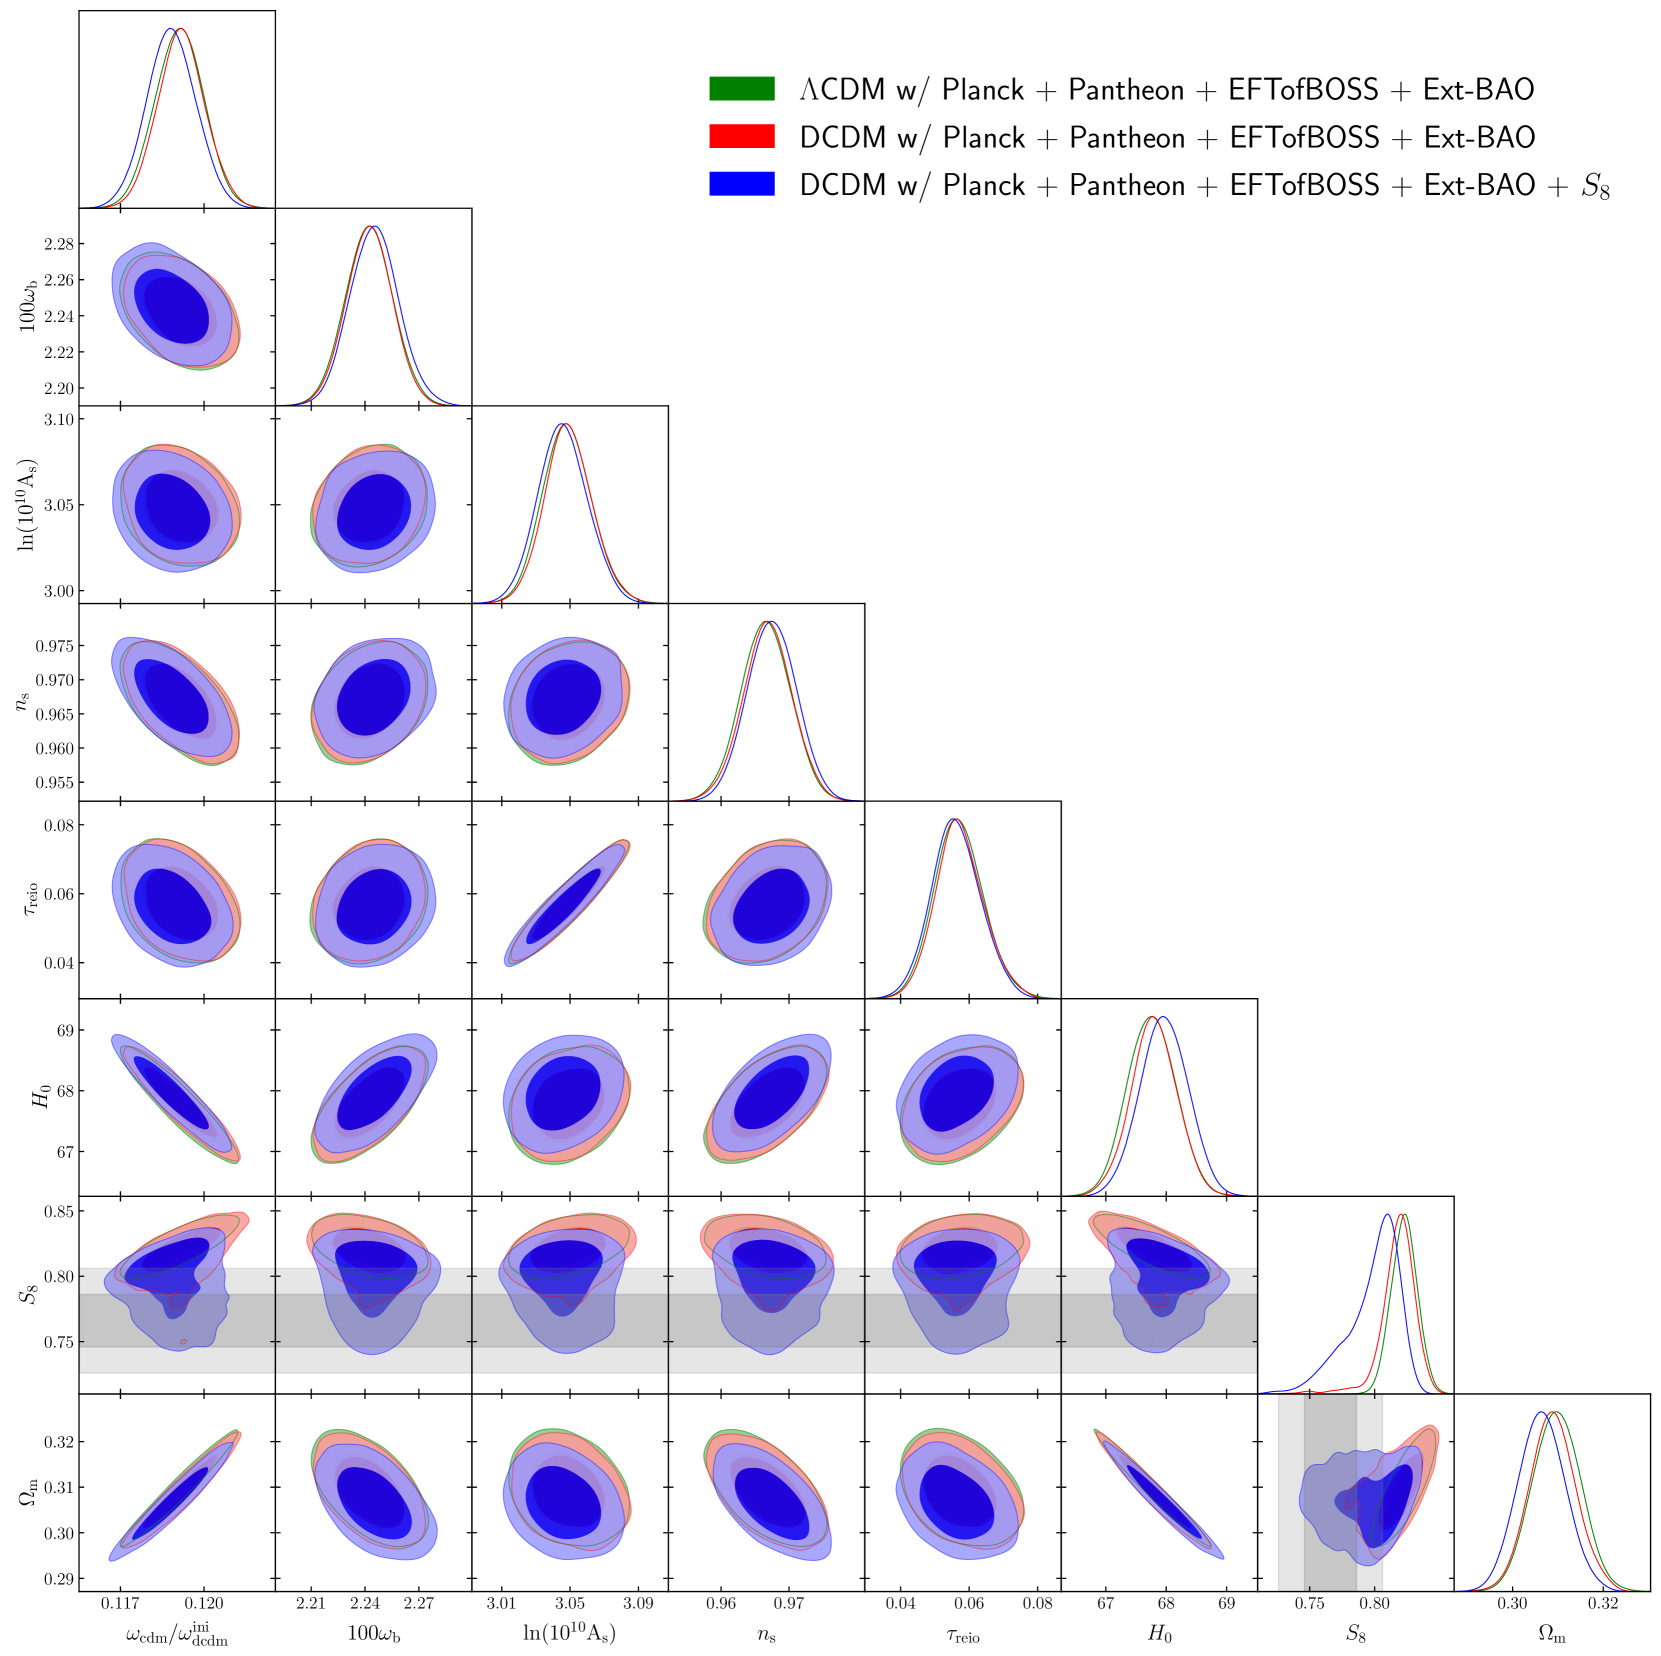
In this appendix, we compare in Fig. 16 the CDM parameters of the DCDM WDM+DR model obtained from the analyses with (blue) and without (red) the EFTofBOSS data, while in Fig. 17 we represent the CDM parameters reconstructed from an analysis of Planck, Pantheon, Ext-BAO and EFTofBOSS data, with (blue) and without (red) the prior. We also show in this second figure the standard CDM posteriors as a reference (green). One can see that the CDM parameters are left largely unchanged in the DCDM WDM+DR model. The decay into warm products only affect the growth of structure at late-times with little impact on parameters that could affect early time physics. This is essentially why cosmological data other than those measuring (and potentially the growth of structure at late-times) are unaffected by the DCDM, despite a lower value.
References
- Verde et al. (2019) L. Verde, T. Treu, and A. G. Riess, “Tensions between the early and the late universe,” in Nature Astronomy 2019 (2019) 1907.10625 .
- Riess et al. (2021) Adam G. Riess et al., “A Comprehensive Measurement of the Local Value of the Hubble Constant with 1 km/s/Mpc Uncertainty from the Hubble Space Telescope and the SH0ES Team,” (2021), arXiv:2112.04510 [astro-ph.CO] .
- Aghanim et al. (2020a) N. Aghanim et al. (Planck), “Planck 2018 results,” Astron. Astrophys. 641, A6 (2020a), 1807.06209 .
- Leauthaud et al. (2017) Alexie Leauthaud et al., “Lensing is Low: Cosmology, Galaxy Formation, or New Physics?” Mon. Not. Roy. Astron. Soc. 467, 3024–3047 (2017), arXiv:1611.08606 [astro-ph.CO] .
- Lange et al. (2021) Johannes U. Lange, Alexie Leauthaud, Sukhdeep Singh, Hong Guo, Rongpu Zhou, Tristan L. Smith, and Francis-Yan Cyr-Racine, “On the halo-mass and radial scale dependence of the lensing is low effect,” Mon. Not. Roy. Astron. Soc. 502, 2074–2086 (2021), arXiv:2011.02377 [astro-ph.CO] .
- Amon et al. (2022) A. Amon et al., “Consistent lensing and clustering in a low- Universe with BOSS, DES Year 3, HSC Year 1 and KiDS-1000,” (2022), arXiv:2202.07440 [astro-ph.CO] .
- Asgari et al. (2021) Marika Asgari et al. (KiDS), “KiDS-1000 Cosmology: Cosmic shear constraints and comparison between two point statistics,” Astron. Astrophys. 645, A104 (2021), arXiv:2007.15633 [astro-ph.CO] .
- Abbott et al. (2022) T. M. C. Abbott et al. (DES), “Dark Energy Survey Year 3 results: Cosmological constraints from galaxy clustering and weak lensing,” Phys. Rev. D 105, 023520 (2022), arXiv:2105.13549 [astro-ph.CO] .
- Hikage et al. (2019) Chiaki Hikage et al. (HSC), “Cosmology from cosmic shear power spectra with Subaru Hyper Suprime-Cam first-year data,” Publ. Astron. Soc. Jap. 71, 43 (2019), arXiv:1809.09148 [astro-ph.CO] .
- Aiola et al. (2020) Simone Aiola et al. (ACT), “The Atacama Cosmology Telescope: DR4 Maps and Cosmological Parameters,” JCAP 12, 047 (2020), arXiv:2007.07288 [astro-ph.CO] .
- Freedman (2021) Wendy L. Freedman, “Measurements of the Hubble Constant: Tensions in Perspective,” Astrophys. J. 919, 16 (2021), arXiv:2106.15656 [astro-ph.CO] .
- Farren et al. (2022) Gerrit S. Farren, Oliver H. E. Philcox, and Blake D. Sherwin, “Determining the hubble constant without the sound horizon: Perspectives with future galaxy surveys,” Physical Review D 105 (2022), 10.1103/physrevd.105.063503.
- Philcox et al. (2022) Oliver H. E. Philcox, Gerrit S. Farren, Blake D. Sherwin, Eric J. Baxter, and Dillon J. Brout, “Determining the hubble constant without the sound horizon: A constraint on from galaxy surveys, cmb lensing and supernovae,” (2022).
- Bernal et al. (2016) Jose Luis Bernal, Licia Verde, and Adam G. Riess, “The trouble with H0,” JCAP 10, 019 (2016), 1607.05617 .
- Aylor et al. (2019) Kevin Aylor, MacKenzie Joy, Lloyd Knox, Marius Millea, Srinivasan Raghunathan, and W.L. Kimmy Wu, “Sounds Discordant: Classical Distance Ladder & CDM -based Determinations of the Cosmological Sound Horizon,” Astrophys. J. 874, 4 (2019), 1811.00537 .
- Knox and Millea (2019) Lloyd Knox and Marius Millea, “Hubble constant hunter’s guide,” (2019), 1908.03663 .
- Camarena, David and Marra, Valerio (2021) Camarena, David and Marra, Valerio, “On the use of the local prior on the absolute magnitude of type ia supernovae in cosmological inference,” (2021), 10.1093/mnras/stab1200, 2101.08641 .
- Efstathiou (2021) George Efstathiou, “To H0 or not to H0?” Mon. Not. Roy. Astron. Soc. 505, 3866–3872 (2021), arXiv:2103.08723 [astro-ph.CO] .
- Schöneberg et al. (2021) Nils Schöneberg, Guillermo Franco Abellán, Andrea Pérez Sánchez, Samuel J. Witte, Vivian Poulin, and Julien Lesgourgues, “The Olympics: A fair ranking of proposed models,” (2021), arXiv:2107.10291 [astro-ph.CO] .
- Kreisch et al. (2020) Christina D. Kreisch, Francis-Yan Cyr-Racine, and Olivier Doré, “Neutrino puzzle: Anomalies, interactions, and cosmological tensions,” Phys. Rev. D 101, 123505 (2020), arXiv:1902.00534 [astro-ph.CO] .
- Berbig et al. (2020) Maximilian Berbig, Sudip Jana, and Andreas Trautner, “The Hubble tension and a renormalizable model of gauged neutrino self-interactions,” Phys. Rev. D 102, 115008 (2020), arXiv:2004.13039 [hep-ph] .
- Ghosh et al. (2020) Subhajit Ghosh, Rishi Khatri, and Tuhin S. Roy, “Can dark neutrino interactions phase out the Hubble tension?” Phys. Rev. D 102, 123544 (2020), arXiv:1908.09843 [hep-ph] .
- Forastieri et al. (2019) Francesco Forastieri, Massimiliano Lattanzi, and Paolo Natoli, “Cosmological constraints on neutrino self-interactions with a light mediator,” Phys. Rev. D 100, 103526 (2019), arXiv:1904.07810 [astro-ph.CO] .
- Escudero and Witte (2020) Miguel Escudero and Samuel J. Witte, “A CMB search for the neutrino mass mechanism and its relation to the Hubble tension,” Eur. Phys. J. C 80, 294 (2020), arXiv:1909.04044 [astro-ph.CO] .
- Escudero and Witte (2021) Miguel Escudero and Samuel J. Witte, “The hubble tension as a hint of leptogenesis and neutrino mass generation,” Eur. Phys. J. C 81, 515 (2021), arXiv:2103.03249 [hep-ph] .
- Blinov and Marques-Tavares (2020) Nikita Blinov and Gustavo Marques-Tavares, “Interacting radiation after Planck and its implications for the Hubble Tension,” JCAP 09, 029 (2020), arXiv:2003.08387 [astro-ph.CO] .
- Ghosh et al. (2021) Subhajit Ghosh, Soubhik Kumar, and Yuhsin Tsai, “Free-streaming and Coupled Dark Radiation Isocurvature Perturbations: Constraints and Application to the Hubble Tension,” (2021), arXiv:2107.09076 [astro-ph.CO] .
- Archidiacono and Gariazzo (2022) Maria Archidiacono and Stefano Gariazzo, “Two sides of the same coin: sterile neutrinos and dark radiation. Status and perspectives,” (2022), arXiv:2201.10319 [hep-ph] .
- Aloni et al. (2021) Daniel Aloni, Asher Berlin, Melissa Joseph, Martin Schmaltz, and Neal Weiner, “A Step in Understanding the Hubble Tension,” (2021), arXiv:2111.00014 [astro-ph.CO] .
- Karwal and Kamionkowski (2016) Tanvi Karwal and Marc Kamionkowski, “Dark energy at early times, the Hubble parameter, and the string axiverse,” Phys. Rev. D 94, 103523 (2016), arXiv:1608.01309 [astro-ph.CO] .
- Poulin et al. (2019) Vivian Poulin, Tristan L. Smith, Tanvi Karwal, and Marc Kamionkowski, “Early dark energy can resolve the hubble tension,” Phys. Rev. Lett. 122, 221301 (2019), 1811.04083 .
- Smith et al. (2020) Tristan L. Smith, Vivian Poulin, and Mustafa A. Amin, “Oscillating scalar fields and the Hubble tension: a resolution with novel signatures,” Phys. Rev. D 101, 063523 (2020), arXiv:1908.06995 [astro-ph.CO] .
- Niedermann and Sloth (2021) Florian Niedermann and Martin S. Sloth, “New early dark energy,” Phys. Rev. D 103, L041303 (2021), arXiv:1910.10739 [astro-ph.CO] .
- Niedermann and Sloth (2020) Florian Niedermann and Martin S. Sloth, “Resolving the Hubble tension with new early dark energy,” Phys. Rev. D 102, 063527 (2020), arXiv:2006.06686 [astro-ph.CO] .
- Ye and Piao (2020) Gen Ye and Yun-Song Piao, “Is the Hubble tension a hint of AdS phase around recombination?” Phys. Rev. D 101, 083507 (2020), arXiv:2001.02451 [astro-ph.CO] .
- Renk et al. (2017) Janina Renk, Miguel Zumalacárregui, Francesco Montanari, and Alexandre Barreira, “Galileon gravity in light of ISW, CMB, BAO and H0 data,” JCAP 10, 020 (2017), arXiv:1707.02263 [astro-ph.CO] .
- Umiltà et al. (2015) C. Umiltà, M. Ballardini, F. Finelli, and D. Paoletti, “CMB and BAO constraints for an induced gravity dark energy model with a quartic potential,” JCAP 08, 017 (2015), arXiv:1507.00718 [astro-ph.CO] .
- Ballardini et al. (2016) Mario Ballardini, Fabio Finelli, Caterina Umiltà, and Daniela Paoletti, “Cosmological constraints on induced gravity dark energy models,” JCAP 05, 067 (2016), arXiv:1601.03387 [astro-ph.CO] .
- Rossi et al. (2019) Massimo Rossi, Mario Ballardini, Matteo Braglia, Fabio Finelli, Daniela Paoletti, Alexei A. Starobinsky, and Caterina Umiltà, “Cosmological constraints on post-Newtonian parameters in effectively massless scalar-tensor theories of gravity,” Phys. Rev. D 100, 103524 (2019), arXiv:1906.10218 [astro-ph.CO] .
- Braglia et al. (2020a) Matteo Braglia, Mario Ballardini, William T. Emond, Fabio Finelli, A. Emir Gumrukcuoglu, Kazuya Koyama, and Daniela Paoletti, “Larger value for by an evolving gravitational constant,” Phys. Rev. D 102, 023529 (2020a), arXiv:2004.11161 [astro-ph.CO] .
- Zumalacarregui (2020) Miguel Zumalacarregui, “Gravity in the Era of Equality: Towards solutions to the Hubble problem without fine-tuned initial conditions,” Phys. Rev. D 102, 023523 (2020), arXiv:2003.06396 [astro-ph.CO] .
- Abadi and Kovetz (2021) Tal Abadi and Ely D. Kovetz, “Can conformally coupled modified gravity solve the Hubble tension?” Phys. Rev. D 103, 023530 (2021), arXiv:2011.13853 [astro-ph.CO] .
- Ballardini et al. (2020) Mario Ballardini, Matteo Braglia, Fabio Finelli, Daniela Paoletti, Alexei A. Starobinsky, and Caterina Umiltà, “Scalar-tensor theories of gravity, neutrino physics, and the tension,” JCAP 10, 044 (2020), arXiv:2004.14349 [astro-ph.CO] .
- Braglia et al. (2020b) Matteo Braglia, William T. Emond, Fabio Finelli, A. Emir Gumrukcuoglu, and Kazuya Koyama, “Unified framework for early dark energy from -attractors,” Phys. Rev. D 102, 083513 (2020b), arXiv:2005.14053 [astro-ph.CO] .
- Di Valentino et al. (2016) Eleonora Di Valentino, Alessandro Melchiorri, and Joseph Silk, “Cosmological hints of modified gravity?” Phys. Rev. D 93, 023513 (2016), arXiv:1509.07501 [astro-ph.CO] .
- Bahamonde et al. (2021) Sebastian Bahamonde, Konstantinos F. Dialektopoulos, Celia Escamilla-Rivera, Gabriel Farrugia, Viktor Gakis, Martin Hendry, Manuel Hohmann, Jackson Levi Said, Jurgen Mifsud, and Eleonora Di Valentino, “Teleparallel Gravity: From Theory to Cosmology,” (2021), arXiv:2106.13793 [gr-qc] .
- Raveri (2020) Marco Raveri, “Reconstructing Gravity on Cosmological Scales,” Phys. Rev. D 101, 083524 (2020), arXiv:1902.01366 [astro-ph.CO] .
- Yan et al. (2020) Sheng-Feng Yan, Pierre Zhang, Jie-Wen Chen, Xin-Zhe Zhang, Yi-Fu Cai, and Emmanuel N. Saridakis, “Interpreting cosmological tensions from the effective field theory of torsional gravity,” Phys. Rev. D 101, 121301 (2020), arXiv:1909.06388 [astro-ph.CO] .
- Frusciante et al. (2020) Noemi Frusciante, Simone Peirone, Luis Atayde, and Antonio De Felice, “Phenomenology of the generalized cubic covariant Galileon model and cosmological bounds,” Phys. Rev. D 101, 064001 (2020), arXiv:1912.07586 [astro-ph.CO] .
- Solà Peracaula et al. (2019) Joan Solà Peracaula, Adria Gomez-Valent, Javier de Cruz Pérez, and Cristian Moreno-Pulido, “Brans–Dicke Gravity with a Cosmological Constant Smoothes Out CDM Tensions,” Astrophys. J. Lett. 886, L6 (2019), arXiv:1909.02554 [astro-ph.CO] .
- Solà Peracaula et al. (2020) Joan Solà Peracaula, Adrià Gómez-Valent, Javier de Cruz Pérez, and Cristian Moreno-Pulido, “Brans–Dicke cosmology with a -term: a possible solution to CDM tensions,” Class. Quant. Grav. 37, 245003 (2020), arXiv:2006.04273 [astro-ph.CO] .
- Ballesteros et al. (2020) Guillermo Ballesteros, Alessio Notari, and Fabrizio Rompineve, “The tension: vs. ,” JCAP 11, 024 (2020), arXiv:2004.05049 [astro-ph.CO] .
- Braglia et al. (2021) Matteo Braglia, Mario Ballardini, Fabio Finelli, and Kazuya Koyama, “Early modified gravity in light of the tension and LSS data,” Phys. Rev. D 103, 043528 (2021), arXiv:2011.12934 [astro-ph.CO] .
- Desmond et al. (2019) Harry Desmond, Bhuvnesh Jain, and Jeremy Sakstein, “Local resolution of the Hubble tension: The impact of screened fifth forces on the cosmic distance ladder,” Phys. Rev. D 100, 043537 (2019), arXiv:1907.03778 [astro-ph.CO] .
- Lin et al. (2019) Meng-Xiang Lin, Marco Raveri, and Wayne Hu, “Phenomenology of Modified Gravity at Recombination,” Phys. Rev. D 99, 043514 (2019), arXiv:1810.02333 [astro-ph.CO] .
- Chiang and Slosar (2018) Chi-Ting Chiang and Anže Slosar, “Inferences of in presence of a non-standard recombination,” (2018), arXiv:1811.03624 [astro-ph.CO] .
- Hart and Chluba (2020) Luke Hart and Jens Chluba, “Updated fundamental constant constraints from Planck 2018 data and possible relations to the Hubble tension,” Mon. Not. Roy. Astron. Soc. 493, 3255–3263 (2020), arXiv:1912.03986 [astro-ph.CO] .
- Sekiguchi and Takahashi (2021) Toyokazu Sekiguchi and Tomo Takahashi, “Early recombination as a solution to the tension,” Phys. Rev. D 103, 083507 (2021), arXiv:2007.03381 [astro-ph.CO] .
- Jedamzik and Pogosian (2020) Karsten Jedamzik and Levon Pogosian, “Relieving the Hubble tension with primordial magnetic fields,” Phys. Rev. Lett. 125, 181302 (2020), arXiv:2004.09487 [astro-ph.CO] .
- Cyr-Racine et al. (2021) Francis-Yan Cyr-Racine, Fei Ge, and Lloyd Knox, “A Symmetry of Cosmological Observables, and a High Hubble Constant as an Indicator of a Mirror World Dark Sector,” (2021), arXiv:2107.13000 [astro-ph.CO] .
- Di Valentino et al. (2021a) Eleonora Di Valentino, Olga Mena, Supriya Pan, Luca Visinelli, Weiqiang Yang, Alessandro Melchiorri, David F. Mota, Adam G. Riess, and Joseph Silk, “In the realm of the Hubble tension—a review of solutions,” Class. Quant. Grav. 38, 153001 (2021a), arXiv:2103.01183 [astro-ph.CO] .
- Lesgourgues et al. (2016) Julien Lesgourgues, Gustavo Marques-Tavares, and Martin Schmaltz, “Evidence for dark matter interactions in cosmological precision data?” JCAP 02, 037 (2016), 1507.04351 .
- Buen-Abad et al. (2015) Manuel A. Buen-Abad, Gustavo Marques-Tavares, and Martin Schmaltz, “Non-Abelian dark matter and dark radiation,” Phys. Rev. D 92, 023531 (2015), arXiv:1505.03542 [hep-ph] .
- Chacko et al. (2016) Zackaria Chacko, Yanou Cui, Sungwoo Hong, Takemichi Okui, and Yuhsin Tsai, “Partially Acoustic Dark Matter, Interacting Dark Radiation, and Large Scale Structure,” JHEP 12, 108 (2016), arXiv:1609.03569 [astro-ph.CO] .
- Buen-Abad et al. (2018) Manuel A. Buen-Abad, Martin Schmaltz, Julien Lesgourgues, and Thejs Brinckmann, “Interacting dark sector and precision cosmology,” JCAP 01, 008 (2018), 1708.09406 .
- Heimersheim et al. (2020) Stefan Heimersheim, Nils Schöneberg, Deanna C. Hooper, and Julien Lesgourgues, “Cannibalism hinders growth: Cannibal Dark Matter and the tension,” (2020), 2008.08486 .
- Gómez-Valent et al. (2020) Adrià Gómez-Valent, Valeria Pettorino, and Luca Amendola, “Update on coupled dark energy and the tension,” Phys. Rev. D 101, 123513 (2020), arXiv:2004.00610 [astro-ph.CO] .
- Di Valentino et al. (2020) Eleonora Di Valentino, Alessandro Melchiorri, Olga Mena, and Sunny Vagnozzi, “Interacting dark energy in the early 2020s: A promising solution to the and cosmic shear tensions,” Phys. Dark Univ. 30, 100666 (2020), arXiv:1908.04281 [astro-ph.CO] .
- Lucca (2021) Matteo Lucca, “Dark energy–dark matter interactions as a solution to the S8 tension,” Phys. Dark Univ. 34, 100899 (2021), arXiv:2105.09249 [astro-ph.CO] .
- Abellan et al. (2020) Guillermo F. Abellan, Riccardo Murgia, Vivian Poulin, and Julien Lavalle, “Hints for decaying dark matter from measurements,” (2020), 2008.09615 .
- Di Valentino et al. (2021b) Eleonora Di Valentino et al., “Cosmology intertwined III: and ,” Astropart. Phys. 131, 102604 (2021b), arXiv:2008.11285 [astro-ph.CO] .
- Bansal et al. (2021) Saurabh Bansal, Jeong Han Kim, Christopher Kolda, Matthew Low, and Yuhsin Tsai, “Mirror Twin Higgs Cosmology: Constraints and a Possible Resolution to the and Tensions,” (2021), arXiv:2110.04317 [hep-ph] .
- Enqvist et al. (2015a) Kari Enqvist, Seshadri Nadathur, Toyokazu Sekiguchi, and Tomo Takahashi, “Decaying dark matter and the tension in ,” JCAP 09, 067 (2015a), 1505.05511 .
- Berezhiani et al. (2015) Z. Berezhiani, A.D. Dolgov, and I.I. Tkachev, “Reconciling planck results with low redshift astronomical measurements,” Phys. Rev. D 92, 061303 (2015), 1505.03644 .
- Blinov et al. (2020) Nikita Blinov, Celeste Keith, and Dan Hooper, “Warm Decaying Dark Matter and the Hubble Tension,” JCAP 06, 005 (2020), arXiv:2004.06114 [astro-ph.CO] .
- Vattis et al. (2019) Kyriakos Vattis, Savvas M. Koushiappas, and Abraham Loeb, “Late universe decaying dark matter can relieve the tension,” Phys. Rev. D99, 121302 (2019), 1903.06220 .
- Abellán et al. (2021) Guillermo F. Abellán, Riccardo Murgia, and Vivian Poulin, “Linear cosmological constraints on 2-body decaying dark matter scenarios and robustness of the resolution to the tension,” (2021), arXiv:2102.12498 [astro-ph.CO] .
- Chudaykin et al. (2016) A. Chudaykin, D. Gorbunov, and I. Tkachev, “Dark matter component decaying after recombination: Lensing constraints with planck data,” Phys. Rev. D94, 023528 (2016), 1602.08121 .
- Chudaykin et al. (2018) A. Chudaykin, D. Gorbunov, and I. Tkachev, “Dark matter component decaying after recombination: Sensitivity to baryon acoustic oscillation and redshift space distortion probes,” Phys. Rev. D 97, 083508 (2018), arXiv:1711.06738 [astro-ph.CO] .
- Poulin et al. (2016) Vivian Poulin, Pasquale D. Serpico, and Julien Lesgourgues, “A fresh look at linear cosmological constraints on a decaying dark matter component,” Journal of Cosmology and Astroparticle Physics 2016, 036–036 (2016).
- Clark et al. (2020) Steven J. Clark, Kyriakos Vattis, and Savvas M. Koushiappas, “Cosmological constraints on late-Universe decaying dark matter as a solution to the H0 tension,” (2020), 2006.03678 .
- Haridasu and Viel (2020) Balakrishna S. Haridasu and Matteo Viel, “Late-time decaying dark matter: constraints and implications for the H0-tension,” (2020), 2004.07709 .
- Nygaard et al. (2020) Andreas Nygaard, Thomas Tram, and Steen Hannestad, “Updated constraints on decaying cold dark matter,” (2020), arXiv:2011.01632 [astro-ph.CO] .
- Alvi et al. (2022) S. Alvi, T. Brinckmann, M. Gerbino, M. Lattanzi, and L. Pagano, “Do you smell something decaying? Updated linear constraints on decaying dark matter scenarios,” (2022), arXiv:2205.05636 [astro-ph.CO] .
- Berezinsky et al. (1991) V. Berezinsky, A. Masiero, and J.W.F. Valle, “Cosmological signatures of supersymmetry with spontaneously broken R parity,” Physics Letters B 266, 382–388 (1991).
- Kim and Kim (2002) Hang Bae Kim and Jihn E. Kim, “Late decaying axino as CDM and its lifetime bound,” Physics Letters B 527, 18–22 (2002).
- Covi et al. (1999) Laura Covi, Jihn E. Kim, and Leszek Roszkowski, “Axinos as cold dark matter,” Phys. Rev. Lett. 82, 4180–4183 (1999), hep-ph/9905212 .
- Feng et al. (2003) J. L. Feng, A. Rajaraman, and F. Takayama, “Superweakly interacting massive particles,” Phys. Rev. Lett. 91, 011302 (2003), hep-ph/0302215 .
- Feng et al. (2003) Jonathan L. Feng, Arvind Rajaraman, and Fumihiro Takayama, “Superweakly interacting massive particle dark matter signals from the early universe,” Phys. Rev. D 68, 063504 (2003), hep-ph/0306024 .
- Allahverdi et al. (2015) Rouzbeh Allahverdi, Bhaskar Dutta, Farinaldo S. Queiroz, Louis E. Strigari, and Mei-Yu Wang, “Dark matter from late invisible decays to and of gravitinos,” Phys. Rev. D 91, 055033 (2015), 1412.4391 .
- Abazajian et al. (2012) K. N. Abazajian et al., “Light Sterile Neutrinos: A White Paper,” (2012), arXiv:1204.5379 [hep-ph] .
- Drewes et al. (2017) M. Drewes et al., “A white paper on kev sterile neutrino dark matter,” JCAP 01, 025 (2017), 1602.04816 .
- Chen et al. (2009) Chuan-Ren Chen, Fuminobu Takahashi, and T. T. Yanagida, “Gamma rays and positrons from a decaying hidden gauge boson,” Phys. Lett. B 671, 71–76 (2009), 0809.0792 .
- Choi et al. (2020a) Gongjun Choi, Motoo Suzuki, and Tsutomu T. Yanagida, “Degenerate Sub-keV fermion dark matter from a solution to the Hubble tension,” (2020a), 2002.00036 .
- Choi et al. (2020b) Gongjun Choi, Motoo Suzuki, and Tsutomu. T. Yanagida, “Degenerate fermion dark matter from a broken U(1)B-L gauge symmetry,” Phys. Rev. D 102, 035022 (2020b), 2004.07863 .
- Choi and Yanagida (2021) Gongjun Choi and Tsutomu T. Yanagida, “Gravitino cosmology helped by a right handed (s)neutrino,” (2021), 2104.02958 .
- Holm et al. (2022) Emil Brinch Holm, Thomas Tram, and Steen Hannestad, “Decaying warm dark matter revisited,” (2022), arXiv:2205.13628 [astro-ph.CO] .
- Choi et al. (2020c) Gongjun Choi, Motoo Suzuki, and Tsutomu T. Yanagida, “XENON1T anomaly and its implication for decaying warm dark matter,” Phys. Lett. B 811, 135976 (2020c), 2006.12348 .
- Xu and Zheng (2020) Shuai Xu and Sibo Zheng, “Resolving xenon excess with decaying cold dark matter,” (2020), 2012.10827 .
- Dutta et al. (2021) Koushik Dutta, Avirup Ghosh, Arpan Kar, and Biswarup Mukhopadhyaya, “Decaying fermionic warm dark matter and XENON1T electronic recoil excess,” Phys. Dark Univ. 33, 100855 (2021), arXiv:2103.14664 [hep-ph] .
- Lin et al. (2001) W. B. Lin, D. H. Huang, X. Zhang, and R. Brandenberger, “Nonthermal Production of Weakly Interacting Massive Particles and the Subgalactic Structure of the Universe,” Phys. Rev. Lett. 86, 954–957 (2001), astro-ph/0009003 .
- Sánchez-Salcedo (2003) F. J. Sánchez-Salcedo, “Unstable Cold Dark Matter and the Cuspy Halo Problem in Dwarf Galaxies,” ApJ Letters 591, L107–L110 (2003), astro-ph/0305496 .
- Cembranos et al. (2005) J. A. R. Cembranos, J. L. Feng, A. Rajaraman, and F. Takayama, “Superweakly interacting massive particle solutions to small scale structure problems,” Phys. Rev. Lett. 95, 181301 (2005), hep-ph/0507150 .
- Kaplinghat (2005) Manoj Kaplinghat, “Dark matter from early decays,” Phys. Rev. D 72, 063510 (2005), astro-ph/0507300 .
- Strigari et al. (2007) Louis E. Strigari, Manoj Kaplinghat, and James S. Bullock, “Dark matter halos with cores from hierarchical structure formation,” Phys. Rev. D 75, 061303 (2007), astro-ph/0606281 .
- Borzumati et al. (2008) F. Borzumati, T. Bringmann, and P. Ullio, “Dark matter from late decays and the small-scale structure problems,” Phys. Rev. D 77, 063514 (2008), hep-ph/0701007 .
- Peter et al. (2010) Annika H. G. Peter, Christopher E. Moody, and Marc Kamionkowski, “Dark-matter decays and self-gravitating halos,” Phys. Rev. D 81, 103501 (2010), 1003.0419 .
- Peter and Benson (2010) Annika H. G. Peter and Andrew J. Benson, “Dark-matter decays and milky way satellite galaxies,” Phys. Rev. D 82, 123521 (2010), 1009.1912 .
- Carrasco et al. (2012) John Joseph M. Carrasco, Mark P. Hertzberg, and Leonardo Senatore, “The effective field theory of cosmological large scale structures,” Journal of High Energy Physics 2012 (2012), 10.1007/jhep09(2012)082.
- Baumann et al. (2012) Daniel Baumann, Alberto Nicolis, Leonardo Senatore, and Matias Zaldarriaga, “Cosmological non-linearities as an effective fluid,” Journal of Cosmology and Astroparticle Physics 2012, 051–051 (2012).
- Porto et al. (2014) Rafael A. Porto, Leonardo Senatore, and Matias Zaldarriaga, “The Lagrangian-space Effective Field Theory of large scale structures,” Journal of Cosmology and Astroparticle Physics 2014, 022–022 (2014).
- Pajer and Zaldarriaga (2013) Enrico Pajer and Matias Zaldarriaga, “On the renormalization of the effective field theory of large scale structures,” Journal of Cosmology and Astroparticle Physics 2013, 037–037 (2013).
- Abolhasani et al. (2016) Ali Akbar Abolhasani, Mehrdad Mirbabayi, and Enrico Pajer, “Systematic renormalization of the effective theory of Large Scale Structure,” Journal of Cosmology and Astroparticle Physics 2016, 063–063 (2016).
- Senatore and Zaldarriaga (2014) Leonardo Senatore and Matias Zaldarriaga, “Redshift Space Distortions in the Effective Field Theory of Large Scale Structures,” (2014), arXiv:1409.1225 [astro-ph.CO] .
- Baldauf et al. (2015) Tobias Baldauf, Mehrdad Mirbabayi, Marko Simonovic, and Matias Zaldarriaga, “Equivalence principle and the baryon acoustic peak,” Physical Review D 92 (2015), 10.1103/physrevd.92.043514.
- Senatore and Zaldarriaga (2015) Leonardo Senatore and Matias Zaldarriaga, “The IR-resummed Effective Field Theory of Large Scale Structures,” Journal of Cosmology and Astroparticle Physics 2015, 013–013 (2015).
- Senatore and Trevisan (2018) Leonardo Senatore and Gabriele Trevisan, “On the IR-resummation in the EFTofLSS,” Journal of Cosmology and Astroparticle Physics 2018, 019–019 (2018).
- Lewandowski and Senatore (2020) Matthew Lewandowski and Leonardo Senatore, “An analytic implementation of the IR-resummation for the BAO peak,” Journal of Cosmology and Astroparticle Physics 2020, 018–018 (2020).
- Blas et al. (2016) Diego Blas, Mathias Garny, Mikhail M. Ivanov, and Sergey Sibiryakov, “Time-sliced perturbation theory II: baryon acoustic oscillations and infrared resummation,” Journal of Cosmology and Astroparticle Physics 2016, 028–028 (2016).
- Carrasco et al. (2014a) John Joseph M. Carrasco, Simon Foreman, Daniel Green, and Leonardo Senatore, “The 2-loop matter power spectrum and the IR-safe integrand, volume=2014,” Journal of Cosmology and Astroparticle Physics , 056–056 (2014a).
- Carrasco et al. (2014b) John Joseph M. Carrasco, Simon Foreman, Daniel Green, and Leonardo Senatore, “The Effective Field Theory of Large Scale Structures at two loops,” Journal of Cosmology and Astroparticle Physics 2014, 057–057 (2014b).
- Senatore (2015) Leonardo Senatore, “Bias in the effective field theory of large scale structures,” Journal of Cosmology and Astroparticle Physics 2015, 007–007 (2015).
- Mirbabayi et al. (2015) Mehrdad Mirbabayi, Fabian Schmidt, and Matias Zaldarriaga, “Biased tracers and time evolution,” Journal of Cosmology and Astroparticle Physics 2015, 030–030 (2015).
- Angulo et al. (2015) Raul Angulo, Matteo Fasiello, Leonardo Senatore, and Zvonimir Vlah, “On the statistics of biased tracers in the Effective Field Theory of Large Scale Structures,” Journal of Cosmology and Astroparticle Physics 2015, 029–029 (2015).
- Fujita et al. (2020) Tomohiro Fujita, Valentin Mauerhofer, Leonardo Senatore, Zvonimir Vlah, and Raul Angulo, “Very massive tracers and higher derivative biases,” Journal of Cosmology and Astroparticle Physics 2020, 009–009 (2020).
- Perko et al. (2016) Ashley Perko, Leonardo Senatore, Elise Jennings, and Risa H. Wechsler, “Biased Tracers in Redshift Space in the EFT of Large-Scale Structure,” (2016), arXiv:1610.09321 [astro-ph.CO] .
- Nadler et al. (2018) Ethan O. Nadler, Ashley Perko, and Leonardo Senatore, “On the bispectra of very massive tracers in the Effective Field Theory of Large-Scale Structure,” Journal of Cosmology and Astroparticle Physics 2018, 058–058 (2018).
- D’Amico et al. (2021) Guido D’Amico, Leonardo Senatore, and Pierre Zhang, “Limits on wCDM from the EFTofLSS with the PyBird code,” Journal of Cosmology and Astroparticle Physics 2021, 006–006 (2021).
- Alcock and Paczynski (1979) C. Alcock and B. Paczynski, “An evolution free test for non-zero cosmological constant,” Nature 281, 358–359 (1979).
- Beutler et al. (2019) Florian Beutler, Emanuele Castorina, and Pierre Zhang, “Interpreting measurements of the anisotropic galaxy power spectrum,” Journal of Cosmology and Astroparticle Physics 2019, 040–040 (2019).
- Hahn et al. (2017) ChangHoon Hahn, Roman Scoccimarro, Michael R. Blanton, Jeremy L. Tinker, and Sergio Rodríguez-Torres, “The Effect of Fiber Collisions on the Galaxy Power Spectrum Multipoles,” Monthly Notices of the Royal Astronomical Society , stx185 (2017).
- Blas et al. (2011) Diego Blas, Julien Lesgourgues, and Thomas Tram, “The Cosmic Linear Anisotropy Solving System (CLASS). Part II: Approximation schemes,” Journal of Cosmology and Astroparticle Physics 2011, 034–034 (2011).
- Lewis et al. (2000) Antony Lewis, Anthony Challinor, and Anthony Lasenby, “Efficient computation of CMB anisotropies in closed FRW models,” Astrophys. J. 538, 473–476 (2000), arXiv:astro-ph/9911177 .
- Chudaykin et al. (2020) Anton Chudaykin, Mikhail M. Ivanov, Oliver H.E. Philcox, and Marko Simonovic, “Nonlinear perturbation theory extension of the Boltzmann code CLASS,” Physical Review D 102 (2020), 10.1103/physrevd.102.063533.
- Hamilton (2000) A. J. S. Hamilton, “Uncorrelated modes of the nonlinear power spectrum,” Mon. Not. Roy. Astron. Soc. 312, 257–284 (2000), arXiv:astro-ph/9905191 .
- Simonovic et al. (2018) Marko Simonovic, Tobias Baldauf, Matias Zaldarriaga, John Joseph Carrasco, and Juna A. Kollmeier, “Cosmological perturbation theory using the FFTLog: formalism and connection to QFT loop integrals,” JCAP 04, 030 (2018), arXiv:1708.08130 [astro-ph.CO] .
- Amendola et al. (2018) Luca Amendola et al., “Cosmology and fundamental physics with the Euclid satellite,” Living Rev. Rel. 21, 2 (2018), 1606.00180 .
- Alonso et al. (2018) David Alonso et al. (LSST Dark Energy Science), “The LSST Dark Energy Science Collaboration (DESC) Science Requirements Document,” (2018), 1809.01669 .
- Alam et al. (2017) Shadab Alam et al. (BOSS), “The clustering of galaxies in the completed SDSS-III Baryon Oscillation Spectroscopic Survey: cosmological analysis of the DR12 galaxy sample,” Mon. Not. Roy. Astron. Soc. 470, 2617–2652 (2017), 1607.03155 .
- Reid et al. (2015) Beth Reid et al., “SDSS-III Baryon Oscillation Spectroscopic Survey Data Release 12: galaxy target selection and large scale structure catalogues,” (2015), arXiv:1509.06529 [astro-ph.CO] .
- Kitaura et al. (2016) Francisco-Shu Kitaura, Sergio Rodríguez-Torres, Chia-Hsun Chuang, Cheng Zhao, Francisco Prada, Héctor Gil-Marín, Hong Guo, Gustavo Yepes, Anatoly Klypin, Claudia G. Scóccola, Jeremy Tinker, Cameron McBride, Beth Reid, Ariel G. Sánchez, Salvador Salazar-Albornoz, Jan Niklas Grieb, Mariana Vargas-Magana, Antonio J. Cuesta, Mark Neyrinck, Florian Beutler, Johan Comparat, Will J. Percival, and Ashley Ross, “The clustering of galaxies in the SDSS-III Baryon Oscillation Spectroscopic Survey: mock galaxy catalogues for the BOSS Final Data Release,” Monthly Notices of the Royal Astronomical Society 456, 4156–4173 (2016).
- Zhang et al. (2021) Pierre Zhang, Guido D’Amico, Leonardo Senatore, Cheng Zhao, and Yifu Cai, “BOSS Correlation Function Analysis from the Effective Field Theory of Large-Scale Structure,” (2021), arXiv:2110.07539 [astro-ph.CO] .
- d’ Amico et al. (2020) Guido d’ Amico, Jérôme Gleyzes, Nickolas Kokron, Katarina Markovic, Leonardo Senatore, Pierre Zhang, Florian Beutler, and Héctor Gil-Marín, “The cosmological analysis of the SDSS/BOSS data from the Effective Field Theory of Large-Scale Structure,” Journal of Cosmology and Astroparticle Physics 2020, 005–005 (2020).
- Colas et al. (2020) Thomas Colas, Guido d’ Amico, Leonardo Senatore, Pierre Zhang, and Florian Beutler, “Efficient cosmological analysis of the SDSS/BOSS data from the Effective Field Theory of Large-Scale Structure,” Journal of Cosmology and Astroparticle Physics 2020, 001–001 (2020).
- Nishimichi et al. (2020) Takahiro Nishimichi, Guido D’Amico, Mikhail M. Ivanov, Leonardo Senatore, Marko Simonovic, Masahiro Takada, Matias Zaldarriaga, and Pierre Zhang, “Blinded challenge for precision cosmology with large-scale structure: Results from effective field theory for the redshift-space galaxy power spectrum,” Physical Review D 102 (2020), 10.1103/physrevd.102.123541.
- D’Amico et al. (2021) Guido D’Amico, Leonardo Senatore, and Pierre Zhang, JCAP 01, 006 (2021), 2003.07956 .
- Audren et al. (2014) Benjamin Audren, Julien Lesgourgues, Gianpiero Mangano, Pasquale Dario Serpico, and Thomas Tram, “Strongest model-independent bound on the lifetime of dark matter,” JCAP 12, 028 (2014), 1407.2418 .
- Enqvist et al. (2015b) Kari Enqvist, Seshadri Nadathur, Toyokazu Sekiguchi, and Tomo Takahashi, “Decaying dark matter and the tension in 8,” Journal of Cosmology and Astroparticle Physics 2015, 067–067 (2015b).
- Ma and Bertschinger (1995) Chung-Pei Ma and Edmund Bertschinger, “Cosmological perturbation theory in the synchronous and conformal newtonian gauges,” The Astrophysical Journal 455, 7 (1995).
- Lesgourgues and Tram (2014) Julien Lesgourgues and Thomas Tram, “Fast and accurate CMB computations in non-flat FLRW universes,” JCAP 09, 032 (2014), arXiv:1312.2697 [astro-ph.CO] .
- Hubert et al. (2021) Jonathan Hubert, Aurel Schneider, Doug Potter, Joachim Stadel, and Sambit K. Giri, “Decaying dark matter: Simulations and weak-lensing forecast,” (2021), arXiv:2104.07675 [astro-ph.CO] .
- Lesgourgues et al. (2013) Julien Lesgourgues, Gianpiero Mangano, Gennaro Miele, and Sergio Pastor, Neutrino Cosmology (Cambridge University Press, 2013).
- Blackadder and Koushiappas (2014) Gordon Blackadder and Savvas M. Koushiappas, “Dark matter with two- and many-body decays and supernovae type Ia,” Physical Review D 90 (2014), 10.1103/physrevd.90.103527.
- Aoyama et al. (2014) Shohei Aoyama, Toyokazu Sekiguchi, Kiyotomo Ichiki, and Naoshi Sugiyama, “Evolution of perturbations and cosmological constraints in decaying dark matter models with arbitrary decay mass products,” Journal of Cosmology and Astroparticle Physics 2014, 021–021 (2014).
- Lesgourgues and Tram (2011) Julien Lesgourgues and Thomas Tram, “The Cosmic Linear Anisotropy Solving System (CLASS) IV: efficient implementation of non-cold relics,” JCAP 09, 032 (2011), 1104.2935 .
- Senatore and Zaldarriaga (2017) Leonardo Senatore and Matias Zaldarriaga, “The Effective Field Theory of Large-Scale Structure in the presence of Massive Neutrinos,” (2017), arXiv:1707.04698 [astro-ph.CO] .
- de Belsunce and Senatore (2019) Roger de Belsunce and Leonardo Senatore, “Tree-level bispectrum in the effective field theory of large-scale structure extended to massive neutrinos,” Journal of Cosmology and Astroparticle Physics 2019, 038–038 (2019).
- Heymans et al. (2020) Catherine Heymans et al., “Kids-1000 cosmology: Multi-probe weak gravitational lensing and spectroscopic galaxy clustering constraints,” (2020) 2007.15632 .
- Brinckmann and Lesgourgues (2019) Thejs Brinckmann and Julien Lesgourgues, “MontePython 3: boosted MCMC sampler and other features,” Phys. Dark Univ. 24, 100260 (2019), 1804.07261 .
- Audren et al. (2013) Benjamin Audren, Julien Lesgourgues, Karim Benabed, and Simon Prunet, “Conservative Constraints on Early Cosmology: an illustration of the Monte Python cosmological parameter inference code,” JCAP 02, 001 (2013), arXiv:1210.7183 [astro-ph.CO] .
- Aghanim et al. (2020b) N. Aghanim et al. (Planck), “Planck 2018 results. VIII. Gravitational lensing,” Astron. Astrophys. 641, A8 (2020b), arXiv:1807.06210 [astro-ph.CO] .
- Scolnic et al. (2018) D. M. Scolnic et al., “The Complete Light-curve Sample of Spectroscopically Confirmed SNe Ia from Pan-STARRS1 and Cosmological Constraints from the Combined Pantheon Sample,” Astrophys. J. 859, 101 (2018), 1710.00845 .
- Beutler et al. (2011) Florian Beutler, Chris Blake, Matthew Colless, D.Heath Jones, Lister Staveley-Smith, Lachlan Campbell, Quentin Parker, Will Saunders, and Fred Watson, “The 6dF Galaxy Survey: baryon acoustic oscillations and the local Hubble constant,” Mon. Not. Roy. Astron. Soc. 416, 3017–3032 (2011), 1106.3366 .
- Ross et al. (2015) Ashley J. Ross, Lado Samushia, Cullan Howlett, Will J. Percival, Angela Burden, and Marc Manera, “The clustering of the SDSS DR7 main Galaxy sample I: A 4 per cent distance measure at z = 0.15,” Mon. Not. Roy. Astron. Soc. 449, 835–847 (2015), 1409.3242 .
- de Sainte Agathe et al. (2019) Victoria de Sainte Agathe et al., “Baryon acoustic oscillations at z = 2.34 from the correlations of Ly absorption in eBOSS DR14,” Astron. Astrophys. 629, A85 (2019), 1904.03400 .
- Blomqvist et al. (2019) Michael Blomqvist et al., “Baryon acoustic oscillations from the cross-correlation of Ly absorption and quasars in eBOSS DR14,” Astron. Astrophys. 629, A86 (2019), 1904.03430 .
- Gelman and Rubin (1992) Andrew Gelman and Donald B. Rubin, “Inference from Iterative Simulation Using Multiple Sequences,” Statistical Science 7, 457 – 472 (1992).
- Poulin et al. (2018) Vivian Poulin, Kimberly K. Boddy, Simeon Bird, and Marc Kamionkowski, “Implications of an extended dark energy cosmology with massive neutrinos for cosmological tensions,” Phys. Rev. D97, 123504 (2018), 1803.02474 .
- Raveri and Hu (2019) Marco Raveri and Wayne Hu, “Concordance and discordance in cosmology,” Phys. Rev. D 99, 043506 (2019), arXiv:1806.04649 [astro-ph.CO] .
- Mau et al. (2022) S. Mau et al., “Milky Way Satellite Census. IV. Constraints on Decaying Dark Matter from Observations of Milky Way Satellite Galaxies,” (2022), arXiv:2201.11740 [astro-ph.CO] .
- Aghamousa, Amir and others (2016) Aghamousa, Amir and others (DESI), “The DESI Experiment Part I: Science,Targeting, and Survey Design,” (2016), 1611.00036 .
- Heymans et al. (2013) Catherine Heymans et al., “CFHTLenS tomographic weak lensing cosmological parameter constraints: Mitigating the impact of intrinsic galaxy alignments,” Mon. Not. Roy. Astron. Soc. 432, 2433 (2013), 1303.1808 .