contents= Submitted to the Proceedings of the US Community Study on the Future of Particle Physics (Snowmass 2021) , scale=1,placement=top,opacity=1,color=black,position=3.25in,1.2in
Snowmass 2021 Cosmic Frontier White Paper:
Cosmology with Millimeter-Wave Line Intensity Mapping
Abstract
Next-generation tests of fundamental physics and cosmology using large scale structure require measurements over large volumes of the Universe, including high redshifts inaccessible to present-day surveys. Line intensity mapping, an emerging technique that detects the integrated emission of atomic and molecular lines without resolving sources, can efficiently map cosmic structure over a wide range of redshifts. Observations at millimeter wavelengths detect far-IR emission lines such as CO/[CII], and take advantage of observational and analysis techniques developed by CMB experiments. These measurements can provide constraints with unprecedented precision on the physics of inflation, neutrino masses, light relativistic species, dark energy and modified gravity, and dark matter, among many other science goals. In this white paper we forecast the sensitivity requirements for future ground-based mm-wave intensity mapping experiments to enable transformational cosmological constraints. We outline a staged experimental program to steadily improve sensitivity, and describe the necessary investments in developing detector technology and analysis techniques.
1 Introduction
Over the past few decades, thanks to the increasing volume and precision of cosmological surveys—in particular measurements of the cosmic microwave background (CMB) and large-scale structure (LSS)—we have established a high-precision, “concordance” model of cosmology: the CDM paradigm. Nevertheless, we are still left with fundamental open questions. What was the mechanism that set the seeds of cosmic structure in the very early universe? What is the nature of dark energy (DE) and dark matter (DM)? What are the properties of neutrinos and other possible light relics? High-precision maps of the three-dimensional LSS provide a rich trove of information about the origin, evolution and composition of the Universe, probing deviations from the standard cosmological model and potentially hinting at new physics. The line intensity mapping (LIM) technique offers a means to map LSS over a wide range of scales and across many redshift epochs, complementing upcoming wide-field galaxy surveys at redshifts , and providing a spectroscopic probe of LSS at .
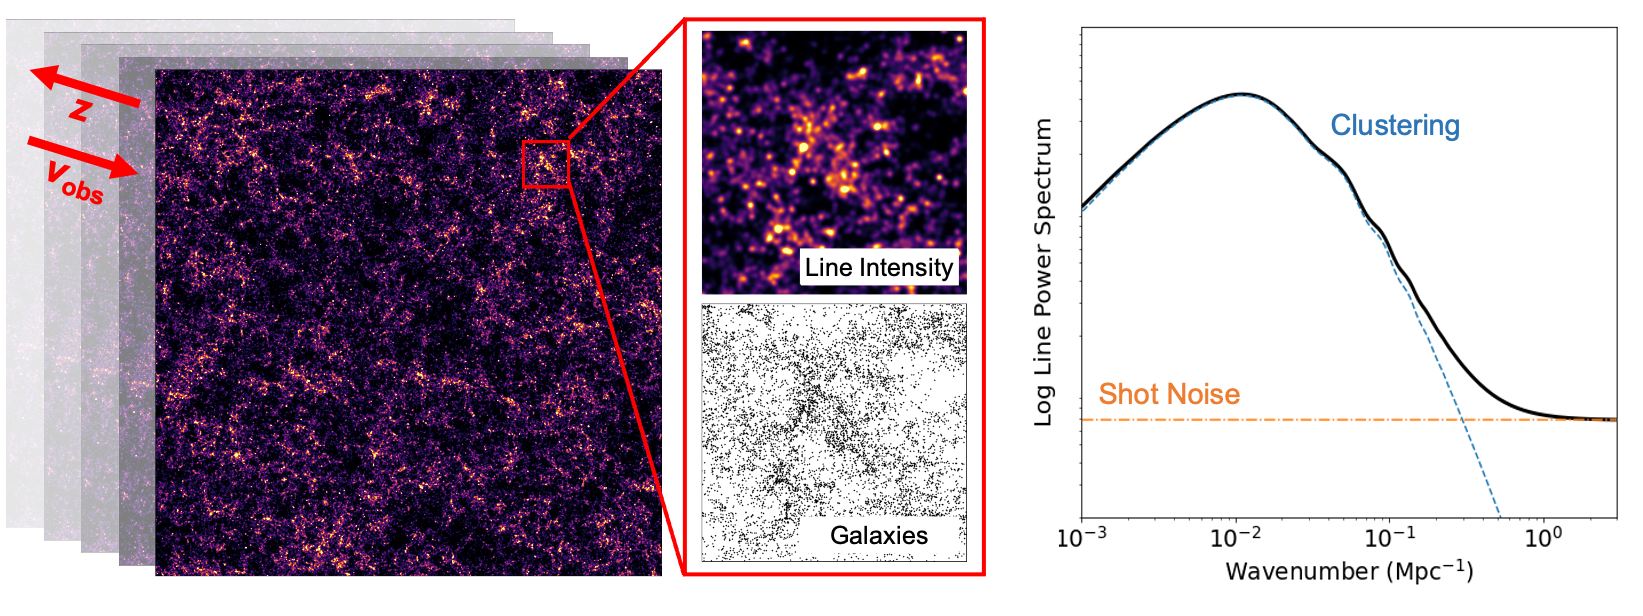
In contrast to typical galaxy surveys, which directly image large numbers of resolved galaxies, LIM measures the aggregate emission of all galaxies in a chosen spectral line [1]. Spatial fluctuations in the resulting intensity field and spectral emission information can be combined to generate a smoothed three-dimensional map of the galaxy distribution. As illustrated in Figure 1, the clustering component traces the underlying DM while the shot noise contribution arises from the discrete nature of the sources. Emission lines originating from different phases of the interstellar medium can be used individually and in synergy with each other to constrain cosmology and astrophysics [2, 3, 4]. Since the LIM technique does not require resolving individual galaxies, it is an efficient probe of LSS over large comoving volumes, enabling measurements over large scales and over long redshift lever arms, including the high-redshift regime. The promise of LIM surveys for testing fundamental cosmology is therefore multifold:
-
1.
Wide redshift coverage mitigates degeneracies between cosmological parameters due to different degeneracy directions at low and high redshifts.
-
2.
Measuring very large-scale modes allows extraction of key information about physics at the scale of the cosmological horizon, including imprints of multiple degrees of freedom during inflation and general relativistic effects that probe the theory of gravity.
-
3.
Probing higher redshifts provides access to an order of magnitude more linear and semi-linear density modes, which are less affected by nonlinearities and astrophysical processes that decorrelate the modes from the initial conditions, and can be described accurately with perturbative theoretical models; see the dedicated Snowmass 2021 white paper on cosmology at high redshift for further details [5].
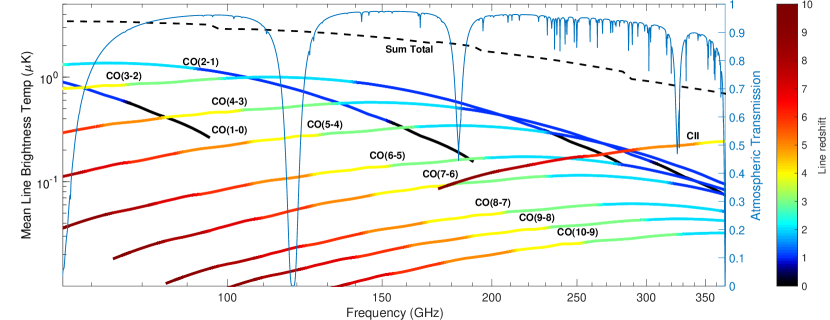
LIM at millimeter wavelengths has garnered significant experimental interest in recent years. These measurements target atomic and molecular lines with rest-frame wavelengths in the far-IR. Lines such as the CO(JJ-1) rotational transitions and the [CII] ionized carbon fine structure line are bright in dusty, star-forming galaxies that are abundant in the early Universe, and have been observed in individual sources out to the epoch of reionization [6, 7]. Observations from cm to THz frequencies are capable of detecting emission from redshifts using a combination of lines. Figure 2 shows the mean brightness temperatures of spectral lines detectable by mm-wavelength ground-based surveys, in addition to representative atmospheric transmission. These observations operate in a region of frequency space with much less Galactic foreground contamination than LIM efforts targeting the 21 cm line [8], and build on the extensive heritage of CMB observations at similar frequencies. Current experiments, including CCAT-p [9], COMAP [10], CONCERTO [11], EXCLAIM [12], mmIME [13], SPT-SLIM [14], TIM [15], and TIME [16], are demonstrating the technologies and analysis techniques to probe cosmology, but so far lack the necessary scale and sensitivity to place competitive cosmological constraints.
The goal of this white paper is to illustrate that next-generation mm-wave LIM experiments are capable of testing fundamental physics and cosmology, particularly at higher redshifts and over larger volumes than possible with current probes of LSS. After describing the motivating science cases, we forecast the measurement requirements needed to cross critical target thresholds. We outline a staged experimental program that reaches these thresholds by gradually increasing the sensitivity and volume of LIM observations. We then describe the needed investments in technology to improve experimental sensitivity, and summarize the challenges in extracting cosmology from LIM measurements and the investments in analysis techniques that would address them.
2 Science Summary
Wide-field LIM surveys would advance our understanding of open fundamental questions in cosmology, and in several cases cross physically-motivated theoretical thresholds. Measuring clustering statistics of line intensity fluctuations over the redshift range would allow us to:
-
1.
Decipher the origin of cosmic structure: The simplest models of single-field, slow-roll inflation predict primordial fluctuations with a nearly scale-invariant power spectrum and Gaussian distribution, in agreement with CMB and LSS observations [18]. Deviations from either prediction, e.g., features in the primordial power spectrum [19, 20] or primordial non-Gaussianity (PNG) [21], would probe fundamental physics at the highest energy scales and shed light on the mechanism that set the seeds of cosmic structure; see the dedicated Snowmass 2021 white paper on Inflation [22]. High-precision measurements of the line power spectrum can significantly improve current bounds on inflaton features [18, 23, 24] by detecting, e.g., sinusoidal modulation of the power spectrum [25] with enhanced sensitivity to lower amplitudes and a broader range of feature frequencies. The amplitude of the local-type PNG, , can be constrained by measuring the scale-dependent line bias on large scales [26]. Furthermore, measurement of the line bispectrum improves limits on the local shape and constrains other types of PNG, such as the equilateral [27, 28, 29], orthogonal [30], and folded [31, 32] shapes (which do not leave distinguishable imprints on the power spectrum [33]). Detection of local-type PNG is considered a “smoking gun” for multi-field inflation, which generically predicts . Therefore, crossing the critical threshold of would rule out single-field models of inflation, which obey the consistency relation enforcing [34, 35]. Reaching similar thresholds on other shapes is also desirable: detecting would imply that inflation is a strongly-coupled phenomenon [36, 37] and considerably limit inflation model space. CMB data from Planck provide the current tightest constraints [38], but recent results from galaxy surveys [39, 40, 41] point to the potential of LSS to exceed the current CMB limits of . Advantages of LIM: First, LIM measurements of large comoving volumes compared to galaxy surveys would access very large-scale modes, which are crucial in constraining using scale-dependent bias. Second, since the signal-to-noise ratio for PNG in the bispectrum sharply increases as a function of the smallest scale [42], probing and accessing a large number of linear and semi-linear modes make LIM surveys particularly powerful compared to lower-redshift surveys. Third, using cross-correlations between multiple lines observable in a LIM survey in addition to auto spectra can further improve constraints by mitigating cosmic variance [43].
-
2.
Measure the sum of neutrino masses: When neutrinos become non-relativistic, their masses contribute to the matter content of the universe and modify the expansion history and growth of structure [44]. They can thus be constrained by measurements of line clustering statistics such as the power spectrum. The mass splitting measured by neutrino oscillation experiments sets a minimum for the sum of neutrino masses, in the normal and in the inverted mass hierarchies [45, 46]. This sets a critical threshold of for a detection of the minimum neutrino mass [47]. Improving on the current best constraints of from CMB and LSS data [48, 49] would indirectly distinguish between the two mass orderings, with implications for determining the nature of neutrinos (Dirac vs. Majorana), understanding mixing in the lepton sector, and discriminating between flavor models [50]; see the dedicated Snowmass 2021 white paper on synergies between cosmological and laboratory probes of neutrinos [51]. Advantages of LIM: By mapping LSS over a long redshift lever arm, LIM surveys capture the redshift evolution of the scale-dependent suppression of the matter power spectrum and growth rate due to neutrino masses. Furthermore, wide redshift coverage breaks parameter degeneracies in the CMB and low-redshift LSS probes [52], most notably between and the large-scale amplitude of the matter power spectrum, optical depth, and DE equation of state [53, 54, 55].
-
3.
Search for new light particles: The Standard Model (SM) of particle physics predicts three species of massless neutrinos contributing to the radiation content of the Universe at early times, corresponding to . Changing modifies the amplitude of the matter power spectrum and the phase and amplitude of the baryon acoustic oscillations [56], and thus can be constrained by measuring the power spectra of biased tracers of DM. Detection of excess light relic abundance offers discovery space for new physics, as many extensions to the SM predict extra light relics. The spin states and decoupling temperatures determine the minimum excess values: for a single scalar, for a Weyl fermion, and for a vector boson [57, 58]. Therefore, reaching would constrain excess light relics with non-zero (zero) spin at (), probing a wide range of models—including those with axions, axion-like particles, thermal populations of gravitinos, and dark photons [59]; see the dedicated Snowmass 2021 white paper on light relics [60]. Advantages of LIM: By probing extremely large comoving volumes, LIM surveys could significantly improve on current limits from CMB and LSS data, [48]. Since LIM is not affected by the degeneracy between and the primordial Helium fraction, —one of the limiting factors in CMB constraints on light relics—these measurements will be highly complementary to CMB-S4 [61].
-
4.
Test the physics of dark energy and gravity: Although the current accelerated expansion is well-modeled by a cosmological constant which begins to dominate the cosmic energy density at late times, , it unclear whether this is the correct model of DE, or if the acceleration is due to modifications to General Relativity. “Tracking”-type behavior, where DE behaves like matter at high redshift with equation of state , and then transitions to a cosmological constant with at low redshift, is a generic prediction of scalar-tensor theories with second-order equations of motion (Horndeski theories) [62, 63]. Another class of models, which has received attention as a solution to the Hubble tension [64, 65, 66], assumes an early dark energy (EDE) component that behaves like a cosmological constant before some critical pre-recombination redshift , and afterwards dilutes faster than radiation. LSS surveys can test these models by precisely characterizing the expansion history during both the matter- and DE-dominated eras [67]. At the same time, LSS probes models of gravity by tracing their imprints on the growth of structure [68, 69]; while modifications to gravity and dynamic DE are largely indistinguishable in the expansion history, their effects are distinct in the fluctuations probed by clustering statistics [70]. Advantages of LIM: High-precision LIM measurements would significantly improve current constraints on dynamical and EDE models due to wide redshift access. [71, 72, 73]. Measurements at high redshift probe the EDE fraction out to very high pre-recombination redshifts [25], and constrain EDE where its effect on the matter power spectrum is more prominent since nonlinearities reduce the difference between EDE and CDM [74].
-
5.
Explore dark matter candidates: High-precision measurements of line clustering statistics constrain various dark matter scenarios, including those that act like an additional contribution to [75] and those that leave features in the clustering statistics of DM tracers, such as self-interacting DM [76], ultra-light axion DM [77], and models with DM-baryon scattering [78]; see the dedicated Snowmass 2021 white papers on dark matter constraints from cosmic surveys [79, 80, 81]. Advantages of LIM: By probing the faintest galaxies, which are not detected by galaxy surveys, LIM can uniquely constrain DM models that suppress small-scale structure [82]. LIM surveys can also be sensitive to radiative decays/annihilations of a broad range of beyond-the-Standard-Model particles which decay to photons at a specific frequency. If the density of these exotic species traces the DM, they will appear in LIM data as an emission line with no known atomic or molecular frequency. Models that can be probed using this signature include axion or sterile neutrino dark matter which decays to photons [83, 84], or an enhanced decay rate of the cosmic neutrino background [85].
Beyond the fundamental physics goals outlined above, a wide-field high-redshift LIM survey would also be a valuable tool for a broader range of astrophysical studies; see e.g., [1, 86]. LIM surveys provide a unique window into the aggregate properties of faint, distant galaxies unobservable by traditional surveys, probing galaxy growth and evolution [87, 88, 13, 89, 10, 90] as well as the process of cosmic reionization [91].
3 Measurement Requirements and Staged Experimental Program
Focusing on a subset of science goals described above, in this section we forecast the experimental sensitivity that LIM surveys targeting CO/[CII] require to cross the critical thresholds for , and . We also use the Chevallier-Polarski-Linder parametrization of the DE equation of state () to illustrate LIM’s potential to constrain dynamic DE models [92, 93].
Rather than focusing on a single survey design, we perform Fisher forecasts to determine the optimal design of ground-based mm-wave LIM surveys in achieving the best constraints on parameters of interest by measuring CO/[CII]. We present constraints as a function of spectrometer-hours: the product of spectrometer count and integration time, which is a reasonable proxy for sensitivity and the “effort level” of an experiment. Based on these results, we then outline a staged experimental approach that builds up sensitivity, enabled by technical advances discussed in Section 4.
We use only the line power spectra in our forecasts. Exploiting information in the observed intensity field beyond the power spectrum, e.g., higher-order statistics, one-point statistics, and synergies between LIM and future CMB and galaxy surveys [94] would not only improve constraints, but also offer a means to overcome degeneracies with nuisance astrophysical parameters, and to improve mitigation of systematics and foregrounds.
3.1 Sensitivity required to cross critical thresholds
Our forecasts consider power spectrum measurements of several CO rotational lines (from J=2-1 to J=6-5) and the [CII] fine-structure line combined with Planck primary CMB data [48]. As the best- and worst-case scenarios, we show constraints with and without interloper lines as a source of noise in our analysis [95, 96]. We use a linear model of the line power spectrum, and assume that the line biases and mean brightness temperatures are well-constrained. We choose a conservative bound on the small-scale cutoff () to stay in the regime where the linear model of the line power spectrum is accurate to [97]. The large-scale cutoffs—most relevant for —are set by the angular extent of the survey and the atmospheric transmission as a function of frequency in the angular and line-of-sight directions, respectively. For each line, we split the survey into redshift bins with mean redshifts and widths of 0.1 dex to account for the cosmic evolution of the line-emitting population, as well as variations in noise levels caused by the atmospheric transmission. The constraints are obtained using a unified Fisher Forecast pipeline described in Ref. [17], where further details about the signal and interloper modeling, instrument noise, and forecasting assumptions are outlined.
The instantaneous sensitivity of an instrument is determined by spectrometer count. Each “spectrometer” consists of a single spatial pixel that fully samples the 80–310 GHz range with frequency channels of width ; we assume resolving power . Millimeter-wave detectors are now routinely fabricated with device noise that is subdominant to the atmospheric background at excellent sites [98]—even at the spectral resolution needed for LIM science—so we assume that the instrument noise is dominated by thermal emission from the atmosphere.
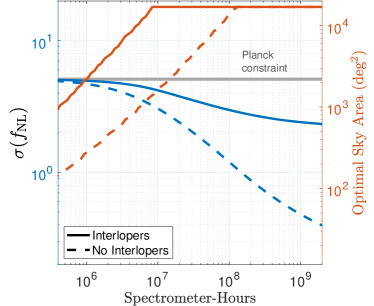
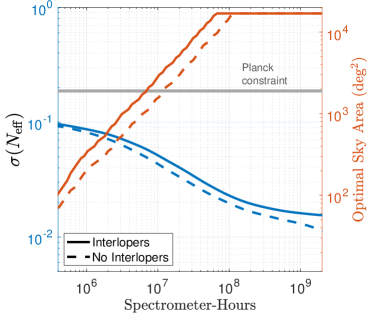
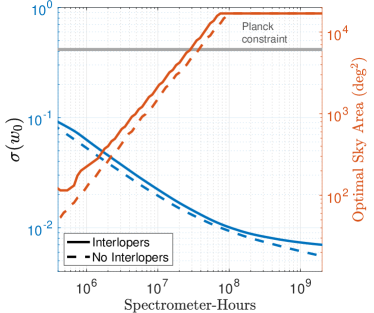
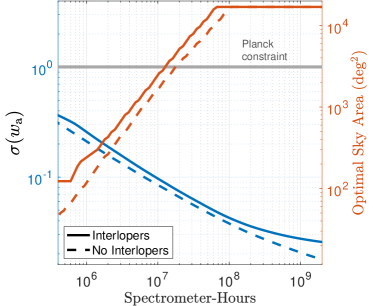
Figure 3 shows projections for one-parameter extensions to CDM varying , , and , and for a three-parameter extension varying , , and , in blue. The sky fraction that minimizes parameter uncertainties at each value of spectrometer-hours is shown in red, and limits from Planck are shown with horizontal gray lines. In all cases, significant improvements over current constraints are possible; the projected uncertainties generally plateau after spectrometer-hours, when the observable sky fraction hits a maximum of . In all cases except , the “interloper” worst-case scenario is not significantly less constraining than the best-case scenario111Without a Planck prior, the impact of interlopers is more relevant [17].. The degradation of the constraint agrees with the findings of Ref. [99], which showed that while interloper contamination increases the uncertainty and biases the best-fit value of , using cross-correlations between lines of interest and interlopers can largely remove the contamination.
Our forecasts indicate that future mm-wave LIM surveys can deliver cosmological constraints that are comparable to or exceed contemporary and planned CMB/LSS experiments. LIM experiments in the spectrometer-hour range can deliver constraints from the clustering power spectrum that are competitive with those from the upcoming generation of spectroscopic galaxy surveys [100], such as EUCLID [101] and DESI [102]. Experiments with spectrometer-hours would improve constraints on most parameters by an additional factor of 2–4. For , such a survey would provide comparable constraints to baseline forecasts for CMB-S4 [59], while for , a spectrometer-hour survey gives similar constraining power to CMB-S4. Projected constraints on surpass those from the proposed PUMA 21 cm experiment at – spectrometer-hours depending on the degree of interloper mitigation [33]; we also note that our forecasts for PNG are based only on the power spectrum and that significant additional constraining power will come from the bispectrum.
Projections for several of the science targets outlined in Section 2 rely on effects observable in the DM fluctuations in the linear regime, i.e., the initial conditions of structure formation. Therefore, the number of measurable linear (or weakly nonlinear) modes is a useful metric for comparing the potential of different LSS surveys. The decorrelation of the observed fluctuations from their initial conditions due to nonlinear evolution and instrumental noise is accounted for in defining the number of modes. As in Ref. [5], we compute the primordial physics Figure of Merit (FoM) to characterize the “effective” number of observed modes correlated with the initial conditions (see Appendix A for further details). Sensitivity to several parameters of interest—such as primordial features, local-shape PNG, and EDE—scale as . Ambitious future LIM surveys could achieve a FoM up to 170, with the exact value depending on how well interloper lines can be suppressed. For comparison, the expected FoM for DESI is 0.16, while PUMA expects 26–85 depending on foreground mitigation; see [5] for more extended comparison across various LSS surveys.
When interpreting the forecasted parameter constraints and FoM, it is important to note that the LIM technique is still in an early stage of development compared to the CMB and galaxy surveys, and several major caveats exist. First, while we assume perfect knowledge of the nuisance astrophysical parameters (i.e., the mean brightness temperature and line bias, which are degenerate with cosmological parameters), their current uncertainties are large. We anticipate that taking cross-correlations, both internally in multi-line intensity maps and with other probes such as galaxy surveys and CMB lensing, will significantly reduce these uncertainties [103]. Second, we assume linear theory for the line power spectrum; marginalizing over nonlinear parameters could degrade constraints, with the of impact depending on the choice of small-scale cutoff [25]. Finally, we assume that large angular and line-of-sight scales can be recovered without a significant component above the cutoffs. The degree to which this is possible is uncertain and depends on the scan strategy and atmospheric noise—techniques to recover large scales will be tested on pathfinder experiments.
Although our forecasts are performed specifically for mm-wave measurements from 80–310 GHz, we also anticipate and advocate for measurements of rest-frame far-IR lines outside of this range. Generally, cm-wave or THz measurements employ technology and observation strategies similar to mm-wave, and will improve the statistical power and redshift range of LIM measurements. Ground-based cm-wave surveys of low-J CO lines with – spectrometer-hours would complement mm-wave measurements by independently providing percent-level determination of the high-redshift expansion history [104, 105, 106] and PNG constraints from multiple tracers [107, 108, 109]. Since CO(1-0) and CO(2-1) at have no interloper lines to contend with, these measurements will also aid in attributing mm-wave signals to specific lines. Surveys of [CII], [NII], [OI], [OIII], and other lines extending to higher frequencies should enable similar synergies.
3.2 Experimental program
We envision a staged experimental approach in which increasing numbers of spectrometers are deployed on ground-based mm-wave telescopes to achieve the science goals outlined in the previous section. This strategy follows the approach used to develop similar technology for current mm-wave observatories measuring the CMB. It offers a natural path to increasing technical readiness and scale, and by the mid-2030s, this program could position mm-wave LIM as a successor to current CMB surveys.
Table 1 outlines possible experimental stages and forecasts for the science cases in Section 2, in addition to the primordial physics Figure of Merit. Each stage corresponds to a different experimental scale and is differentiated by the instrumentation and platform used—while current experiments employ a wide array of spectrometer technologies, we anticipate that future projects will converge on high-density on-chip spectrometers deployed at existing CMB facilities. Once the transition to CMB-style instruments is made, we assume that densely-packed spectrometer wafers will be deployed in receivers with multiple “optics tubes,” as envisioned for SO, SPT-3G+, and CMB-S4. An optics tube is assumed to hold an array of 400 on-chip spectrometers on a 6” wafer in the same formfactor as the SO-LAT optics tubes; note that this requires a significant increase in packing density over current on-chip spectrometers (see Section 4).
| Spec- hrs | Example | Time- scale | (meV) | FoM | ||||
| TIME, CCAT-p, SPT-SLIM | 2022 | 5.1 (5.1) | 61 (65) | 0.1 (0.11) | 13 (14) | 51 (52) | 0.0015 | |
| TIME-EXT | 2025 | 4.7 (5) | 43 (47) | 0.082 (0.087) | 5.3 (6.3) | 21 (26) | (0.09-0.1) | |
| SPT-like 1 tube | 2028 | 3.1 (4.2) | 23 (28) | 0.043 (0.051) | 2 (2.2) | 8.5 (9.7) | (1.7-3.1) | |
| SPT-like 7 tubes | 2031 | 1.2 (3) | 9.7 (13) | 0.02 (0.023) | 0.93 (1) | 3.8 (4.3) | (9.5-28) | |
| CMB-S4-like 85 tubes | 2037 | 0.48 (2.4) | 4.1 (6.8) | 0.013 (0.016) | 0.61 (0.73) | 2.1 (2.8) | (21-108) | |
| Planck | 5.1 | 83 | 0.187 | 41 | 100 | — | ||
While this program outlines an ambitious scaling up from current-generation experiments, we note that over the last 10 years similar progress has been made with CMB experiments. Moreover, this progression is feasible using existing 5–10m class CMB facilities, which are well-suited to the degree-to-arcminute scales necessary for these LIM science cases. Experimental techniques for extracting power spectra from extended, low surface brightness emission are mature and large classes of instrumental systematics relevant to the measurement are well-understood and quantified.
4 Investments Needed
4.1 Technology Developments
While first-generation mm-wave LIM instruments are now being demonstrated, several advances are still needed to enable the sensitivity required to cross the aforementioned science thresholds. The following hardware-related investments in detectors, readout, and facilities would leverage the considerable investment made in CMB experiments over the last few decades:
-
•
On-Chip Spectrometer Packing Density: Current approaches to mm-wave spectroscopy (diffraction gratings, Fourier Transform or Fabry-Perot spectroscopy, heterodyne detection) are difficult to scale to large spectrometer counts. On-chip spectroscopy, in which the detector and spectrometer are integrated on a silicon wafer, offers a natural path to maximizing the sensitivity of mm-wave receivers. However, while prototype on-chip spectrometers are now being demonstrated [110, 111], their spatial packing density is still significantly lower than CMB focal planes (primarily due to the physical extent of the spectrometer on the wafer). Innovation in focal plane geometry and layout will be key to enabling high-density close-packed arrays. Our forecasts assume that a 6” diameter wafer holds spectrometers, which fully samples the available focal plane area.
-
•
On-Chip Spectrometer Spectral Resolution: On-chip spectrometers have demonstrated spectral resolution of [110, 112]. Improving this to would move LIM experiments into the regime of spectroscopic surveys. Higher increases the number of available modes and significantly improves the measurement of redshift-space distortions [113, 25]. When mitigating astrophysical systematics, higher enables higher-fidelity line separation, either by allowing finer application of anisotropic projection effects [95, 96] or phase-space templates [114, 115], or by requiring less volume to be excised when masking foreground lines [116, 117, 118]. Increasing the spectral resolution of on-chip spectrometers requires development of new low-loss dielectric materials.
-
•
Multiplexed Readout: Spectroscopic pixels require significantly more detectors than their broadband counterparts; a 1000-spectrometer array with would have a detector count approaching that of the entire CMB-S4 experiment. Readout development will be essential to the success of future spectroscopic instruments. New technologies based on state-of-the-art FPGA platforms, such as the RF system-on-chip, promise to dramatically reduce overall readout costs to $1–2 per channel [119].
-
•
Telescopes and Facilities: The science goals outlined above can all be accomplished with 5–10 m class telescopes, with unobstructed optics optimized for measurements of extended, low surface brightness emission and minimal instrumental systematics. Several such facilities exist or will be built in the next decade, including SPT, ACT, SO, CCAT-p, and CMB-S4 [120, 9, 121]. Reusing these telescopes for the LIM measurement represents a natural step that would extend their lifetime in service of cosmological science similar to CMB.
4.2 Analysis Techniques
Controlling astrophysical, instrumental, and modeling systematics will also be critical for LIM cosmology. Investments in analysis techniques, which can be validated by pathfinder experiments, will enable future surveys to take advantage of the sensitivity enabled by hardware advances:
-
•
Astrophysical systematics: Both astrophysical continuum and spectral line emission induce systematics in the LIM measurement. Continuum foregrounds/backgrounds can be orders of magnitudes stronger than the signal of interest [122]. However, they generally vary smoothly with frequency, affecting modes at low spectral wavenumber (i.e., where ). Furthermore, mm-wave continuum emission has been extensively studied at the angular scales of interest by CMB experiments. Spectral line sources—typically referred to as interlopers—are another potential source of systematics. This is particularly true at mm-wave, where CO rotational transitions from a range of redshifts could be present at any given frequency, along with other potential lines [123, 117]. Mitigating interloper lines remains an active area of research with several methods under investigation, including masking [116, 117, 118], leveraging differential effects in projection from angular/spectral dimensions to physical space (i.e., the Alcock-Paczyński effect [124, 95, 96]), coherently removing power [114, 115], and using machine learning techniques [125, 126]. Preliminary work suggests that these methods should be highly effective in suppressing the effects and biases of interloper emission, but more effort is needed, along with validation on data from pathfinder experiments.
-
•
Instrumental systematics: Instrumental systematics can arise from a variety of mechanisms, including calibration errors, detector gain variations, and reflections in optics. Of particular concern are effects that induce frequency-dependent structure on otherwise-smooth spectral response [127, 128]. At millimeter wavelengths the atmosphere presents an additional challenge for ground-based experiments, since the telluric lines of ozone, water, oxygen, and other chemical species could imprint frequency-dependent structure in the data. Although these systematics are both site- and instrument-specific, mm-wave LIM will benefit from observational techniques developed by CMB experiments, in addition to strategies tested on pathfinder instruments [87, 129].
-
•
Modeling systematics: Realizing LIM’s full potential requires accurate theoretical models of the signal, matching the measurement sensitivity. Like galaxy redshift surveys, this requires both state-of-the art numerical simulations and analytical tools, the latter usually validated by the former. Developments on both fronts are needed for LIM observables. On the analytic side, existing models based on the halo-model framework [130, 131] require two ingredients: relating the line intensity to DM halos, and relating the halo properties to the underlying DM distribution. While the latter can be modeled accurately using perturbative models of LSS, there are large uncertainties on the former, primarily driven by lack of observational constraints [97, 132, 133, 134]. Ongoing and future LIM experiments [16, 135, 136, 137, 138, 139] will inform this poorly-constrained theory space. The combination of observational data and small-volume simulations of hydrodynamical galaxy formation and radiative transfer can be used to construct “effective” models of line luminosity, which are simple enough to be incorporated into semi-analytic simulations (based on N-body simulations) over cosmological volumes, and into analysis of future LIM data [140, 141, 142]. A consistent theoretical framework for the line emission is needed to fully take advantage of multi-line observational capability [3].
5 Conclusions
Line intensity mapping at millimeter wavelengths is a powerful tool for testing fundamental physics and cosmology by measuring large-scale structure over large volumes and at high redshift. Far-IR emission lines such as CO and [CII] trace galaxies through most of the history of the Universe, and are redshifted to the mm-wave atmospheric windows where they can be detected from the ground. Observations from proven observing sites, mapping out the Universe from , could measure an order of magnitude more primordial modes than contemporary galaxy surveys and provide transformational constraints on numerous cosmological science cases, including inflation, dark energy, dark matter, and neutrinos and relativistic species. To develop this new observational technique, we recommend support for mm-wave LIM projects as they transition from pathfinders to experiments with significant cosmological constraining power. This transition will be enabled by investments in the following technical areas:
-
•
Instrumentation: Development in mm-wave detectors, spectrometers, and readout will significantly increase instantaneous sensitivity.
-
•
Analysis: Development of techniques to mitigate astrophysical, instrumental, and modeling systematics will enable robust extraction of the cosmological signal.
All of these efforts leverage decades of investment and experience from CMB and LSS experiments in detector technology, facilities, observing strategy, and analysis.
6 Acknowledgements
We thank Adam Anderson, José Luis Bernal, Matt Bradford, Clarence Chang, Jacques Delabrouille, Dan Marrone, Gabriela Sato-Polito, Sara Simon, and Michael Zemcov for helpful comments.
Appendix A Primordial Physics Figure of Merit
To quantify the information content of the LIM power spectrum in constraining primordial physics, we calculate the primordial physics FoM as defined in [5]. We compute the linear matter power spectrum using the CLASS Boltzmann code222https://github.com/lesgourg/class_public [143], and model the nonlinear line power spectrum using redshift-space Eulerian perturbation theory at one-loop level, including the effective field-theory terms and infrared resummation, using the velocileptors package 333https://github.com/sfschen/velocileptors [144]. The line biases are computed by assuming Sheth-Tormen halo biases and co-evolution predictions as in [97]. We set the small-scale cut () according to instrument resolutions in the angular and line-of-sight directions, and further impose the cutoff of . The same large-scale cut is set as in the parameter forecasts. Instrumental noise is computed as in [17], and interlopers are accounted for as additional noise terms.
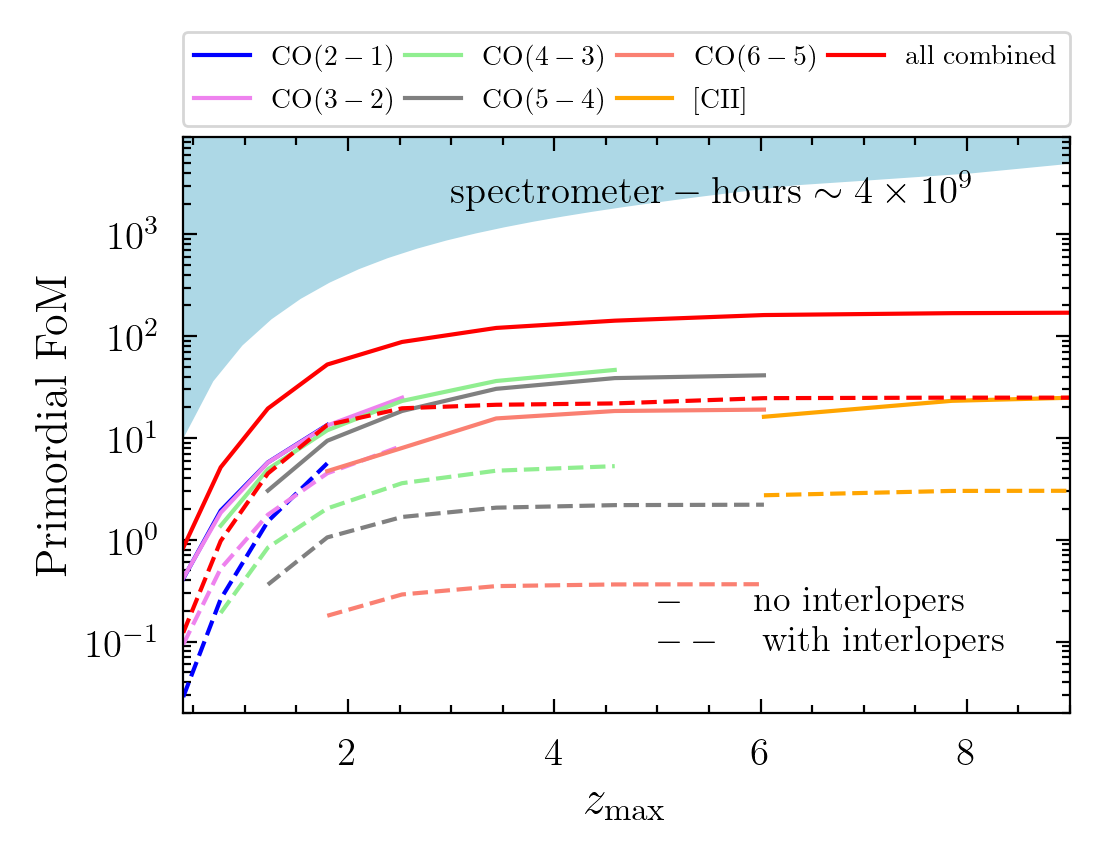
Figure 4 shows the FoM as a function of maximum observed redshift for spectrometer-hours, for each individual line and their combination. The solid and dashed lines correspond to including or neglecting the interloper lines in the noise. The blue shaded region is the cosmic variance limit for a full-sky survey. It is important to recognize that an experiment’s constraining power cannot be fully condensed in a single FoM. For instance, while the total FoM (in red) appears to saturate at high redshift, access to the high-redshift regime is particularly powerful in breaking parameter degeneracies, as illustrated by our parameter forecasts.
References
- [1] Ely D. Kovetz et al. Line-Intensity Mapping: 2017 Status Report. arXiv e-prints, page arXiv:1709.09066, September 2017. arXiv:1709.09066.
- [2] José Fonseca, Marta Silva, Mário G. Santos, and Asantha Cooray. Cosmology with intensity mapping techniques using atomic and molecular lines. Mon. Not. Roy. Astron. Soc., 464(2):1948–1965, 2017. arXiv:1607.05288, doi:10.1093/mnras/stw2470.
- [3] Guochao Sun, Brandon S. Hensley, Tzu-Ching Chang, Olivier Doré, and Paolo Serra. A Self-consistent Framework for Multiline Modeling in Line Intensity Mapping Experiments. Astrophys. J., 887(2):142, December 2019. arXiv:1907.02999, doi:10.3847/1538-4357/ab55df.
- [4] Emmanuel Schaan and Martin White. Multi-tracer intensity mapping: Cross-correlations, Line noise & Decorrelation. JCAP, 05:068, 2021. arXiv:2103.01964, doi:10.1088/1475-7516/2021/05/068.
- [5] Simone Ferraro, Noah Sailer, Anze Slosar, Martin White, et al. Snowmass2021 Cosmic Frontier White Paper: Cosmology and fundamental physics from the three-dimensional Large Scale Structure. Snowmass 2021 White Paper, 2022.
- [6] L. Pentericci, S. Carniani, M. Castellano, A. Fontana, R. Maiolino, L. Guaita, et al. Tracing the Reionization Epoch with ALMA: [C II] Emission in z 7 Galaxies. Astrophys. J., 829(1):L11, September 2016. arXiv:1608.08837, doi:10.3847/2041-8205/829/1/L11.
- [7] Françoise Combes. Molecular gas in distant galaxies from ALMA studies. Astronomy and Astrophysics, 26(1):5, August 2018. arXiv:1806.06712, doi:10.1007/s00159-018-0110-4.
- [8] E. R. Switzer, C. J. Anderson, A. R. Pullen, and S. Yang. Intensity Mapping in the Presence of Foregrounds and Correlated Continuum Emission. Astrophys. J., 872(1):82, February 2019. arXiv:1812.06223, doi:10.3847/1538-4357/aaf9ab.
- [9] CCAT-Prime collaboration, M. Aravena, J. E. Austermann, K. Basu, N. Battaglia, B. Beringue, et al. CCAT-prime Collaboration: Science Goals and Forecasts with Prime-Cam on the Fred Young Submillimeter Telescope. arXiv e-prints, page arXiv:2107.10364, July 2021. arXiv:2107.10364.
- [10] Kieran A. Cleary, Jowita Borowska, Patrick C. Breysse, Morgan Catha, Dongwoo T. Chung, Sarah E. Church, et al. COMAP Early Science: I. Overview. arXiv e-prints, page arXiv:2111.05927, November 2021. arXiv:2111.05927.
- [11] Guilaine Lagache. Exploring the dusty star-formation in the early Universe using intensity mapping. In Vibor Jelić and Thijs van der Hulst, editors, Peering towards Cosmic Dawn, volume 333, pages 228–233, May 2018. arXiv:1801.08054, doi:10.1017/S1743921318000558.
- [12] Giuseppe Cataldo, Peter Ade, Christopher Anderson, Alyssa Barlis, Emily Barrentine, Nicholas Bellis, et al. Overview and status of EXCLAIM, the experiment for cryogenic large-aperture intensity mapping. arXiv e-prints, page arXiv:2101.11734, January 2021. arXiv:2101.11734.
- [13] Garrett K. Keating, Daniel P. Marrone, Geoffrey C. Bower, and Ryan P. Keenan. An Intensity Mapping Detection of Aggregate CO Line Emission at 3 mm. Astrophys. J., 901(2):141, October 2020. arXiv:2008.08087, doi:10.3847/1538-4357/abb08e.
- [14] K. S. Karkare, A. J. Anderson, P. S. Barry, B. A. Benson, J. E. Carlstrom, T. Cecil, et al. SPT-SLIM: A Line Intensity Mapping Pathfinder for the South Pole Telescope. arXiv e-prints, page arXiv:2111.04631, November 2021. arXiv:2111.04631.
- [15] Joaquin Vieira, James Aguirre, C. Matt Bradford, Jeffrey Filippini, Christopher Groppi, Dan Marrone, et al. The Terahertz Intensity Mapper (TIM): a Next-Generation Experiment for Galaxy Evolution Studies. arXiv e-prints, page arXiv:2009.14340, September 2020. arXiv:2009.14340.
- [16] A. T. Crites, J. J. Bock, C. M. Bradford, T. C. Chang, A. R. Cooray, L. Duband, et al. The TIME-Pilot intensity mapping experiment. In Wayne S. Holland and Jonas Zmuidzinas, editors, Millimeter, Submillimeter, and Far-Infrared Detectors and Instrumentation for Astronomy VII, volume 9153 of Society of Photo-Optical Instrumentation Engineers (SPIE) Conference Series, page 91531W, August 2014. doi:10.1117/12.2057207.
- [17] Azadeh Moradinezhad Dizgah, Garrett K. Keating, Kirit S. Karkare, Abigail Crites, and Shouvik Roy Choudhury. Neutrino Properties with Ground-based Millimeter-wavelength Line Intensity Mapping. Astrophys. J., 926(2):137, 2022. arXiv:2110.00014, doi:10.3847/1538-4357/ac3edd.
- [18] Y. Akrami et al. Planck 2018 results. X. Constraints on inflation. Astron. Astrophys., 641:A10, 2020. arXiv:1807.06211, doi:10.1051/0004-6361/201833887.
- [19] Jens Chluba, Jan Hamann, and Subodh P. Patil. Features and New Physical Scales in Primordial Observables: Theory and Observation. Int. J. Mod. Phys. D, 24(10):1530023, 2015. arXiv:1505.01834, doi:10.1142/S0218271815300232.
- [20] Anze Slosar et al. Scratches from the Past: Inflationary Archaeology through Features in the Power Spectrum of Primordial Fluctuations. Bull. Am. Astron. Soc., 51(3):98, 2019. arXiv:1903.09883.
- [21] P. Daniel Meerburg et al. Primordial Non-Gaussianity. Astro2020 White Paper, 2019. arXiv:1903.04409.
- [22] G. L. Pimentel, B. Wallisch, W. L. K. Wu, et al. Inflation: Theory and Observations. Snowmass 2021 White Paper, 2022.
- [23] Florian Beutler, Matteo Biagetti, Daniel Green, Anže Slosar, and Benjamin Wallisch. Primordial Features from Linear to Nonlinear Scales. Phys. Rev. Res., 1(3):033209, 2019. arXiv:1906.08758, doi:10.1103/PhysRevResearch.1.033209.
- [24] Mario Ballardini, Fabio Finelli, Federico Marulli, Lauro Moscardini, and Alfonso Veropalumbo. New constraints on primordial features from the galaxy two-point correlation function. February 2022. arXiv:2202.08819.
- [25] Noah Sailer, Emanuele Castorina, Simone Ferraro, and Martin White. Cosmology at high redshift — a probe of fundamental physics. JCAP, 12(12):049, 2021. arXiv:2106.09713, doi:10.1088/1475-7516/2021/12/049.
- [26] Neal Dalal, Olivier Dore, Dragan Huterer, and Alexander Shirokov. The imprints of primordial non-gaussianities on large-scale structure: scale dependent bias and abundance of virialized objects. Phys. Rev. D, 77:123514, 2008. arXiv:0710.4560, doi:10.1103/PhysRevD.77.123514.
- [27] Paolo Creminelli. On non-Gaussianities in single-field inflation. JCAP, 10:003, 2003. arXiv:astro-ph/0306122, doi:10.1088/1475-7516/2003/10/003.
- [28] Mohsen Alishahiha, Eva Silverstein, and David Tong. DBI in the sky. Phys. Rev. D, 70:123505, 2004. arXiv:hep-th/0404084, doi:10.1103/PhysRevD.70.123505.
- [29] Clifford Cheung, Paolo Creminelli, A. Liam Fitzpatrick, Jared Kaplan, and Leonardo Senatore. The Effective Field Theory of Inflation. JHEP, 03:014, 2008. arXiv:0709.0293, doi:10.1088/1126-6708/2008/03/014.
- [30] Leonardo Senatore, Kendrick M. Smith, and Matias Zaldarriaga. Non-Gaussianities in Single Field Inflation and their Optimal Limits from the WMAP 5-year Data. JCAP, 01:028, 2010. arXiv:0905.3746, doi:10.1088/1475-7516/2010/01/028.
- [31] Xingang Chen, Min-xin Huang, Shamit Kachru, and Gary Shiu. Observational signatures and non-Gaussianities of general single field inflation. JCAP, 01:002, 2007. arXiv:hep-th/0605045, doi:10.1088/1475-7516/2007/01/002.
- [32] R. Holman and Andrew J. Tolley. Enhanced Non-Gaussianity from Excited Initial States. JCAP, 05:001, 2008. arXiv:0710.1302, doi:10.1088/1475-7516/2008/05/001.
- [33] Dionysios Karagiannis, Anže Slosar, and Michele Liguori. Forecasts on Primordial non-Gaussianity from 21 cm Intensity Mapping experiments. JCAP, 11:052, 2020. arXiv:1911.03964, doi:10.1088/1475-7516/2020/11/052.
- [34] Juan Martin Maldacena. Non-Gaussian features of primordial fluctuations in single field inflationary models. JHEP, 05:013, 2003. arXiv:astro-ph/0210603, doi:10.1088/1126-6708/2003/05/013.
- [35] Paolo Creminelli and Matias Zaldarriaga. Single field consistency relation for the 3-point function. JCAP, 10:006, 2004. arXiv:astro-ph/0407059, doi:10.1088/1475-7516/2004/10/006.
- [36] Daniel Baumann and Daniel Green. Equilateral Non-Gaussianity and New Physics on the Horizon. JCAP, 09:014, 2011. arXiv:1102.5343, doi:10.1088/1475-7516/2011/09/014.
- [37] Daniel Baumann, Daniel Green, and Rafael A. Porto. B-modes and the Nature of Inflation. JCAP, 01:016, 2015. arXiv:1407.2621, doi:10.1088/1475-7516/2015/01/016.
- [38] Y. Akrami et al. Planck 2018 results. IX. Constraints on primordial non-Gaussianity. Astron. Astrophys., 641:A9, 2020. arXiv:1905.05697, doi:10.1051/0004-6361/201935891.
- [39] Mehdi Rezaie et al. Primordial non-Gaussianity from the completed SDSS-IV extended Baryon Oscillation Spectroscopic Survey – I: Catalogue preparation and systematic mitigation. Mon. Not. Roy. Astron. Soc., 506(3):3439–3454, 2021. arXiv:2106.13724, doi:10.1093/mnras/stab1730.
- [40] Giovanni Cabass, Mikhail M. Ivanov, Oliver H. E. Philcox, Marko Simonović, and Matias Zaldarriaga. Constraints on Single-Field Inflation from the BOSS Galaxy Survey. January 2022. arXiv:2201.07238.
- [41] Guido D’Amico, Matthew Lewandowski, Leonardo Senatore, and Pierre Zhang. Limits on primordial non-Gaussianities from BOSS galaxy-clustering data. January 2022. arXiv:2201.11518.
- [42] Emiliano Sefusatti, Martin Crocce, and Vincent Desjacques. The Halo Bispectrum in N-body Simulations with non-Gaussian Initial Conditions. Mon. Not. Roy. Astron. Soc., 425:2903, 2012. arXiv:1111.6966, doi:10.1111/j.1365-2966.2012.21271.x.
- [43] Uros Seljak. Extracting primordial non-gaussianity without cosmic variance. Phys. Rev. Lett., 102:021302, 2009. arXiv:0807.1770, doi:10.1103/PhysRevLett.102.021302.
- [44] Julien Lesgourgues, Gianpiero Mangano, Gennaro Miele, and Sergio Pastor. Neutrino Cosmology. Cambridge University Press, 2 2013.
- [45] P. F. de Salas, D. V. Forero, C. A. Ternes, M. Tortola, and J. W. F. Valle. Status of neutrino oscillations 2018: 3 hint for normal mass ordering and improved CP sensitivity. Phys. Lett. B, 782:633–640, 2018. arXiv:1708.01186, doi:10.1016/j.physletb.2018.06.019.
- [46] Ivan Esteban, M. C. Gonzalez-Garcia, Alvaro Hernandez-Cabezudo, Michele Maltoni, and Thomas Schwetz. Global analysis of three-flavour neutrino oscillations: synergies and tensions in the determination of , , and the mass ordering. JHEP, 01:106, 2019. arXiv:1811.05487, doi:10.1007/JHEP01(2019)106.
- [47] Cora Dvorkin et al. Neutrino Mass from Cosmology: Probing Physics Beyond the Standard Model. March 2019. arXiv:1903.03689.
- [48] N. Aghanim et al. Planck 2018 results. VI. Cosmological parameters. Astron. Astrophys., 641:A6, 2020. [Erratum: Astron.Astrophys. 652, C4 (2021)]. arXiv:1807.06209, doi:10.1051/0004-6361/201833910.
- [49] Mikhail M. Ivanov, Marko Simonović, and Matias Zaldarriaga. Cosmological Parameters and Neutrino Masses from the Final Planck and Full-Shape BOSS Data. Phys. Rev. D, 101(8):083504, 2020. arXiv:1912.08208, doi:10.1103/PhysRevD.101.083504.
- [50] P. F. De Salas, S. Gariazzo, O. Mena, C. A. Ternes, and M. Tórtola. Neutrino Mass Ordering from Oscillations and Beyond: 2018 Status and Future Prospects. Front. Astron. Space Sci., 5:36, 2018. arXiv:1806.11051, doi:10.3389/fspas.2018.00036.
- [51] Martina Gerbino, Evan Grohs, Massimiliano Lattanzi, et al. Synergy between cosmological and laboratory searches in neutrino physics: a white paper. Snowmass 2021 White Paper, 2022.
- [52] Byeonghee Yu, Robert Z. Knight, Blake D. Sherwin, Simone Ferraro, Lloyd Knox, and Marcel Schmittfull. Towards Neutrino Mass from Cosmology without Optical Depth Information. September 2018. arXiv:1809.02120.
- [53] Steen Hannestad. Neutrino masses and the dark energy equation of state - Relaxing the cosmological neutrino mass bound. Phys. Rev. Lett., 95:221301, 2005. arXiv:astro-ph/0505551, doi:10.1103/PhysRevLett.95.221301.
- [54] Adrian Liu, Jonathan R. Pritchard, Rupert Allison, Aaron R. Parsons, Uroš Seljak, and Blake D. Sherwin. Eliminating the optical depth nuisance from the CMB with 21 cm cosmology. Phys. Rev. D, 93(4):043013, 2016. arXiv:1509.08463, doi:10.1103/PhysRevD.93.043013.
- [55] R. Allison, P. Caucal, E. Calabrese, J. Dunkley, and T. Louis. Towards a cosmological neutrino mass detection. Phys. Rev. D, 92(12):123535, 2015. arXiv:1509.07471, doi:10.1103/PhysRevD.92.123535.
- [56] Daniel Baumann, Daniel Green, and Matias Zaldarriaga. Phases of New Physics in the BAO Spectrum. JCAP, 11:007, 2017. arXiv:1703.00894, doi:10.1088/1475-7516/2017/11/007.
- [57] Christopher Brust, David E. Kaplan, and Matthew T. Walters. New Light Species and the CMB. JHEP, 12:058, 2013. arXiv:1303.5379, doi:10.1007/JHEP12(2013)058.
- [58] Zackaria Chacko, Yanou Cui, Sungwoo Hong, and Takemichi Okui. Hidden dark matter sector, dark radiation, and the CMB. Phys. Rev. D, 92:055033, 2015. arXiv:1505.04192, doi:10.1103/PhysRevD.92.055033.
- [59] Kevork N. Abazajian et al. CMB-S4 Science Book, First Edition. 10 2016. arXiv:1610.02743.
- [60] Cora Dvorkin, Joel Meyers, et al. The Physics of Light Relics. Snowmass 2021 White Paper, 2022.
- [61] Kevork Abazajian et al. CMB-S4 Science Case, Reference Design, and Project Plan. 7 2019. arXiv:1907.04473.
- [62] Marco Raveri, Philip Bull, Alessandra Silvestri, and Levon Pogosian. Priors on the effective Dark Energy equation of state in scalar-tensor theories. Phys. Rev. D, 96(8):083509, 2017. arXiv:1703.05297, doi:10.1103/PhysRevD.96.083509.
- [63] Dina Traykova, Emilio Bellini, Pedro G. Ferreira, Carlos García-García, Johannes Noller, and Miguel Zumalacárregui. Theoretical priors in scalar-tensor cosmologies: Shift-symmetric Horndeski models. Phys. Rev. D, 104(8):083502, 2021. arXiv:2103.11195, doi:10.1103/PhysRevD.104.083502.
- [64] Tanvi Karwal and Marc Kamionkowski. Dark energy at early times, the Hubble parameter, and the string axiverse. Phys. Rev. D, 94(10):103523, 2016. arXiv:1608.01309, doi:10.1103/PhysRevD.94.103523.
- [65] Florian Niedermann and Martin S. Sloth. New early dark energy. Phys. Rev. D, 103(4):L041303, 2021. arXiv:1910.10739, doi:10.1103/PhysRevD.103.L041303.
- [66] Matteo Braglia, William T. Emond, Fabio Finelli, A. Emir Gumrukcuoglu, and Kazuya Koyama. Unified framework for early dark energy from -attractors. Phys. Rev. D, 102(8):083513, 2020. arXiv:2005.14053, doi:10.1103/PhysRevD.102.083513.
- [67] Philip Bull, Martin White, and Anže Slosar. Searching for dark energy in the matter-dominated era. Mon. Not. Roy. Astron. Soc., 505(2):2285–2299, 2021. arXiv:2007.02865, doi:10.1093/mnras/stab1338.
- [68] Bhuvnesh Jain and Justin Khoury. Cosmological Tests of Gravity. Annals Phys., 325:1479–1516, 2010. arXiv:1004.3294, doi:10.1016/j.aop.2010.04.002.
- [69] Austin Joyce, Lucas Lombriser, and Fabian Schmidt. Dark Energy Versus Modified Gravity. Ann. Rev. Nucl. Part. Sci., 66:95–122, 2016. arXiv:1601.06133, doi:10.1146/annurev-nucl-102115-044553.
- [70] Scott Dodelson, Katrin Heitmann, Chris Hirata, Klaus Honscheid, Aaron Roodman, Uroš Seljak, et al. Cosmic Visions Dark Energy: Science. 4 2016. arXiv:1604.07626.
- [71] Mikhail M. Ivanov, Evan McDonough, J. Colin Hill, Marko Simonović, Michael W. Toomey, Stephon Alexander, et al. Constraining Early Dark Energy with Large-Scale Structure. Phys. Rev. D, 102(10):103502, 2020. arXiv:2006.11235, doi:10.1103/PhysRevD.102.103502.
- [72] J. Colin Hill, Evan McDonough, Michael W. Toomey, and Stephon Alexander. Early dark energy does not restore cosmological concordance. Phys. Rev. D, 102(4):043507, 2020. arXiv:2003.07355, doi:10.1103/PhysRevD.102.043507.
- [73] Tristan L. Smith, Vivian Poulin, José Luis Bernal, Kimberly K. Boddy, Marc Kamionkowski, and Riccardo Murgia. Early dark energy is not excluded by current large-scale structure data. Phys. Rev. D, 103(12):123542, 2021. arXiv:2009.10740, doi:10.1103/PhysRevD.103.123542.
- [74] Anatoly Klypin, Vivian Poulin, Francisco Prada, Joel Primack, Marc Kamionkowski, Vladimir Avila-Reese, et al. Clustering and Halo Abundances in Early Dark Energy Cosmological Models. Mon. Not. Roy. Astron. Soc., 504(1):769–781, 2021. arXiv:2006.14910, doi:10.1093/mnras/stab769.
- [75] Daniel Green and Surjeet Rajendran. The Cosmology of Sub-MeV Dark Matter. JHEP, 10:013, 2017. arXiv:1701.08750, doi:10.1007/JHEP10(2017)013.
- [76] Sean Tulin and Hai-Bo Yu. Dark Matter Self-interactions and Small Scale Structure. Phys. Rept., 730:1–57, 2018. arXiv:1705.02358, doi:10.1016/j.physrep.2017.11.004.
- [77] Renée Hlozek, Daniel Grin, David J. E. Marsh, and Pedro G. Ferreira. A search for ultralight axions using precision cosmological data. Phys. Rev. D, 91(10):103512, 2015. arXiv:1410.2896, doi:10.1103/PhysRevD.91.103512.
- [78] Cora Dvorkin, Kfir Blum, and Marc Kamionkowski. Constraining Dark Matter-Baryon Scattering with Linear Cosmology. Phys. Rev. D, 89(2):023519, 2014. arXiv:1311.2937, doi:10.1103/PhysRevD.89.023519.
- [79] Keith Bechtol et al. Snowmass2021 Cosmic Frontier White Paper: Dark matter physics from halo measurements. Snowmass 2021 White Paper, 2022.
- [80] Arka Banerjee et al. Snowmass2021 Cosmic Frontier Dark Matter Numerical Simulations White Paper. Snowmass 2021 White Paper, 2022.
- [81] Sukanya Chakrabarti et al. Snowmass2021 Cosmic Frontier White Paper: Observational Facilities to Study Dark Matter. Snowmass 2021 White Paper, 2022.
- [82] Jurek B. Bauer, David J. E. Marsh, Renée Hložek, Hamsa Padmanabhan, and Alex Laguë. Intensity Mapping as a Probe of Axion Dark Matter. Mon. Not. Roy. Astron. Soc., 500(3):3162–3177, 2020. arXiv:2003.09655, doi:10.1093/mnras/staa3300.
- [83] Cyril Creque-Sarbinowski and Marc Kamionkowski. Searching for decaying and annihilating dark matter with line intensity mapping. Physical Review D, 98(6):063524, September 2018. arXiv:1806.11119, doi:10.1103/PhysRevD.98.063524.
- [84] José Luis Bernal, Andrea Caputo, and Marc Kamionkowski. Strategies to detect dark-matter decays with line-intensity mapping. Physical Review D, 103(6):063523, March 2021. arXiv:2012.00771, doi:10.1103/PhysRevD.103.063523.
- [85] José Luis Bernal, Andrea Caputo, Francisco Villaescusa-Navarro, and Marc Kamionkowski. Searching for the Radiative Decay of the Cosmic Neutrino Background with Line-Intensity Mapping. Physical Review Letters, 127(13):131102, September 2021. arXiv:2103.12099, doi:10.1103/PhysRevLett.127.131102.
- [86] Ely Kovetz, Patrick C. Breysse, Adam Lidz, Jamie Bock, Charles M. Bradford, Tzu-Ching Chang, et al. Astrophysics and Cosmology with Line-Intensity Mapping. Bulletin of the AAS, 51(3):101, May 2019. arXiv:1903.04496.
- [87] Garrett K. Keating, Daniel P. Marrone, Geoffrey C. Bower, Erik Leitch, John E. Carlstrom, and David R. DeBoer. COPSS II: The Molecular Gas Content of Ten Million Cubic Megaparsecs at Redshift z 3. Astrophys. J., 830(1):34, October 2016. arXiv:1605.03971, doi:10.3847/0004-637X/830/1/34.
- [88] Shengqi Yang, Anthony R. Pullen, and Eric R. Switzer. Evidence for C II diffuse line emission at redshift z 2.6. Monthly Notices of the Royal Astronomical Society, 489(1):L53–L57, October 2019. arXiv:1904.01180, doi:10.1093/mnrasl/slz126.
- [89] Patrick C. Breysse, Shengqi Yang, Rachel S. Somerville, Anthony R. Pullen, Gergö Popping, and Abhishek S. Maniyar. On estimating the cosmic molecular gas density from CO Line Intensity Mapping observations. arXiv e-prints, page arXiv:2106.14904, June 2021. arXiv:2106.14904.
- [90] Christopher J. Anderson, Eric R. Switzer, and Patrick C. Breysse. Constraining low redshift [CII] Emission by Cross-Correlating FIRAS and BOSS Data. arXiv e-prints, page arXiv:2202.00203, January 2022. arXiv:2202.00203.
- [91] Adam Lidz, Steven R. Furlanetto, S. Peng Oh, James Aguirre, Tzu-Ching Chang, Olivier Doré, et al. Intensity Mapping with Carbon Monoxide Emission Lines and the Redshifted 21 cm Line. Astrophys. J., 741(2):70, November 2011. arXiv:1104.4800, doi:10.1088/0004-637X/741/2/70.
- [92] Michel Chevallier and David Polarski. Accelerating universes with scaling dark matter. Int. J. Mod. Phys. D, 10:213–224, 2001. arXiv:gr-qc/0009008, doi:10.1142/S0218271801000822.
- [93] Eric V. Linder. Exploring the expansion history of the universe. Phys. Rev. Lett., 90:091301, 2003. arXiv:astro-ph/0208512, doi:10.1103/PhysRevLett.90.091301.
- [94] Eric J. Baxter, Chihway Chang, Andrew Hearin, et al. Snowmass2021 Cosmic Frontier White Paper: Opportunities from Cross-survey Analyses of Static Probes. Snowmass 2021 White Paper, 2022.
- [95] Adam Lidz and Jessie Taylor. On Removing Interloper Contamination from Intensity Mapping Power Spectrum Measurements. Astrophys. J., 825:143, 2016. arXiv:1604.05737, doi:10.3847/0004-637X/825/2/143.
- [96] Yun-Ting Cheng, Tzu-Ching Chang, James Bock, C. Matt Bradford, and Asantha Cooray. Spectral Line De-confusion in an Intensity Mapping Survey. Astrophys. J., 832(2):165, 2016. arXiv:1604.07833, doi:10.3847/0004-637X/832/2/165.
- [97] Azadeh Moradinezhad Dizgah, Farnik Nikakhtar, Garrett K. Keating, and Emanuele Castorina. Precision tests of CO and [CII] power spectra models against simulated intensity maps. JCAP, 02(02):026, 2022. arXiv:2111.03717, doi:10.1088/1475-7516/2022/02/026.
- [98] J. J. A. Baselmans, J. Bueno, S. J. C. Yates, O. Yurduseven, N. Llombart, K. Karatsu, et al. A kilo-pixel imaging system for future space based far-infrared observatories using microwave kinetic inductance detectors. Astronomy and Astrophysics, 601:A89, May 2017. arXiv:1609.01952, doi:10.1051/0004-6361/201629653.
- [99] Chang Chen and Anthony R. Pullen. Removing Interlopers From Intensity Mapping Probes Of Primordial Non-Gaussianity. 10 2021. arXiv:2110.04460.
- [100] Andreu Font-Ribera, Patrick McDonald, Nick Mostek, Beth A. Reid, Hee-Jong Seo, and An Slosar. DESI and other dark energy experiments in the era of neutrino mass measurements. JCAP, 05:023, 2014. arXiv:1308.4164, doi:10.1088/1475-7516/2014/05/023.
- [101] Luca Amendola et al. Cosmology and fundamental physics with the Euclid satellite. Living Rev. Rel., 21(1):2, 2018. arXiv:1606.00180, doi:10.1007/s41114-017-0010-3.
- [102] Amir Aghamousa et al. The DESI Experiment Part I: Science,Targeting, and Survey Design. 10 2016. arXiv:1611.00036.
- [103] Andrej Obuljen, Emanuele Castorina, Francisco Villaescusa-Navarro, and Matteo Viel. High-redshift post-reionization cosmology with 21cm intensity mapping. Journal of Cosmology and Astrophysics, 2018(5):004, May 2018. arXiv:1709.07893, doi:10.1088/1475-7516/2018/05/004.
- [104] José Luis Bernal, Patrick C. Breysse, and Ely D. Kovetz. Cosmic Expansion History from Line-Intensity Mapping. Physical Review Letters, 123(25):251301, December 2019. arXiv:1907.10065, doi:10.1103/PhysRevLett.123.251301.
- [105] José Luis Bernal, Patrick C. Breysse, Héctor Gil-Marín, and Ely D. Kovetz. User’s guide to extracting cosmological information from line-intensity maps. Physical Review D, 100(12):123522, December 2019. arXiv:1907.10067, doi:10.1103/PhysRevD.100.123522.
- [106] Kirit S. Karkare and Simeon Bird. Constraining the expansion history and early dark energy with line intensity mapping. Phys. Rev. D, 98(4):043529, August 2018. arXiv:1806.09625, doi:10.1103/PhysRevD.98.043529.
- [107] Azadeh Moradinezhad Dizgah, Garrett K. Keating, and Anastasia Fialkov. Probing Cosmic Origins with CO and [CII] Emission Lines. Astrophys. J. Lett., 870(1):L4, 2019. arXiv:1801.10178, doi:10.3847/2041-8213/aaf813.
- [108] Azadeh Moradinezhad Dizgah and Garrett K. Keating. Line intensity mapping with [CII] and CO(1-0) as probes of primordial non-Gaussianity. Astrophys. J., 872(2):126, 2019. arXiv:1810.02850, doi:10.3847/1538-4357/aafd36.
- [109] R. Henry Liu and Patrick C. Breysse. Coupling parsec and gigaparsec scales: Primordial non-Gaussianity with multitracer intensity mapping. Physical Review D, 103(6):063520, March 2021. arXiv:2002.10483, doi:10.1103/PhysRevD.103.063520.
- [110] K. S. Karkare, P. S. Barry, C. M. Bradford, S. Chapman, S. Doyle, J. Glenn, et al. Full-Array Noise Performance of Deployment-Grade SuperSpec mm-Wave On-Chip Spectrometers. Journal of Low Temperature Physics, 199(3-4):849–857, February 2020. arXiv:2002.04542, doi:10.1007/s10909-020-02407-4.
- [111] Akira Endo et al. Wideband on-chip terahertz spectrometer based on a superconducting filterbank. Journal of Astronomical Telescopes, Instruments, and Systems, 5:035004, July 2019. arXiv:1901.06934, doi:10.1117/1.JATIS.5.3.035004.
- [112] Akio Taniguchi, Tom J. L. C. Bakx, Jochem J. A. Baselmans, Robert Huiting, Kenichi Karatsu, Nuria Llombart, et al. DESHIMA 2.0: development of an integrated superconducting spectrometer for science-grade astronomical observations. arXiv e-prints, page arXiv:2110.14656, October 2021. arXiv:2110.14656.
- [113] Dongwoo T. Chung. A Partial Inventory of Observational Anisotropies in Single-dish Line-intensity Mapping. Astrophys. J., 881(2):149, August 2019. arXiv:1905.00209, doi:10.3847/1538-4357/ab3040.
- [114] A. Kogut, E. Dwek, and S. H. Moseley. Spectral Confusion for Cosmological Surveys of Redshifted C II Emission. Astrophys. J., 806(2):234, June 2015. arXiv:1505.00266, doi:10.1088/0004-637X/806/2/234.
- [115] Yun-Ting Cheng, Tzu-Ching Chang, and James J. Bock. Phase-space Spectral Line Deconfusion in Intensity Mapping. Astrophys. J., 901(2):142, 2020. arXiv:2005.05341, doi:10.3847/1538-4357/abb023.
- [116] Marta B. Silva, Mário G. Santos, Asantha Cooray, and Yan Gong. Prospects for Detecting C Emission During the Epoch of Reionization. Astrophys. J., 806(2):209, 2015. arXiv:1410.4808, doi:10.1088/0004-637X/806/2/209.
- [117] Patrick C. Breysse, Ely D. Kovetz, and Marc Kamionkowski. Masking line foregrounds in intensity mapping surveys. Mon. Not. Roy. Astron. Soc., 452(4):3408–3418, 2015. arXiv:1503.05202, doi:10.1093/mnras/stv1476.
- [118] G. Sun, L. Moncelsi, M. P. Viero, M. B. Silva, J. Bock, C. M. Bradford, et al. A foreground masking strategy for [c ii] intensity mapping experiments using galaxies selected by stellar mass and redshift. The Astrophysical Journal, 856(2):107, Mar 2018. URL: http://dx.doi.org/10.3847/1538-4357/aab3e3, doi:10.3847/1538-4357/aab3e3.
- [119] Ian Lowe, Gabriele Coppi, Peter A. R. Ade, Peter C. Ashton, Jason E. Austermann, James Beall, et al. The Balloon-borne Large Aperture Submillimeter Telescope Observatory. In Society of Photo-Optical Instrumentation Engineers (SPIE) Conference Series, volume 11445 of Society of Photo-Optical Instrumentation Engineers (SPIE) Conference Series, page 114457A, December 2020. arXiv:2012.01376, doi:10.1117/12.2576146.
- [120] Peter Ade, James Aguirre, Zeeshan Ahmed, Simone Aiola, Aamir Ali, David Alonso, et al. The Simons Observatory: science goals and forecasts. Journal of Cosmology and Astrophysics, 2019(2):056, February 2019. arXiv:1808.07445, doi:10.1088/1475-7516/2019/02/056.
- [121] Kevork Abazajian, Graeme Addison, Peter Adshead, Zeeshan Ahmed, Steven W. Allen, David Alonso, et al. CMB-S4 Science Case, Reference Design, and Project Plan. arXiv e-prints, page arXiv:1907.04473, July 2019. arXiv:1907.04473.
- [122] E. R. Switzer, C. J. Anderson, A. R. Pullen, and S. Yang. Intensity mapping in the presence of foregrounds and correlated continuum emission. The Astrophysical Journal, 872(1):82, feb 2019. URL: https://doi.org/10.3847/1538-4357/aaf9ab, doi:10.3847/1538-4357/aaf9ab.
- [123] M. Righi, C. Hernández-Monteagudo, and R. A. Sunyaev. Carbon monoxide line emission as a CMB foreground: tomography of the star-forming universe with different spectral resolutions. Astronomy and Astrophysics, 489(2):489–504, October 2008. arXiv:0805.2174, doi:10.1051/0004-6361:200810199.
- [124] C. Alcock and B. Paczynski. An evolution free test for non-zero cosmological constant. Nature, 281:358, October 1979. doi:10.1038/281358a0.
- [125] Kana Moriwaki, Nina Filippova, Masato Shirasaki, and Naoki Yoshida. Deep learning for intensity mapping observations: component extraction. Monthly Notices of the Royal Astronomical Society, 496(1):L54–L58, July 2020. arXiv:2002.07991, doi:10.1093/mnrasl/slaa088.
- [126] Kana Moriwaki and Naoki Yoshida. Deep-learning Reconstruction of Three-dimensional Galaxy Distributions with Intensity Mapping Observations. Astrophys. J., 923(1):L7, December 2021. arXiv:2110.05755, doi:10.3847/2041-8213/ac3cc0.
- [127] Garrett K. Keating, Geoffrey C. Bower, Daniel P. Marrone, David R. DeBoer, Carl Heiles, Tzu-Ching Chang, et al. First Results from COPSS: The CO Power Spectrum Survey. Astrophys. J., 814(2):140, December 2015. arXiv:1510.06744, doi:10.1088/0004-637X/814/2/140.
- [128] N. Barry, B. Hazelton, I. Sullivan, M. F. Morales, and J. C. Pober. Calibration requirements for detecting the 21 cm epoch of reionization power spectrum and implications for the SKA. Monthly Notices of the Royal Astronomical Society, 461(3):3135–3144, 06 2016. URL: https://doi.org/10.1093/mnras/stw1380, arXiv:https://academic.oup.com/mnras/article-pdf/461/3/3135/8106921/stw1380.pdf, doi:10.1093/mnras/stw1380.
- [129] Marie K. Foss, Håvard T. Ihle, Jowita Borowska, Kieran A. Cleary, Hans Kristian Eriksen, Stuart E. Harper, et al. COMAP Early Science: III. CO Data Processing. arXiv e-prints, page arXiv:2111.05929, November 2021. arXiv:2111.05929.
- [130] Uros Seljak. Analytic model for galaxy and dark matter clustering. Mon. Not. Roy. Astron. Soc., 318:203, 2000. arXiv:astro-ph/0001493, doi:10.1046/j.1365-8711.2000.03715.x.
- [131] Asantha Cooray and Ravi K. Sheth. Halo Models of Large Scale Structure. Phys. Rept., 372:1–129, 2002. arXiv:astro-ph/0206508, doi:10.1016/S0370-1573(02)00276-4.
- [132] John Joseph M. Carrasco, Mark P. Hertzberg, and Leonardo Senatore. The Effective Field Theory of Cosmological Large Scale Structures. JHEP, 09:082, 2012. arXiv:1206.2926, doi:10.1007/JHEP09(2012)082.
- [133] Valentin Assassi, Daniel Baumann, Daniel Green, and Matias Zaldarriaga. Renormalized Halo Bias. JCAP, 08:056, 2014. arXiv:1402.5916, doi:10.1088/1475-7516/2014/08/056.
- [134] Leonardo Senatore and Matias Zaldarriaga. The IR-resummed Effective Field Theory of Large Scale Structures. JCAP, 02:013, 2015. arXiv:1404.5954, doi:10.1088/1475-7516/2015/02/013.
- [135] G. Lagache, M. Cousin, and M. Chatzikos. The [cii] 158 micrometer line emission in high-redshift galaxies. Astronomy & Astrophysics, 609:A130, Jan 2018. URL: http://dx.doi.org/10.1051/0004-6361/201732019, doi:10.1051/0004-6361/201732019.
- [136] Manuel Aravena et al. The CCAT-Prime Submillimeter Observatory. 9 2019. arXiv:1909.02587.
- [137] Asantha Cooray, Tzu-Ching Chang, Stephen Unwin, Michael Zemcov, Andrew Coffey, Patrick Morrissey, et al. Cdim: Cosmic dawn intensity mapper final report, 2019. arXiv:1903.03144.
- [138] Thomas M. Essinger-Hileman, Trevor M. Oxholm, Gage L. Siebert, Peter A. Ade, Christopher J. Anderson, Alyssa Barlis, et al. Optical design of the experiment for cryogenic large-aperture intensity mapping (exclaim). Millimeter, Submillimeter, and Far-Infrared Detectors and Instrumentation for Astronomy X, Dec 2020. URL: http://dx.doi.org/10.1117/12.2576254, doi:10.1117/12.2576254.
- [139] Kieran A. Cleary et al. COMAP Early Science: I. Overview. 11 2021. arXiv:2111.05927.
- [140] T. K. Daisy Leung, Karen P. Olsen, Rachel S. Somerville, Romeel Davé, Thomas R. Greve, Christopher C. Hayward, et al. Predictions of the l [c ii]–sfr and [cii] luminosity function at the epoch of reionization. The Astrophysical Journal, 905(2):102, Dec 2020. URL: http://dx.doi.org/10.3847/1538-4357/abc25e, doi:10.3847/1538-4357/abc25e.
- [141] Shengqi Yang, Rachel S. Somerville, Anthony R. Pullen, Gergö Popping, Patrick C. Breysse, and Abhishek S. Maniyar. Multitracer Cosmological Line Intensity Mapping Mock Light-cone Simulation. Astrophys. J., 911(2):132, 2021. arXiv:2009.11933, doi:10.3847/1538-4357/abec75.
- [142] Rahul Kannan, Aaron Smith, Enrico Garaldi, Xuejian Shen, Mark Vogelsberger, Rüdiger Pakmor, et al. The THESAN project: predictions for multi-tracer line intensity mapping in the Epoch of Reionization. November 2021. arXiv:2111.02411.
- [143] Diego Blas, Julien Lesgourgues, and Thomas Tram. The Cosmic Linear Anisotropy Solving System (CLASS) II: Approximation schemes. JCAP, 07:034, 2011. arXiv:1104.2933, doi:10.1088/1475-7516/2011/07/034.
- [144] Shi-Fan Chen, Zvonimir Vlah, and Martin White. Consistent Modeling of Velocity Statistics and Redshift-Space Distortions in One-Loop Perturbation Theory. JCAP, 07:062, 2020. arXiv:2005.00523, doi:10.1088/1475-7516/2020/07/062.