Magnetic-field and pressure phase diagram of the triangular lattice antiferromagnet CsCuCl3 clarified by magnetic susceptibility measured with a proximity detector oscillator
Abstract
The effect of pressure () on magnetic susceptibility of CsCuCl3 was examined in magnetic fields () of up to 51 T using a proximity detector oscillator (PDO), and the - phase diagram of CsCuCl3 was constructed over the saturation field (). We found that, with increasing , increases and the uud-phase that appeared at = 0.7 GPa widened. Based on comparison between the experimental and calculated - phase diagrams, the Y-phase was predicted to appear above 1.7 GPa. The interchain antiferromagnetic exchange interaction in the -plane was evaluated and found to increase with increasing , which is consistent with a previous study under high pressure [D. Yamamoto et al., Nat. Commun. 12, 4263 (2021).]. Moreover, an anomaly was observed below = 0.6 GPa just below and might be a new phase transition derived from nonlinear response caused by the PDO technique.
I Introduction
Geometrically frustrated magnets have been studied over the past several decades owing to a rich variety of exotic physical phenomena Anderson (1973); Balents (2010). One of the most typical geometrically frustrated magnets is the two-dimensional triangular lattice antiferromagnet (TLA) Starykh (2015). The ground state infinitely degenerates in magnetic fields, and a small perturbation, such as easy-plane anisotropy, lifts the degeneracy and stabilizes the one-energy state Yamamoto et al. (2014), for example, an umbrella spin structure in low-magnetic fields normal to the easy plane. For classical spin systems, extensive theoretical studies have been conducted Kawamura and Miyashita (1985); Chubukov and Golosov (1991); Seabra et al. (2011), and one of the experimental realizations is RbFe(MoO4)2 Inami et al. (1996); Smirnov et al. (2007). When spins are small, quantum fluctuations play an important role in lifting degeneracy in some cases. For TLAs, the up-up-down (uud) state, which corresponds to a magnetization plateau at one-third of the saturation magnetization, is an exotic ground state Kawamura and Miyashita (1985); Chubukov and Golosov (1991); Seabra et al. (2011); Sakai and Nakano (2011); Coletta et al. (2016) caused by the order-by-disorder mechanism Henley (1989) in magnetic fields. To date, Cs2CuBr4 Tanaka et al. (2002); Ono et al. (2003, 2004) (not equilateral) and Ba3CoSb2O9 Shirata et al. (2012); Susuki et al. (2013) are known to exhibit the uud ground state of = 1/2 TLAs in magnetic fields.
CsCuCl3 has been studied for a long time as one of ABX3 compounds Achiwa (1969). It is a TLA compound formed by ferromagnetic chains and exhibits a quantum phase transition in magnetic fields Nojiri et al. (1988); Nikuni and Shiba (1993). The crystal structure of CsCuCl3 at room temperature is hexagonal with a space group 6122 or 6522 Wells (1947); Schlueter et al. (1966). Magnetic Cu2+ ions of CsCuCl3 with = 1/2 form a helical chain structure with a sixfold periodicity along the -direction and triangular lattices in the -plane. The spin Hamiltonian for CsCuCl3 in magnetic fields Nikuni and Shiba (1993) is given by,
| (1) | |||||
where represents a spin located at the -th site in the -th -plane, and the summation is taken over all nearest-neighbor pairs in the -th -plane. The -axis is assumed to be parallel to the -axis. The first and second terms are the intrachain ferromagnetic exchange (exchange constant ) and interchain antiferromagnetic exchange (exchange constant ) interactions, respectively. ( 0) represent a weak anisotropic exchange ratio for the easy plane. The third term represents the Dzyaloshinskii-Moriya (DM) interaction where n,n+1 represents the DM vector between adjacent spins in the -th and (+1)-th -planes. The fourth term is the Zeeman energy. and are the -factors for the -axis and Bohr magneton, respectively.
The intrachain and interchain exchange constants were evaluated based on the following analyses: /kB = 24 3 K and /kB = 3.8 1 K from magnetic susceptibilities Tazuke et al. (1981), /kB = 28 K and /kB = 4.9 K from electron spin resonance (ESR) excitation modes for Tanaka et al. (1992), and /kB = 28 K (2.4 meV) and /kB = 4.6 K (0.4 meV) from inelastic neutron scattering data Mekata et al. (1995). The Cu spins exhibited a 120∘ spin structure in the -plane below the Nel temperature = 10.7 K Adachi et al. (1980); Weber et al. (1996). The Cu chain structure along the -axis allows DM interaction with a uniform vector pointing in the chain direction (/kB = 5.1 K Tanaka et al. (1992) or 5.8 K Mekata et al. (1995)) owing to the chiral crystal structure Adachi et al. (1980); Kousaka et al. (2009). Below , the nearest-neighbor spins along the -axis were rotated with a pitch angle of = 5.1 0.1∘ in the -plane Adachi et al. (1980). In the following analysis of our experimental data, we used the parameter values obtained by the analysis of ESR excitation modes Tanaka et al. (1992): /kB = 28 K and /kB = 4.9 K, and /kB = 5.1 K .
The magnetization () of CsCuCl3 for at 1.1 K increased almost linearly and showed a jump at 12.5 T, then increased again and saturated at 31 T Nojiri et al. (1988). Nikuni and Shiba interpreted the magnetization process of CsCuCl3 for Nikuni and Shiba (1993) using the spin Hamiltonian (Eq.(1)). They eliminated the asymmetric part from the Hamiltonian by rotating the -plane with pitch = tan-1 (/2 (1 + )). Thereafter, the spin Hamiltonian can be simply rewritten as:
| (2) | |||||
where = . They defined the easy-plane anisotropy as,
| (3) |
Thereafter, the value of saturation field is given by,
| (4) |
They interpreted that the jump in of CsCuCl3 for was caused by the quantum phase transition from the umbrella to 2-1 coplanar phase. Their theoretical predictions were confirmed by neutron diffraction Mino et al. (1994) in magnetic fields.
The application of high pressure is a powerful method that can alter the magnetic properties of a material by shrinking its crystal lattice. As for TLAs, magnetic anisotropy and the exchange interaction between magnetic ions vary through the change in distance and angle between the neighboring magnetic ions through intervening nonmagnetic ions by applying pressure. For the anisotropic TLA Cs2CuCl4, the appearance of a number of field-induced magnetic phase transitions upon pressure application have been reported, accompanied by an increase in the exchange coupling ratio /, where and are the exchange interactions on the horizontal and diagonal bonds in the spatially anisotropic triangular lattice, respectively Zvyagin et al. (2019).
Sera et al. Sera et al. (2017) performed magnetization measurements of CsCuCl3 at 1.4 K in magnetic fields (0 up to 15 T) along the -axis under high pressure ( up to 0.9 GPa) and observed the magnetization plateau with 0.34 B/Cu2+ under 0.68 GPa, which corresponds to the uud phase in . Hosoi et al. tried to explain the magnetization under high pressure by assuming that was sensitive to pressure Hosoi et al. (2018). They constructed the magnetic phase diagram of CsCuCl3 at 0 K under pressure by calculating the spin Hamiltonian based on spin-wave theory with ( = 0.07 at ambient pressure) as a variable of pressure. decreased with increasing pressure, and the uud and Y coplanar phases under high pressure ( 0.06) were predicted to appear with the fixed parameters of and . Yamamoto et al. demonstrated theoretically that the ratio of to reduces with pressure, and then the uud and Y coplanar phases appeared under 0.75 GPa, corresponding to the results of magnetic measurement of CsCuCl3 under high pressure up to 1.21 GPa in magnetic fields of up to 5 T Yamamoto et al. (2021). In both theories, the change in the ratio of to was important for the appearance of the field- and pressure-induced magnetic phases. A quantitative comparison of the - phase diagram of CsCuCl3 requires under high pressure which was directly estimated from . Therefore, in this study, we investigated the pressure dependence of the entire magnetization process of CsCuCl3 over the saturation field using a proximity detector oscillator (PDO) system.
The remainder of this study is organized as follows. In Section 2, the sample preparation of single crystals of CsCuCl3, experimental methods and conditions are described. The experimental results of the pressure dependence of magnetic susceptibility up to 1.72 GPa and the magnetic-field () versus pressure () phase diagram obtained experimentally are presented in Section 3. In Section 4, the constructed - phase diagram is compared with the calculated phase diagram by Hosoi et al. Hosoi et al. (2018). The similarities and differences between them are discussed. Finally, the origin of the anomaly observed immediately below the saturation field in the -direction is discussed, followed by a summary of this study.
II Experimental
Single crystals of CsCuCl3 were grown by evaporating an aqueous solution containing equimolar amounts of CsCl and CuCl22H2O. Pulsed magnetic fields of up to 51 T with a pulse duration of 35 ms were generated using a nondestructive pulse magnet at AHMF at Osaka University. High-field magnetization measurements were performed using an induction method with a pick-up coil at temperatures down to 1.4 K at ambient pressure. A PDO system Altarawneh et al. (2009) was utilized to measure the change in the PDO resonance frequency (), which corresponded to the field change of the magnetization (/), namely magnetic susceptibility, in a magnetic insulator, as explained below, under high pressures of up to 1.72 GPa. When the magnetic insulator was placed inside the sensor coil of the LC tank circuit, the change in in the magnetic field was proportional to / Ghannadzadeh et al. (2011). In this study, we used a NiCrAl piston cylinder-type pressure cell (PCC) with the inner and outer diameters of 2.0 and 8.6 mm, respectively, and the pressure medium Daphne 7373 oil (Idemitsu Kosan Co.,Ltd.). The pressure in the sample space was calibrated using the change in the superconducting transition temperature of Sn Smith and Chu (1967). A large field sweep rate of pulsed magnetic fields induced the Joule heating caused by eddy currents generated in a conducting material. Based on our preliminary experiments, we found that the temperature in the sample space changed slightly until approximately 6.5 ms (approximately 40 T in the ascending process when the maximum field was 51 T) from the start of magnetic-field generation.
III Experimental Results
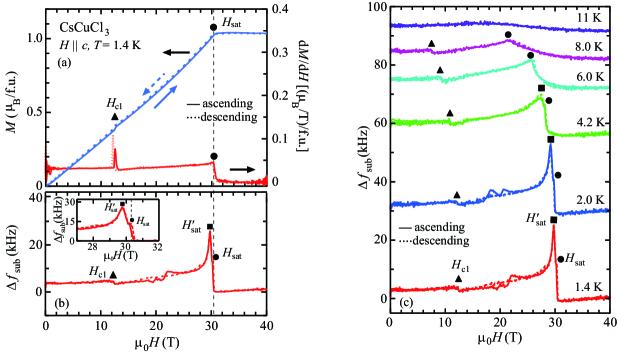
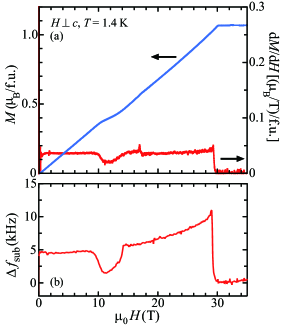
Figure 1(a) shows the magnetization () and its field derivative (d/d) of CsCuCl3 for at 1.4 K under ambient pressure. A small jump at = 12.5 T in , which corresponds to a peak in d/d, indicates the phase transition from the umbrella to 2-1 coplanar phase. A small hysteresis in and d/d was observed around , indicating a first-order phase transition, and was saturated at = 30.2 T. These features were consistent with those in a previous study Nojiri et al. (1988). Figure 1(b) shows the change in PDO resonance frequency versus the applied field (sub- ) curves of CsCuCl3 for at 1.4 K under ambient pressure. The value was obtained by subtracting the PDO frequency at = 20 K as the background from that at each temperature. The - curve at 1.4 K under ambient pressure indicates shoulders at and , and a sharp peak at = 29.8 T, just below (Fig.1 (b) inset). An anomaly between 18 and 24 T in the field-ascending process was observed below 4.2 K, when the applied magnetic field went beyond , but the field range of the anomaly depends on the maximum applied field. The reason for this observation is currently unclear. The temperature dependence of the sub- curve under ambient pressure is shown in Fig.1 (c). The shoulder at shifted to a lower field with increasing temperature and disappeared above (=10.7 K). With increasing temperature, the shoulder at and the sharp peak at shifted together to a lower magnetic field, merged above 6.0 K and disappeared above . may appear because of a magnetic phase transition caused by the AC response (MHz region) in the PDO measurements. In comparison, pulsed-field magnetization measurement was the low-frequency AC response at approximately 25 Hz and no sharp peak at in d/d was observed with the conventional method.
In the and d/d curves for at 1.4 K under ambient pressure (Fig. 2 (a)), a plateau-like anomaly in , which corresponds to a dip in d/d, was observed between 10 and 14 T, and the was saturated at = 29.3 T. Figure 2(b) exhibits the sub- curve for at 1.4 K under ambient pressure. A dip between 10 and 14 T and a peak at were observed. The sharp peak just below seen in the sub- curves for was not observed in the sub- curve for .
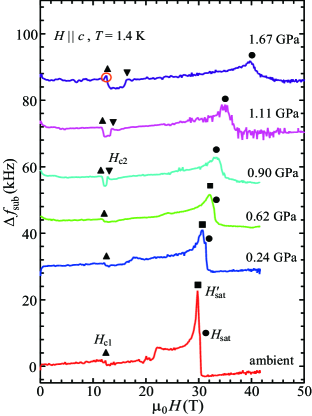
The pressure dependence of the sub- curves of CsCuCl3 for at 1.4 K is shown in Fig. 3. The position of did not change significantly under 0.90 GPa. However, the shoulder at changed its structure to a dip with two shoulders when 0.90 GPa. We define the low and high transition fields as and , respectively. was nearly constant with increasing pressure even above 0.90 GPa. Contrarily, shifted to a higher magnetic field with increasing pressure above 0.90 GPa. The dip between and is suggested to be the uud phase reported in a previous study Nojiri et al. (1988). The anomaly between 18 and 24 T at ambient pressure shifted to a lower magnetic field with increasing pressure and disappeared under 0.62 GPa. The and shifted together to a higher magnetic field with increasing pressure, and merged into one peak or broaden to form one peak at 0.90 GPa. The increase in indicates an increase in the antiferromagnetic interaction in the -plane of CsCuCl3, which may be caused by the shrinkage of the lattice in the -plane of CsCuCl3 under pressure Christy et al. (1994).
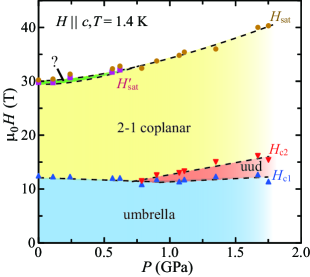
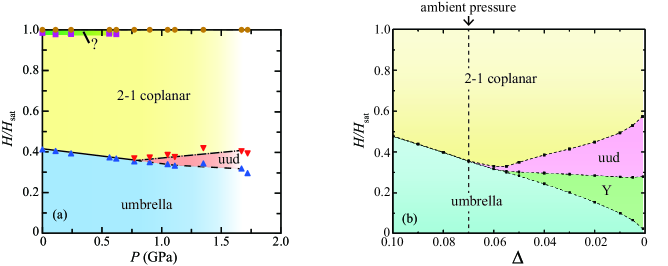
The magnetic field () versus the pressure phase diagram of CsCuCl3 for at 1.4 K is shown in Fig. 4. The pressure dependence of is well-fitted by the equation = 30.2 + 2.14 + 2.14. is mainly determined by the antiferromagnetic exchange interaction in the -plane, as shown in Eq. (4). The field range of the uud phase between and expanded to a high-magnetic-field side with increasing pressure. The dashed lines extrapolated to the lower side from and intersect at approximately 0.7 GPa, which is in good agreement with the appearance of a magnetic plateau in above 0.68 GPa in statice fields observed by Sera et al. Sera et al. (2017). The green magnetic phase near the saturation field in Fig. 4 is discussed in the next section.
IV Discussion
IV.1 Magnetic field () vs. pressure () phase diagram
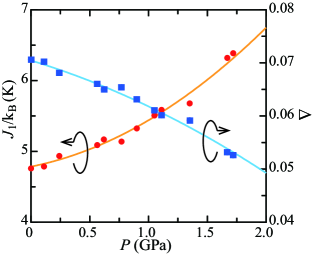
We determined the interchain exchange constant and anisotropy parameter from Eqs. (3) and (4), where the ferromagnetic intrachain exchange constant /kB = 28 K and = 1.012 were fixed under pressure, and ( 0) is the interchain antiferromagnetic exchange constant, as defined in the introduction. Figure 5 shows the pressure dependence of and . The interchain exchange constant (/kB = 4.8 K at ambient pressure) was obtained from the saturation field, which is almost the same as that in Ref. [Tanaka et al., 1992]. increased with increasing pressure, whereas decreased. The /kB and were evaluated to be 6.4 K and 0.053 under the maximum pressure = 1.72 GPa, respectively. In the pressure range of this study, decreased from 0.070 to 0.053 (4 18). depended strongly on , as shown in Eq. (4), because the change in under pressure was quite small. Therefore, the pressure dependence of did not change much in both cases of /kB = constant and /kB = 28.45 - 10.49 reported in Ref. [Yamamoto et al., 2021] . The magnetic-field normalized by the versus pressure phase diagram of CsCuCl3 is shown in Fig. 6(a). The similar calculated phase diagram by Hosoi et al. Hosoi et al. (2018) is depicted in Fig. 6(b).The pressure dependences of / and / qualitatively agree with the calculation Hosoi et al. (2018), and similar results were obtained by Yamamoto et al. Yamamoto et al. (2021). The emergence of the Y coplanar phase was expected at 0.05 and / 0.3, as shown in Fig. 6 (b). In the sub- curves for at 1.4 K under = 1.67 GPa, a small peak indicated by a red circle at corresponds to the transition field from the umbrella to predicted Y coplanar phase Hosoi et al. (2018). The Y phase was expected to appear below / = 0.3 in Ref. [Hosoi et al., 2018] (Fig. 6 (b)), but the experimentally observed / was approximately 0.3 at the maximum pressure in this study. Therefore, we plan to perform PDO measurements at pressures above 1.72 GPa. A crystal structural phase transition in CsCuCl3, however, was predicted at pressures between 1.65 and 3.1 GPa Christy et al. (1994), and this transition may hinder the appearance of the Y-phase.
IV.2 The anomaly just below the saturation field
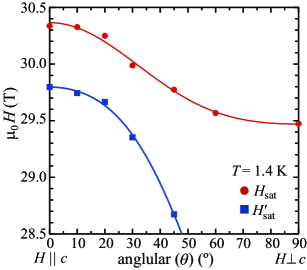
The peak at observed in the sub- curve for did not appear in the case of . The angular dependences of and are shown in Fig. 7, where is the angle between the applied magnetic field and -axis. shifted gradually to a lower magnetic field with increasing. , but shifted abruptly to a lower magnetic field with increasing until = 45∘, and then disappeared at 45∘. The angle dependences of and were fitted by the equations = cos2 + cos4 + and = ′cos2 + ′cos4 + ′(, , , ′, ′ and ′ are fitting parameters). The following parameter values were obtained from the fittings: = 0.448, = 0.078, = 29.8, ′ = 1.69, ′ = -0.280, and ′ = 28.4. In both cases, the coefficients of cos2 were dominant, although their magnitudes were largely different.
In the d/d curve of the triangular lattice antiferromagnet NiBr2Katsumata et al. (1983), a sharp peak, which corresponds to the antiferro-fan transition, was observed just below the saturation field. If the peak at indicates a magnetic transition from the 2-1 coplanar to fan phase, it should be observed in conventional magnetization measurements of CsCuCl3. However, no anomaly at was observed in the and d/d curves (Fig. 1(a)).
Why was the anomaly observed in the PDO measurements? In the PDO measurements, / in the insulating sample CsCuCl3 was taken as in high-frequency response (of the order of ten mega-hertz). The high-frequency response in magnetic fields may give rise to a nonlinear magnetic response owing to the third-harmonic component of in the AC magnetic susceptibility measurements ( in the AC magnetic measurements is given by () = 0 + + + ). To clarify this interpretation, AC magnetic susceptibility measurements of CsCuCl3 in high magnetic fields are required.
V Summary
We experimentally performed magnetic measurements of single-crystal samples of CsCuCl3 in pulsed-high magnetic fields under high pressure using the PDO technique. We succeeded in measuring the shift of the PDO frequency that corresponds to the field derivation of magnetization over the saturation field, and clarified the pressure dependence of and . The magnetic field versus pressure phase diagram of CsCuCl3 constructed from the experimental results agrees qualitatively with that obtained by theoretical calculations Hosoi et al. (2018); Yamamoto et al. (2021).The anomaly just below the saturation field for at 1.4 - 4.2 K was observed in the PDO measurements and not in the conventional magnetization measurements. This anomaly may correspond to the transition field caused by the nonlinear AC magnetic response in PDO measurements.
Acknowledgements.
We thank T. Sakurai, D. Yamamoto and T. Takeuchi for the fruitful discussion on the magnetism of CsCuCl3 under pressure. We would like to thank Editage (www. editage.com) for English language editing. This study was financially supported by the Sasakawa Scientific Research Grant from The Japan Science Society and Osaka University Fellowship: “Super Hierarchical Materials Science Program”.This study was also supported by JSPS KAKENHI (Grant Nos JP17H06137, JP17K18758, JP21H01035, JP19H00648, 25220803) and JSPS Core-to-Core Program, A. Advanced Research Networks.References
- Anderson (1973) P. W. Anderson, Materials Research Bulletin 8, 153 (1973).
- Balents (2010) L. Balents, Nature 464, 199 (2010).
- Starykh (2015) O. A. Starykh, Rep. Prog. Phys. 78, 052502 (2015).
- Yamamoto et al. (2014) D. Yamamoto, G. Marmorini, and I. Danshita, Phys. Rev. Lett. 112, 127203 (2014).
- Kawamura and Miyashita (1985) H. Kawamura and S. Miyashita, J. Phys. Soc. Jpn. 54, 4530 (1985).
- Chubukov and Golosov (1991) A. V. Chubukov and D. I. Golosov, J. Phys.: Condens. Matter 3, 69 (1991).
- Seabra et al. (2011) L. Seabra, T. Momoi, P. Sindzingre, and N. Shannon, Phys. Rev. B 84, 214418 (2011).
- Inami et al. (1996) T. Inami, Y. Ajiro, and T. Goto, J. Phys. Soc. Jpn. 65, 2374 (1996).
- Smirnov et al. (2007) A. I. Smirnov, H. Yashiro, S. Kimura, M. Hagiwara, Y. Narumi, K. Kindo, A. Kikkawa, K. Katsumata, A. Y. Shapiro, and L. N. Demianets, Phys. Rev. B 75, 134412 (2007).
- Sakai and Nakano (2011) T. Sakai and H. Nakano, Phys. Rev. B 83, 100405 (2011).
- Coletta et al. (2016) T. Coletta, T. A. Tóth, K. Penc, and F. Mila, Phys. Rev. B 94, 075136 (2016).
- Henley (1989) C. L. Henley, Phys. Rev. Lett. 62, 2056 (1989).
- Tanaka et al. (2002) H. Tanaka, T. Ono, H. A. Katori, H. Mitamura, F. Ishikawa, and T. Goto, Prog. Theor. Phys. Suppl. 145, 101 (2002).
- Ono et al. (2003) T. Ono, H. Tanaka, H. A. Katori, F. Ishikawa, H. Mitamura, and T. Goto, Phys. Rev. B 67, 104431 (2003).
- Ono et al. (2004) T. Ono, H. Tanaka, O. Kolomiyets, H. Mitamura, T. Goto, K. Nakajima, A. Oosawa, Y. Koike, K. Kakurai, J. Klenke, P. Smeibidle, and M. Meißner, J. Phys.: Condens. Matter 16, S773 (2004).
- Shirata et al. (2012) Y. Shirata, H. Tanaka, A. Matsuo, and K. Kindo, Phys. Rev. Lett. 108, 057205 (2012).
- Susuki et al. (2013) T. Susuki, N. Kurita, T. Tanaka, H. Nojiri, A. Matsuo, K. Kindo, and H. Tanaka, Phys. Rev. Lett. 110, 267201 (2013).
- Achiwa (1969) N. Achiwa, J. Phys. Soc. Jpn. 27, 561 (1969).
- Nojiri et al. (1988) H. Nojiri, Y. Tokunaga, and M. Motokawa, J. Phys. Colloques 49, C8 (1988).
- Nikuni and Shiba (1993) T. Nikuni and H. Shiba, J. Phys. Soc. Jpn. 62, 3268 (1993).
- Wells (1947) A. F. Wells, J. Chem. Soc. , 1662 (1947).
- Schlueter et al. (1966) A. W. Schlueter, R. A. Jacobson, and R. E. Rundle, Inorg. Chem. 5, 277 (1966).
- Tazuke et al. (1981) Y. Tazuke, H. Tanaka, K. Iio, and K. Nagata, J. Phys. Soc. Jpn. 50, 3919 (1981).
- Tanaka et al. (1992) H. Tanaka, U. Schotte, and K. D. Schotte, J. Phys. Soc. Jpn. 61, 1344 (1992).
- Mekata et al. (1995) M. Mekata, Y. Ajiro, T. Sugino, A. Oohara, K. Ohara, S. Yasuda, Y. Oohara, and H. Yoshizawa, J. Magn. Magn. Matter 140, 1987 (1995).
- Adachi et al. (1980) K. Adachi, N. Achiwa, and M. Mekata, J. Phys. Soc. Jpn. 49, 545 (1980).
- Weber et al. (1996) H. B. Weber, T. Werner, J. Wosnitza, H. v. Löhneysen, and U. Schotte, Phys. Rev. B 54, 15924 (1996).
- Kousaka et al. (2009) Y. Kousaka, H. Ohsumi, T. Komesu, T. Arima, M. Takata, S. Sakai, M. Akita, K. Inoue, T. Yokobori, Y. Nakao, E. Kaya, and J. Akimitsu, J. Phys. Soc. Jpn. 78, 123601 (2009).
- Mino et al. (1994) M. Mino, K. Ubukata, T. Bokui, M. Arai, H. Tanaka, and M. Motokawa, Physica B: Condens. Matter 201, 213 (1994).
- Zvyagin et al. (2019) S. A. Zvyagin, D. Graf, T. Sakurai, S. Kimura, H. Nojiri, J. Wosnitza, H. Ohta, T. Ono, and H. Tanaka, Nat. Commun. 10, 1064 (2019).
- Sera et al. (2017) A. Sera, Y. Kousaka, J. Akimitsu, M. Sera, and K. Inoue, Phys. Rev. B 96, 014419 (2017).
- Hosoi et al. (2018) M. Hosoi, H. Matsuura, and M. Ogata, J. Phys. Soc. Jpn. 87, 075001 (2018).
- Yamamoto et al. (2021) D. Yamamoto, T. Sakurai, R. Okuto, S. Okubo, H. Ohta, H. Tanaka, and Y. Uwatoko, Nat. Commun. 12, 4263 (2021).
- Altarawneh et al. (2009) M. M. Altarawneh, C. H. Mielke, and J. S. Brooks, Rev. Sci. Instrum. 80, 066104 (2009).
- Ghannadzadeh et al. (2011) S. Ghannadzadeh, M. Coak, I. Franke, P. A. Goddard, J. Singleton, and J. L. Manson, Rev. Sci. Instrum. 82, 113902 (2011).
- Smith and Chu (1967) T. F. Smith and C. W. Chu, Phys. Rev. 159, 353 (1967).
- Christy et al. (1994) A. G. Christy, R. J. Angel, J. Haines, and S. M. Clark, J. Phys.: Condens. Matter 6, 3125 (1994).
- Katsumata et al. (1983) K. Katsumata, K. Sugiyama, and M. Date, J. Phys. Soc. Jpn. 52, 3312 (1983).