Supplementary Material for ACID: Action-Conditional Implicit Visual Dynamics for Deformable Object Manipulation
In this supplementary document, we provide detailed definitions for all evaluation metrics for geometry prediction, dynamics prediction, correspondence evaluation, ranking evaluation, and plan execution evaluation (Section I). Additional qualitative results for comparison with existing action-conditional visual dynamics models can be found in Section II. Additional action sequence roll-outs for our ACID model can be found in Section III.
I Metrics
In this section, we provide the formal definitions of the metrics that we use for evaluation. We define mIoU for geometry evaluation; vis and full mean-squared error for dynamics evaluation; FMR and acc for correspondence evaluation; Kendall’s for ranking evaluation; F-score and Chamfer for planning execution evaluation. and success rate have been defined in the main paper.
I-A Geometry Metric
mIoU: we follow Peng et al.[peng2020convolutional] for volumetric interaction over union calculation. Let and be the set of all points that are inside of the predicted and ground-truth shapes, respectively. The volumetric IoU is the volume of two shapes’ intersection divided by the volume of their union:
We randomly sample 100k points from the bounding boxes and determine if the points lie inside or outside and , respectively. The mIoU is the mean volumetric intersection over union across test set.
I-B Dynamics Metric
vis and full MSE: we follow Xu et al. [xu2020learning] for flow mean-squared error. Let be the set of all points that are inside of the ground-truth shapes, and be the set of all points that are visible in the camera for the ground-truth shapes. And let be the predicted flow , and be the ground-truth flow . The vis and full mean-squared error is defined as:
I-C Correspondence Metric
FMR (Feature-match Recall): we follow Deng et al.[deng2018ppfnet] for feature-match recall calculation, which measures the percentage of fragment pairs that is recovered with high confidence. Let be the ground truth mapping and be the predicted mapping. Mathematically, FMR is calculated as:
And is averaged across test set. inlier distance threshold and or is the inlier recall threshold, following prior work [deng2018ppfnet, choy2019fully].
acc. (accuracy): is defined as the percentage of points that are correctly matched, where being correctly matched means that the predicted matched point is within from the ground-truth matched point:
I-D Ranking Metric
Kendall’s : we use Kendall’s [kendall1938new] for ranking evaluation, which has been examined in a computer vision context before [dwibedi2019temporal]. Kendall’s is a measure of the correspondence between two rankings, with values close to 1 indicating strong agreement, and values close to -1 indicating strong disagreement. In our scenarios, we have a predicted ranking of sampled action sequence and a ground-truth ranking of the sampled action sequence . For action sequence , the quadruplet of rank indices is said to be concordant if and or and . Otherwise it is said to be discordant. And Kendall’s is defined as:
where is the number of concordant pairs, the number of discordant pairs.
I-E Planning Execution Metric
Chamfer distance: The Chamfer distance is widely used for point set distance calculation [fan2017point]. For two point sets , the Chamfer distance is defined as:
For us, represents the object shape specified in the target configuration, represents the shape of the object after actions are executed.
F-Score: we follow Tatarchenko et al.[tatarchenko2019single] for F-score calculation. Recall is defined as the number of points in the ground-truth shape that lie within a certain distance to the source shape. Precision counts the percentage of points on the source shape that lie within a certain distance to the ground truth. The F-Score is then defined as the harmonic mean between precision and recall:
For us, the source shape is the final shape of the object after the action sequence is executed.
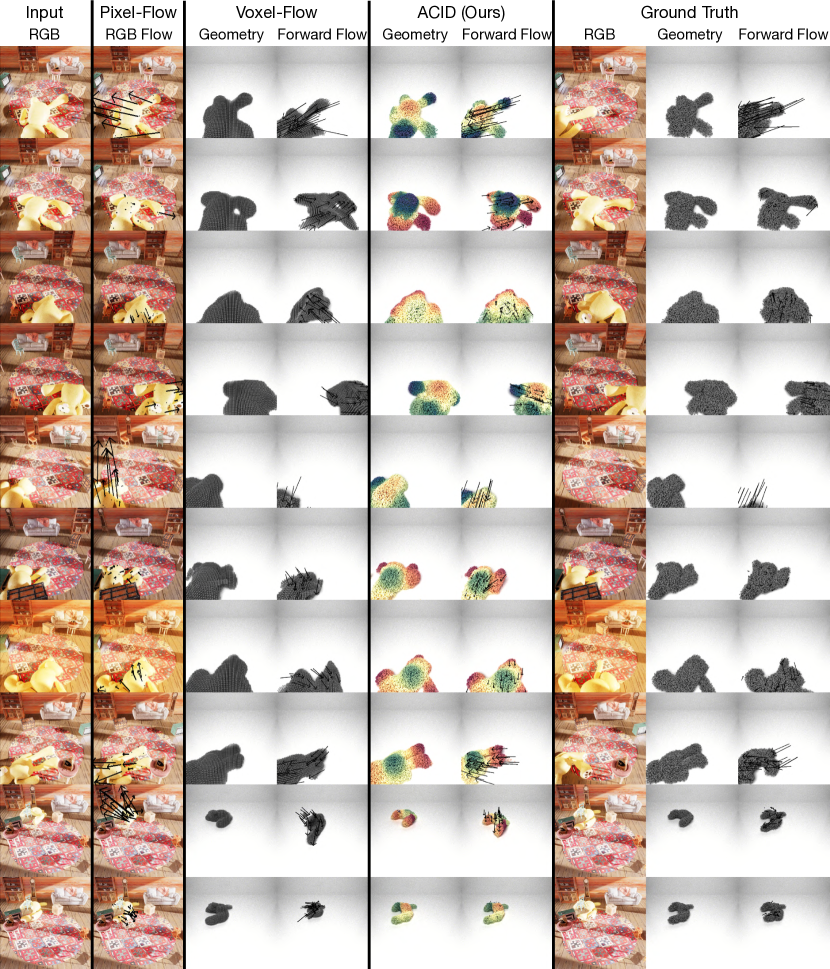
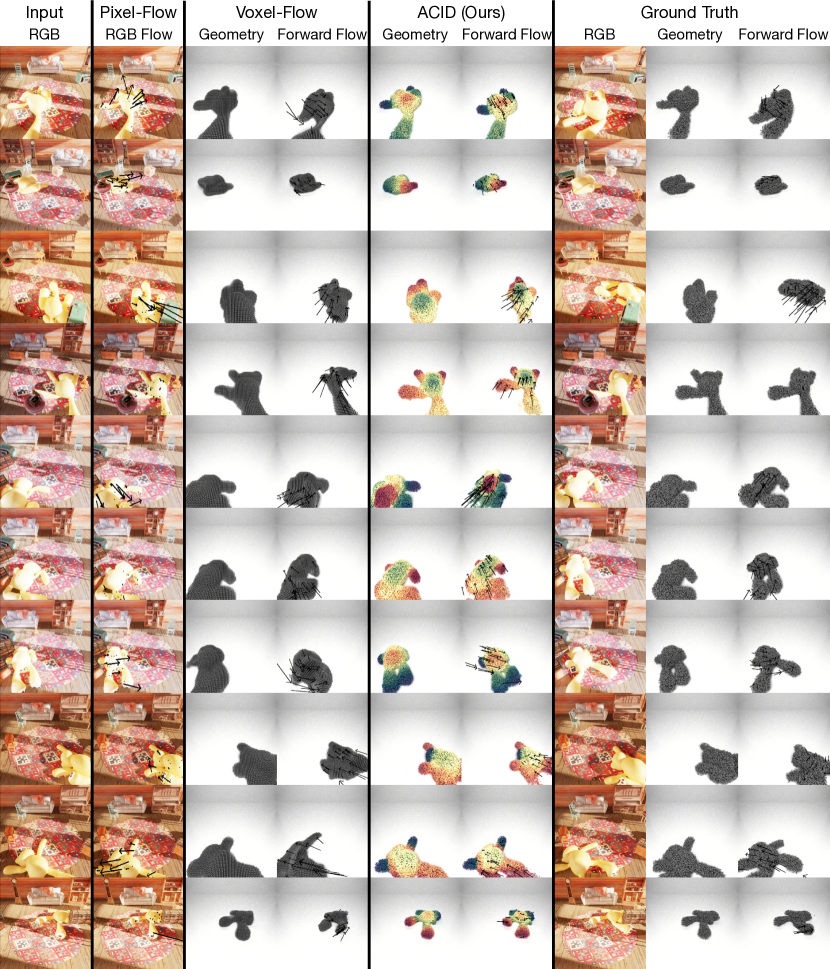
II Action-Conditional Visual Dynamics Visualizations
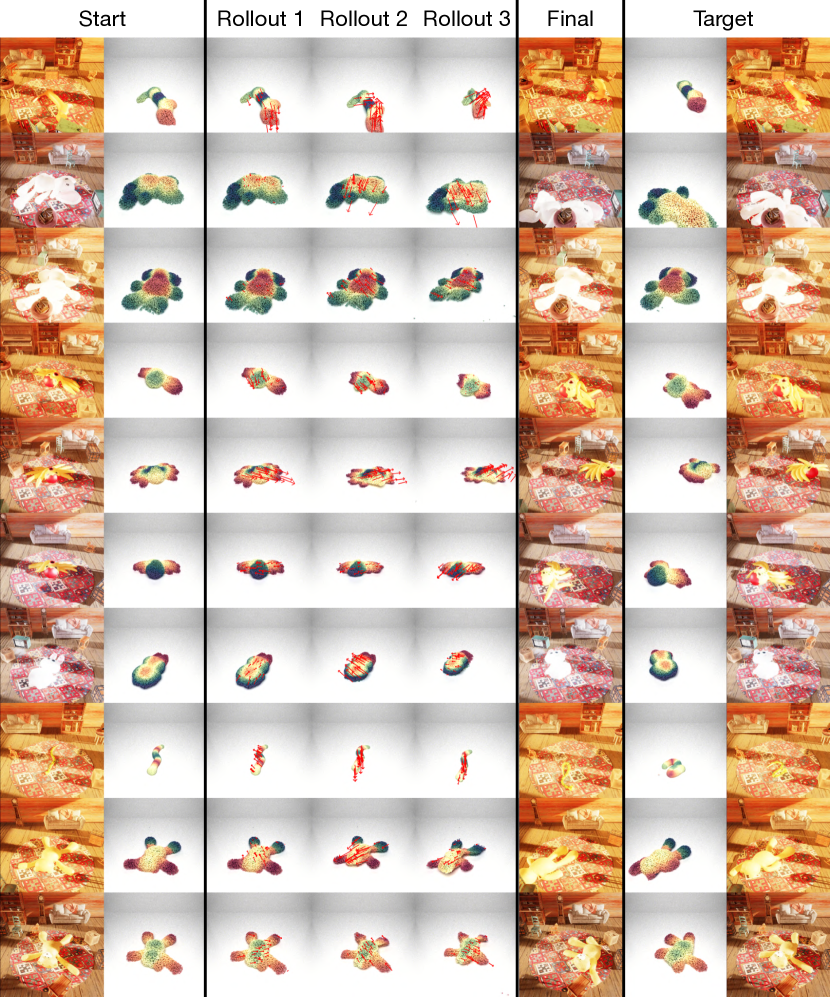
III Roll-outs Visualizations
We show here more example visualizations of ACID’s planning results. We visualize the roll-outs of the selected action sequences with lowest cost under different start and target configurations. As shown in Fig. 3, our method can estimate the dynamics of the object over multiple action commands and select reasonable action sequence.