Absolute Calibration of Cepheid Period–Luminosity Relations in NGC 4258
Abstract
NGC 4258 is one of the most important anchors for calibrating the Cepheid period–luminosity relations (PLRs) owing to its accurate distance measured from water maser motions. We expand on previous efforts and carry out a new Cepheid search in this system using the Hubble Space Telescope (HST). We discover and measure a sample of 669 Cepheids in four new and two archival NGC 4258 fields, doubling the number of known Cepheids in this galaxy and obtaining an absolute calibration of their optical PLRs. We determine a Wesenheit () PLR of , consistent with an independent Large Magellanic Cloud (LMC) calibration at the level of mag in its zeropoint, after accounting for a metallicity dependence of mag dex-1 (Riess et al., 2016). Our determination of the PLR slope also agrees with the LMC-based value within their uncertainties. We attempt to characterize the metallicity effect of Cepheid PLRs using only the NGC 4258 sample, but a relatively narrow span of abundances limits our sensitivity and yields a zero-point dependence of mag dex-1. The Cepheid measurements presented in this study have been used as part of the data to derive the Hubble constant in a companion paper by the SH0ES team.
1 Introduction
The Cepheid period–luminosity relations (PLRs; Leavitt & Pickering, 1912) have played a critical role in determining the extragalactic distance scale and the expansion rate of the Universe. By searching for Cepheid variable stars in M33 and measuring their periods and magnitudes, Hubble (1926) confirmed the extragalactic nature of “spiral nebulae.” Using Cepheid PLRs and other techniques (brightest stars and mean nebular luminosity), Hubble (1929) was able to estimate the current expansion rate of the Universe, now known as the Hubble constant (H0). It is one of the few directly observable cosmological parameters that constrain the age, size, and evolution of our Universe. Since then, many dedicated studies (e.g., Freedman et al., 2001) leveraged the robustness of Cepheid PLRs to calibrate the luminosity of various secondary distance indicators such as Type Ia supernovae (SNe Ia), the Tully-Fisher relation, the surface brightness fluctuation method, and the fundamental plane for elliptical galaxies, to determine H0 using their fluxes and redshifts in the Hubble flow. SNe Ia are unrivaled among secondary distance indicators in their accuracy and precision for studies of H0 and dark energy (Scolnic et al., 2018).
In the past decades, observational cosmologists have sought ever-greater precision in H0 for a better understanding of our Universe. As key steps in the measurement of H0, the calibration and application of Cepheid PLRs are now pushed to a precision that requires propagation of uncertainties from subtle factors besides the random error in the astrophysically-limited sample size of Cepheid–SN Ia calibrators, such as differences in reddening laws, metallicity scales, possible PLR nonlinearities, and instrument calibrations. The SH0ES (Supernovae, H0, for the Equation of State of dark energy) team provides the “state-of-the-art” measurements of the Cepheid-based distance ladder while observing the greatest number of SN Ia hosts leading to the most precise direct measurement of H0 (Riess et al., 2021b) through careful designs of observations. This includes the use of the same Hubble Space Telescope (HST) instruments and filters to measure Cepheids in all galaxies to nullify cross-instrumental errors, the pre-selection of low-dust, ideal SN Ia calibrators, and the choice of near-infrared (NIR) wavelengths to reduce uncertainties from knowledge of reddening laws. After more than a decade of work (Riess et al., 2009, 2011, 2016, 2019, 2021b), the SH0ES team is approaching 1% total uncertainty in H0 and has discovered a discrepancy between the direct measurement of H0 and its inferred value from the combination of Planck cosmic microwave background observations and the CDM cosmological model that is in significance (Riess et al., 2021b). Extensive checks of systematic errors in both the direct measurement and the Planck observations do not relieve this tension (Riess et al., 2021b; Di Valentino et al., 2021, and references therein), raising the possibility of “new physics” beyond the standard model.
In the current stage, the Cepheid PLR zeropoints are anchored to three systems: the Large Magellanic Cloud (LMC), the Milky Way, and NGC 4258. The distances to these three anchors were all measured geometrically, with the LMC distance obtained using detached eclipsing binaries, the NGC 4258 distance derived through monitoring of its water-maser motions, and the Milky Way Cepheid distances measured via parallaxes from the Gaia mission as well as HST via the spatial-scanning technique. The past three years have witnessed major improvements in all three of these distance measurements. Pietrzyński et al. (2019) measured 20 eclipsing binary systems and achieved a 1% distance measurement to the LMC. Reid et al. (2019) improved the water-maser modeling and reduced the NGC 4258 distance uncertainty from 2.6% to 1.5%. For the Milky Way Cepheids, the Gaia EDR3 release delivered a factor of 2 higher precision than DR2. Concurrently with these improvements of anchor distances, the SH0ES team (Riess et al., 2019, 2021a) acquired HST observations of 70 and 75 Cepheids in the LMC and Milky Way, respectively, to calibrate the Cepheid PLRs with the same observational setup as used for the Cepheid–SN Ia calibrator observations, nullifying the cross-instrumental errors in the H0 measurement. For NGC 4258, dedicated HST observations and analyses were performed by Macri et al. (2006), Hoffmann et al. (2016), and Riess et al. (2016).
Given the critical role of NGC 4258 in the Cepheid PLR calibration and thus the H0 measurement, we expanded the Cepheid observations in this galaxy to enlarge the Cepheid sample, especially long-period ( d) Cepheids, which are more commonly used for the Cepheid–SN Ia calibration. In this study, we observe four new fields in NGC 4258 using HST and perform a uniform Cepheid search and analysis in them, as well as perform a blind search and measurement of Cepheids from two archival fields (Macri et al., 2006). The rest of this paper is organized as follows. In §2, we describe the observations of various NGC 4258 fields and detail our reduction and photometry procedures. §3 presents the Cepheid identification and characterization procedures. We show our results in §4 and summarize the paper in §5.
2 Observations and Data Reduction
2.1 Observations
NGC 4258 is a relatively nearby spiral galaxy at a distance of 7.58 Mpc (Reid et al., 2019). Because of its relatively large apparent size, measuring a substantial sample of long-period Cepheids in this system using HST (which has imagers with limited fields of view of – on a side) is less efficient than in more-distant large spirals. Nevertheless, given the critical role of NGC 4258 in the absolute calibration of the extragalactic distance scale, time-series HST observations toward selected fields of this galaxy are desired in order to calibrate Cepheid PLRs in the same filter system as for those more distant Cepheid–SN Ia calibration galaxies. In 2003–2004, two NGC 4258 fields were observed with 12 epochs using HST ACS (GO-9810; PI Greenhill). Random-phased WFC3 observations, including NIR imaging, were also acquired in programs GO-11570 and 15640 (PI Riess) to aid the Cepheid PLR calibration of these Cepheids. We recently designed and acquired new HST time-series observations (GO-16198, PI Riess) in four additional fields to search for and measure more Cepheids in NGC 4258 to better constrain the absolute calibration of Cepheid PLRs. In this study, we analyzed both the archival observations and these new data at optical wavelengths only. The NIR data reduction and results are presented by Riess et al. (2021b).

2.1.1 Archival Observations
The archival observations acquired in 2003–2004 include 12 epochs of ACS imaging data in three bands: F435W, F555W, and F814W (HST equivalent to , , and , respectively). These data were analyzed by Macri et al. (2006) to search for Cepheids and measure their PLRs. A detailed description of these archival data can be found in §2.1 of that paper. The observations cover two fields: “inner” and “outer” as named by the authors. The observation baseline was days and two images were obtained in each band of each visit to help remove cosmic rays. In this work, we re-analyzed only the F555W and F814W data for their relevancy to the SH0ES calibration of the Cepheid distance scale. The exposure times per epoch were 1600 s and 800 s for F555W and F814W, respectively. For convenience, we renamed the inner field as “F1” and the outer field as “F2.” In this re-analysis, we used the latest Astrodrizzle software, which was not yet available at the time when the original analysis was performed. Compared with the Multidrizzle software that was used prior to its launch, Astrodrizzle provides significant improvements in data processing and astrometric information handling (Gonzaga et al., 2012).
2.1.2 New Observations
From December 2020 to February 2021, we acquired time-series observations of four NGC 4258 fields using HST. Two partially overlapping fields (F3 and F4) were imaged with ACS, while the other two fields (F5 and F6, also partially overlapping) were simultaneously imaged with WFC3. We adopted the same F555W and F814W filters used by the SH0ES team to calibrate Cepheid PLRs. For the WFC3 fields (F5 and F6), we also included F350LP observations for a more efficient Cepheid search and period determination than the traditional F555W filter. We obtained between 10 and 13 epochs of F555W or F350LP data that span a baseline of 68 days depending on the field. Unlike the 2003–2004 archival observations, we only obtained one exposure per visit. Consequently, we were not able to remove cosmic rays in individual images (we removed cosmic rays in our combined master images as defined in §2.2). The typical exposure times were 640 s and 785 s per band for ACS and WFC3 fields, respectively. Because of HST orientation constraints, there were some frame offsets among different visits. The locations of the first image of each field are shown in Figure 1. We summarize the observation dates, exposure times, and dataset identifiers of both archival and new observations in Table 1.
| Field | Epoch | Date | Dataset | Filter | Exposure [s] | Dither |
|---|---|---|---|---|---|---|
| F1 | 1 | 2003-12-05 | J8R001020 | F814W | 800 | 2 |
| F1 | 1 | 2003-12-05 | J8R001030 | F555W | 1600 | 2 |
| F1 | 2 | 2003-12-06 | J8R002020 | F814W | 800 | 2 |
| F1 | 2 | 2003-12-06 | J8R002030 | F555W | 1600 | 2 |
| F1 | 3 | 2003-12-07 | J8R003020 | F814W | 800 | 2 |
Note. — This table is available in its entirety in machine-readable form.
2.2 Data Reduction
We retrieved both the archival and new data from the Mikulski Archive for Space Telescopes (MAST) in the flc format, which includes flatfield and charge-transfer efficiency (CTE) corrections. We aligned and drizzled (Fruchter & Hook, 2002) the images of a given field using DrizzlePac 2.2.6. For each field, we registered all the images to a reference frame (usually the first F814W image for fields F1–F4 and the first F350LP image for fields F5 and F6) using tweakreg 1.4.7. The registered images were then drizzled to distortion-free images in the drc format using Astrodrizzle 3.1.6. We created drizzled images for each epoch of each band, which were used for time-series photometry in a later step, and deep master images that included data from all epochs for source-detection purposes. We excluded epoch 10 of fields F1 and F2, and epoch 11 of field F2, from the corresponding master images because they were slightly defocused. We note that the defocused epochs were included in the time-series photometry as their zeropoints can be adjusted using field stars to match the other epochs.
We used the DAOPHOT/ALLSTAR/ALLFRAME software suite (Stetson, 1987, 1994) to perform point-spread function (PSF) photometry on the drizzled images. Our photometry procedures were divided into three steps. In the first step, we derived a master source list from those drizzled deep master images. We adopted the standard two-pass source detection and PSF fitting using DAOPHOT and ALLSTAR as described in the DAOPHOT manual. For fields F5 and F6, we used the F350LP master images for source detection owing to their increased depth and wavelength coverage. For the ACS fields (F1–F4) where F350LP is unavailable, we co-added the F555W and F814W master images for source detection. Variable sources with mean magnitudes above the detection limit but first-epoch magnitudes below the detection limit should be safely included in our source list, given that our master images consist of the flux of all the epochs. In the second step, we performed time-series PSF photometry on the drizzled images of individual epochs using ALLFRAME with the source list obtained in the first step as input. This was done separately for each band to obtain instrumental F350LP, F555W, and F814W magnitudes for each epoch. In the last step, we calibrated the magnitudes into the Vega system by including aperture corrections and the appropriate instrument zeropoints. We determined the aperture corrections by measuring the magnitude differences between our PSF photometry and aperture photometry of 150 visually selected bright and isolated objects. The Vega magnitude zeropoints were obtained using the STScI ACS Zeropoints Calculator111https://acszeropoints.stsci.edu and Deustua et al. (2017) for ACS and WFC3, respectively.
3 Cepheid Selection
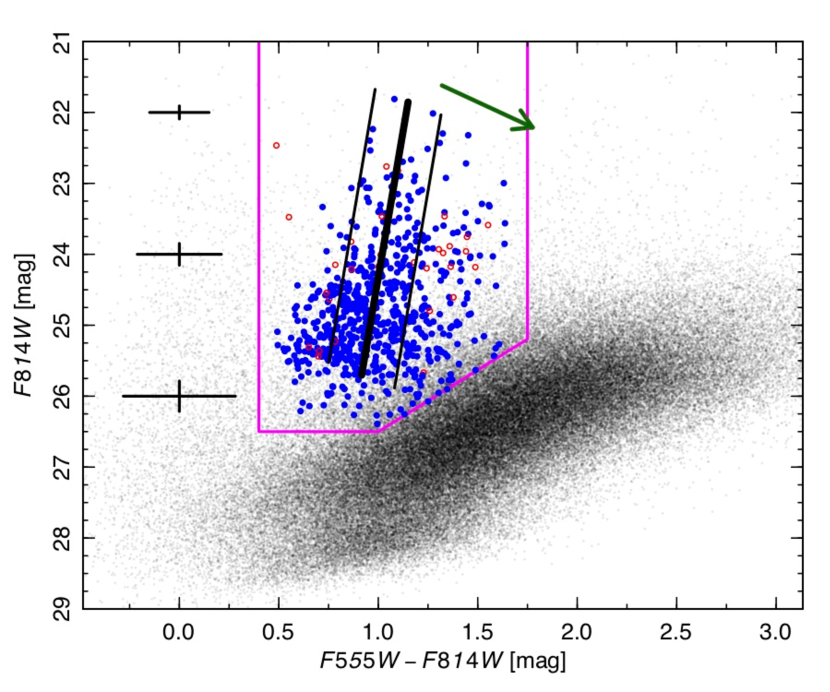
We detected and measured million point sources in these six fields using the method described in §2.2. To select a clean sample of Cepheid variables, we applied several consecutive cuts based on the light-curve properties, colors, magnitudes, and signal-to-noise ratios (SNRs). The initial cut is based on the light-curve (F555W for ACS fields and F350LP for WFC3 fields) variability index (Stetson, 1996). We made use of the TRIAL program that was kindly provided by Peter Stetson to extract light curves of sources with . The second cut is based on the color–magnitude diagram (CMD) to select stars in a CMD region where the Cepheid instability strip is expected. Our selection boundary is shown with magenta lines in Figure 2. The lower part of the boundary was designed to avoid the dense red giant branch stars, which would contaminate the selected sample with too many non-Cepheid stars.
Next, we fit Cepheid templates to the light curves of the surviving objects and made additional cuts. We adopted the Yoachim et al. (2009) templates to measure their periods, amplitudes, and mean magnitudes. The details of the template-fitting method are presented in §3.2 of Yuan et al. (2020). Then we applied the amplitude-based cuts
and cuts based on the dispersion of light curves about the best-fit models,
Considering the limited sampling of the NGC 4258 light curves, we adopted conservative amplitude-based cuts compared to those well-measured Cepheid amplitude properties as presented by Klagyivik & Szabados (2009). We note that the Cepheid amplitudes in F350LP and F555W are close enough (Hoffmann et al., 2016) for the above selection purposes. For the cuts based on the light-curve fits, we relaxed the cut in fields F3 and F4 owing to their lower-SNR observations compared with other fields and bands. We then removed possible Type \@slowromancapii@ Cepheids whose Wesenheit index are fainter than 28.1 3.31 or mag fainter than the classical Cepheid PLR, where is defined as and the Wesenheit color term of 1.3 was derived by Riess et al. (2019) using a reddening law of from Cardelli et al. (1989). We also removed objects with periods shorter than 5 days to avoid incompleteness. We note that this period cut also removes the sample contamination from first-overtone Cepheids. The combination of the above cuts yielded a sample of 699 candidate Cepheids.

Finally, we cleaned our sample by performing an iterative 3 clipping of their PLRs. We fit the PLRs to the Wesenheit index, F555W, and F814W measurements with fixed slopes of , , and (respectively) to reject outliers, where the PLR slopes were derived by Riess et al. (2019). For the F555W and F814W bands, we only rejected outliers in the brighter side, which are possibly caused by blending, as the fainter objects are mostly due to extinction and should not be excluded. We rejected 4% of the objects as outliers in this clipping and derived a final sample of 669 Cepheid candidates. If we only reject Wesenheit outliers, then 13 more objects would survive, shifting the Wesenheit index, F555W, and F814W PLR zeropoints by 0.009, 0.018, and 0.016 mag, respectively.
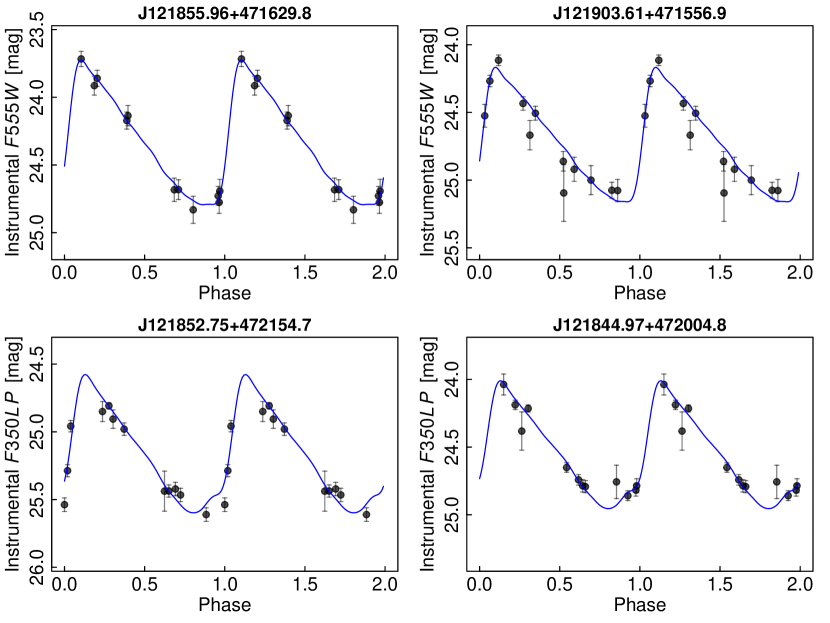
We derived background corrections for these objects using the artificial star test method outlined by Hoffmann et al. (2016) and adjusted their final photometry accordingly. By injecting artificial stars near Cepheids and measuring their magnitudes in the same manner as for real-star photometry, we were able to derive and correct any photometry bias due to background variations. The locations and measured properties of our final Cepheid sample are presented in Table 2. Example light curves in new fields (F3–F6) are shown in Figure 3, while composite light curves of all fields are shown in Figure 4.
| ID | R.A. | Decl. | Magnitudesa [mag] | Amplitudesb [mag] | ||||
|---|---|---|---|---|---|---|---|---|
| (days) | (J2000.0) | (J2000.0) | F555W | F814W | F350LP | |||
| J121856.37+471611.8 | 5.010 | 184.734879 | 47.269939 | 26.686(302) | 25.155(355) | 0.298 | 0.214 | |
| J121846.12+472037.4 | 5.021 | 184.692184 | 47.343731 | 26.441(126) | 25.606(166) | 26.354(151) | 0.311 | 0.198 |
| J121849.57+472117.6 | 5.035 | 184.706543 | 47.354893 | 27.387(190) | 26.392(321) | 27.117(185) | 0.271 | 0.194 |
| J121904.04+471536.1 | 5.036 | 184.766846 | 47.260014 | 26.642(317) | 25.552(345) | 0.275 | 0.150 | |
| J121854.29+471921.1 | 5.054 | 184.726227 | 47.322521 | 26.578(315) | 25.694(474) | 0.333 | 0.237 | |
| J121848.01+472138.4 | 5.086 | 184.700058 | 47.360661 | 26.129(134) | 25.362(186) | 25.928(134) | 0.418 | 0.247 |
| J121833.83+472003.3 | 5.086 | 184.640945 | 47.334251 | 25.863(141) | 25.095(199) | 25.968( 93) | 0.277 | 0.198 |
| J121835.63+472110.9 | 5.087 | 184.648453 | 47.353016 | 26.130(137) | 25.265(213) | 25.966(107) | 0.316 | 0.226 |
| J121856.58+471617.4 | 5.090 | 184.735764 | 47.271507 | 26.183(359) | 24.940(451) | 0.329 | 0.166 | |
| J121851.55+472108.1 | 5.093 | 184.714783 | 47.352257 | 26.369(242) | 25.634(381) | 0.309 | 0.228 | |
Note. — aFully calibrated Vega magnitudes, including background corrections and their uncertainties. Magnitude uncertainties are shown in parentheses and expressed in units of mag. : F555W or F350LP amplitude. : F814W amplitude. This table is available in its entirety in machine-readable form.
4 Results
NGC 4258 is one of the most important distance anchors for Cepheid PLR calibration. The Keplerian motions of water masers around the central supermassive black hole in NGC 4258 monitored by Very Long Baseline Interferometry (VLBI) allow a solid geometrical distance measurement of this system with percent-level uncertainty, laying the foundation for absolute calibrations of the Cepheid PLRs in NGC 4258. In terms of the Cepheid–SN Ia distance ladder, NGC 4258 shows additional advantages. It shares a similar mean crowding level compared to those SN Ia hosts that the SH0ES team measured, and it exhibits a mean metallicity closer to the SN Ia hosts than the LMC. Such similarities help reduce possible systematics from crowding corrections and metallicity-dependence corrections.
Multiple works have calibrated the Cepheid PLRs in NGC 4258 in various bands. For example, Newman et al. (2001) observed NGC 4258 using the WFP2 camera onboard HST and obtained optical PLRs in bands. Macri et al. (2006) derived optical PLRs in bands using the later-installed ACS camera on HST. Hoffmann & Macri (2015) observed NGC 4258 with ground-based facilities and obtained PLRs in the Sloan Digital Sky Survey bands. Fausnaugh et al. (2015) observed NGC 4258 using the Large Binocular Telescope and derived PLRs in ground-based bands. Fausnaugh et al. (2015) and Riess et al. (2016) both reported NIR Cepheid PLRs in the HST F160W (equivalent to the ground ) band.
In this work, we adopted the latest geometric distance to this system (Reid et al., 2019) and determined the absolute Cepheid PLR zeropoints in optical HST bands. We compared our zeropoints to those set by LMC Cepheids (Riess et al., 2019) and found good agreement to the level of mag if we assume a metallicity dependence of mag dex-1 derived by Riess et al. (2016). We also tentatively studied the PLR metallicity effect using the NGC 4258 Cepheids. A comprehensive analysis of the metallicity dependence using multiple datasets is beyond the scope of this work; however, we refer interested readers to Breuval et al. (2021), Riess et al. (2021b), Ripepi et al. (2021), and Ripepi et al. (2022) for this subject. A detailed comparison of Cepheid photometry between this work and the many past publications using different cameras and filter systems is also beyond our scope. However, we note that many past works have not fully incorporated individual Cepheid crowding corrections (e.g., Macri et al. 2006, Hoffmann et al. 2016) as we have here, which will make the Cepheids fainter. The Cepheid properties presented in this work were used by Riess et al. (2021b) to develop the distance ladder and measure H0. Riess et al. (2021b) also published the F160W-band results of these NGC 4258 Cepheids.
4.1 Cepheid PLRs
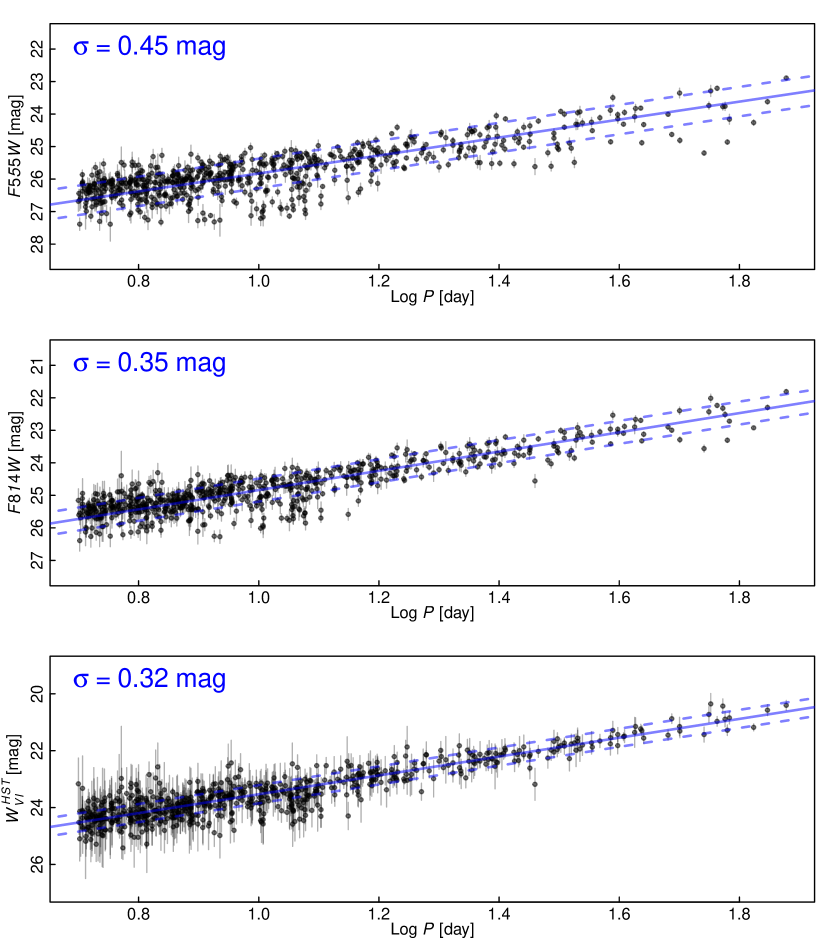
Cepheids are known to follow a linear relationship between their absolute magnitudes and the logarithm of their periods. We fit PLRs to our sample using
where is the Cepheid apparent magnitude (F555W or F814W) or Wesenheit index (), is the Cepheid period in units of days, is the PLR slope, and is the intercept. We adopted the PLR slopes derived by Riess et al. (2019) while setting the intercepts as free parameters. We weighted individual Cepheids by the inverse of the sum of squared measurement errors and the square of the PLR scatter determined by Riess et al. (2019): 0.312, 0.202, and 0.085 mag for F555W, F814W, and , respectively. For the index, we also tried two additional PLR fits: in one fit we kept both the slope and intercept as free parameters, while in the other fit we limited our sample to the same period range of the LMC sample studied by Riess et al. (2019). We note that our completeness cut of d also eliminated the contamination from overtone Cepheids, whose periods are typically shorter than 5 days. The F555W, F814W, and PLRs are shown in Figure 5 and their best-fit values are presented in Table 3.
| Band | Anchor | range | Slopea | Intercept | scatter | Abs. ZPb | [O/H]c | Ref. | |
|---|---|---|---|---|---|---|---|---|---|
| LMC | 6–47 | -3.310 | 15.9350.010 | 0.085 | 68 | -2.5420.028 | 8.40 | Riess+19 | |
| N4258 | 5–75 | -3.310 | 26.8420.012 | 0.319 | 669 | -2.5560.034 | 8.63 | this work | |
| N4258 | 5–75 | -3.2940.042 | 26.8230.049 | 0.319 | 669 | -2.5740.034 | 8.63 | this work | |
| N4258 | 6–47 | -3.310 | 26.8490.014 | 0.316 | 548 | -2.5480.035 | 8.63 | this work | |
| F555W | LMC | 6–47 | -2.760 | 17.6380.038 | 0.312 | 68 | -0.8390.046 | 8.40 | Riess+19 |
| F555W | N4258 | 5–75 | -2.760 | 28.5860.018 | 0.453 | 669 | -0.8110.037 | 8.63 | this work |
| F814W | LMC | 6–47 | -2.960 | 16.8540.025 | 0.202 | 68 | -1.6230.036 | 8.40 | Riess+19 |
| F814W | N4258 | 5–75 | -2.960 | 27.7980.014 | 0.353 | 669 | -1.6000.035 | 8.63 | this work |
Note. — aThe NGC 4258 slopes are either fixed to the LMC values (without giving uncertainty) or computed as free parameters (with uncertainty given). bAbsolute PLR zeropoints. Their uncertainties are computed as , where is the distance modulus uncertainty and is the PLR scatter. For F555W and F814W PLRs, dust extinction is not included in the computation. cThe NGC 4258 metallicity is discussed in §4.2 and the Appendix. The LMC metallicity is derived by Romaniello et al. (2021).
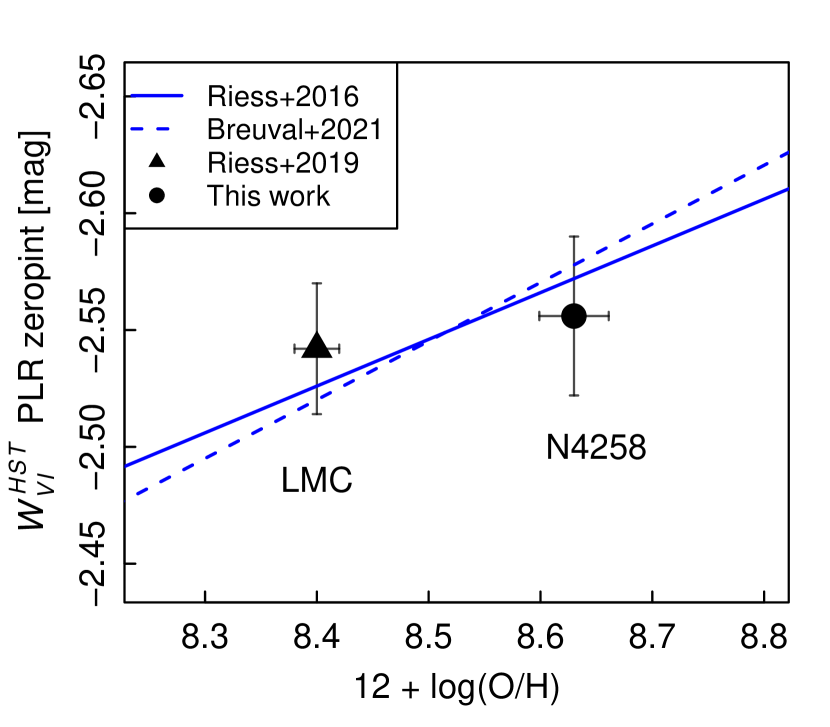
To derive the absolute PLR zeropoints, we adopted the distance modulus of mag to NGC 4258 based on the recent remodeling of the water-maser motions in this system (Reid et al., 2019). The resulting absolute zeropoints of the PLRs are presented in Table 3 as well. Since both the mean extinction toward the LMC and NGC 4258 may be different and the metallicity dependence of F555W and F814W PLRs are unavailable (most existing optical metallicity effect studies are based on non-HST filters), we only compared our reddening-free index PLR with the corresponding value from Riess et al. (2019). The Riess et al. (2019) calibration is based on the LMC Cepheids and detached eclipsing binary distance (Pietrzyński et al., 2019) and thus is completely independent of our result. We applied a metallicity (oxygen abundance (O/H)) dependence of mag dex-1 based on Riess et al. (2016) to the mean difference between the LMC and NGC 4258 Cepheids and obtained a metallicity correction of 0.046 mag. With this metallicity correction, we found excellent agreement ( mag) between our absolute PLR and the Riess et al. (2019) one, as shown in Figure 6. If we assume the metallicity dependence of mag dex-1 derived using ground-based filters by Breuval et al. (2021), the agreement is mag.
4.2 Metallicity Dependence
A robust determination of the Cepheid PLR metallicity dependence requires high precision and consistent calibrations in the chemical abundance measurement, Cepheid photometry, and dust extinction estimation simultaneously. Because our NGC 4258 Cepheids cover a relatively large range of radial distances from the galactic center, it is possible to study the metallicity effect using only the abundance gradient of the galaxy and bypassing the abundance zeropoint error among NGC 4258 and other galaxies. Taking advantage of this opportunity, here we attempt to solve for the -band PLR metallicity dependence using the NGC 4258 Cepheids alone and characterize its associated uncertainty.
We acquired 37 new metallicity measurements for 26 H II regions in NGC 4258 using the Low-Resolution Imaging Spectrometer (LRIS; Oke et al., 1995) on the Keck-I 10 m telescope and the Kast double spectrograph (Miller & Stone, 1993) on the Shane 3 m telescope at Lick Observatory, and combined them with those from Bresolin (2011, hereafter B11) to obtain a total of 52 H II regions. For the new measurements, we followed the observation strategy and analysis methods described in §2.5 of Riess et al. (2005) to derive the metallicities of those H II regions. There are 10 H II regions in common between our new measurements and the B11 sample, and we averaged them with weighted means. We computed the oxygen abundances (O/H) from the quantity using the Zaritsky et al. (1994, hereafter Z94) method and transformed them to the Pettini & Pagel (2004, hereafter PP04) scale using the Teimoorinia et al. (2021) analytical solution. The PP04 scale better matches the zeropoint of the LMC Cepheid metallicity measurements (Romaniello et al., 2021), which are calibrated to the solar-metallicity determinations of Asplund et al. (2009). The combined H II region metallicity measurements and the metallicity gradient are presented in the Appendix (Table 4 and Figure 8, respectively).
We deprojected the galaxy for radial distances from the galactic center using the following position parameters that were adopted by B11:
We found a gradient of on the Z94 scale and a gradient of on the PP04 scale, where is the radial distance from the galactic center in units of kpc. The scatter of these gradient relations is dex, which is likely to have an astrophysical origin rather than measurement errors. We then inferred the Cepheid metallicity using the gradient in the PP04 scale. We note that the Cepheid metallicity estimation is independent of the adopted NGC 4258 distance for deprojection.
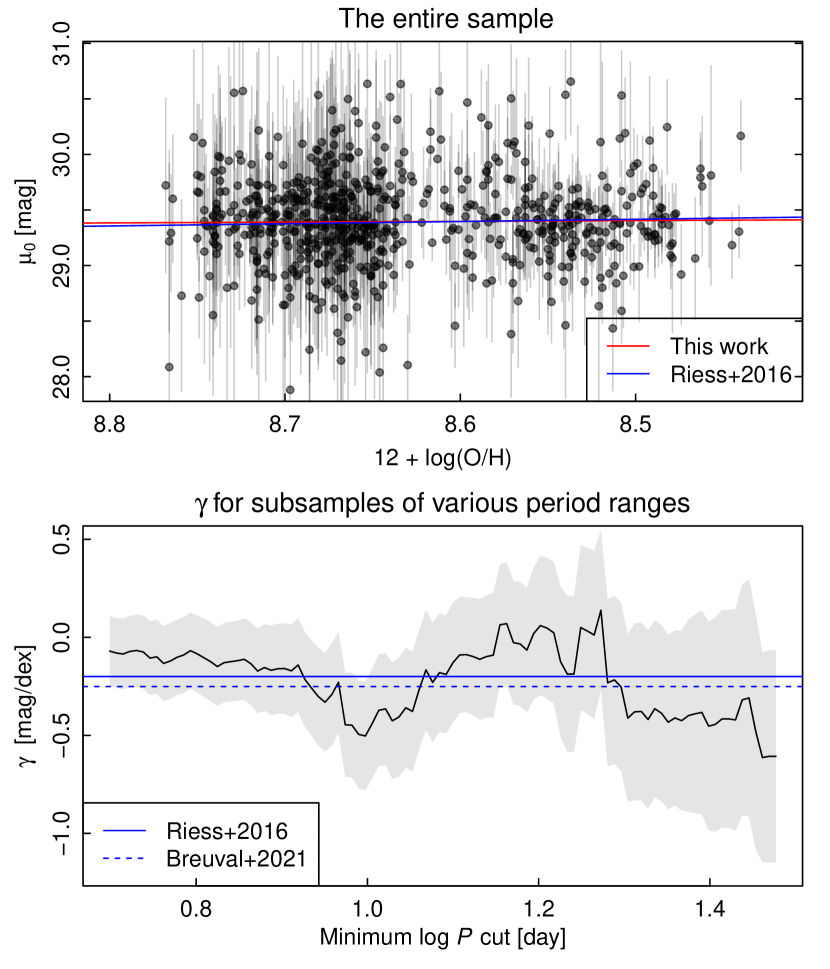
To derive the metallicity dependence , we performed a linear regression fit between the PLR intercepts of individual Cepheids and the metallicity calculated from the Cepheid locations, as shown in the top panel of Figure 7. We calculated with a variety of minimum period cuts of the Cepheid sample, and found that our determination on this term is rather unstable owing to random errors, as shown in the bottom panel of Figure 7. Using the entire Cepheid sample, the best fit yielded mag dex-1, where the quoted uncertainty only includes a random error. The large random error in our measurement was caused by (1) the shallow NGC 4258 metallicity gradient ( times shallower than the Milky Way gradient), (2) the large scatter of the abundances, and (3) the Cepheid measurement errors.
We further characterized the leading systematic error in our metallicity dependence estimate. There is a disagreement regarding the NGC 4258 metallicity gradient in the recent literature. For example, B11 obtained a gradient of using the M91 calibration and using the P05 calibration, while Hoffmann et al. (2016) derived a gradient of on the Z94 scale. When measuring the differential term , only the slope of these relations (which marginally depends on the adopted scales) matters. We took the slope difference of 0.006 dex kpc-1 among these measurements and obtained a mean systematic error in of 0.11 mag dex-1 for various minimum period cuts. Combining the random and systematic errors, we found that mag dex-1. The large uncertainty in our metallicity-effect estimate prevents us from drawing any meaningful comparisons with other studies on this matter. We conclude that NGC 4258 itself is not a good target for a differential constraint of the Cepheid PLR metallicity effect.
4.3 Photometry Comparison with Previous Work
We compared the Cepheid photometry between this work and that of Macri et al. (2006) as follows. We recovered their F555W and F814W magnitudes (using their Table 4 and reversing their transformation equations for and ) and compared them to our equivalent measurements (aperture-corrected, CTE-corrected values). We found -clipped mean differences for the equivalent mean magnitudes of , , and mag in F555W, F814W, and F555WF814W, respectively.
One notable difference between the previous work and our analysis is our inclusion of extensive artificial-star simulations to correct for crowding for individual Cepheids, which was previously neglected in optical analyses. Taking this into account, we found -clipped mean differences with the previous work of , , and mag in F555W, F814W, and F555WF814W, respectively (our corrected values are fainter and bluer). Most of the Cepheids from Macri et al. (2006) come from their “inner” field, which is among the densest and optically reddest fields analyzed by the SH0ES project. We note that for the SH0ES SN hosts (where the background stellar population is less red), the color shift from crowding corrections compared to previous work (Hoffmann et al., 2016) is much smaller, with a mean in F555WF814W of mag (Yuan et al., in preparation).
5 Summary
As part of the effort in pushing the H0 precision close to the 1% level, we expanded the Cepheid search in NGC 4258, one of the critically important galaxies for the absolute calibration of the Cepheid distance scale. We obtained time-series observations of four NGC 4258 fields using HST and carried out a Cepheid search with a combination of new and archival data, yielding a total of 669 Cepheid candidates. We calibrated the Cepheid PLRs using the latest geometric distance to NGC 4258 and found excellent agreement with the independently calibrated Cepheid PLR by Riess et al. (2019). Finally, we studied the effect of metallicity on Cepheid PLRs using our NGC 4258 Cepheids. However, as the data only loosely constrain the PLR metallicity dependence, we conclude that NGC 4258 itself is not suitable for a robust differential determination of the Cepheid metallicity effect.
This work led to a factor of increase in the NIR Cepheid sample in NGC 4258 that was analyzed by Riess et al. (2021b). Although including NGC 4258 as a distance anchor does not significantly reduce the total H0 uncertainty (as there exist two other anchors and the uncertainty has many sources), the NGC 4258 Cepheid data provided robust tests in the crowding corrections and metallicity dependence (Riess et al., 2021b). In the future, we plan to refine the NGC 4258 Cepheid photometry with the James Webb Space Telescope (JWST) by further evaluating the field crowding at NIR wavelengths, and extend the absolute Cepheid PLR calibrations to the JWST photometric system.
References
- Asplund et al. (2009) Asplund, M., Grevesse, N., Sauval, A. J., & Scott, P. 2009, ARA&A, 47, 481, doi: 10.1146/annurev.astro.46.060407.145222
- Bresolin (2011) Bresolin, F. 2011, ApJ, 729, 56, doi: 10.1088/0004-637X/729/1/56
- Breuval et al. (2021) Breuval, L., Kervella, P., Wielgórski, P., et al. 2021, ApJ, 913, 38, doi: 10.3847/1538-4357/abf0ae
- Cardelli et al. (1989) Cardelli, J. A., Clayton, G. C., & Mathis, J. S. 1989, ApJ, 345, 245, doi: 10.1086/167900
- Deustua et al. (2017) Deustua, S. E., Mack, J., Bajaj, V., & Khandrika, H. 2017, WFC3/UVIS Updated 2017 Chip-Dependent Inverse Sensitivity Values, Space Telescope WFC Instrument Science Report
- Di Valentino et al. (2021) Di Valentino, E., Mena, O., Pan, S., et al. 2021, Classical and Quantum Gravity, 38, 153001, doi: 10.1088/1361-6382/ac086d
- Fausnaugh et al. (2015) Fausnaugh, M. M., Kochanek, C. S., Gerke, J. R., et al. 2015, MNRAS, 450, 3597, doi: 10.1093/mnras/stv881
- Freedman et al. (2001) Freedman, W. L., Madore, B. F., Gibson, B. K., et al. 2001, ApJ, 553, 47, doi: 10.1086/320638
- Fruchter & Hook (2002) Fruchter, A. S., & Hook, R. N. 2002, PASP, 114, 144, doi: 10.1086/338393
- Gonzaga et al. (2012) Gonzaga, S., Hack, W., Fruchter, A., & Mack, J. 2012, The DrizzlePac Handbook
- Hoffmann & Macri (2015) Hoffmann, S. L., & Macri, L. M. 2015, AJ, 149, 183, doi: 10.1088/0004-6256/149/6/183
- Hoffmann et al. (2016) Hoffmann, S. L., Macri, L. M., Riess, A. G., et al. 2016, ApJ, 830, 10, doi: 10.3847/0004-637X/830/1/10
- Hubble (1929) Hubble, E. 1929, Proceedings of the National Academy of Science, 15, 168, doi: 10.1073/pnas.15.3.168
- Hubble (1926) Hubble, E. P. 1926, ApJ, 63, 236, doi: 10.1086/142976
- Klagyivik & Szabados (2009) Klagyivik, P., & Szabados, L. 2009, A&A, 504, 959, doi: 10.1051/0004-6361/200811464
- Leavitt & Pickering (1912) Leavitt, H. S., & Pickering, E. C. 1912, Harvard College Observatory Circular, 173, 1
- Macri et al. (2006) Macri, L. M., Stanek, K. Z., Bersier, D., Greenhill, L. J., & Reid, M. J. 2006, ApJ, 652, 1133, doi: 10.1086/508530
- Miller & Stone (1993) Miller, J. S., & Stone, R. P. S. 1993, Lick Obs. Tech. Rep. 66 (Santa Cruz, CA: Lick Observatory)
- Newman et al. (2001) Newman, J. A., Ferrarese, L., Stetson, P. B., et al. 2001, ApJ, 553, 562, doi: 10.1086/320969
- Oke et al. (1995) Oke, J. B., Cohen, J. G., Carr, M., et al. 1995, PASP, 107, 375, doi: 10.1086/133562
- Pettini & Pagel (2004) Pettini, M., & Pagel, B. E. J. 2004, MNRAS, 348, L59, doi: 10.1111/j.1365-2966.2004.07591.x
- Pietrzyński et al. (2019) Pietrzyński, G., Graczyk, D., Gallenne, A., et al. 2019, Nature, 567, 200, doi: 10.1038/s41586-019-0999-4
- Reid et al. (2019) Reid, M. J., Pesce, D. W., & Riess, A. G. 2019, ApJ, 886, L27, doi: 10.3847/2041-8213/ab552d
- Riess et al. (2021a) Riess, A. G., Casertano, S., Yuan, W., et al. 2021a, ApJ, 908, L6, doi: 10.3847/2041-8213/abdbaf
- Riess et al. (2019) Riess, A. G., Casertano, S., Yuan, W., Macri, L. M., & Scolnic, D. 2019, ApJ, 876, 85, doi: 10.3847/1538-4357/ab1422
- Riess et al. (2005) Riess, A. G., Li, W., Stetson, P. B., et al. 2005, ApJ, 627, 579, doi: 10.1086/430497
- Riess et al. (2009) Riess, A. G., Macri, L., Casertano, S., et al. 2009, ApJ, 699, 539, doi: 10.1088/0004-637X/699/1/539
- Riess et al. (2011) —. 2011, ApJ, 730, 119, doi: 10.1088/0004-637X/730/2/119
- Riess et al. (2016) Riess, A. G., Macri, L. M., Hoffmann, S. L., et al. 2016, ApJ, 826, 56, doi: 10.3847/0004-637X/826/1/56
- Riess et al. (2021b) Riess, A. G., Yuan, W., Macri, L. M., et al. 2021b, arXiv e-prints, arXiv:2112.04510. https://arxiv.org/abs/2112.04510
- Ripepi et al. (2021) Ripepi, V., Catanzaro, G., Molinaro, R., et al. 2021, MNRAS, 508, 4047, doi: 10.1093/mnras/stab2460
- Ripepi et al. (2022) Ripepi, V., Catanzaro, G., Clementini, G., et al. 2022, arXiv e-prints, arXiv:2201.01126. https://arxiv.org/abs/2201.01126
- Romaniello et al. (2021) Romaniello, M., Riess, A., Mancino, S., et al. 2021, arXiv e-prints, arXiv:2110.08860. https://arxiv.org/abs/2110.08860
- Scolnic et al. (2018) Scolnic, D. M., Jones, D. O., Rest, A., et al. 2018, ApJ, 859, 101, doi: 10.3847/1538-4357/aab9bb
- Stetson (1987) Stetson, P. B. 1987, PASP, 99, 191, doi: 10.1086/131977
- Stetson (1994) —. 1994, PASP, 106, 250, doi: 10.1086/133378
- Stetson (1996) —. 1996, PASP, 108, 851, doi: 10.1086/133808
- Teimoorinia et al. (2021) Teimoorinia, H., Jalilkhany, M., Scudder, J. M., Jensen, J., & Ellison, S. L. 2021, MNRAS, 503, 1082, doi: 10.1093/mnras/stab466
- Yoachim et al. (2009) Yoachim, P., McCommas, L. P., Dalcanton, J. J., & Williams, B. F. 2009, AJ, 137, 4697, doi: 10.1088/0004-6256/137/6/4697
- Yuan et al. (in preparation) Yuan, W. Macri, L., Riess, A., Brink, T., et al. in preparation
- Yuan et al. (2020) Yuan, W., Fausnaugh, M. M., Hoffmann, S. L., et al. 2020, ApJ, 902, 26, doi: 10.3847/1538-4357/abb377
- Zaritsky et al. (1994) Zaritsky, D., Kennicutt, Robert C., J., & Huchra, J. P. 1994, ApJ, 420, 87, doi: 10.1086/173544
| ID | RA (J2000) | Dec (J2000) | (kpc) | (Z94) | (PP04) | Source | ||
|---|---|---|---|---|---|---|---|---|
| b15 | 184.73279 | 47.30519 | 1.44 | 2.95 | 9.03 | 8.80 | 0.05 | B11 |
| b16 | 184.73413 | 47.30311 | 1.49 | 4.37 | 8.86 | 8.63 | 0.05 | B11 |
| b17 | 184.73450 | 47.29611 | 2.88 | 3.89 | 8.92 | 8.69 | 0.05 | B11 |
| n12 | 184.74600 | 47.31554 | 4.01 | 3.36 | 8.98 | 8.75 | 0.06 | new |
| b14 | 184.74383 | 47.31806 | 4.11 | 3.74 | 8.93 | 8.71 | 0.04 | B11, new |
| n14 | 184.71637 | 47.31225 | 4.30 | 4.15 | 8.89 | 8.66 | 0.08 | new |
| b13 | 184.70629 | 47.32233 | 5.42 | 3.83 | 8.93 | 8.70 | 0.04 | B11, new |
| b12 | 184.74554 | 47.32517 | 6.09 | 4.68 | 8.82 | 8.60 | 0.05 | B11 |
| b6 | 184.71271 | 47.34814 | 6.48 | 3.31 | 8.98 | 8.76 | 0.05 | B11 |
| n3 | 184.72017 | 47.34598 | 6.67 | 3.89 | 8.92 | 8.69 | 0.08 | new |
| b5 | 184.70579 | 47.35228 | 6.92 | 3.61 | 8.95 | 8.72 | 0.04 | B11, new |
| b11 | 184.73904 | 47.33453 | 6.94 | 3.13 | 9.01 | 8.78 | 0.03 | B11, new |
| b10 | 184.73562 | 47.33756 | 7.02 | 3.24 | 8.99 | 8.77 | 0.05 | B11 |
| b9 | 184.73308 | 47.34042 | 7.23 | 3.53 | 8.96 | 8.73 | 0.04 | B11, new |
| b8 | 184.73000 | 47.34319 | 7.36 | 3.51 | 8.96 | 8.73 | 0.04 | B11, new |
| b4 | 184.70217 | 47.35689 | 7.58 | 4.36 | 8.86 | 8.63 | 0.04 | B11, new |
| b7 | 184.72554 | 47.34731 | 7.62 | 2.75 | 9.05 | 8.82 | 0.05 | B11 |
| b19 | 184.76483 | 47.25294 | 7.92 | 4.37 | 8.86 | 8.63 | 0.05 | B11 |
| b20 | 184.77158 | 47.25022 | 7.92 | 6.31 | 8.63 | 8.41 | 0.05 | B11 |
| b3 | 184.73204 | 47.36508 | 12.71 | 5.46 | 8.73 | 8.51 | 0.04 | B11, new |
| n36 | 184.72037 | 47.37533 | 13.12 | 3.75 | 8.93 | 8.71 | 0.08 | new |
| b2 | 184.73025 | 47.36931 | 13.37 | 5.01 | 8.78 | 8.56 | 0.05 | B11 |
| n2 | 184.66781 | 47.32883 | 13.38 | 2.96 | 9.03 | 8.80 | 0.06 | new |
| b1 | 184.72213 | 47.37653 | 13.67 | 5.25 | 8.76 | 8.53 | 0.05 | B11 |
| b23 | 184.76254 | 47.22711 | 13.79 | 6.17 | 8.65 | 8.43 | 0.05 | B11 |
| n37 | 184.72482 | 47.37585 | 13.95 | 4.01 | 8.90 | 8.68 | 0.08 | new |
| b21 | 184.74704 | 47.23744 | 13.97 | 4.26 | 8.87 | 8.64 | 0.05 | B11 |
| n33 | 184.79207 | 47.20681 | 14.70 | 5.12 | 8.77 | 8.54 | 0.08 | new |
| b27 | 184.78179 | 47.21117 | 14.79 | 4.37 | 8.86 | 8.63 | 0.05 | B11 |
| b29 | 184.80558 | 47.20044 | 15.03 | 5.62 | 8.71 | 8.49 | 0.05 | B11 |
| b28 | 184.79075 | 47.20444 | 15.28 | 5.13 | 8.77 | 8.54 | 0.05 | B11 |
| n10 | 184.79571 | 47.20149 | 15.44 | 5.00 | 8.79 | 8.56 | 0.08 | new |
| n32 | 184.79134 | 47.20305 | 15.50 | 3.57 | 8.95 | 8.73 | 0.08 | new |
| n9 | 184.81600 | 47.19271 | 15.97 | 8.23 | 8.40 | 8.24 | 0.08 | new |
| b31 | 184.80283 | 47.19433 | 16.29 | 6.17 | 8.65 | 8.43 | 0.05 | B11 |
| b18 | 184.68275 | 47.29047 | 16.35 | 3.98 | 8.91 | 8.68 | 0.05 | B11 |
| b32 | 184.82475 | 47.18944 | 16.36 | 3.47 | 8.97 | 8.74 | 0.05 | B11 |
| b25 | 184.84950 | 47.21756 | 16.57 | 5.13 | 8.77 | 8.54 | 0.05 | B11 |
| b24 | 184.74621 | 47.22606 | 16.73 | 8.31 | 8.39 | 8.23 | 0.05 | B11 |
| b26 | 184.85362 | 47.21656 | 17.24 | 5.01 | 8.78 | 8.56 | 0.05 | B11 |
| b33 | 184.83825 | 47.18361 | 17.33 | 7.08 | 8.54 | 8.34 | 0.05 | B11 |
| n11 | 184.85562 | 47.21184 | 17.49 | 4.56 | 8.84 | 8.61 | 0.08 | new |
| b34 | 184.83187 | 47.18072 | 17.61 | 5.99 | 8.67 | 8.45 | 0.03 | B11, new |
| b22 | 184.73733 | 47.22869 | 17.79 | 3.71 | 8.94 | 8.71 | 0.05 | B11 |
| n29 | 184.83392 | 47.17906 | 17.85 | 4.83 | 8.81 | 8.58 | 0.08 | new |
| n1 | 184.64927 | 47.32124 | 18.94 | 5.44 | 8.73 | 8.51 | 0.06 | new |
| b35 | 184.79721 | 47.17956 | 19.71 | 5.37 | 8.74 | 8.52 | 0.05 | B11 |
| b36 | 184.83121 | 47.16556 | 19.97 | 8.51 | 8.37 | 8.22 | 0.05 | B11 |
| n26 | 184.63013 | 47.33662 | 21.15 | 4.14 | 8.89 | 8.66 | 0.08 | new |
| b30 | 184.75992 | 47.19464 | 21.55 | 8.14 | 8.41 | 8.24 | 0.04 | B11, new |
| n7 | 184.61146 | 47.35218 | 23.36 | 3.72 | 8.94 | 8.71 | 0.06 | new |
| n5 | 184.62029 | 47.32604 | 25.13 | 5.59 | 8.71 | 8.49 | 0.08 | new |
