Possible in situ formation of Uranus and Neptune via Pebble Accretion
Abstract
The origin of Uranus and Neptune is still unknown. In particular, it has been challenging for planet formation models to form the planets in their current radial distances within the expected lifetime of the solar nebula. In this paper, we simulate the in-situ formation of Uranus and Neptune via pebble accretion and show that both planets can form within 3 Myr at their current locations, and have final compositions that are consistent with the heavy-element to H-He ratios predicted by structure models. We find that Uranus and Neptune could have been formed at their current locations. In several cases a few earth masses (M⊕) of heavy elements are missing, suggesting that Uranus and/or Neptune may have accreted 1 – 3 M⊕ of heavy elements after their formation via planetesimal accretion and/or giant impacts.
1 Introduction
Uranus and Neptune are the outermost planets in the solar system. They have masses of and M⊕ and are located at and AU, respectively. Unlike Jupiter and Saturn, the hydrogen-helium (hereafter, H-He) envelopes of Uranus and Neptune are relatively small fractions of their total masses (Fortney and Nettelmann, 2010; Nettelmann et al., 2013; Helled et al., 2010, 2020).
The in situ formation of Uranus and Neptune has been a challenge for a few decades because at such large orbital locations the formation time-scale typically exceeds the expected lifetimes of protoplanetary disks (Safronov, 1972). A potential solution for these long formation timescales is to assume that Uranus and Neptune formed closer to the Sun and then migrated outwards (Thommes et al., 1999; Tsiganis et al., 2005), however there is no evidence that Uranus and Neptune indeed formed farther in.
An important constraint for formation models of Uranus and Neptune is to reproduce their solid-to-gas ratio as inferred by structure models. For example, it was shown by Helled and Bodenheimer (2014) when using high heavy-element accretion rates as suggested by Rafikov (2011), the problem in forming Uranus and Neptune is no longer the formation time-scale but rather finding an agreement with the right heavy-element to H-He ratio, . In addition, it is difficult to explain why Uranus and Neptune accreted H-He without undergoing runaway accretion of gas becoming gas giants similar to Saturn and Jupiter. A very specific set of parameters is required to reproduce the observed mass and composition of Uranus and Neptune. This is known as the fine tuning problem.
The formation at large radial distances was presented by Goldreich et al. (2004). It was shown that Uranus and Neptune could form at their present-day orbital locations if the solid surface density is high enough (a few times that of the minimum mass solar nebula) and the solids have small sizes (a few cm). Such small solids can be generated by planetesimal collisions.
Further studies on planet formation via pebble accretion have confirmed that the pebble accretion rate can be high enough to form giant planets at large orbital locations (e.g., Lambrechts and Johansen, 2014; Bitsch, Bertram et al., 2015). However, in these studies the H-He mass during the planetary growth was often assumed to be equal to 10% of the total planetary mass. The formation of Uranus and Neptune via pebble accretion was presented in Lambrechts et al. (2014). In this study the dissolution of the accreted pebbles within the envelope was modeled assuming that the icy component of pebbles is uniformly sublimated into the envelope while the refractory material joins the core. In this model the envelope’s composition is uniform at all time, but enriched with respect to the stellar value. Lambrechts et al. (2014) showed that Uranus and Neptune can be formed in their current locations and that the inferred agrees with the ones inferred from structure models and is rather insensitive to the assumed orbital’s location.
An investigation of the formation of mini-Neptunes via pebble accretion was presented by Venturini and Helled (2017). Heavy-element enrichment of the planetary envelope was included in the equation of state (EOS) and opacity calculations. The authors consider both pebble and planetesimal accretion and explore the effect of the envelope’s opacity on the planetary growth. The occurrence rate of mini-Neptunes was found to be between 10 to 80 % when assuming pebble accretion. In the context of the formation of Uranus and Neptune, it was shown that pebbles accretion combined with a high opacity allow the formation of mini-Neptunes at 30 AU. On the other hand, accretion of planetesimal was found to lead to the formation of mini-Neptunes at small radial distances ( 5 AU) with the occurrence rate depending on the envelope’s opacity.
In both of the studies of Lambrechts et al. (2014) and Venturini and Helled (2017) the heavy-element enrichment of the envelope was not modeled self-consistently. The amount of pebbles dissolved in the envelope was not computed but rather assumed: half of the pebble’s mass, represented by rocky material, was set to join the core while the other half composed of water was assumed to be uniformly mixed in the planetary envelope. This is clearly an over-simplification since also rocky pebbles are expected to completely dissolve in the envelope due to their small sizes once the core mass reaches 2 M⊕ (e.g., Valletta and Helled, 2019; Brouwers et al., 2017). In addition, the heavy elements in the envelope of growing protoplanets are likely to have a gradual distribution and not being homogenously mixed (Lozovsky et al., 2017; Helled and Stevenson, 2017; Valletta and Helled, 2019, 2020).
In Valletta and Helled (2020) (hereafter VH20) we presented a numerical framework to model giant planet formation accounting self-consistently the effect of heavy-element enrichment of the planetary envelope on the equation of state and opacity calculation. In addition, we follow the deposition of the heavy elements in the envelope allowing for composition gradients, and calculate the consequent accretion of solids and gas.
In this study, we apply the model presented in VH20 to investigate the in-situ formation of Uranus and Neptune via pebble accretion as described in section 2. We search for formation paths in which the formation timescale and final compositions are consistent with the lifetime of the solar nebula and the inferred compositions of Uranus and Neptune from structure models, respectively. Our results are presented in section 3. We next discuss the connection to giant impacts on Uranus and Neptune in section 3.1. Finally, our conclusions are summarized in section 5.
2 Model
We simulate the in-situ formation of Uranus and Neptune via pebble accretion using the formation model presented in VH20. We adapted the numerical code MESA (Modules for experiment in stellar astrophysics) (Paxton et al., 2010, 2013, 2015, 2018, 2019) to simulate the formation of giant planets. The simulations begin with a heavy-element core with a mass of and a negligible envelope. The consequent planetary growth is insensitive to small changes in the initial conditions because at early stages gas accretion is limited for slightly different choices of core and envelope masses (e.g., Pollack et al., 1996; Ida and Lin, 2004) We use the EOS module developed by Müller et al. (2020) to properly model a mixture of H-He and heavy elements (represented by H2O) in planetary conditions. The total opacity is the sum of the gas and the dust opacity where the former is computed via the standard low temperature (Freedman et al., 2014) Rosseland tables and the latter is determined using the prescription of Valencia et al. (2013). The outer temperature and pressure are set to the disk’s pressure and temperature (Piso and Youdin, 2014) at the planet’s location. We compute the mass and energy deposition by the accreted pebbles and we include the presence of the the deposited H2O in the EOS and opacity calculations. More details on the model can be found in VH20.
2.1 Accretion rates
The heavy-element accretion rate is a key factor when modeling the formation of Uranus and Neptune. As shown in Helled and Bodenheimer (2014) very high solid accretion rates result in a formation time-scale that is too short and the forming planet would then be a giant planet. On the other hand, low accretion rates lead to the formation of mini-Neptunes/super-Earths. Accounting for the heavy-element enrichment of the envelope affects the gas accretion rate: H-He is accreted more rapidly as a consequence of the higher mean molecular weight of the envelope (Stevenson, 1982; Venturini et al., 2016; Venturini and Helled, 2017; Valletta and Helled, 2020).
Pebble accretion rate:
We use the pebble accretion rate derived by Lambrechts and Johansen (2014) (their Eq. 31) where we assume 500 g ; this parameter regulates the gas surface density.
The planetary growth depends on and the disk’s metallicity.
In the paper we fix the gas surface density and investigate the sensitivity of our results to the disk metallicity and viscosity. We also determine whether the pebble accretion rate is governed by 2D or 3D effects (using Eq. 5 of Venturini and Helled (2017)).
The expressions for the heavy-element accretion rates implemented in this work are given in Appendix D.
We follow Piso and Youdin (2014) to determine the pressure and temperature at the planet’s location.
The planetary growth depends on the solid surface density at the planet’s location. In Appendix E we show that the predicted solid surface density at 20 AU of our disk’s profile is similar to the minimum mass solar nebula model (Hayashi, 1981). Nevertheless, it should be kept in mind that the unknown solid surface density remains an important unknown property in planet formation models.
The accreted pebbles are assumed to be composed of pure water. In Appendix A we investigate the sensitivity of the results to the assumed composition of pebbles. In order to mimic gradual gas dissipation we multiply with the exponential factor as suggested by Lambrechts and Johansen (2014). The heavy-element accretion rate strongly depends on the assumed metallicity and viscosity of the disk but is only weakly affected by the orbital location In section 3 and 3.1 we present selected successful runs that lead to Uranus-like and Neptune-like while in Appendix B we present results for a larger set of assumed parameters.
Gas accretion rate:
We determine the gas (H-He) accretion rate numerically at each time-step by demanding that the computed planet’s radius equals RA (Lissauer et al., 2009):
| (1) |
where Mp is the planet’s mass, cs is the sound’s speed, and RH is the Hill’s radius.
Final composition:
Interior structure models of Uranus and Neptune that fit their basic physical properties (mass, radius, rotation, gravity field) constrain in Uranus and Neptune.
The mass of H-He is between 1.25 and 3.53 M⊕ for Uranus and is between 1.64 and 4.15 M⊕ for Neptune, i.e. a minimum and maximum metallicity of 0.75 and 0.9 (Nettelmann et al., 2013; Helled et al., 2011).
Planets like Uranus and Neptune are expected to form if the disk dissipates when the protoplanet has a mass of H-He compatible with observations.
Our simulations are terminated when the planet has accreted 3.5 and 4.2 M⊕ of H-He when modelling the formation of Uranus and Neptune, respectively, since these values correspond to the upper bound of the H-He mass in Uranus and Neptune as determined by structure models (e.g., Helled et al., 2011).
Formation likelihood:
In order to assess whether our formation model can realistically explain the formation of Uranus and Neptune, we calculate the likelihood of our formation scenario by computing the probability that the disk dissipates when the planet has a H-He mass as predicted by structure models as discussed above. The lifetime of the solar nebula is unknown, therefore we assume a probability density function for the disk’s lifetime . The likelihood of forming Uranus and Neptune is then given by the integral of in the time interval at which the planet has a H-He mass that is consistent with the mass range inferred by interior models and is given by:
| (2) |
where and correspond to the time when the protoplanet has a mass equal to the lower and upper limit of the expected H-He in Uranus and Neptune. Mmin and Mmax are the minimum and maximum masses of H-He that are expected in Uranus and Neptune (Helled and Fortney, 2020). We assume Mmin-U=1.25 M⊕ and Mmax-U = 3.53 M⊕ for Uranus, and Mmin-U=1.64 M⊕ and Mmax-N= 4.15 M⊕ for Neptune. The formation likelihood depends on Mmin-U(N) and Mmax-U(N) and in Appendix C we investigate the sensitivity of the results to these assumed values.
The likelihood of forming Uranus and Neptune as computed via Eq. 2 provides a guidance to determine the validity of a given model. The planetary growth depends on a set of parameters that are chosen ad-hoc to reproduce the formation of a Uranus- or Neptune- like planet within the assumed disk lifetimes. A more advanced calculation of the formation likelihood should also include the probability of the different disk’s parameters values (e.g., viscosity, metallicity).
It is difficult to estimate the probability density function . We therefore consider two different assumptions: (i) we assume that the disk’s dissipation time is given by a gaussian function with a median value of 3 Myrs and a standard deviation of 1 Myrs; (ii) we use Eq. 2 of Venturini and Helled (2017) where is given by an exponential function , with = 2.5 Myrs (e.g., Ribas et al., 2015; Pfalzner et al., 2014).
3 Results
The top panels of Figure 1 show successful simulations of the formation of Uranus and Neptune for a given set of parameters. In both cases the disk’s metallicity is assumed to be 1.45 Z⊙, however, the disk’s viscosity is 10-3 and 5 for Uranus and Neptune, respectively. In Appendix B we investigate the formation of Uranus and Neptune considering a larger parameter space of assumed properties.
The blue shaded region indicates the expected H-He mass as inferred from structure models. We find that at 20 AU, when the total mass is 14.5 M⊕ the planet has accreted 3 M⊕ of H-He, in agreement with Uranus’ structure models. This is also the case for Neptune where the planet has accreted 4 M⊕ when the total mass is 17.1 M⊕.
In order to prevent Uranus and Neptune from becoming gas giants, the disk should dissipate by the time they reach their final masses. For the cases presented in Fig. 1, we find that the dissipation time of the solar nebula should be 2.5 Myrs, compatible with the observed lifetimes of proto-planetary disks (Ribas et al., 2015; Pfalzner et al., 2014). The likelihood to form Uranus and Neptune according to the definition provided in Eq. 2 is found to be 9.7% and 10.6%, respectively.
It should be noted that we do not find a given set of model parameters that can reproduce the formation of both Uranus and Neptune exactly. As we show below (Appendix B) when we assume the same parameters for the solar nebula, we typically find that at least one of the planets is missing a couple of Earth masses of heavy elements and therefore must accrete additional heavy-elements or undergo a giant impact. While this is a plausible scenario as discussed in detail in section 3.1, it is also possible that the local conditions at 20 and 30 AU were different due to the ice line that is expected to be between Uranus and Neptune (Powell et al., 2017). This in return can that altered the the composition of the accreted pebbles and the gas metallicity.
Figure 1 shows selected examples of simulations that successfully lead to the in-situ formation of Uranus and Neptune. In appendix B we show the results for a larger set of assumed parameters that lead to the formation of Uranus-like and Neptune-like planets within the expected lifetime of the solar nebula.
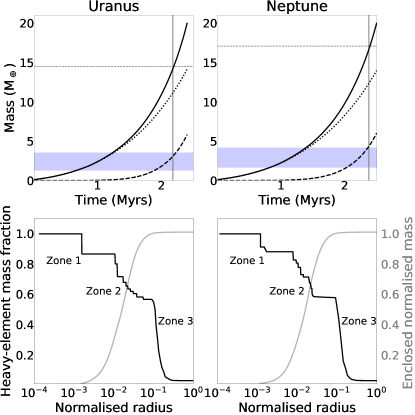
The bottom panels of Figure 1 show the post-formation heavy-element distributions for Uranus and Neptune for these simulations. As discussed in VH20 the primordial heavy-element profile reflects the accretion rate of solids and gas during the planetary growth. It can be seen that the two planets have similar, but not identical, heavy-element profiles. Both planets have composition gradients with the heavy-element mass fraction gradually decreasing towards the planetary surface; the plateau regions that are visible in the bottom panels of Figure 1 are the result of convective mixing that leads to a homogeneous composition. Interestingly, the internal structures of the planets can be roughly divided into three main regions: (i) the central region with a high heavy-element mass fraction of 0.8-1. The mass of the pure heavy-element compact core, is found to be about 4 and 3 M⊕ in Uranus and Neptune, respectively. (ii) an envelope with a composition gradient where the heavy-element decreases with increasing radial distance. In this region the heavy elements are mixed with H-He and the heavy element mass fraction between 40-70%. iii) an atmosphere dominated by H-He with a low heavy-element mass fraction of 0.03 , corresponding to 2.5 the solar value. Such three-zone division of the interior is qualitatively consistent with structure models of Uranus and Neptune (e.g., Helled et al., 2011; Nettelmann et al., 2013) and recent theoretical formation models (e.g., Helled and Stevenson, 2017; Valletta and Helled, 2020; Ormel et al., 2021).
3.1 Connection to giant impacts
In some runs the planet’s mass is equal to the mass of Uranus (Neptune) when the amount of H-He is about 3 M⊕ (4 M⊕). However, in many cases the final planetary mass is less than the mass of Uranus (Neptune) when the desired mass of H-He is reached. For these cases, in order to reproduce the masses of Uranus and Neptune and their composition as inferred by structure models, the planets must accrete additional heavy elements after the disk’s dissipation, typically of the order of a couple of M⊕. It should be noted, however, that the actual H-He mass in Uranus and Neptune could be lower of the order of 1.5 M⊕. If this is indeed the case, more massive impactors would be required. In Appendix B we show that this is a general trend for a relatively large set of parameters.
Such post-formation enrichment, could occur as a result of giant impacts which seems to be needed to explain the observed properties of the planets (e.g., Podolak and Helled, 2012; Reinhardt et al., 2020; Chau et al., 2020) or via late planetesimals accretion (Shibata and Ikoma, 2019; Shibata et al., 2020). Reinhardt et al. (2019) used SPH simulations and showed that the differences of the observed properties of Uranus and Neptune such as the axis tilt, the presence of moons, and the inferred moment of inertia, could be a result of giant impacts with different impact geometries. In these simulations, the impactor is accreted by the target (Uranus/Neptune) and has a typically mass between 1 and 3 M⊕. Such giant impacts are not only required to explain the final planetary mass, but also for enriching the envelope metallicities. As a result, giant impacts on Uranus and Neptune seem to be a likely scenario that is consistent with our formation models. The fact that in many simulations the planets can accrete significant amounts of H-He at early stages also has implications for our understanding of gaseous exoplanets with intermediate masses. Our models suggest that planets with smaller masses than those of Uranus and Neptune are likely to have higher H-He enrichment than those of Uranus and Neptune, as indicated by the large populations of mini-Neptunes (e.g., Otegi et al., 2019).
4 Discussion
While our study represents an advancement in our understanding of the formation of the outermost planets in the solar system, it is clear that further investigations are required. First, we do not find a given set of model parameters that can reproduce the formation of both Uranus and Neptune exactly. This could be resolved, for example, if the metallicities at 20 and 30 AU were different due to ice-lines between Uranus and Neptune (Powell et al., 2017) that could altered the metallicity or the composition of the pebbles. Alternatively, it is possible that only one of the planets underwent a giant impact. It is clear that this topic should be investigated further in future studies. Second, our models assume isolated planets and do not include the interaction between Uranus and Neptune as they grow. The pebble accretion rate is obtained under the assumption of an unperturbed disk where dust coagulates and drifts throughout the protoplanetary disk (Lambrechts and Johansen, 2014). However, the presence of another planet is expected to alter the disk structure and to opening gaps. This in turn can affect the pebble flux exerted at different orbital locations and therefore the planetary growth (Morbidelli, A., 2020). We therefore suggest that future studies should account for the simultaneous/consequent formation of Uranus and Neptune. Third, here we used analytical prescriptions for the accretion rate of pebbles. This is of course an approximation and 2D/3D simulations of the interaction between the proto-planet and the disk are clearly required. Numerical studies suggest that pebble accretion may be halted prior to the disk’s dissipation by the formation of a pressure bump (e.g., Bitsch, Bertram et al., 2015; Bitsch et al., 2018), with important consequences for their further evolution (Chen et al., 2020). Also, the heavy elements in this study are represented by pure-water. While pebbles are expected to be icy, they are likely to consist of various elements and future studies should implement EoS and opacity calculations of various mixtures. This is important since different compositions lead to different formation paths (see Appendix A). Accounting for various species for the heavy elements can also be used for providing predictions on the planetary composition and its depth dependence.
Finally, although our study focuses on the in situ formation of Uranus and Neptune it also has implications for the formation of intermediate-mass exoplanets. Since proto-planetary disks are expected to be diverse in metallicity, viscosity, and dissipation time, also the resulting planets are expected to differ in final mass and composition. This explains the large diversity that we observe in the range of intermediate-mass planets. However, the disk’s condition and the pebble accretion scenario may be different for planets located at smaller orbital distances. Accretion-limiting processes such as entropy advection (Ormel et al., 2015; Moldenhauer et al., 2021, e.g.) might operate in the inner, but not in the outer disk where the local conditions are different.
5 Summary and Conclusions
Understanding the formation of Uranus and Neptune is crucial for understanding the origin of our solar system, as well as the formation of intermediate-mass exoplanets. In this work we applied the giant planet formation model presented by VH20 to investigate the potential in-situ formation of Uranus and Neptune via pebble accretion. We simulated the formation of Uranus and Neptune assuming different disk metallicities and viscosities.
We find that Uranus and Neptune could have formed in-situ but that in many cases giant impacts are needed to explain the final mass and composition of the planets. The required mass of the impactor (or multiple impactors) depends on the model assumptions, such as the composition of the pebbles and the planet’s opacity (see Appendix A for discussion). The fact that a few Earth masses of heavy elements need to be accreted by Uranus and/or Neptune post-formation is consistent with the idea that Uranus and/or Neptune suffered giant impacts post-formation (e.g., Podolak and Helled, 2012; Reinhardt et al., 2019). We show that the primordial heavy-element distribution of Uranus and Neptune is gradual implying that both planets have complex internal structure with composition gradients. Our main conclusions can be summarized as follows:
-
•
Pebble accretion, when accounting for the H-He accretion rate correctly, can lead to the formation of Uranus and Neptune at their current radial distances. The forming planets accrete H-He in proportions that are consistent with the estimated H-He mass from structure models, and the formation timescale is comprable to the expected lifetime of the solar nebula (3 Myrs).
-
•
In many cases the formed planets need to accrete between 1 to 3 M⊕ of heavy-element post-formation in order to reach their final masses and inferred compositions. This is consistent with the giant impact scenario which seems to be needed to explain several properties of Uranus and Neptune (e.g., Reinhardt et al., 2019).
-
•
The primordial internal profiles can be roughly divided in three layers characterized by a different heavy-element mass fractions. We show that the deep interiors of Uranus and Neptune are characterized by composition gradients. The planets have no distinct layers or well-defined core-envelope boundary. The primordial heavy-element profile reflects the ratio between the solid and gas accretion rates (Helled and Stevenson, 2017; Valletta and Helled, 2020).
In this paper we showed that Uranus and Neptune could have formed at their current locations and that intermediate mass planets with H-He envelope is a common output of planet formation via pebble accretion which is in agreement with exoplanetary data (e.g., Otegi et al., 2019). Whether Uranus and/or Neptune experienced giant impacts remains to be determined.
It is clear that in order to better understand the origin and evolution of Uranus and Neptune space missions dedicated to their exploration as well as progress in theory are required (e.g., Helled et al., 2020; Helled and Fortney, 2020; Fletcher et al., 2021; Guillot et al., 2021). Such efforts are now ongoing, and we hope that future measurements and theoretical studies will reveal the true nature of this unique planetary class.
Acknowledgements
We thank an anonymous referee for valuable comments. We also thank Peter Bodenheimer and Sho Shibata for valuable comments. We acknowledge support from the Swiss National Science Foundation (SNSF) under grant 200020_188460.
References
- Bitsch et al. (2018) Bitsch, B., Morbidelli, A., Johansen, A., Lega, E., Lambrechts, M., and Crida, A. (2018). The pebble isolation mass — scaling law and implications for the formation of super-earths and gas giants. Astronomy & Astrophysics, 612.
- Bitsch, Bertram et al. (2015) Bitsch, Bertram, Lambrechts, Michiel, and Johansen, Anders (2015). The growth of planets by pebble accretion in evolving protoplanetary discs. A&A, 582:A112.
- Brouwers et al. (2017) Brouwers, Vazan, and Ormel (2017).
- Brouwers et al. (2021) Brouwers, M. G., Ormel, C. W., Bonsor, A., and Vazan, A. (2021). How planets grow by pebble accretion IV: Envelope opacity trends from sedimenting dust and pebbles. arXiv e-prints, page arXiv:2106.03848.
- Chachan et al. (2021) Chachan, Y., Lee, E. J., and Knutson, H. A. (2021). Radial gradients in dust-to-gas ratio lead to preferred region for giant planet formation. The Astrophysical Journal, 919(1):63.
- Chau et al. (2020) Chau, A., Reinhardt, C., Izidoro, A., Stadel, J., and Helled, R. (2020). Could Uranus and Neptune form by collisions of planetary embryos? In AGU Fall Meeting Abstracts, volume 2020, pages P066–0003.
- Chen et al. (2020) Chen, Y.-X., Zhang, X., Li, Y.-P., Li, H., and Lin, D. N. C. (2020). Retention of long-period gas giant planets: Type II migration revisited. 900(1):44.
- Fletcher et al. (2021) Fletcher, L. N., Helled, R., Roussos, E., Jones, G., Charnoz, S., André, N., Andrews, D., Bannister, M., Bunce, E., Cavalié, T., Ferri, F., Fortney, J., Grassi, D., Griton, L., Hartogh, P., Hueso, R., Kaspi, Y., Lamy, L., Masters, A., Melin, H., Moses, J., Mousis, O., Nettleman, N., Plainaki, C., Schmidt, J., Simon, A., Tobie, G., Tortora, P., Tosi, F., and Turrini, D. (2021). Ice giant system exploration within ESA’s Voyage 2050. Experimental Astronomy.
- Fortney and Nettelmann (2010) Fortney, J. J. and Nettelmann, N. (2010). 152(1):423–447.
- Freedman et al. (2014) Freedman, R. S., Lustig-Yaeger, J., Fortney, J. J., Lupu, R. E., Marley, M. S., and Lodders, K. (2014). The Astrophysical Journal Supplement Series, 214(2):25.
- Goldreich et al. (2004) Goldreich, P., Lithwick, Y., and Sari, R. (2004). Planet formation by coagulation: A focus on uranus and neptune. Annual Review of Astronomy and Astrophysics, 42(1):549–601.
- Guillot et al. (2021) Guillot, T., Fortney, J., Rauscher, E., Marley, M. S., Parmentier, V., Line, M., Wakeford, H., Kaspi, Y., Helled, R., Ikoma, M., Knutson, H., Menou, K., Valencia, D., Durante, D., Ida, S., Bolton, S. J., Li, C., Stevenson, K. B., Bean, J., Cowan, N. B., Hofstadter, M. D., Hueso Alonso, R., Leconte, J., Li, L., Mordasini, C., Mousis, O., Nettelmann, N., Soderlund, K., and Wong, M. (2021). Keys of a Mission to Uranus or Neptune, the Closest Ice Giants. In Bulletin of the American Astronomical Society, volume 53, page 244.
- Hayashi (1981) Hayashi, C. (1981). Progress of Theoretical Physics Supplement, 70:35–53.
- Helled et al. (2010) Helled, R., Anderson, J. D., Podolak, M., and Schubert, G. (2010). The Astrophysical Journal, 726(1):15.
- Helled et al. (2011) Helled, R., Anderson, J. D., Podolak, M., and Schubert, G. (2011). ApJ, 726:15.
- Helled and Bodenheimer (2014) Helled, R. and Bodenheimer, P. (2014). The Astrophysical Journal, 789(1):69.
- Helled and Fortney (2020) Helled, R. and Fortney, J. J. (2020). The interiors of Uranus and Neptune: current understanding and open questions. Philosophical Transactions of the Royal Society of London Series A, 378(2187):20190474.
- Helled et al. (2020) Helled, R., Nettelmann, N., and Guillot, T. (2020). Uranus and neptune: Origin, evolution and internal structure. Space Science Reviews, 216(3):38.
- Helled and Stevenson (2017) Helled, R. and Stevenson, D. (2017). The fuzziness of giant planets’ cores. The Astrophysical Journal, 840(1):L4.
- Ida and Lin (2004) Ida, S. and Lin, D. N. C. (2004). Toward a deterministic model of planetary formation. i. a desert in the mass and semimajor axis distributions of extrasolar planets. The Astrophysical Journal, 604(1):388–413.
- Lambrechts and Johansen (2014) Lambrechts and Johansen (2014). A&A, 572:A107.
- Lambrechts et al. (2014) Lambrechts, Johansen, A., and Morbidelli, A. (2014). Separating gas-giant and ice-giant planets by halting pebble accretion. A&A, 572:A35.
- Lissauer et al. (2009) Lissauer, J. J., Hubickyj, O., D’Angelo, G., and Bodenheimer, P. (2009). Icarus, 199(2):338 – 350.
- Lozovsky et al. (2017) Lozovsky, M., Helled, R., Rosenberg, E. D., and Bodenheimer, P. (2017). The Astrophysical Journal, 836(2):227.
- Moldenhauer et al. (2021) Moldenhauer, Kuiper, R., Kley, W., and Ormel, C. W. (2021). Steady state by recycling prevents premature collapse of protoplanetary atmospheres. A&A, 646:L11.
- Morbidelli et al. (2015) Morbidelli, A., Lambrechts, M., Jacobson, S., and Bitsch, B. (2015). Icarus, 258:418 – 429.
- Morbidelli, A. (2020) Morbidelli, A. (2020). Planet formation by pebble accretion in ringed disks. A&A, 638:A1.
- Mordasini et al. (2014) Mordasini, Klahr, H., Alibert, Y., Miller, N., and Henning, T. (2014). A&A, 566:A141.
- Movshovitz and Podolak (2008) Movshovitz, N. and Podolak, M. (2008). The opacity of grains in protoplanetary atmospheres. Icarus, 194:368–378.
- Müller et al. (2020) Müller, Helled, Ravit, and Cumming, Andrew (2020). The challenge of forming a fuzzy core in jupiter. A&A, 638:A121.
- Nettelmann et al. (2013) Nettelmann, N., Helled, R., Fortney, J., and Redmer, R. (2013). New indication for a dichotomy in the interior structure of uranus and neptune from the application of modified shape and rotation data. Planetary and Space Science, 77:143–151. Surfaces, atmospheres and magnetospheres of the outer planets and their satellites and ring systems: Part VIII.
- Nettelmann et al. (2013) Nettelmann, N., Helled, R., Fortney, J. J., and Redmer, R. (2013). Planet. Space Sci., 77:143–151.
- Ormel et al. (2021) Ormel, Vazan, and Brouwers (2021). How planets grow by pebble accretion - iii. emergence of an interior composition gradient. A&A, 647:A175.
- Ormel (2014) Ormel, C. (2014). AN ATMOSPHERIC STRUCTURE EQUATION FOR GRAIN GROWTH. The Astrophysical Journal, 789(1):L18.
- Ormel et al. (2015) Ormel, C. W., Shi, J.-M., and Kuiper, R. (2015). Hydrodynamics of embedded planets’ first atmospheres – II. A rapid recycling of atmospheric gas. Monthly Notices of the Royal Astronomical Society, 447(4):3512–3525.
- Otegi et al. (2019) Otegi, J., Bouchy, F., and Helled, R. (2019).
- Paxton et al. (2010) Paxton, B., Bildsten, L., Dotter, A., Herwig, F., Lesaffre, P., and Timmes, F. (2010). The Astrophysical Journal Supplement Series, 192(1):3.
- Paxton et al. (2013) Paxton, B., Cantiello, M., Arras, P., Bildsten, L., Brown, E. F., Dotter, A., Mankovich, C., Montgomery, M. H., Stello, D., Timmes, F. X., and Townsend, R. (2013). The Astrophysical Journal Supplement Series, 208(1):4.
- Paxton et al. (2015) Paxton, B., Marchant, P., Schwab, J., Bauer, E. B., Bildsten, L., Cantiello, M., Dessart, L., Farmer, R., Hu, H., Langer, N., Townsend, R. H. D., Townsley, D. M., and Timmes, F. X. (2015). The Astrophysical Journal Supplement Series, 220(1):15.
- Paxton et al. (2018) Paxton, B., Schwab, J., Bauer, E. B., Bildsten, L., Blinnikov, S., Duffell, P., Farmer, R., Goldberg, J. A., Marchant, P., Sorokina, E., Thoul, A., Townsend, R. H. D., and Timmes, F. X. (2018). The Astrophysical Journal Supplement Series, 234(2):34.
- Paxton et al. (2019) Paxton, B., Smolec, R., Schwab, J., Gautschy, A., Bildsten, L., Cantiello, M., Dotter, A., Farmer, R., Goldberg, J. A., and Jermyn, A. S. (2019). arXiv e-prints, page arXiv:1903.01426.
- Pfalzner et al. (2014) Pfalzner, S., Steinhausen, M., and Menten, K. (2014). The Astrophysical Journal, 793(2):L34.
- Piso and Youdin (2014) Piso, A.-M. A. and Youdin, A. N. (2014). The Astrophysical Journal, 786(1):21.
- Podolak and Helled (2012) Podolak, M. and Helled, R. (2012). What Do We Really Know about Uranus and Neptune? ApJ, 759(2):L32.
- Pollack et al. (1996) Pollack, J. B., Hubickyj, O., Bodenheimer, P., Lissauer, J. J., Podolak, M., and Greenzweig, Y. (1996). Icarus, 124(1):62 – 85.
- Powell et al. (2017) Powell, D., Murray-Clay, R., and Schlichting, H. E. (2017). Using ice and dust lines to constrain the surface densities of protoplanetary disks. The Astrophysical Journal, 840(2):93.
- Rafikov (2011) Rafikov, R. R. (2011). ApJ, 727:86.
- Reinhardt et al. (2019) Reinhardt, C., Chau, A., Stadel, J., and Helled, R. (2019). Bifurcation in the history of Uranus and Neptune: the role of giant impacts. Monthly Notices of the Royal Astronomical Society, 492(4):5336–5353.
- Reinhardt et al. (2020) Reinhardt, C., Chau, A., Stadel, J., and Helled, R. (2020). Bifurcation in the history of uranus and neptune: the role of giant impacts. Monthly Notices of the Royal Astronomical Society, 492:5336–5353.
- Ribas et al. (2015) Ribas, Bouy, Hervé, and Merín, Bruno (2015). A&A, 576:A52.
- Safronov (1972) Safronov, V. S. (1972).
- Shibata et al. (2020) Shibata, Helled, and Ikoma (2020). The origin of the high metallicity of close-in giant exoplanets - combined effects of resonant and aerodynamic shepherding. A&A, 633:A33.
- Shibata and Ikoma (2019) Shibata, S. and Ikoma, M. (2019). Monthly Notices of the Royal Astronomical Society, 487(4):4510–4524.
- Stevenson (1982) Stevenson, D. (1982). Formation of the giant planets. Planetary and Space Science, 30(8):755–764.
- Thommes et al. (1999) Thommes, E. W., Duncan, M. J., and Levison, H. F. (1999). Nature, 402(6762):635–638.
- Tsiganis et al. (2005) Tsiganis, K., Gomes, R., Morbidelli, A., and Levison, H. F. (2005). Nature, 435(7041):459–461.
- Valencia et al. (2013) Valencia, D., Guillot, T., Parmentier, V., and Freedman, R. S. (2013). The Astrophysical Journal, 775(1):10.
- Valletta and Helled (2020) Valletta and Helled (2020). The Astrophysical Journal, 900(2):133.
- Valletta and Helled (2019) Valletta, C. and Helled, R. (2019). The Astrophysical Journal, 871(1):127.
- Venturini et al. (2016) Venturini, Alibert, Yann, and Benz, Willy (2016). A& A, 596:A90.
- Venturini and Helled (2017) Venturini, J. and Helled, R. (2017). The Astrophysical Journal, 848.
Appendix A The importance of opacity and composition of the pebbles
As shown in previous studies, the envelope’s opacity significantly affects the H-He accretion rate (e.g., Brouwers et al., 2021, 2017; Mordasini et al., 2014; Movshovitz and Podolak, 2008). The opacity that we used in this study corresponds to the sum of the gas and dust opacity. Determining the grain opacity, however, is challenging since it depends on many parameters, such as the number of grains present in a layer, their composition, shape, and size distribution. For simplicity, the dust grain opacity is simply calculated using the prescription of Valencia et al. (2013).
The dust opacity derived by Valencia et al. (2013) is significantly higher than suggested by other studies (Mordasini et al., 2014; Ormel, 2014; Brouwers et al., 2021). However, the grain opacity is expected to be high at early phases of the planetary growth when the protoplanet accretes pebbles due to efficient pebble fragmentation (Brouwers et al., 2021; Chachan et al., 2021), pebble ablation (e.g., Valletta and Helled, 2020) and bouncing collisions between accreted pebbles (Ormel et al., 2021).
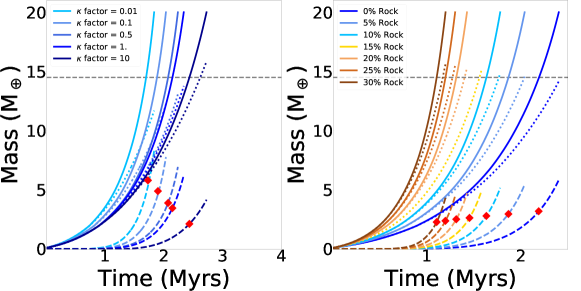
Here in order to demonstrate the importance of the dust opacity on the planetary growth we multiply the dust opacity by a fixed factor. The results are shown in Figure 3 where different line colours represent cases with the opacity is multiplied by different factors. It is clear from the figure that the planetary growth strongly depends on the dust opacity: higher dust opacity result in less efficient accretion of gas.
The composition of the accreted pebbles is also important since it can affect the solid accretion rate, due to the modification of the Stokes number. Pebbles with higher densities lead to higher solid accretion rates and therefore shorter formation timescales. The stokes number depends on the pebble density according to Eq. 6 of Lambrechts and Johansen (2014). In turn, the solid accretion rate is affected by the Stokes number as can be seen in Eq. D3.
In the right panel plot of Figure 3 we show the planetary growth for different assumed pebble composition. Different colours represent different assumed pebble’s density. Rock is represented by SiO2, with a density of 2.7 g cm-3. As expected, higher rock fractions lead to higher solid accretion rates. It should be noted that for simplicity in these calculations the pebble composition is not considered in the equation of state and opacity calculations.
Appendix B Dependence on the metallicity and viscosity of the disk
In this section, we investigate a larger parameter space of disk’s metallicity and viscosity.
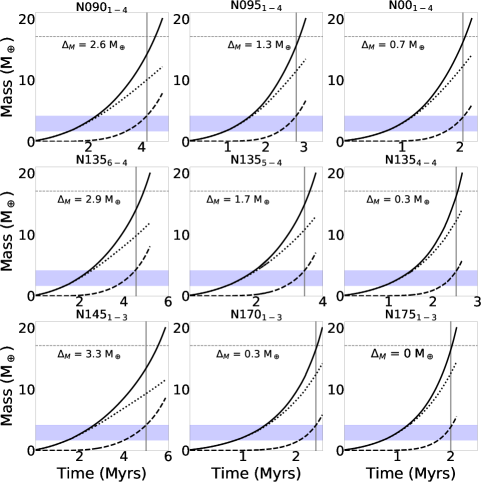
The range of parameters is summarized in Table 1, where the names of the runs names reflect the assumed parameters: the first letter of the run’s name of U or N corresponds to the formation of Uranus or Neptune, respectively. The time at which the simulation is terminated essentially corresponds to the required disk’s dissipation time, which is indicated in the fourth column of the table. The second and third columns in Table 1 represent the disk’s metallicity in solar units (we use Z) and the disk’s viscosity, respectively. The metallicity and viscosity of the disk are also indicated by the run name. For example, U130 indicates a metallicity equals to 1.30 Z⊙, while ”1-3” represents a disk’s viscosity of . The fourth column indicates the missing heavy-element mass that needs to be accreted after the dissipation of the solar nebula. If M = 0 the planet have reached the mass of Uranus/Neptune when the disk dissipates. In this case if a giant impact occurs after the disk’s dissipation the mass of heavy elements in the planet can exceeds the amount inferred by observations. The fifth column indicates the formation probability (Eq. 2) where the disk’s dissipation time is assumed to obey a gaussian probability function, while the sixth () column shows the formation probability as computed via equation 2 of Venturini and Helled (2017).
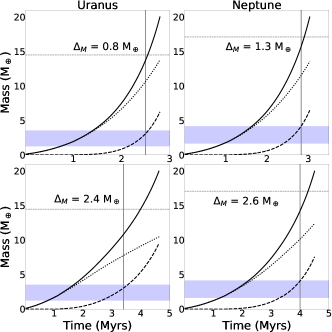
The first two runs indicated in Table 1 (U1451-3 and N1455-4) are the ones presented in Figure 1. The top panels of Figure 2 show runs U1401-3 and N1405-4 while in the bottom panels are shown runs U1451.5 and N1457.5-4. The other runs listed in Table 1 are presented in Figure 4.
The runs listed in Table 1 include disk metallicities between 0.8 and 1.75 Z⊙ and a disk viscosities between 10-3 and 10-4. We find that for these assumed ranges, the inferred required dissipation time is in agreement with the expected lifetime of the solar nebula, 1.8 – 4 Myrs. In many cases a couple M⊕ of heavy elements are missing when the disk dissipates, suggesting that Uranus and/or Neptune must accrete 1 – 3 M⊕ of heavy elements post formation. This could be in the form of giant impacts, which is consistent with the idea that both Uranus and Neptune suffered giant impacts post-formation, that can explain their observed physical properties (e.g., Podolak and Helled, 2012; Reinhardt et al., 2019). However, there is a sufficient number of cases in which the planets reach the measured mass of Uranus/Neptune by the end of the simulation and no further accretion is required. Finally, Table 1 also lists the formation probability for the different scenarios. We find that in general the formation probability as defined in Venturini and Helled (2017) is lower than our definition given in Eq. 2. However, for both definitions, the presented scenarios are plausible. The formation probability goes up to 35% according to our definition and to 18% according to the definition provided in Venturini and Helled (2017). This suggests that Uranus- and Neptune- like planet are a rather common outcome of pebble accretion at large orbital distances. Generally speaking, scenarios requesting giant impacts are found to be more probable. In the cases where extra mass of heavy elements are required to be accreted post-formation, the planetary growth is slower and the protoplanet spends more time in the blue region of the plots (the region with the correct mass of H-He).
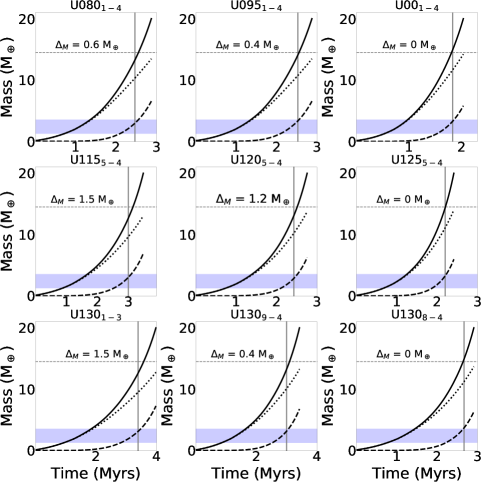
Figure 4 demonstrates that for given assumed parameters for the solar nebula we predict different formation paths for Uranus and Neptune as we don’t find a setup which reproduced the observed properties of both planets. For example, in U001-4 and N001-4 the same set of parameters are assumed at 20 and 30 AU, however in this case we find that Uranus reaches its final mass and expected composition, while Neptune needs to accrete an extra 0.9 M⊕ of heavy elements. In the case of U0951-4 and N0951-4 both planets don’t reach their final masses by the end of the simulations, and both Uranus and Neptune need to accrete 1 and 1.5 M⊕ of heavy elements post-formation. Interestingly, we find that in most of these cases we have intermediate mass planets with non-negligible H-He envelope, consistent with the observed exoplanet populations.
| Run name | Disk’s metallicity (Z⊙) | Disk’s viscosity | Dissipation time (Myr) | M (M⊕) | -V | |
| U1451-3 | 1.45 Z⊙ | 10-3 | 2.1 | 0 M⊕ | 9.5 % | 9.4 % |
| N1455-4 | 1.45 Z⊙ | 5 10-4 | 2.4 | 0 M⊕ | 10.5 % | 8.7 % |
| U1401-3 | 1.40 Z⊙ | 10-3 | 2.5 | 0.8 M⊕ | 14.5% | 10.4% |
| N1405-4 | 1.40 Z⊙ | 5 10-4 | 2.83 | 1.3 M⊕ | 18.3% | 10.3% |
| U1451.5 | 1.45 Z⊙ | 1.5 | 3.5 | 2.4 M⊕ | 35 % | 18.3 % |
| N1457.5-4 | 1.45 Z⊙ | 7.5 | 4 | 2.6 M⊕ | 25% | 11.3% |
| U0801-4 | 0.80 Z⊙ | 2.48 | 0.6 M⊕ | 15.7% | 11.3% | |
| U0951-4 | 0.90 Z⊙ | 2.5 | 0.4 M⊕ | 16% | 11.2% | |
| U001-4 | 1.00 Z⊙ | 1.82 | 0 M⊕ | 6.3% | 10.6% | |
| U1155-4 | 1.15 Z⊙ | 5 | 3.1 | 1.5 M⊕ | 24.5% | 12.4% |
| U1205-4 | 1.20 Z⊙ | 5 | 2.4 | 1.2 M⊕ | 14.2% | 10.5% |
| U1255-4 | 1.25 Z⊙ | 5 | 2.2 | 0 M⊕ | 10.0% | 9.9% |
| U1301-3 | 1.30 Z⊙ | 3.4 | 1.5 M⊕ | 27.5% | 12.3% | |
| U1309-4 | 1.30 Z⊙ | 9 | 3 | 0.4 M⊕ | 22.7% | 11.4% |
| U1308-4 | 1.30 Z⊙ | 8 | 2.7 | 0 M⊕ | 16.8% | 10.9% |
| N0901-4 | 0.90 Z⊙ | 4.20 | 2.6⊕ | 23% | 12.2% | |
| N0951-4 | 0.95 Z⊙ | 2.80 | 1.3 M⊕ | 18.7% | 10.8% | |
| N001-4 | 1.00 Z⊙ | 2.05 | 0.7 M⊕ | 7.7% | 9.4% | |
| N1356-4 | 1.35 Z⊙ | 6 | 4.55 | 2.9 M⊕ | 23% | 12.8% |
| N1355-4 | 1.35 Z⊙ | 5 | 3.45 | 1.7 M⊕ | 24.5% | 11.6% |
| N1354-4 | 1.35 Z⊙ | 4 | 2.52 | 0.3 M⊕ | 13.1% | 9.1% |
| N1451-3 | 1.45 Z⊙ | 5 | 3.3 M⊕ | 17.2% | 12.9% | |
| N1701-3 | 1.70 Z⊙ | 2.36 | 0.3 M⊕ | 10.9% | 8.9% | |
| N1751-3 | 1.75 Z⊙ | 2 | 0 M⊕ | 6.4% | 7.8% |
Uranus
Neptune
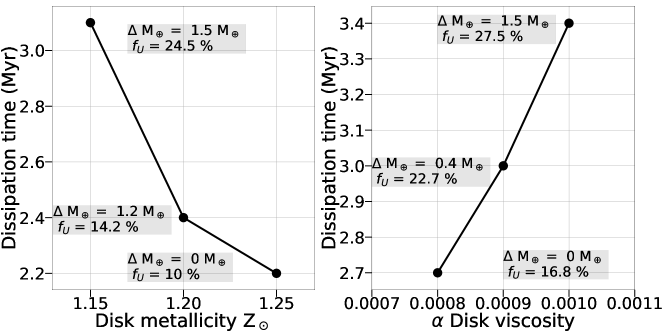
In Figure 5 we show in detail how the disk’s dissipation time, the M and the formation probability depend on the disk’s metallicity and disk’s viscosity. The left panel shows runs U1155-4, U1205-4 and U1255-4. The various model parameters are kept fixed and we investigate the sensitivity of the results to the assumed disk’s metallicity. We find that the dissipation time, M and the formation probability decrease with increasing disk metallicity. The right panel plot shows runs U1309-4, U1308-4 and U1301-3. Here, the metallicity is fixed and we investigate how our results depend on the disk’s viscosity. We find that the dissipation time M and the formation probability increase with increasing viscosity.
Appendix C Internal composition of Uranus and Neptune
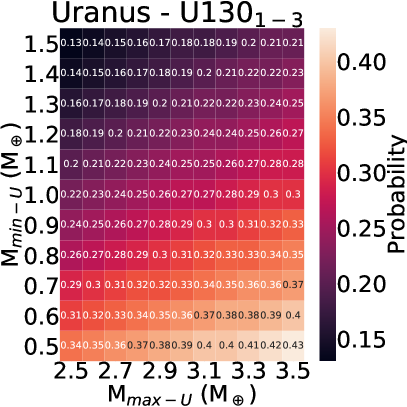
The computed formation probability shown in the last two columns of Table 1 depends on the assumed minimum and maximum mass of H-He in Uranus and Neptune. We assumed that Mmin-U(N) and Mmax-U(N) are 1.25 (1.64) M⊕ and Mmax-U(N) is 3.53 (4.15) M⊕. In figure 6 we explore the sensitivity of the formation likelihood on Mmin-U(N) and Mmax-U(N). In the left and right panel plot we show the formation probability of forming Uranus (represented by run U1301-3) and Neptune (represented by run N1451-3), respectively. The x and y-axis indicate Mmax-U(N) and Mmin-U(N), respectively. The formation probability is indicated by a color scheme. We find that when assuming a low Mmin-U(N) and a large Mmax-U(N) the formation probability of Uranus and Neptune is relatively high. In particular, the left panel plot suggests that assuming a maximum and a minimum H-He Uranus mass of 0.5 and 3.5 M⊕ results in a formation probability 40%. On the other hand, the formation probability becomes significantly smaller when assuming low Mmax-U(N) and high Mmin-U(N).
Appendix D Pebble accretion rate
The pebble (i.e., heavy-element) accretion rate implemented in this work is given by (Lambrechts and Johansen, 2014):
| (D1) |
where and represent the mass of the planet and the mass of the central star, respectively. and indicate the disk metallicity and the gas surface density, respectively. Finally, and represent the protoplanet’s age and the orbital location. The pebble accretion rate transitions to the lower 3D regime when:
| (D2) |
where , and represent the pebble scale height, the Stokes number, and the Hill’s radius, respectively. In this case, the pebble accretion rate is given by: (Morbidelli et al., 2015):
| (D3) |
where represents the 2D solid accretion rate given in Eq. D1.
Appendix E Disk model
Our baseline model is similar to the one presented in Lambrechts and Johansen (2014) where it is assumed that the gas surface density of the disk obeys a simple power law:
| (E1) |
where g cm-2. For the temperature and pressure profiles we adopt a passively irradiated disk model (Piso and Youdin, 2014) where:
| (E2) |
| (E3) |
We use an analytical approximation to model the pebble accretion rate (Eq. D1). The mass of accreted pebbles depends on the local solid surface density at the planet’s formation. As a result, the results of our simulations do not depend on the implemented disk model as long as different disk models predict a similar solid surface density at the planet’s formation location. For example, in Venturini and Helled (2017) the authors followed the minimum mass solar nebula model (Hayashi, 1981); the gas surface density is given by:
| (E4) |
where g cm-2. Assuming a metallicity of 0.018 (which is the baseline model in Venturini and Helled (2017)) the solid surface density predicted by Eq. E4 at 20 AU is similar to our disk model assuming a metallicity of 1 Z⊙ which is the case shown in the top right plot in Figure 4.