Connecting Structure, Conformation and Energetics of Human
Telomere G-quadruplex Multimers
Abstract
G-quadruplexes (G4s) are helical four-stranded structures forming from guanine-rich nucleic acid sequences, which are thought to play a role in cancer development and malignant transformation. Most current studies focus on G4 monomers, yet under suitable and biologically relevant conditions G4s undergo multimerization. Here, we address the structural, conformational and energetic features of G4 multimers formed in solutions by the human telomere sequence. A novel multi-technique approach is used combining Small Angle X-ray Scattering (SAXS) and circular dichroism experiments with coarse-grained simulations, to provide quantitative information about large-scale structural features and the stability of G4 multimers. The latter show a significant polydispersity with an exponential distribution of contour lengths, suggesting a step-growth polymerization. On increasing DNA concentration, the strength of G4 stacking interaction increases, as well as the number of the units in the aggregates, with dimers and trimers as the most probable forms. At the same time, a variation of G4 conformation is observed. Our findings provide a quantitative picture of human telomere G4 multimers, which must be accounted for to achieve a rational design of anticancer drugs targeting DNA structures.
keywords:
DNA, Small Angle X-ray Scattering, Coarse-Grained Simulations, Circular Dichroism, Structural BiologyBenedetta Petra Rosi Valeria Libera Andrea Orecchini Silvia Corezzi Giorgio Schirò Petra Pernot Caterina Petrillo Lucia Comez* Cristiano De Michele* Alessandro Paciaroni*
Dr. B. P. Rosi, Dr. V. Libera, Prof. A. Orecchini, Prof. S. Corezzi, Prof. C. Petrillo, Prof. A. Paciaroni
Dipartimento di Fisica e Geologia
Università degli Studi di Perugia
Perugia 06123, Italy
E-mail: alessandro.paciaroni@unipg.it
Prof. A. Orecchini, Dr. L. Comez
IOM-CNR c/o Dipartimento di Fisica e Geologia
Università degli Studi di Perugia
Perugia 06123, Italy
E-mail: comez@iom.cnr.it
C. De Michele
Dipartimento di Fisica
Università degli Studi di Roma “La Sapienza”
Rome 00185, Italy
E-mail: cristiano.demichele@uniroma1.it
G. Schirò
Institut de Biologie Structurale
CNRS
Grenoble 38000, France
P. Pernot
European Synchrotron Radiation Facility (ESRF)
Grenoble 38043, France
1 Introduction
Deciphering the relationship between structure and function of biological molecules is a difficult but crucial task. This appears even more complex, if one considers that in the physiological context the role played by a biomolecule not only depends on the behavior in its monomeric state, but also on the interaction among different biomolecules and/or biomolecular units giving rise to higher-order structures. A paradigmatic case where the higher-order structure is crucial is represented by G-quadruplexes (G4s). These biomolecules are noncanonical nucleic acid structures formed by G-rich oligonucleotides which fold into four-stranded helical structures consisting of multiple stacked planar arrays of four guanine bases associated through cyclic Hoogsteen-like hydrogen bonds (G-tetrads) [1]. G4s display three main topologies (parallel, antiparallel and hybrid) that differ in the relative orientation of the four guanine runs and in the arrangement of loop regions [2, 3, 4]. They are highly polymorphic, as their structure depends both on the specific oligonucleotide sequence and on environmental factors, such as the type and concentration of cations, molecular crowding and/or dehydration conditions [5, 6, 7, 8, 9, 10]. In the genomes of higher eukaryotes, sequences with the ability to form G4s are abundant [11, 12, 13] and concentrated in the telomeric regions (up to 25 % of all G4 DNA) [14]. G4s have also been detected in cells [15, 14], where they are thought to regulate transcription, translation, DNA replication, RNA localization and other biological functions [16, 17, 18]. Because of such biological importance, G4s have received a lot of attention as drug-design targets [1, 19, 20]. In particular, since G4s have been demonstrated to block telomerase and HIV integrase, there is cause to believe that specific G4-stabilizing ligands could be used as anti-cancer or anti-viral drugs [21, 22].
In addition to this, G4s have been widely investigated as promising building blocks and functional elements in fields such as synthetic biology and nanotechnology [23, 24], mostly because of their high stability, structural versatility, and functional diversity.
The majority of studies on G4s have focused on their monomeric state, but there is evidence that G4s can take many different multimeric forms [25]. Aggregation has been shown to depend on the length of loops and likely to occur through the stacking of external G-tetrads of parallel folds, with dimers and trimers as the most probable aggregated forms [9].
It has been recently proposed that multimeric G4s may have an important biological role in the case of telomeric DNA, where the 3’ single-stranded overhang has the capability to form higher-order structures containing several G4 units linked by TTA spacers [26]. An effective design of anticancer drugs targeting telomere G4s [27] clearly demands for a detailed knowledge of the spatial arrangement and stability of their multimeric structure.
Here we investigate the structural, conformational and energetic features of multimers formed by units of the human telomere sequence Tel22 [AG3(T2AG3)3], by exploiting a unique biophysical multi-technique approach that combines small angle X-ray scattering (SAXS), circular dichroism (CD) and coarse-grained simulations.
The comparison of experimental and numerical data allows a quantitative description of the multimerization of Tel22 G4s at increasing DNA concentrations and unveils how the aggregation process affects the structure, the conformation and stacking interactions of Tel22 G4s units.
2 Results and Discussion
2.1 Small-angle X-ray Scattering
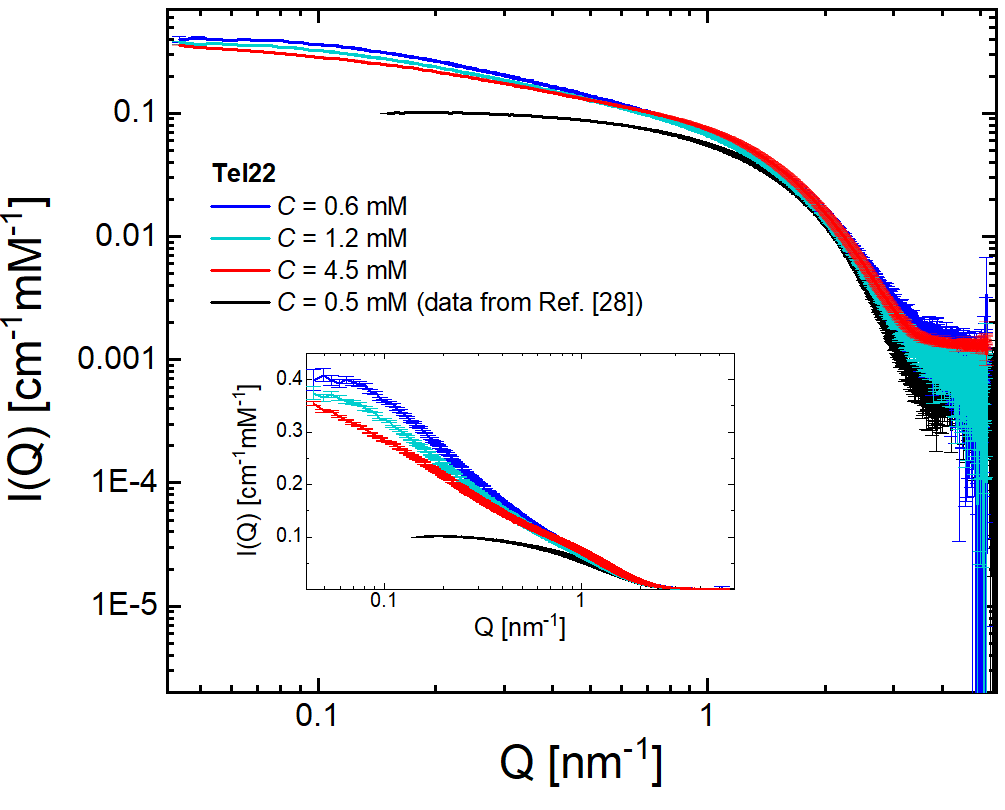
To experimentally investigate the structural properties of concentrated G4 samples, we performed SAXS measurements on G4 solutions at different DNA concentrations. In the high- region, nm-1, the signal accounts mainly for the structural features of the G4 unit (Tel22), i.e. shape and characteristic dimensions, through the so-called form factor function . On the other hand, in the intermediate- and low-Q regions, the intensity reflects the higher-order structure arising from the reversible multimerization process of G4 units. In particular, the contribution of Tel22 multimers is quite visible, as a clear deviation below nm-1 in Figure 1, where the scattering intensity of a solution of Tel22 monomers at DNA concentration mM (data taken from Reference [28]) is compared with that of the present study. It is worth noting that the monomeric sample was prepared in such a way to rule out the presence of possible aggregates (see the Methods section). Actually, describing the complex mechanism of G4s self-assembly and deriving quantitative information on structural and conformational features of the G4 aggregates from SAXS measurements is a very difficult task, as we expect a significant degree of polydispersity in the length distribution of the aggregates [29]. Also in the high-Q region, where the SAXS signal is dominated by the form factor, the interpretation of the experimental data deserves great care. In a previous study [28], we found the form factor of Tel22 monomers in solution to be well described by that of a hard cylinder (HC). In this case the topology of Tel22 consists of a mixture of antiparallel and hybrid conformers, however, an increase of concentration above mM drives a progressive shift toward the parallel (propeller) state, with concomitant decrease of the anti-parallel and hybrid forms [30, 31, 32, 33]. This shift in the conformational populations entails a different description of the average G4 unit, as each conformer is characterized by a different shape and volume [34]. Since the only form factor known for the Tel22 sequence in solution is the one in the antiparallel conformation (143D structure in the PDB database [35]), we exploited numerical simulations in conjuction with experimental data to get new insights into the basic structural features of the different conformers.
2.2 Simulation model
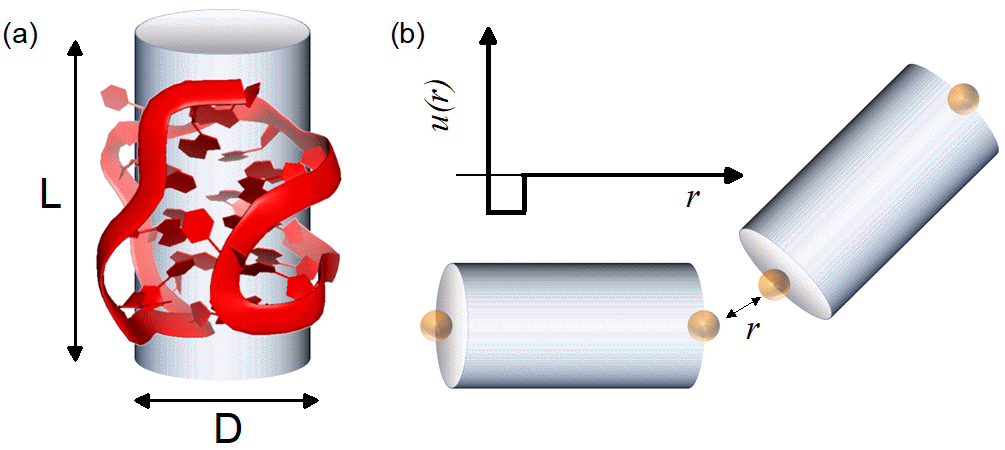
To obtain more quantitative information on the G4 ensembles, we developed a novel approach comparing SAXS experimental intensities with those computationally estimated through Monte Carlo (MC) simulations, by modeling the G4 unit as a hard cylinder (HC) with two attractive sites at the basis, as schematized in Figure 2 (for more details see the Methods section). Scattering intensities from simulations of HCs have been obtained following a procedure similar to that discussed in Reference [36]. Within this procedure each cylinder is replaced with a set of scattering points randomly placed inside its volume with a fixed number density, and by using these points the structure factor is then calculated. This procedure ensures that the numerical scattering intensity also includes the form factor of HCs so that it can be directly compared with the experimental one. This simple yet effective coarse-grained model has proven to successfully describe reversible self-aggregation processes in other DNA-based systems [37, 38], and it is especially suitable for describing the hydrophobic (stacking) forces acting between G4 units. An extensive campaign of simulations was carried out so as to reproduce SAXS results for all the concentrations studied experimentally. In particular, to find the best agreement between simulations and experiments we explored the phase space corresponding to different G4 shapes and different strength of stacking interaction between units. As to the former, the starting point was a HC with a diameter of nm and a length of nm that best reproduces the monomeric form of Tel22 sequences [28]. To modulate the shape of the cylinder we introduced the parameter , so that and (). Finally, the stacking interaction between G4s was varied through the effective temperature (where is the binding energy of the HC attractive sites).
2.3 Comparison between SAXS data and simulations
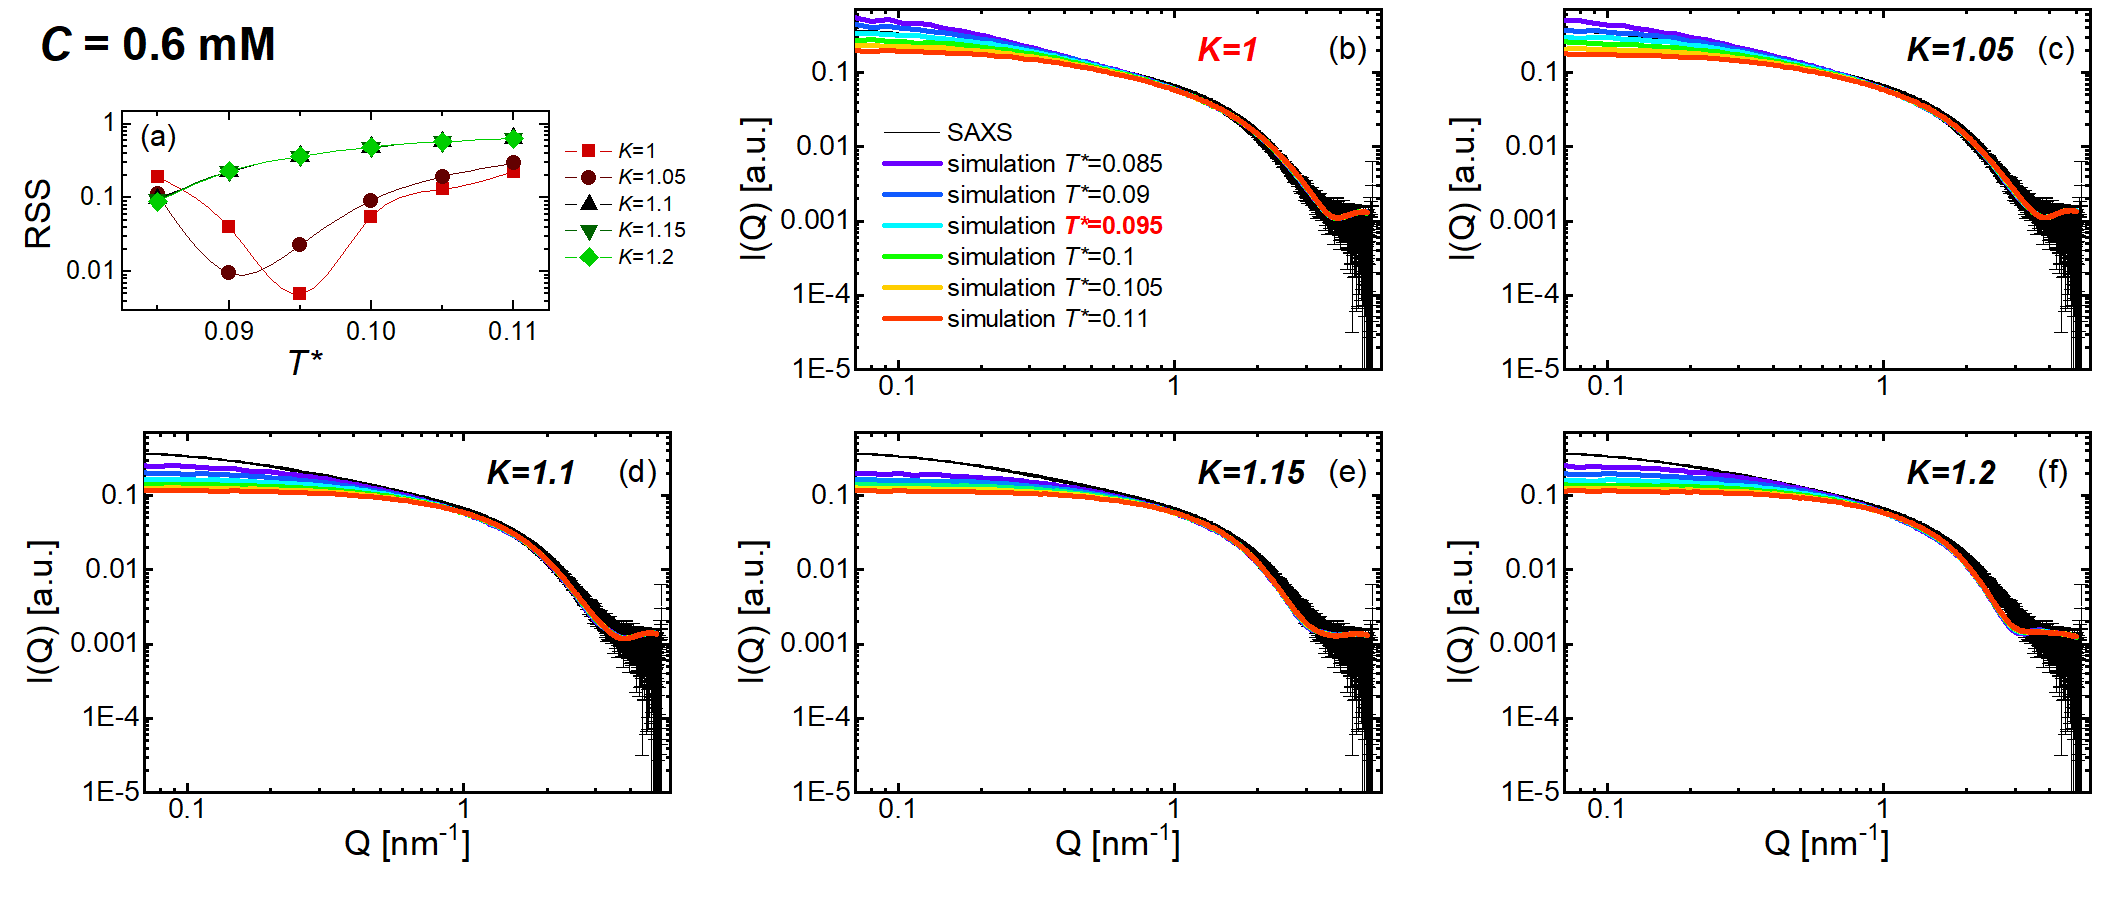
The experimental can be suitably reproduced by finely changing the and simulation parameters, as shown in Figure 3 for the selected concentration =0.6 mM. In this case an excellent agreement between simulation and experiment is obtained for =1 and =0.095 (panel b). Similar plots for =1.2 mM and =4.5 mM are reported in Figure SI1 and SI2 of the Supporting Information, respectively.
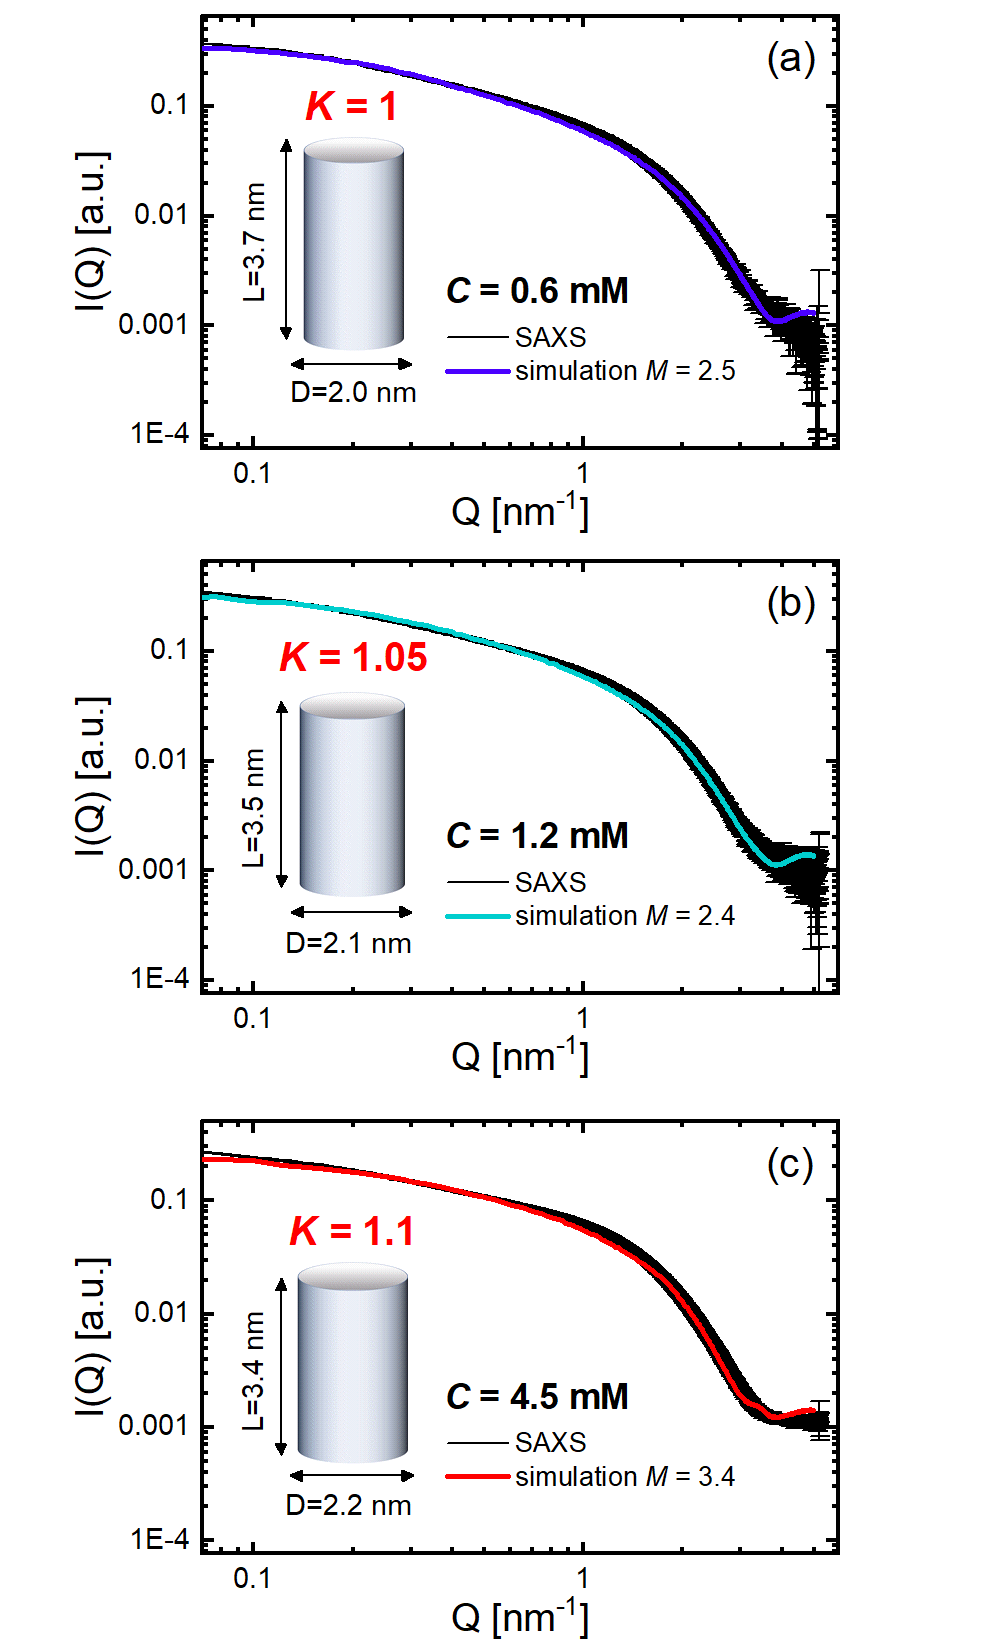
Best matches (according to the residual sum of squares ) between experiments and simulations are reported in Figure 4. Experimental and simulated curves remarkably superimpose onto each other over the whole explored -range. As expected, in the region of the highest values (above nm-1) the simulated SAXS intensity is less effective in describing the experimental data, since it does not take into account the fine structural details of the actual G4 folds numerically modeled as HCs. On the other hand, simulations are able to reproduce strikingly well the experimental data in the low- and intermediate- region, and can therefore effectively describe the aggregation processes.
| [mM] | Ð | [kcal mol-1]b | [kcal mol-1]c | [cal mol-1K-1]d | |||
|---|---|---|---|---|---|---|---|
| 0.6 | 0.095 | 1 | 2.5 0.3 | 1.60 0.04 | -0.76 0.17 | -6.12 0.16 | -18.3 0.8 |
| 1.2 | 0.1 | 1.05 | 2.4 0.2 | 1.58 0.04 | -0.70 0.15 | -5.82 0.15 | -17.5 0.7 |
| 4.5 | 0.09 | 1.1 | 3.4 0.5 | 1.70 0.04 | -1.21 0.19 | -6.47 0.18 | -18.0 0.9 |
aAverage chain length. Errors were estimated by considering the statistical error on and the error associated with the finite value by which temperatures were sampled in the simulations. bStacking free energy calculated for a standard concentration 1 M of G4s and K. cEnergy contribution to . d Entropic contribution to .
Once validated, simulations can be exploited to obtain quantitative information on stacking and aggregation of G4 solutions as the concentration varies. In particular, the adopted numerical model is consistent with an exponential distribution of G4 multimer chain lengths : , where is the number of G4s per unit volume, and is the average number of stacked units. The value of can be directly obtained from the simulation, since it is related to the average potential energy per G4 monomer, , through the relationship [39]. The simulations thus provide an estimate of the average length of G4 multimers at each of the investigated concentrations, as reported in Table 1. Quite interestingly, values are in the range 2.4 3.4, in agreement with the experimental results suggesting dimers and trimers as the main multimeric forms [9].
It is worth noting that using an exponential distribution to describe the length of multimer chains is equivalent to assume that multimerization of G4s complies with a step-growth mechanism. This is analogous to the case of the self-assembly of DNA-encoded nanoparticles into chain-like superstructures [40], and at variance with the chain-growth mechanism which is less commonly applied to supramolecular biopolymers [41, 42]. In addition, as Tel22 multimers follow an exponential distribution, we can easily estimate the spread of their molecular mass distribution as quantified by the ratio between the weight average molecular weight and the number average molecular weight, i.e. the so called dispersity Ð [43]. The parameter Ð, which is reported in Table 1, indicates a moderate degree of polidispersity as it is higher than the monodisperse limit Ð but smaller than the highest attainable value Ð.
The knowledge of the average chain length allows to calculate also the coaxial stacking free energy of the system [44] (Table 1). The standard free energy , calculated for a standard temperature of 293 K and concentration of 1 M, increases from about -0.7 kcal mol-1 at the lowest concentrations to -1.2 kcal mol-1 at mM. The associated contributions of the standard bonding energy and the standard bonding entropy are of the order of kcal mol-1 and cal mol-1K-1, respectively. We note that our estimate for is much lower than other values reported in literature for the stacking free energies of G4 structures. In a recent computational work, for instance, the dimerization free energy of parallel Tel22 G4s was estimated to be of the order of kcal mol-1 in the most stable 5’-5’ configuration [45]. However, we point out that this disagreement can arise from the fact that free energy estimates based on all-atom molecular dynamics simulations may be quite inaccurate in calculating the entropic contribution to the stacking free energy, as it happens in the case of self-assembled short DNA-duplexes [44, 46, 47, 48]. For example, a system composed of ultra-short DNA duplexes of 5 base-pairs each has been studied through all-atom simulations in Reference [49] and authors note that an overestimate of stacking
attractions leads to unrealistically long aggregates. For comparison, computational studies in which only the enthalpic term is considered return G4s stacking energies between -34 and -8 kcal mol-1 [50], which are in line with our values. As current estimates of intermolecular G4 stacking energies mainly come from numerical studies, our findings call for future experimental work on this subject.
As for the geometry of the G4 units, the experimental curves are better reproduced using slightly larger values of on increasing concentration (as reported in Table 1), corresponding to a variation of the simulated HCs towards a more disk-like shape. This trend suggests an increase of the fraction of G4 with parallel conformation, that is known to have a more oblate shape compared to the antiparallel and hybrid folds [34]. This is consistent with previous literature where the fraction of parallel G4s was proposed to progressively increase for DNA concentrations above mM [30, 31, 33]. It is also worth of note that the parallel-stranded propeller topology might favour the stacking of G4 units [51], thus further favouring the formation of longer multimers on increasing concentration.
From the cylinder length and the average number of stacked units we can readily estimate the gyration radius of the G4 multimers, that turns out to be in the range 2.5 nm 3.5 nm (see Supporting Information). To further support the picture provided by our method, in Figure SI3 gyration radii are shown to be in excellent agreement with those obtained by fitting the SAXS data with a phenomenological function proposed by Beaucage to describe systems with several characteristic lengths [52].
2.4 Circular dichroism
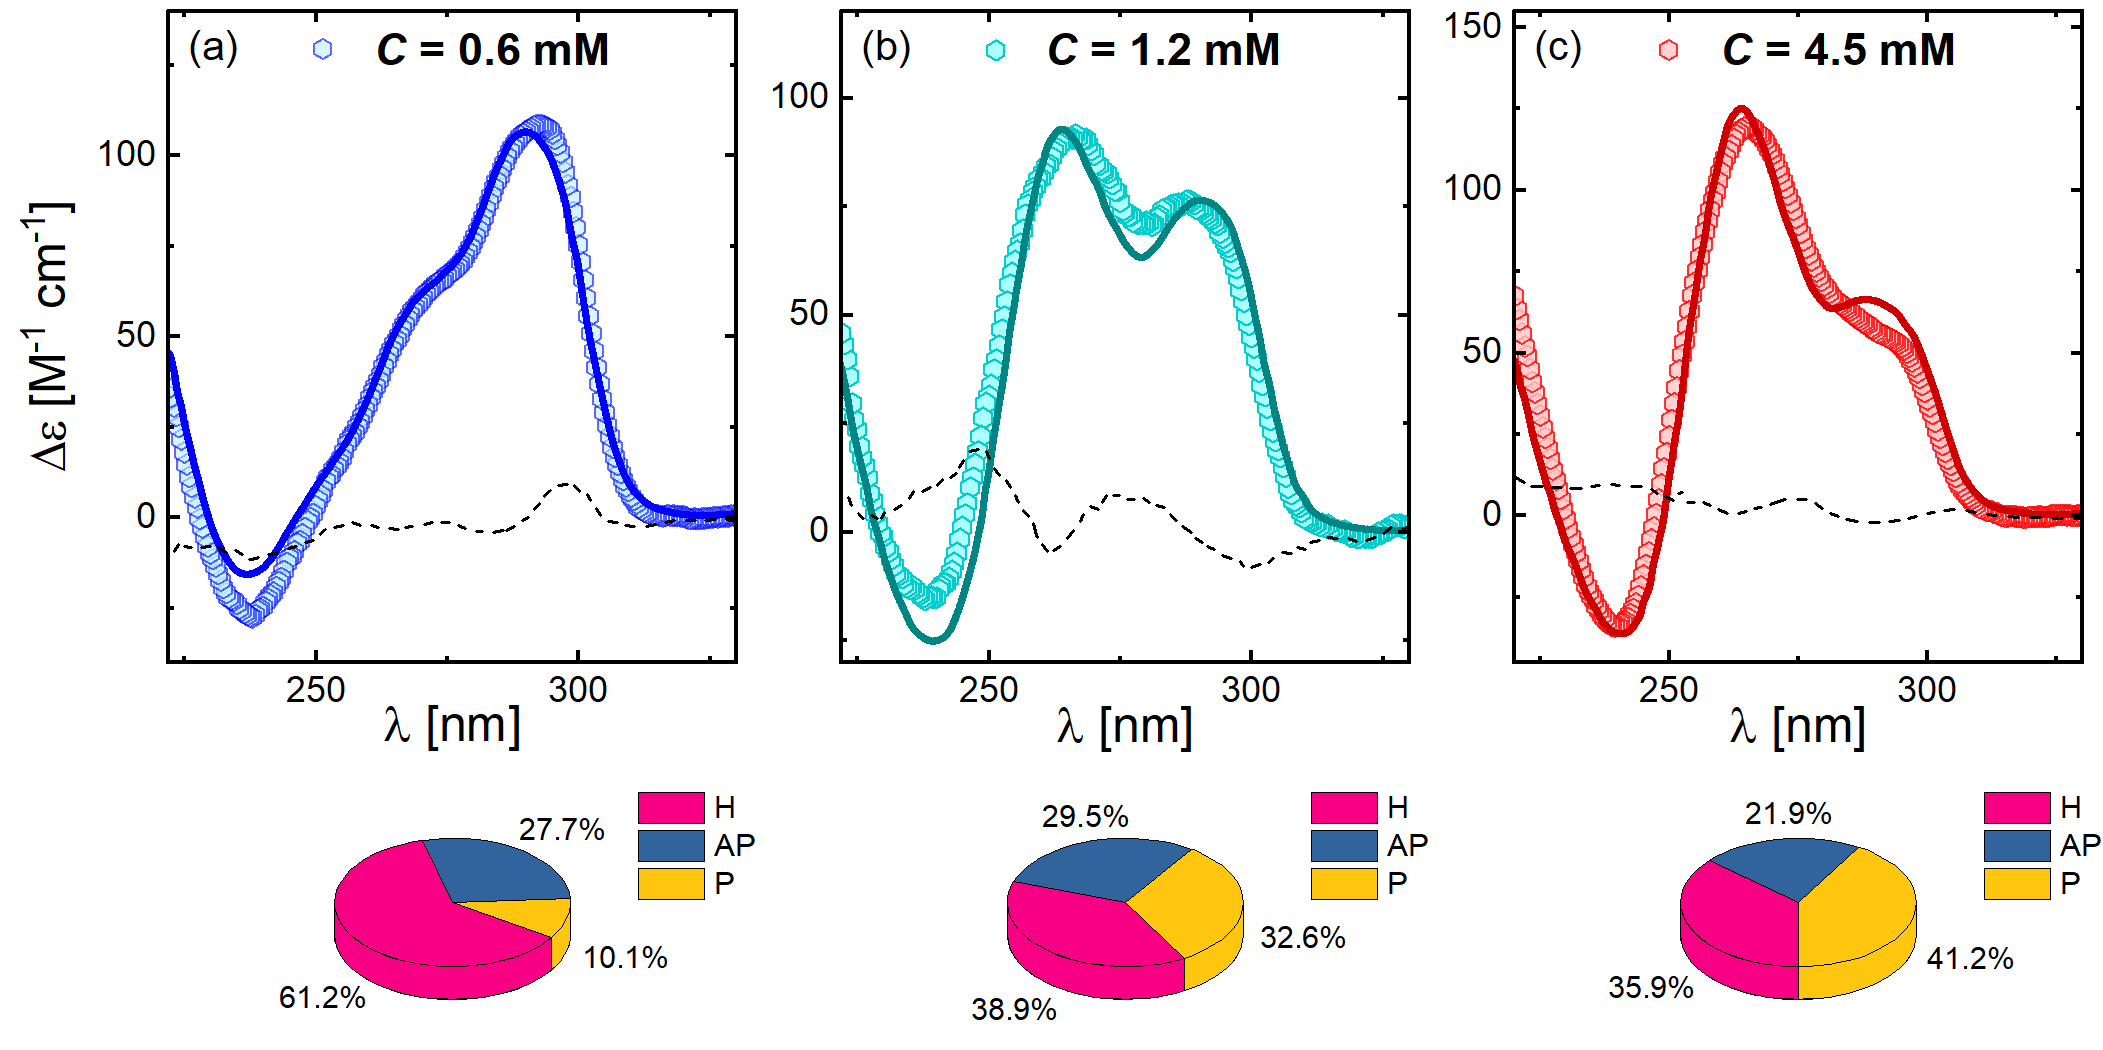
To shed light on the possible change of the G4 secondary structure, we performed CD measurements as a function of the DNA concentration. As shown in Figure 5, at mM (panel a) the spectrum displays the typical features of G4 hybrid topology, with a maximum at about 295 nm, a shoulder at 270 nm and a minimum at 240 nm. As increases, the maximum progressively downshifts and a new peak appears at 265 nm (panel b and c), suggesting an increase in the parallel fraction consistent with the findings reported above [33]. A method based on the principal component analysis and singular value decomposition was used to quantify the fraction of the major G4 topologies [53]. In Figure 5 the fit of experimental data obtained from the deconvolution into the three main folded topologies (parallel, antiparallel and hybrid), is reported, with the corresponding results represented in the pie charts. A population transfer is evident, as the hybrid component halves at the highest concentration, while the parallel component grows from 10% to 40%.
By combining the values of the G4 stacking energy and aspect ratio from SAXS and simulations with the fractions of topologies from CD, we can easily obtain specific information on the shape and energy parameters of each G4 conformation (see Table SI2 of the Supporting Information). As anticipated, a more elongated shape is associated with the antiparallel conformer, whereas a flattened cylinder represents the parallel one. As for the stacking interaction, it turns out that antiparallel G4s are much less prone to form multimers than either hybrid or parallel G4s (see Table SI2). This is consistent with previous results indicating that the parallel [45] and the hybrid [26] conformations are prevalent in human telomere multimers.
3 Conclusions
This work provides an unprecedented quantitative description of the self-assembly process of Tel22 G4s in concentrated solutions.
Coarse-grained simulations were exploited to extensively explore the parameter space related to interaction stacking strength between G4s units, multimer length and the G4 unit shape. The coarse-grained simulation model was refined by successfully reproducing the experimental SAXS data, thus determining how the average length and the stability of G4 multimers changes as a function of DNA concentration. In the emerging picture, on increasing the self-crowding of G4s, the attractive interactions between different units become more and more important and at the same time the G4 conformation shifts toward the parallel state.
We show that our integrated approach allows a direct interpretation of low-resolution structural data on a challenging system consisting of polydisperse aggregates of polymorphic G4s, while also determining their thermodynamic features. In the light of this, we plan to adopt the same method in the future to provide a detailed description of G4s multimers even more closely related to biological issues, such as those forming from long telomeric sequences, in the presence of ligands of potential therapeutic interest. This knowledge will be crucial to design and optimize new drugs specifically targeting interunit junctions between adjacent G4s.
4 Methods
4.1 Experimental Methods
4.1.1 Sample preparation
Human telomere Tel22 AG3(T2AG3)3 (: 6966.6 g mol-1) was purchased from Eurogentec and used as received. Samples were prepared by dissolving the lyophilized powder in a 50 mM phosphate buffer at pH 7, 0.3 mM EDTA and 150 mM KCl. The high concentration of the starting solution ( 13 mM) is appropriate to ensure the formation of aggregates, that remain stable even after dilution. The solution was heated up to 95°C, slowly cooled down to room temperature and left at room temperature overnight. After this procedure, the solution was centrifugated for 120 s at 15°C and 15000 rpm. From the centrifugated solution, samples at 3 different DNA concentrations were prepared, namely, = 0.6 mM, 1.2 mM, and 4.5 mM. The molarity of the solutions was determined from UV absorption measurements at 260 nm, using a molar extinction coefficient of 228 500 M-1 cm-1. Both experimental and computational investigations were performed at these concentrations. Before measurements, samples where further annealed and left at room temperature overnight.
It should be noted that the sample in monomeric state taken from Reference [28] was prepared starting from a stock solution with a lower concentration of mM. Such a different procedure avoided the formation of aggregates.
4.1.2 Circular Dichroism
CD experiments were performed using a Jasco J810 spectropolarimeter in 0.01 to 0.1 mm path-length quartz cells. Spectra were collected in the range from 220 nm to 330 nm with a scan speed of 50 nm/min. All spectra were acquired at room temperature. CD data were expressed as the difference in the molar absorption [M-1 cm-1] of the right- and left-handed circularly polarized light.
4.1.3 Small-angle X-ray Scattering
Small-angle X-ray Scattering (SAXS) experiments were performed at the BM29 beamline of the European Synchrotron Radiation Facility (ESRF) in Grenoble, France. The incident energy was 12.5 keV, corresponding to an incident wavelength of 0.99 Å-1. The scattering vector range was between = 0.0044 Å-1 and 0.521 Å-1. All patterns were collected at 20° C. Analogous patterns of the buffer were collected before and after every collection on the samples and used to subtract any contribution from the solvent and the sample environment.
4.2 Computational Methods
4.3 Simulation model
The simulation model consisted of hard cylinders (HCs) characterized by a length and a diameter , with two attractive sites at the bases. The attractive sites were located along the symmetry axis at a distance + from the HC center of mass. Sites belonging to distinct particles interact via the square-well (SW) potential, i.e., , if , and = 0, if , where is the distance between the interacting sites, is the interaction range (i.e., the diameter of the attractive sites), and is the ratio between the binding energy and the thermal energy , where i s the Boltzmann constant. The temperature was expressed as the adimensional parameter .
4.3.1 Monte Carlo simulations
Simulations were performed in the canonical () ensemble, leveraging a recently developed algorithm for checking the overlap between HCs [54] which relies on a novel and very efficient algorithm for finding the roots of a quartic equation [55]. For each value of concentration, we simulated a suitable number of particles in a cubic box with volume using standard periodic boundary conditions. Values of and where chosen so that the density , where is tha Avogadro’s number, reproduced each of the experimentally-investigated values of DNA concentration . The number of particles used in the simulations was 5808, 6292 and 6776 for 0.6 mM, 1.2 mM and 4.5 mM respectively. The aspect ratio of the HCs was varied from that associated with the starting values of nm and nm, by introducing the parameter : and . For each value of , five different values of ( =1, 1.05, 1.10, 1.15, and 1.2) were considered, thereby obtaining a total of 12 starting configurations. Each starting configuration was thermalised for at least MC steps at six different values of , namely, =0.085, 0.9, 0.095, 0.1, 0.105, and 0.11. The initial configuration used for the equilibration was obtained by placing the hard cylinders on a ortorhombic lattice.
Supporting Information
Supporting Information is available from the Wiley Online Library or from the author.
Acknowledgements
B.P.R. and C.P. acknowledges the support from MIUR-PRIN (Grant No. 2017RX9XXY). C.D.M. acknowledges the support from MIUR-PRIN (Grant No. 2017Z55KCW).
References
- [1] S. Neidle, Nat. Rev. Chem. 2017, 1, 0041.
- [2] M. Webba da Silva, Chem. Eur. J. 2007, 13 9738.
- [3] S. Neidle, G. N. Parkinson, Curr. Opin. Struct. Biol. 2003, 13, 3 275.
- [4] A. I. Karsisiotis, N. M. Hessari, E. Novellino, G. P. Spada, A. Randazzo, M. Webba da Silva, Angew. Chem. Int. Ed. 2011, 50, 45 10645.
- [5] J. L. Huppert, The FEBS Journal 2010, 277, 17 3452.
- [6] A. T. Phan, V. Kuryavyi, D. J. Patel, Curr. Opin. Struct. Biol. 2006, 16, 3 288.
- [7] V. Víglaský, K. Tlučková, L. Bauer, Eur. Biophys. J. 2011, 40 29.
- [8] J. B. Chaires, The FEBS Journal 2010, 277, 5 1098.
- [9] N. Smargiasso, F. Rosu, W. Hsia, P. Colson, E. S. Baker, M. T. Bowers, E. De Pauw, V. Gabelica, J. Am. Chem. Soc. 2008, 130, 31 10208.
- [10] B. Heddi, A. T. Phan, J. Am. Chem. Soc. 2011, 133, 25 9824.
- [11] J. L. Huppert, S. Balasubramanian, Nucleic Acids Res. 2005, 33, 9 2908.
- [12] A. K. Todd, M. Johnston, S. Neidle, Nucleic Acids Res. 2005, 33, 9 2901.
- [13] R. Hänsel-Hertsch, M. Di Antonio, S. Balasubramanian, Nat. Rev. Mol. Cell Biol. 2017, 18 279.
- [14] G. Biffi, D. Tannahill, J. McCafferty, S. Balasubramanian, Nat. Chem. 2013, 5 182.
- [15] E. Y. N. Lam, D. Beraldi, D. Tannahill, S. Balasubramanian, Nat. Commun. 2013, 4 1796.
- [16] J. L. Huppert, S. Balasubramanian, Nucleic Acids Res. 2006, 35, 2 406.
- [17] S. Kendrick, L. H. Hurley, Pure Appl. Chem. 2010, 82, 8 1609.
- [18] D. Rhodes, H. J. Lipps, Nucleic Acids Res. 2015, 43, 18 8627.
- [19] F. Bianchi, L. Comez, R. Biehl, F. D’Amico, A. Gessini, M. Longo, C. Masciovecchio, C. Petrillo, A. Radulescu, B. Rossi, F. Sacchetti, F. Sebastiani, N. Violini, A. Paciaroni, Nucleic Acids Res. 2018, 46, 22 11927.
- [20] L. Comez, F. Bianchi, V. Libera, M. Longo, C. Petrillo, F. Sacchetti, F. Sebastiani, F. D’Amico, B. Rossi, A. Gessini, C. Masciovecchio, H. Amenitsch, C. Sissi, A. Paciaroni, Phys. Chem. Chem. Phys. 2020, 22 11583.
- [21] S. Neidle, The FEBS Journal 2010, 277, 5 1118.
- [22] R. Perrone, E. Butovskaya, D. Daelemans, G. Palù, C. Pannecouque, S. N. Richter, J. Antimicrob. Chemother. 2014, 69, 12 3248.
- [23] L. A. Yatsunyk, O. Mendoza, J.-L. Mergny, Acc. Chem. Res. 2014, 47, 6 1836.
- [24] J.-L. Mergny, D. Sen, Chem. Rev. 2019, 119, 10 6290.
- [25] S. Kolesnikova, E. A. Curtis, Molecules 2019, 24, 17.
- [26] R. C. Monsen, S. Chakravarthy, W. L. Dean, J. B. Chaires, J. O. Trent, Nucleic Acids Res. 2021, 49, 3 1749.
- [27] J. Zhao, Q. Zhai, Bioorg. Chem. 2020, 103 104229.
- [28] V. Libera, E. A. Andreeva, A. Martel, A. Thureau, M. Longo, C. Petrillo, A. Paciaroni, G. Schirò, L. Comez, J. Phys. Chem. Lett. 2021, 12, 33 8096.
- [29] E. J. Baldassarri, M. G. Ortore, F. Spinozzi, A. Round, C. Ferrero, P. Mariani, Nanomaterials 2020, 10, 4.
- [30] I. Kejnovská, M. Vorlíčková, M. Brázdová, J. Sagi, Biopolymers 2014, 101, 4 428.
- [31] M. Vorlíčková, I. Kejnovská, J. Sagi, D. Renčiuk, K. Bednářová, J. Motlová, J. Kypr, Methods 2012, 57, 1 64.
- [32] J. Palacký, M. Vorlíčková, I. Kejnovská, P. Mojzeš, Nucleic Acids Res. 2013, 41, 2 1005.
- [33] D. Renčiuk, I. Kejnovská, P. Školáková, K. Bednářová, J. Motlová, M. Vorlíčková, Nucleic Acids Res. 2009, 37, 19 6625.
- [34] N. An, A. M. Fleming, E. G. Middleton, C. J. Burrows, PNAS 2014, 111, 40 14325.
- [35] Y. Wang, D. J. Patel, Structure 1993, 1, 4 263.
- [36] A. Pal, C. A. De Filippo, T. Ito, M. A. Kamal, A. V. Petukhov, C. De Michele, P. Schurtenberger, ACS Nano 2022, 16, 2 2558.
- [37] K. T. Nguyen, A. Battisti, D. Ancora, F. Sciortino, C. De Michele, Soft Matter 2015, 11 2934.
- [38] K. T. Nguyen, F. Sciortino, C. De Michele, Langmuir 2014, 30, 16 4814.
- [39] F. Sciortino, E. Bianchi, J. F. Douglas, P. Tartaglia, J. Chem. Phys. 2007, 126, 19 194903.
- [40] M. Gu, X. Ma, L. Zhang, J. Lin, J. Am. Chem. Soc. 2019, 141, 41 16408.
- [41] S. Ogi, K. Sugiyasu, S. Manna, S. Samitsu, M. Takeuchi, Nature Chem. 2014, 6 188–195.
- [42] H. Zhang, Y. Wang, H. Zhang, X. Liu, A. Lee, Q. Huang, F. Wang, J. Chao, H. Liu, J. Li, J. Shi, X. Zuo, L. Wang, X. Cao, C. Bustamante, Z.-Q. Tian, C. Fan, Nat. Comm. 2019, 10, 1006.
- [43] I. Teraoka, Models of Polymer Chains, chapter 1, 1–67, John Wiley and Sons, Ltd, ISBN 9780471224518, 2002.
- [44] C. De Michele, T. Bellini, F. Sciortino, Macromolecules 2012, 45, 2 1090.
- [45] M. Kogut, C. Kleist, J. Czub, PLoS Comput. Bio. 2019, 15, e1007383.
- [46] C. Maffeo, B. Luan, A. Aksimentiev, Nucleic Acids Res. 2012, 40 3812.
- [47] C. Maffeo, J. Yoo, J. Comer, D. B. Wells, B. Luan, A. Aksimentiev, J. Condens. Matter Phys. 2014, 26, 41 413101.
- [48] A. A. Chen, A. E. García, PNAS 2013, 110, 42 16820.
- [49] S. Saurabh, Y. Lansac, Y. H. Jang, M. A. Glaser, N. A. Clark, P. K. Maiti, Phys. Rev. E 2017, 95 032702.
- [50] N. Špačková, I. Berger, J. Šponer, J. Am. Chem. Soc. 1999, 121, 23 5519.
- [51] S. Haider, G. N. Parkinson, S. Neidle, Biophys. J. 2008, 95, 1 296.
- [52] G. Beaucage, J. Appl. Crystallog. 1996, 29, 2 134.
- [53] R. del Villar-Guerra, J. O. Trent, J. B. Chaires, Angew. Chem. Int. Ed. 2018, 57, 24 7171.
- [54] A. Orellana, E. Romani, C. De Michele, Eur. Phys. J. E 2018, 41, 4.
- [55] A. G. Orellana, C. D. Michele, ACM Trans. Math. Softw. 2020, 46, 2.