Comparing Implementations of Self-Interacting Dark Matter in the Gizmo and Arepo Codes
Abstract
Self-interacting dark matter (SIDM) models have received great attention over the past decade as solutions to the small-scale puzzles of astrophysics. Though there are different implementations of dark matter (DM) self-interactions in N-body codes of structure formation, there has not been a systematic study to compare the predictions of these different implementations. We investigate the implementation of dark matter self-interactions in two simulation codes: Gizmo and Arepo. We begin with identical initial conditions for an isolated M⊙ dark matter halo and investigate the evolution of the density and velocity dispersion profiles in Gizmo and Arepo for SIDM cross-section over mass of 1, 5, and 50 . Our tests are restricted to the core expansion phase where the core density decreases and core radius increases with time. We find better than 30% agreement between the codes for the density profile in this phase of evolution, with the agreement improving at higher resolution. We find that varying code-specific SIDM parameters changes the central halo density by less than 10% outside of the convergence radius. We argue that SIDM core formation is robust across the two different schemes and conclude that these codes can reliably differentiate between cross-sections of 1, 5, and 50 but finer distinctions would require further investigation.
keywords:
dark matter– software: simulations – cosmology: theory1 Introduction
Self-interacting dark matter (SIDM) is a generic prediction of dark sector models for physics beyond the Standard Model (Spergel & Steinhardt, 2000; Ahn & Shapiro, 2005; Ackerman et al., 2009; Arkani-Hamed et al., 2009; Feng et al., 2009; Loeb & Weiner, 2011; Tulin et al., 2013), and it is a possible explanation for small-scale structure formation puzzles (for a comprehensive review of small-scale challenges, see Bullock & Boylan-Kolchin, 2017). Several groups have confirmed that SIDM with a cross-section over mass of order or larger can alleviate small-scale issues (Davé et al., 2001; Colín et al., 2002; Vogelsberger et al., 2012; Rocha et al., 2013; Kamada et al., 2017). This is due to the fact that scattering can effectively transfer kinetic energy within galactic halos and change the dark matter distribution (see Tulin & Yu, 2018, for a review of SIDM phenomenology). In particular, the changes introduced by the heat transfer have been shown to provide an economical way to explain the diverse range of rotation curves of galaxies (Oman et al., 2015; Ren et al., 2019a) and the “too-big-to-fail" problem (Vogelsberger et al., 2012; Kaplinghat et al., 2019; Turner et al., 2021).
Simulations of SIDM with baryons have found that while baryonic feedback can reduce the central density of a cuspy halo, if an SIDM halo already has a core present, the feedback does not make a significant difference (Robles et al., 2017; Fitts et al., 2019; Sameie et al., 2021). This result suggests that SIDM predictions are fairly robust to feedback implementation and provides further motivation to use the observed properties of galaxies to test SIDM models.
The growing use of simulation-derived predictions to constrain the microphysics of SIDM motivates us to compare predictions from different codes. Since it is impossible to model DM-DM particle scattering directly in a galaxy formation simulation, the macroscopic effects must be modeled in an approximate way. As discussed by Tulin & Yu (2018), there are various methods for implementing DM self-interactions but the differences that may arise from each have yet to be studied in detail. Here, for the first time, we present a code comparison of two implementations of simple elastic SIDM, specifically focusing on the popular Gizmo and Arepo codes. We begin with identical initial conditions for an isolated M⊙ dwarf halo, which is a mass regime of particular interest for small-scale structure tests. We investigate the effects of the SIDM implementations within and between the codes by varying the SIDM cross-section per mass /m = 1, 5, and 50 cm2 g-1.
Our work is structured as follows: section 2 presents our initial conditions in more detail and outlines the SIDM implementations in each code. Section 3 presents the effects of changing the SIDM parameters, the concentration of the halo, and the resolution of the simulations. Section 4 outlines our conclusions.
2 The Simulations
2.1 Code Descriptions
In the following, we introduce our two simulation codes – Gizmo and Arepo – and describe the methods each uses for implementing DM self-interactions.
Halo name Mass [M⊙] DM particles Run time () Scale radius Force softening Smoothing length Neighbours searched /m Colour [Gyr] [kpc] [pc] (Gizmo) (Arepo) [ ] m10HR 10 (1,3,1.536) 14 10 – – CDM (High Resolution) 0.25 32 5 1 0.25 32 5 5 0.25 32 5 50 m10 10 (1,3,1.536) 14 10 – – CDM (Baseline; 0.25 32 5 1 Fiducial Resolution) 0.25 32 5 5 0.25 32 5 50 m10SIDM- 10 (1,3,1.536) 14 10 0.125 16 5 5 m10SIDM+ 0.5 64 5 5
2.1.1 Gizmo
Gizmo is a massively parallel, multi-physics simulation code that uses a meshless Lagrangian Godunov-type method (“Meshless finite-mass” or MFM; Hopkins 2015; Hopkins et al. 2018).111Gizmo, including the SIDM module, is publicly available here: https://bitbucket.org/phopkins/gizmo-public. Given that our simulations are DM only, we rely on only the N-body tree-gravity solver which is derived from Gadget-3 (Springel, 2010).
Gizmo’s implementation of elastic self-interactions uses the methodology introduced by Rocha et al. (2013), which is based on the rate of scattering of the DM macro-particles in phase space. The probability of an interaction is calculated as:
| (1) |
where is the mass of the macroparticle, is the relative velocity difference between the two macroparticles, and is the number density factor that accounts for the overlap of the two macroparticles’ smoothing kernels. A random number is drawn from a uniform distribution in the interval to determine whether an interaction takes place. If an interaction takes place, the particles are given outgoing velocities consistent with elastic scattering. The outgoing velocities are calculated in terms of the center-of-mass velocity of the two particles, their masses, and their relative speed. The direction of the scatter is randomly chosen (such that the scatter is isotropic in the center-of-mass frame) and each particle moves opposite the other (for details and tests of this implementation against analytic problems see Rocha et al., 2013).
2.1.2 Arepo
Arepo is a massively parallel, multi-physics simulation code that employs a finite-volume method on a moving Voronoi mesh and a tree-particle-mesh method for gravitational interactions. Details of the underlying method can be found in (Springel, 2010) while the most recent release of the code is described in (Weinberger et al., 2020).222Arepo has recently been publicly released (see Weinberger et al. 2020) and is available here: https://gitlab.mpcdf.mpg.de/vrs/arepo. Note, however, that the public release does not include the SIDM implementation.
Arepo estimates the probability of an elastic self-interaction at each time step by calculating the scattering probability for each particle with each of its nearest neighbours (32 5 by default and in our baseline model) as:
| (2) |
where is the cubic spline Kernel function and is the smoothing length enclosing the nearest neighbours of particle (for details of this SIDM implementation, see Vogelsberger et al., 2012).
Once the probability of interaction is calculated, a random number is drawn from a uniform distribution in the interval to determine if an interaction takes place. If it does, a neighbor must be selected to scatter with. The set of neighbors is sorted by distance to the original particle and the first neighbor whose pairwise probability to scatter with the original particle satisfies the inequality is chosen. Once a pair is matched, each particle is given a new velocity that reflects the original center-of-mass velocity and the two particles’ relative velocity. The direction is chosen randomly but each particle moves opposite the other.
Given the different approaches taken by each code in its underlying gravity solver, the similarities between their SIDM calculations and implementations are striking. With these similarities in mind, we ask: what differences, if any, arise between the two codes?
2.2 Initial Conditions
We use SpherIC, an initial conditions generator for spherically symmetric systems in equilibrium first presented in Garrison-Kimmel et al. (2013). SpherIC is based on HALOGEN4MUSE (Zemp et al., 2008)333SpherIC was available on Bitbucket, but since that site stopped supporting Mercurial repositories, it is no longer publicly available. However HALOGEN4MUSE is available here: https://github.com/mzemp/halogen. Our initial conditions are also available upon request. and generates profiles in the -model family, a generalization of the Navarro-Frenk-White (NFW) model:
| (3) |
where is the scale radius and is the scale density (Navarro et al., 1997; Navarro et al., 2010). The parameters and characterize the inner and outer power-law slope of the halo, respectively. The quantity determines the sharpness of transition between the inner and outer slope. An NFW profile corresponds to and the scale radius in this case is equal to the radius where the logarithmic slope of the density profile is -2 (i.e., ). For more general ()-models, we have the following relation (Di Cintio et al., 2014):
| (4) |
In this work we utilize a halo model with , , and kpc as these parameter values lie within the ranges that we would expect for a typical halo of this mass (see Lazar et al., 2020). We set our halos to have a total mass of . The virial radius (defined as the radius within which the average density is 100) is 52.5 kpc and the mass enclosed is . The values we use for correspond to kpc - where is the radius at which the profile has a slope of .
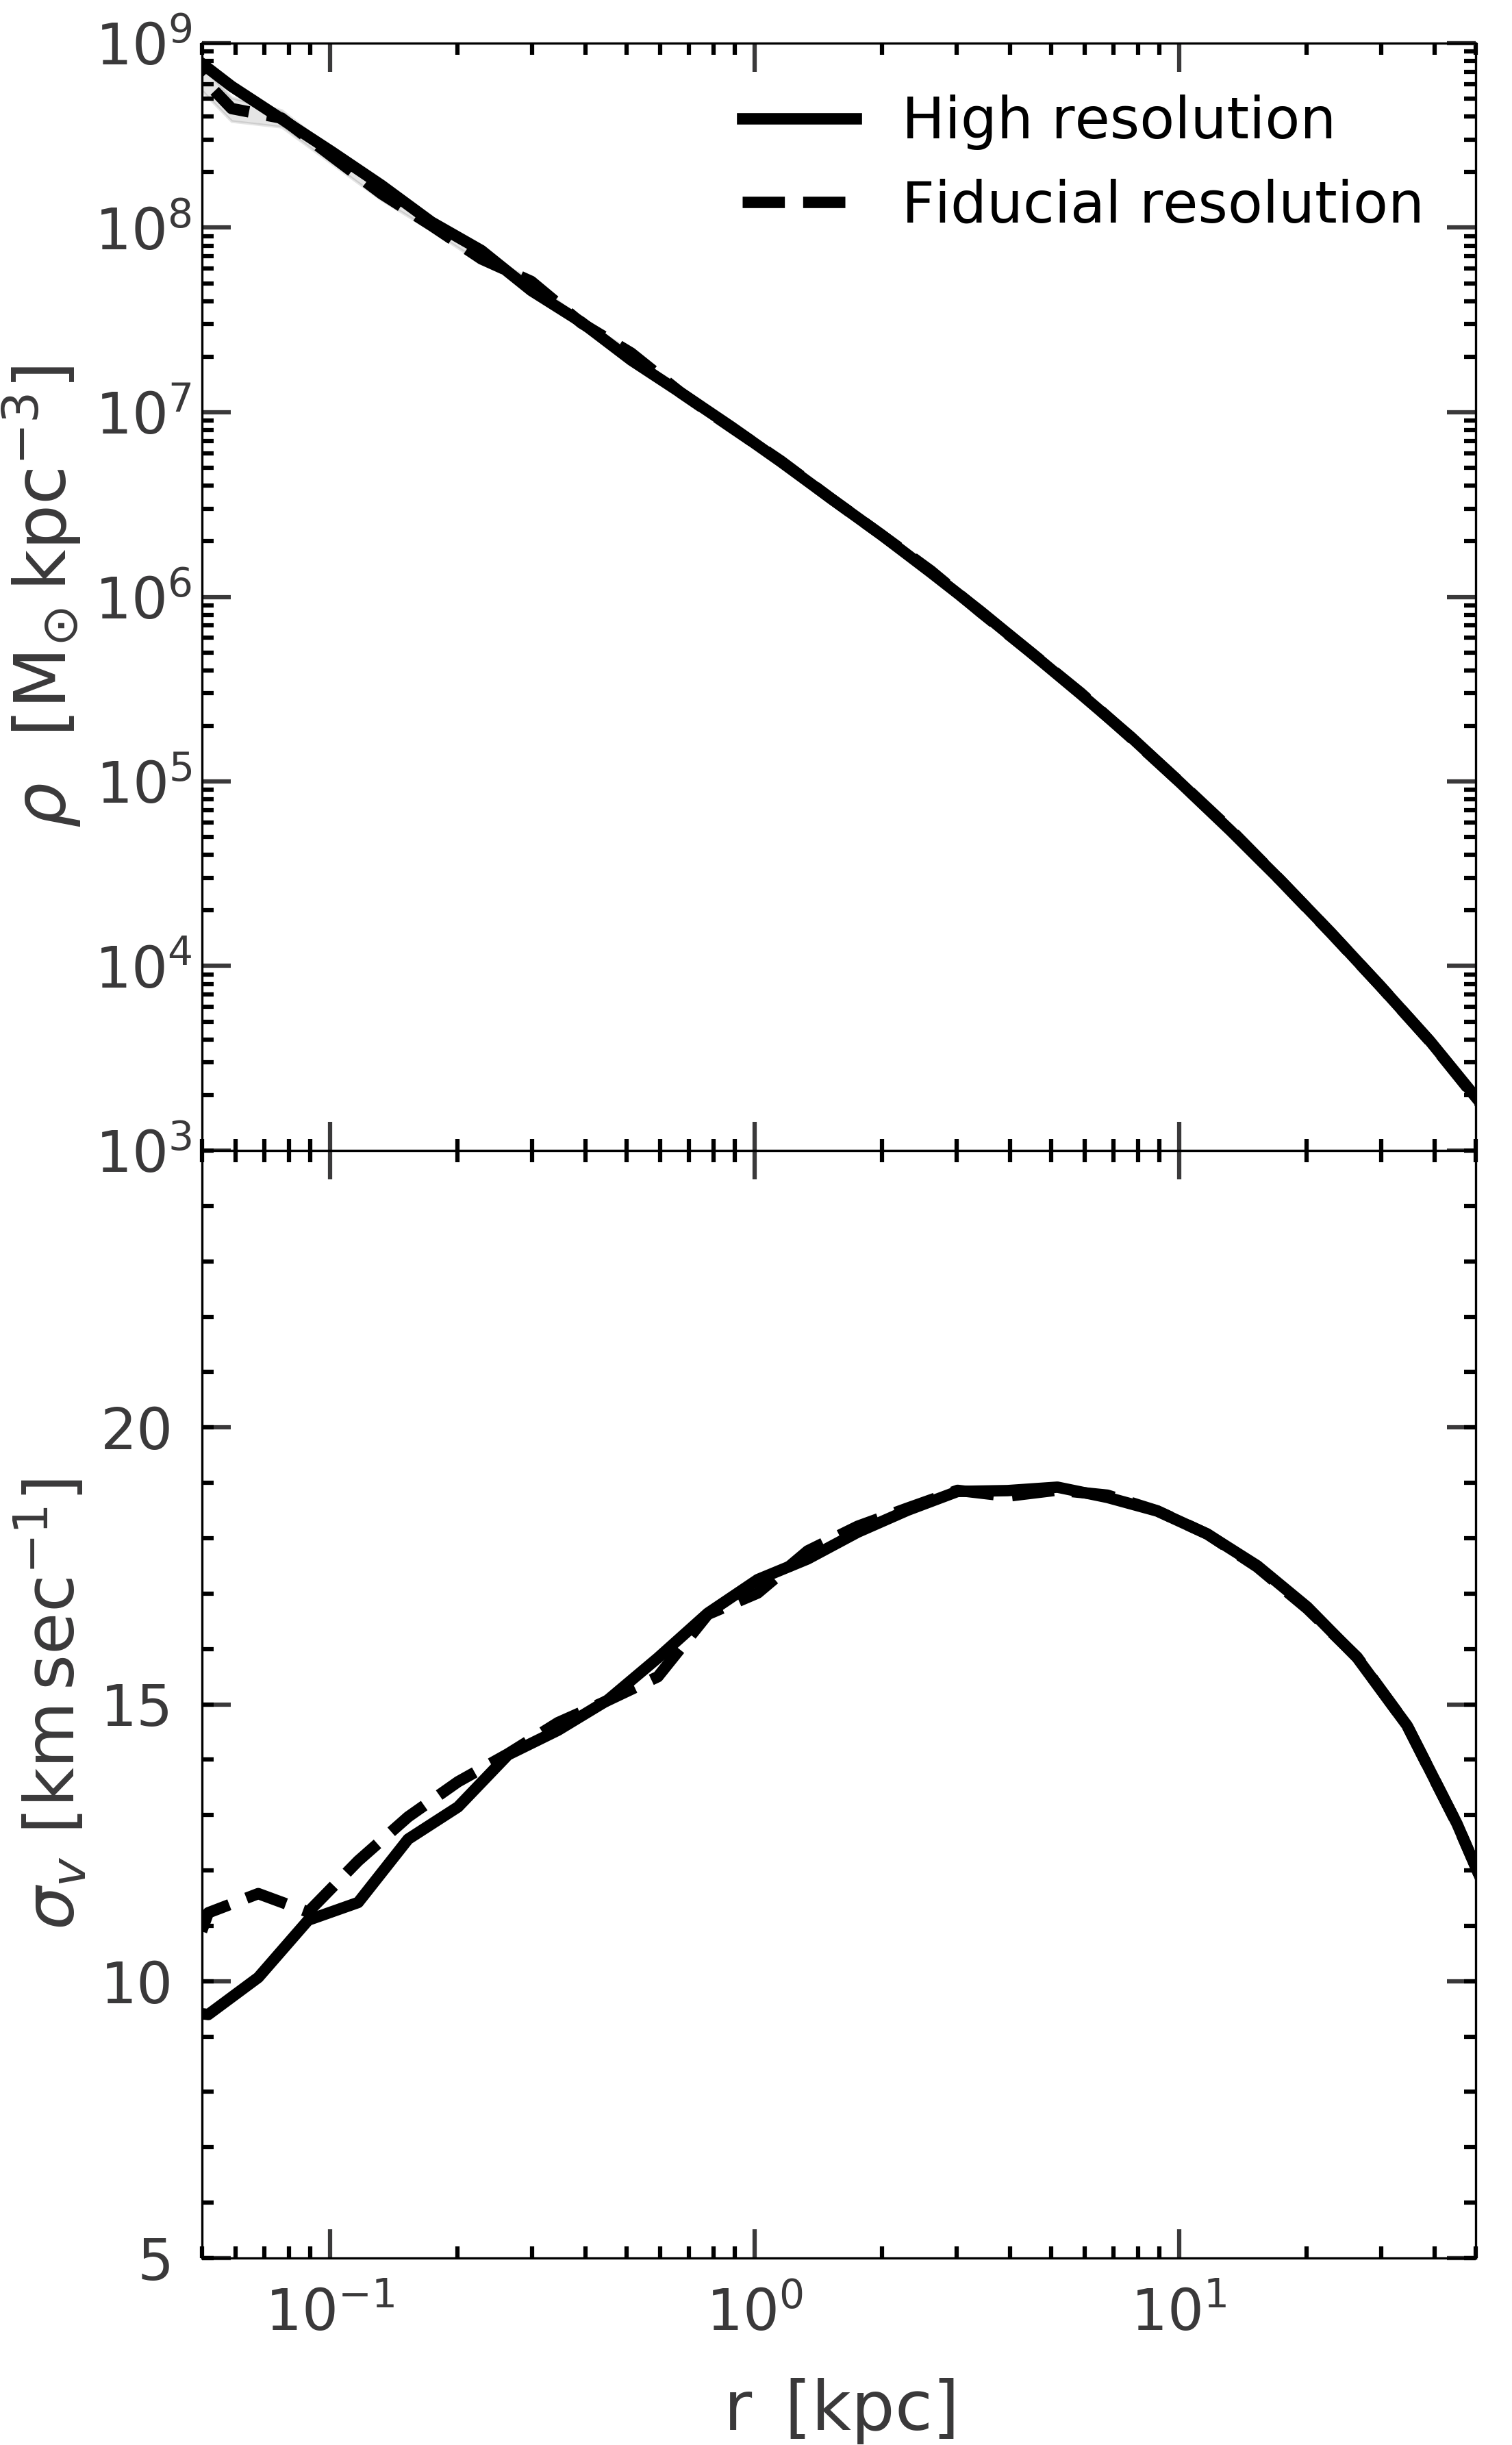
We use the parameters described above to create initial conditions at two different resolution levels: a baseline (fiducial) resolution with particles and a higher resolution of particles. We show the radial density and velocity dispersion profiles of these two initial conditions in Fig. 1.
2.3 Runs
We evolve the initial conditions at two resolutions in Gizmo and Arepo. For each resolution, we run one CDM simulation and three SIDM simulations. The results for the CDM models are shown in black in the figures throughout this work. For the code-to-code SIDM implementation comparison, we evolve both initial conditions using the respective SIDM implementations of Gizmo and Arepo for 3 different cross-sections: /m cm2 g-1. For the Gizmo simulations, we adopt the default SIDM smoothing length () of 25% of the force softening. Since the force softening we use is 10 pc, our smoothing length is 2.5 pc. Likewise, for the Arepo simulations, we adopt the default value for the neighbors searched () which is 32 5.
Finally, we test the effects of varying code-specific SIDM parameters at the fiducial resolution. We set the SIDM cross-section to 5 cm2 g-1 and vary the smoothing length (in Gizmo) and the number of neighbours searched (in Arepo). For Gizmo we adopt smoothing lengths of 1.25 pc and 5 pc which we refer to as SIDM- and SIDM+ respectively. For Arepo we set the number of neighbours searched to 16 5 and 64 5 and refer to these again as SIDM- and SIDM+. Note that these values are less than and greater than the default values set for these parameters in the respective codes. In total, we present a suite of 20 simulations (see Table 1 for a detailed list of all the simulations).
3 Results
3.1 Convergence of each code
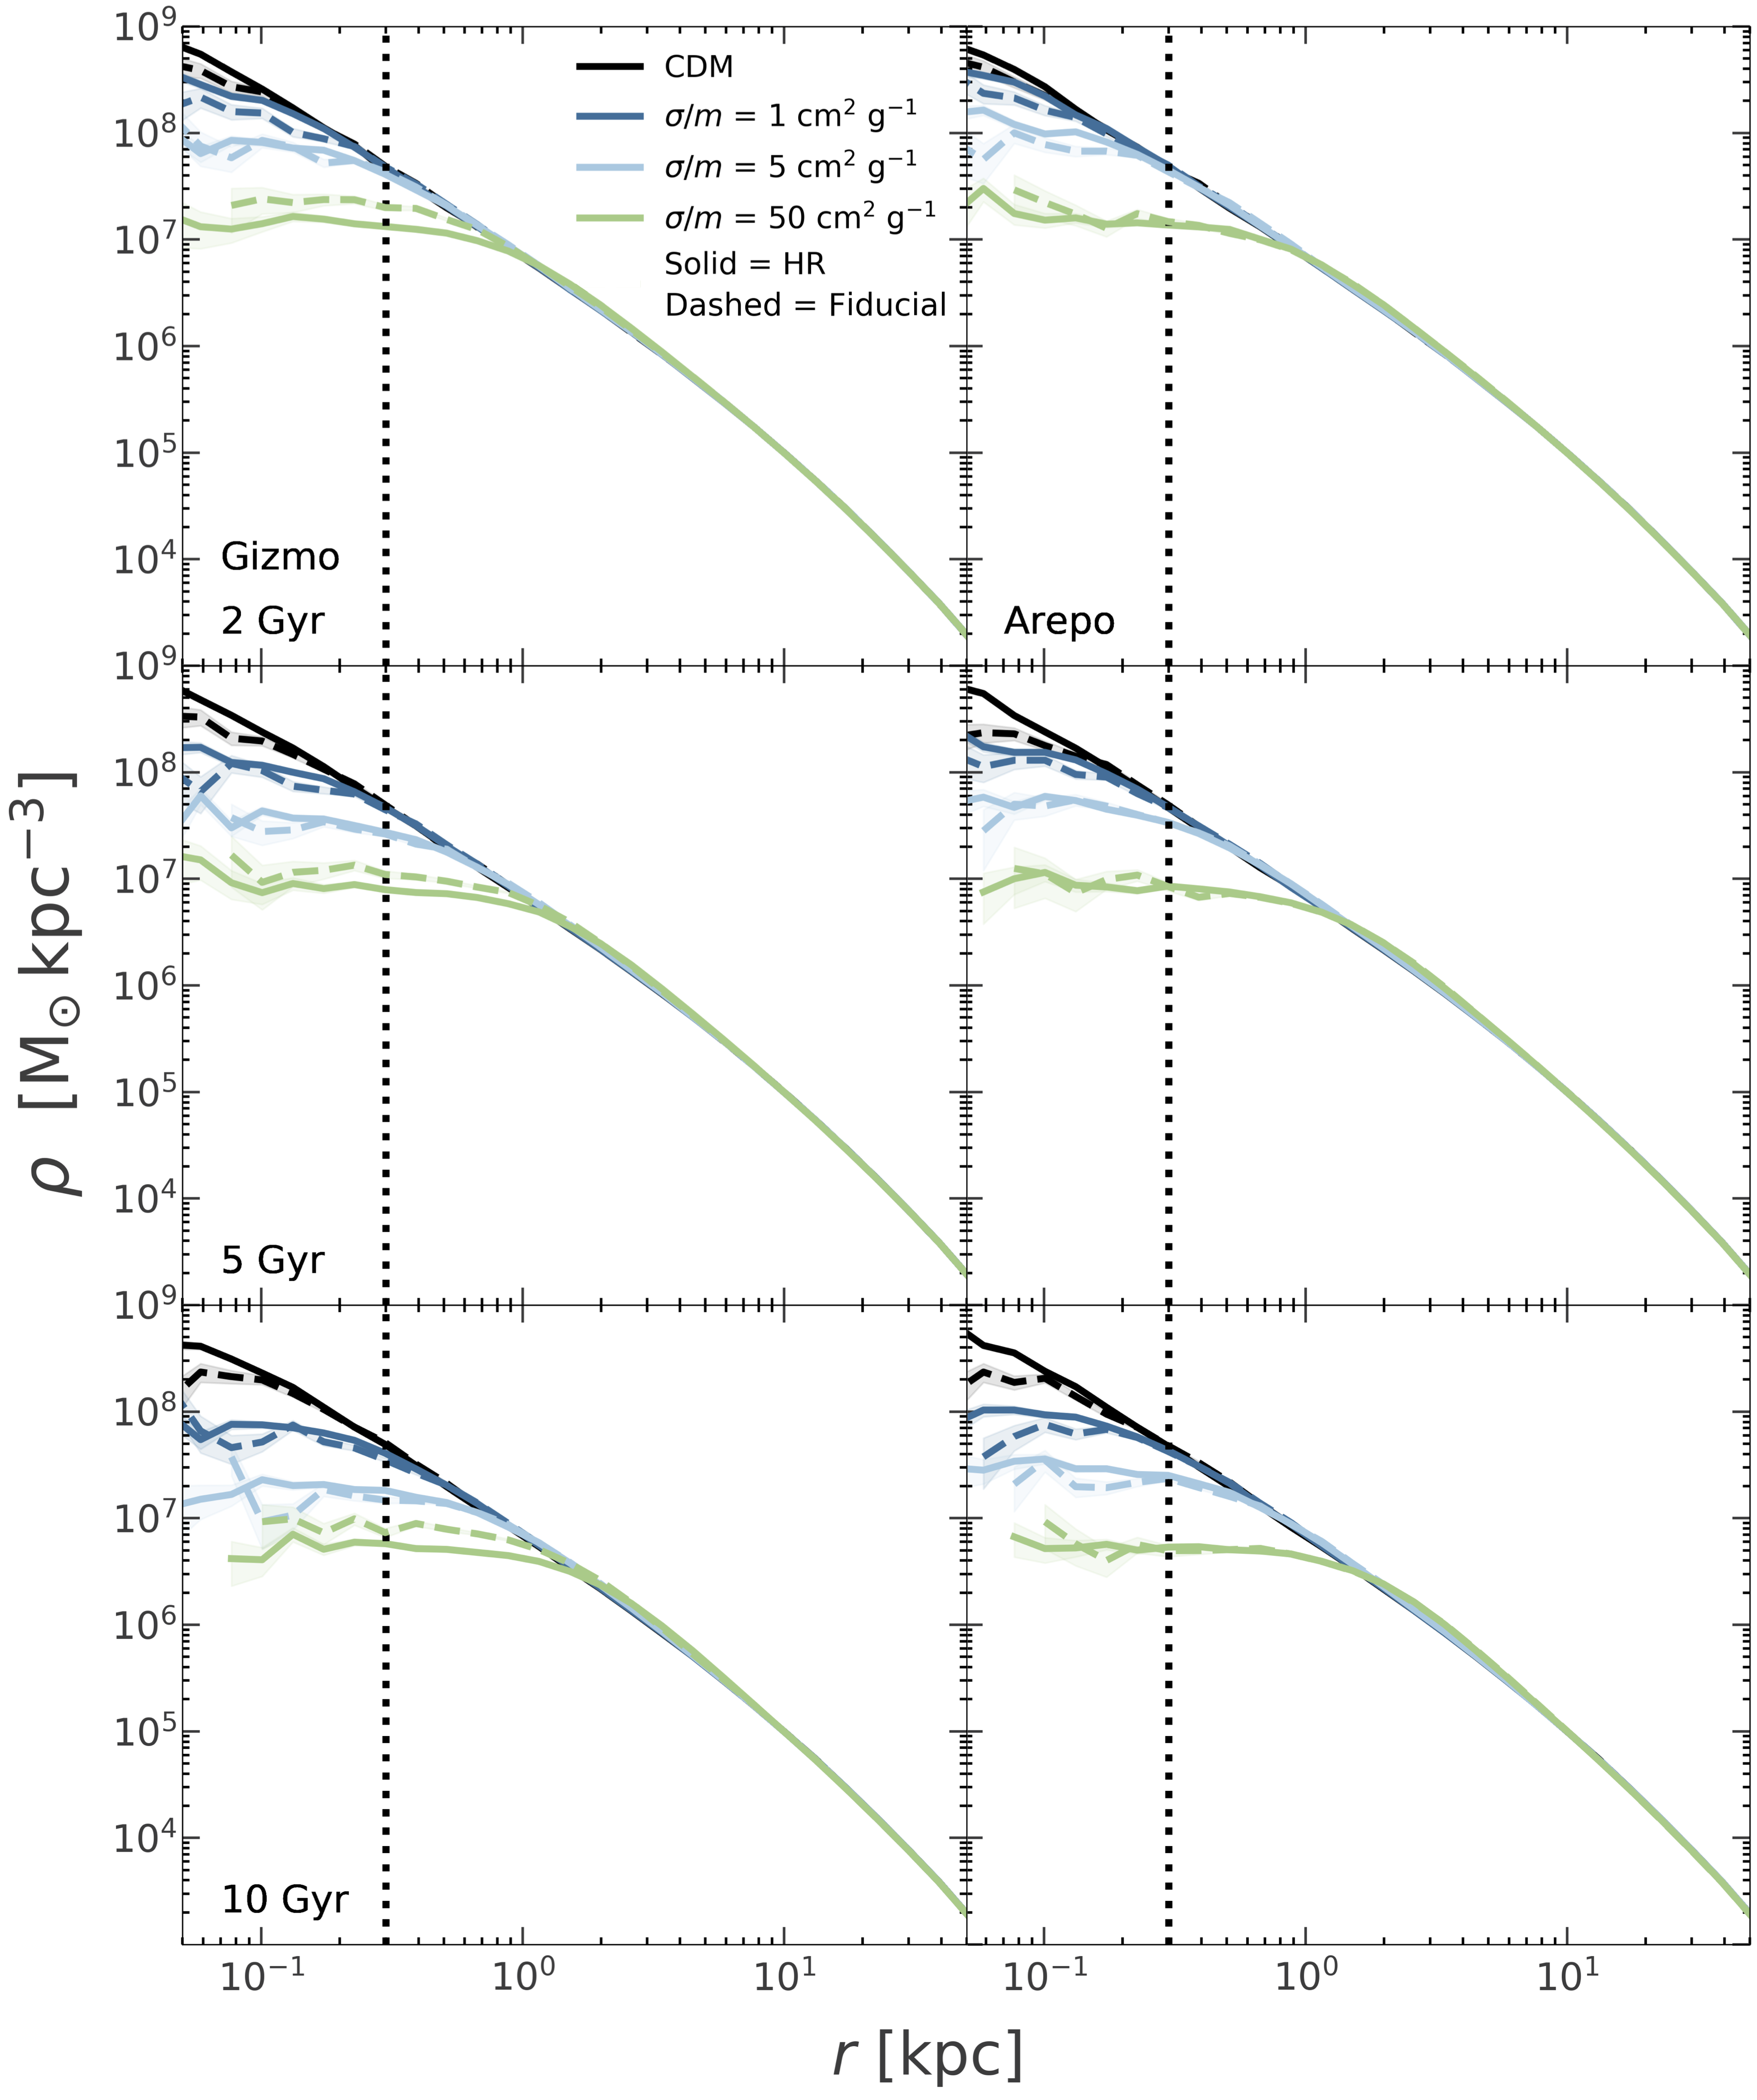
Before comparing the results from the two codes, we first discuss the sensitivity of each code internally to resolution. In Fig. 2, we present 3 snapshots (2, 5, and 10 Gyr) of each code (Gizmo in the left panel and Arepo in the right). The figure shows the results of the high and fiducial resolution simulations for CDM in black and SIDM /m and cm2 g-1 in dark blue, light blue, and green respectively.
All of our high resolution simulations contain at least 200 particles within a radius of 250 pc throughout the 10 Gyr simulations. Nearly all the fiducial resolution simulations contain more than 200 particles within 300 pc.444The only exception is the fiducial resolution Arepo simulation with /m cm2g-1 at late times which contains 200 particles at 400 pc. For consistency, we mark this radius on all our plots with a black dotted line and conduct all our comparisons at 300 pc (e.g., the comparison done in Fig. 5).
The error plotted in Fig. 2 and on all plots in this paper is the Poisson error (calculated as the density at the bin divided by the square root of the number of particles in the bin) and is represented with the shaded region around the curve. Some of the profiles are cut off because the simulations do not have any particles in the innermost region of the halo.
In sum, the simulations plotted in Fig. 2 demonstrate remarkable agreement between the fiducial and high resolution simulations. Indeed, outside of 250 pc, nearly all the simulations are within one another’s error margins (the only exception being the cm2 g-1 run in Gizmo).
3.2 Comparison of the codes across resolutions
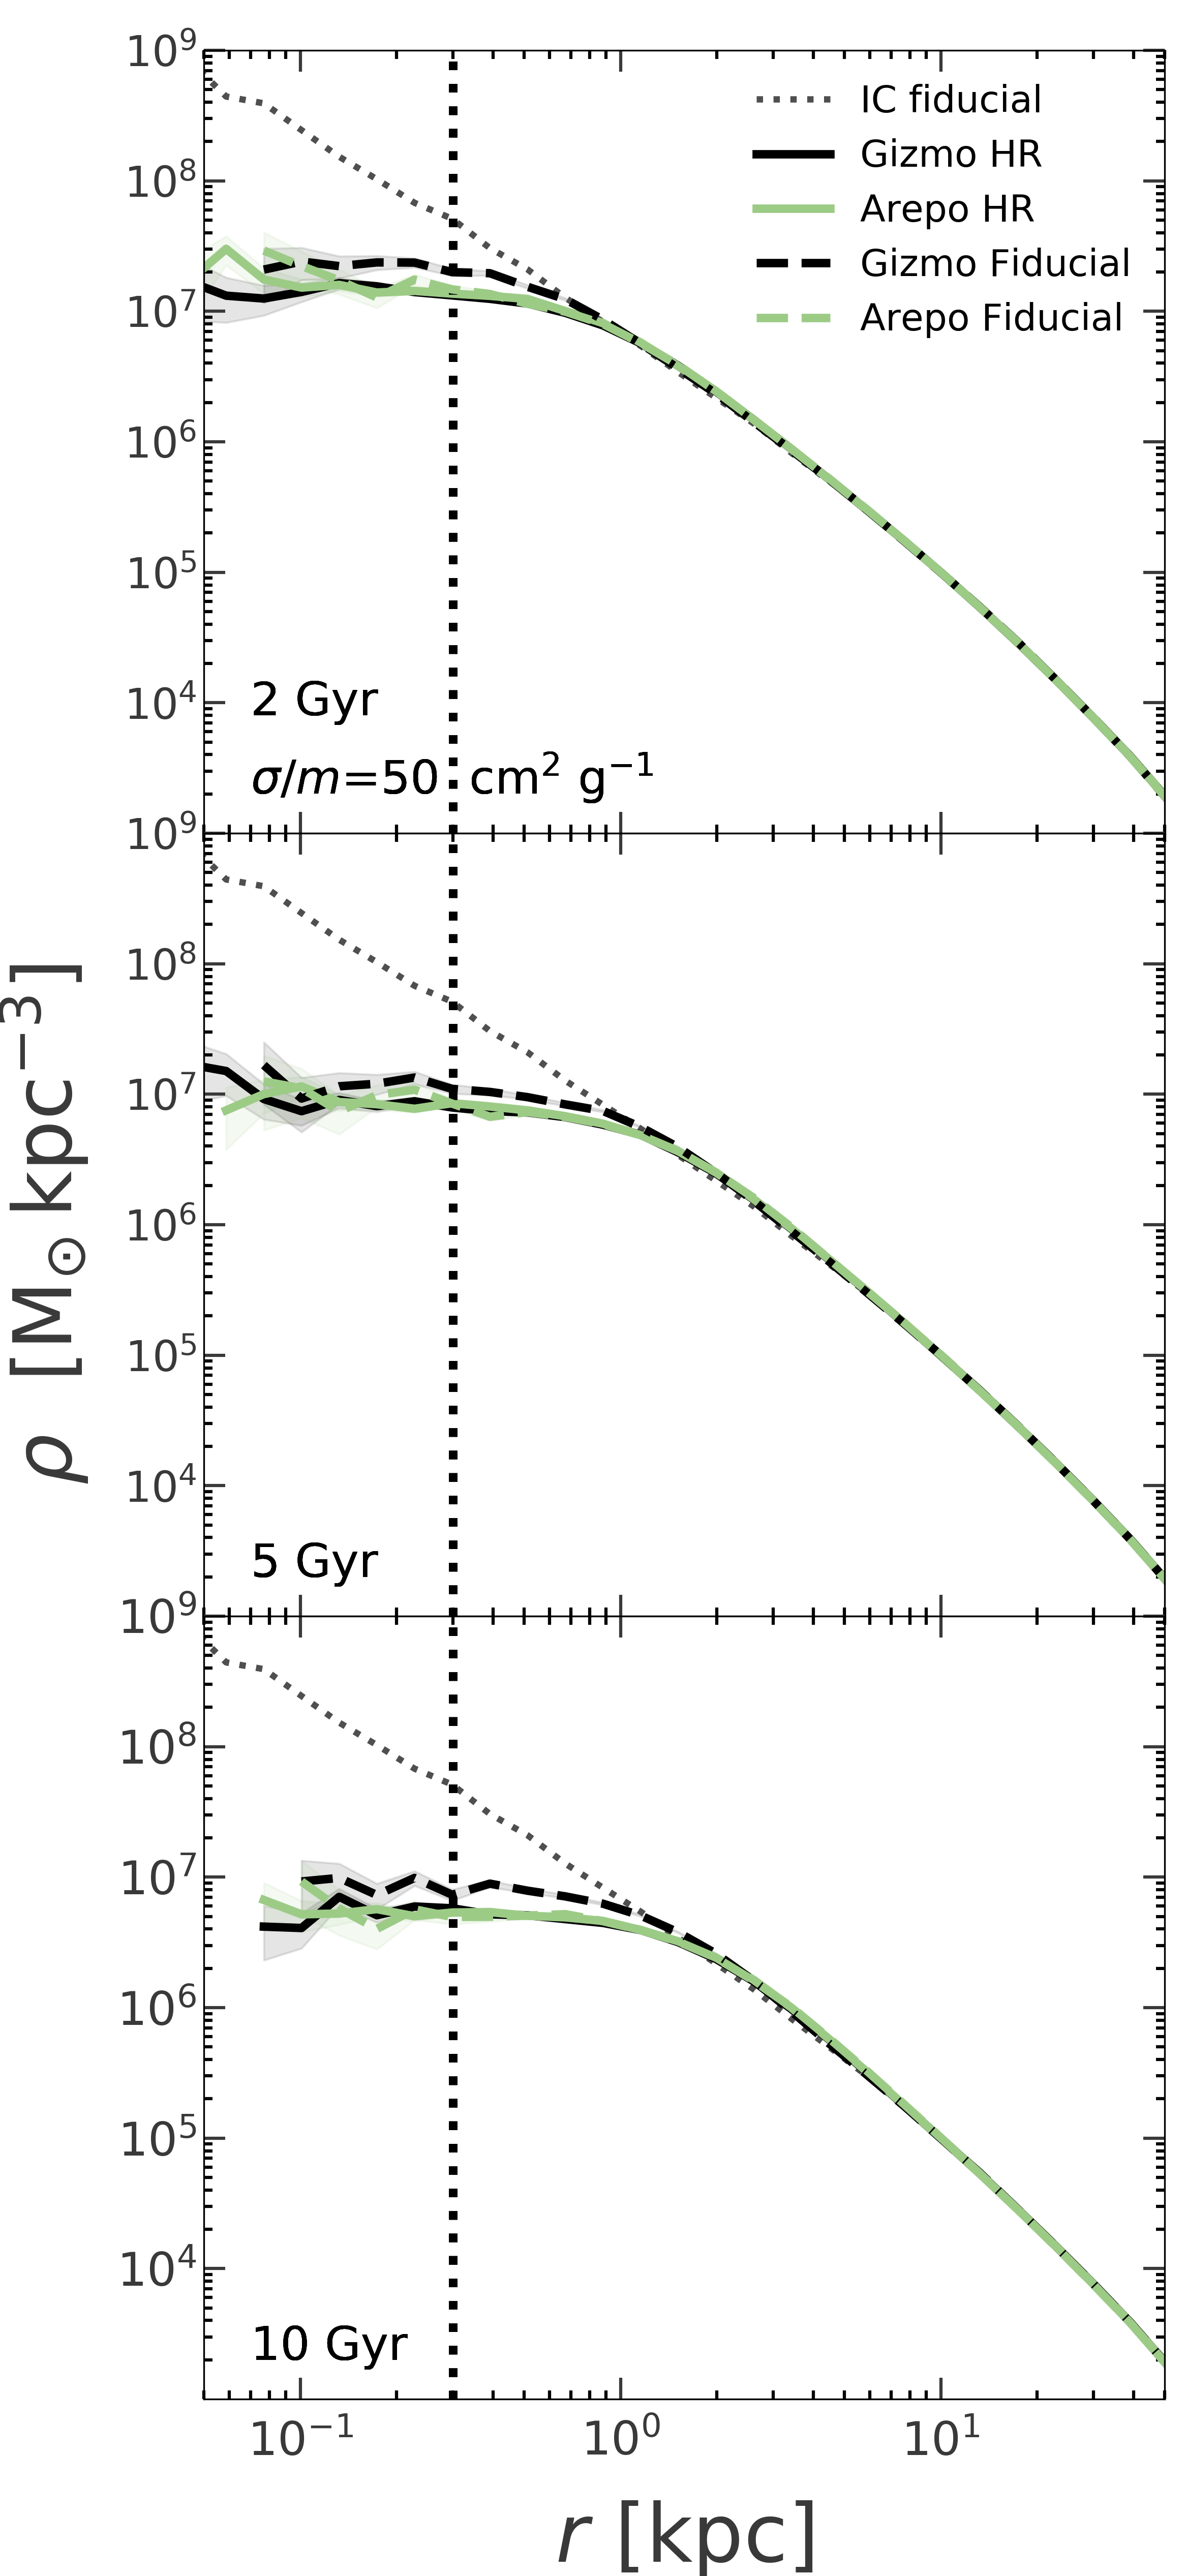
Having tested the convergence of the codes internally as the resolution is increased, we next compared the two resolutions across the two codes. For this comparison, we choose the most extreme SIDM cross-section (/m = 50 cm2g-1). Fig. 3 shows the results of Gizmo and Arepo for this cross-section at 2, 5, and 10 Gyr. In this figure, we plot the fiducial resolution simulations in green and the high resolution in black. The Gizmo simulations are plotted with solid lines while the Arepo simulations are plotted with dashed lines. We find that increasing the resolution of the simulations brings the simulation results into better agreement. In other words, the density profiles from Gizmo and Arepo exhibit better agreement at the higher resolution than at the fiducial resolution.
3.3 Sensitivity to SIDM Cross-section
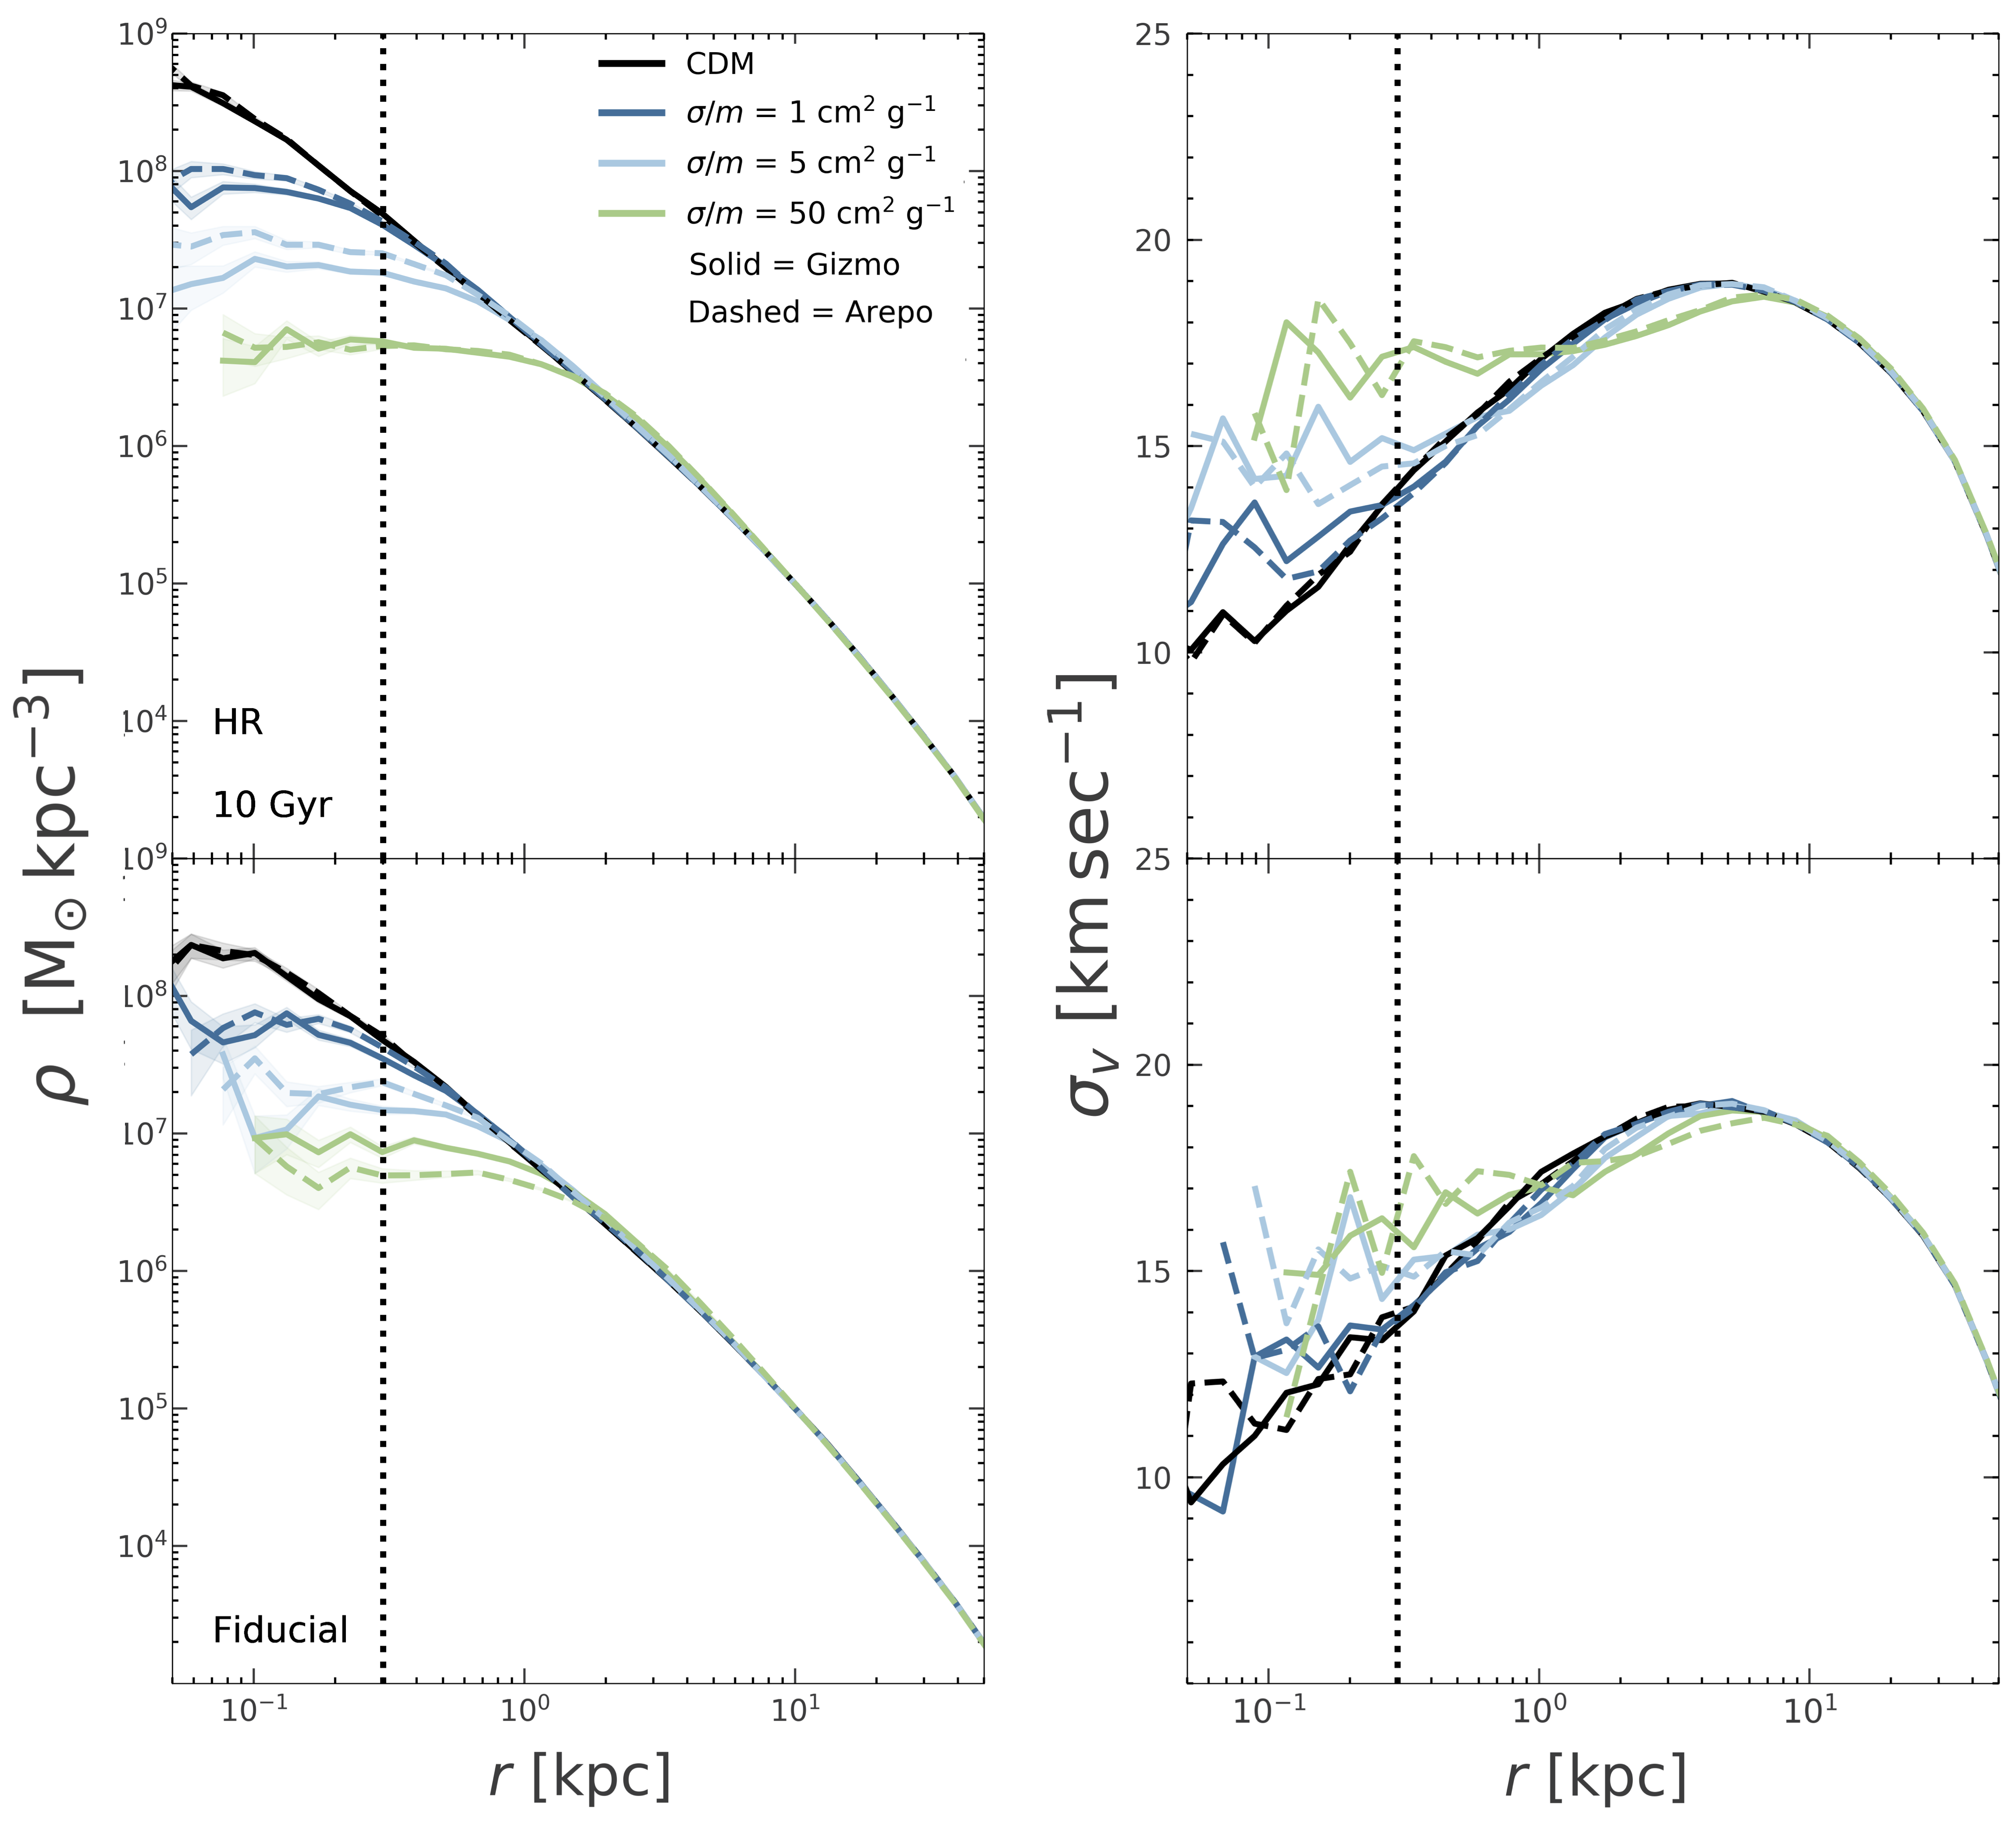
Next, we consider the sensitivity of each code to different SIDM cross-sections at high and fiducial resolution. We compare our results for the SIDM cross-section = 1, 5, and 50 in Fig. 4. We have plotted the Gizmo simulations with solid lines and the Arepo simulations with dashed lines and use the same colour conventions as in Fig. 2.
Consistent with Rocha et al. (2013), Elbert et al. (2015), and Fitts et al. (2019), we found that an increase in the SIDM cross-section results in density profiles that are shallower and more cored. One can better understand why the density profiles become more cored by looking at the velocity dispersion profiles. As Rocha et al. (2013) describe, the core is created by the heat transport (characterized by the DM velocity dispersion) from large radii to the inner region. The velocity dispersion curves flattened as the halo was evolved in our simulations (see the right panel of Figure 4). The flat velocity dispersion profiles of the SIDM simulations indicate that the SIDM halos are thermalized within the core, which is a necessary condition for establishing a cored DM density profile.
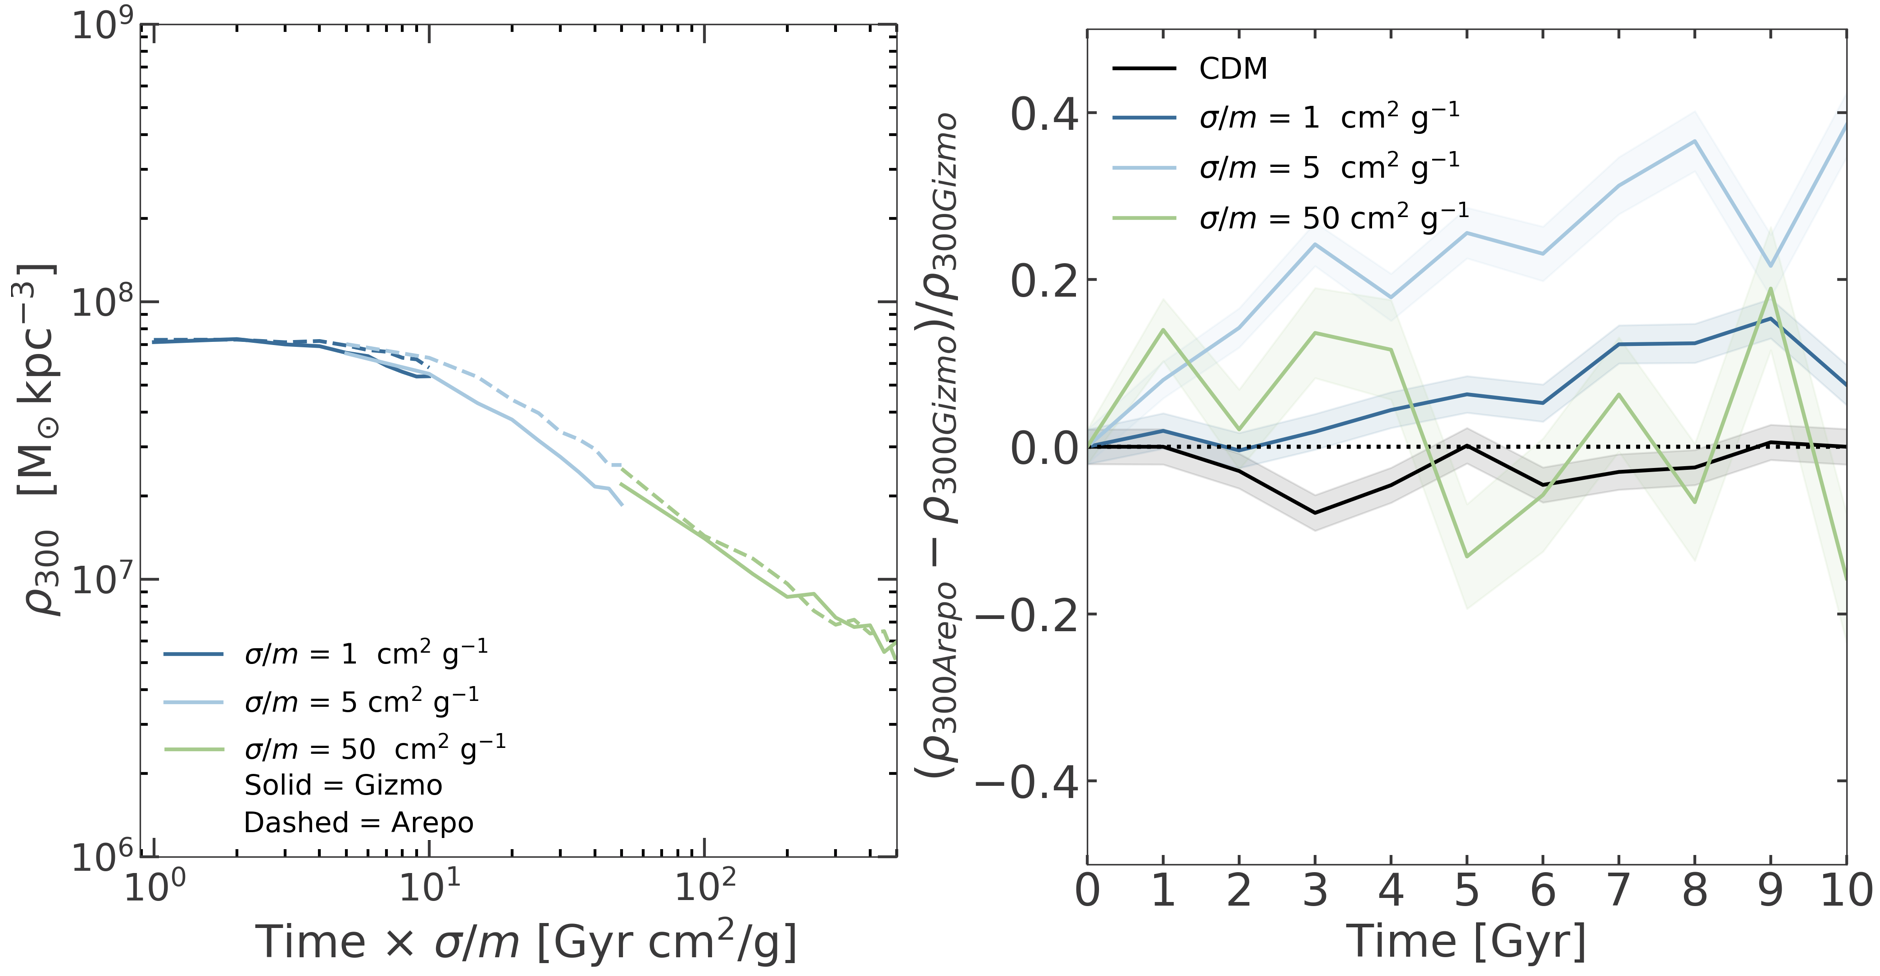
Analytic models of gravothermal evolution predict that halo evolution in the long-mean-free path is self-similar and determined by the product of scattering time and age (Koda & Shapiro, 2011; Nishikawa et al., 2020). Given previous work (see, e.g., Ren et al. (2019b) and Robertson et al. (2021)), we expect the central density for a given halo to be a function of age times since the scattering rate is proportional to . We can see this behavior clearly in the left panel of Fig. 5 where we have plotted (proxy for the core density) vs. age multiplied by . Both Arepo and Gizmo follow the general trend of decreasing core density (increasing core size) with increasing age times . Note that the initial lack of evolution in is because the core size is smaller than and the density at is close to its initial value.
Fig. 5 provides a generally encouraging picture of agreement between Arepo and Gizmo. It is worth noting that the Arepo results seem to provide a more seamless curve when the three different cross-sections are plotted together as in the left panel of Fig. 5, as expected from analytic models.
To better compare the results of the two codes, we also tracked the difference between the density profiles at pc through 10 Gyr. We chose pc since our resolution tests suggest the simulations are well-converged at this radius (see §3.1 for more). For the fiducial resolution simulations, the difference in density profiles was approximately 20-40% and the velocity dispersion profiles were within 5-10% of one another. For the high resolution simulations, the halo profiles were largely within 30% of one another (see the right panel of Fig. 5) and the velocity dispersion profiles were within 5%.
We find that the difference between the two codes is much smaller than the difference between the various SIDM cross-sections we tested. In other words, we are confident these simulations can be used to distinguish amongst SIDM cross-sections of 1, 5, and 50 cm2 g-1. However, the code-to-code variation is large enough that we would argue against using such simulations to differentiate between effects due to SIDM cross-sections of, e.g., 1 vs. 1.5 cm2 g-1.
Finally, as seen in both Fig. 4 and the right panel of Fig. 5, there is an inversion of the DM density profiles, computed by the Arepo and Gizmo codes, for the SIDM cross-section /m cm2g-1. For cross-sections of /m cm2g-1, the halos simulated with Arepo have higher densities than those simulated with Gizmo. However, around 4-5 Gyr, the halos with cross-sections of cm2g-1 evolved with Gizmo become denser than the those evolved with Arepo. The inversion is more obvious in the fiducial resolution simulation (bottom panel of Fig. 4) but is also seen in the higher resolution simulations (top panel of Fig. 4 and right panel of Fig. 5).
To better understand the results of each code, we also tracked the number of self-interactions amongst the dark matter particles. As expected, the number of self-interactions increases with increasing cross-section. The scaling is nearly linear in both codes, with the interaction cross-section of 50 cm2g-1 exhibiting 8 times as many interactions as the cm2g-1 simulation and the cm2g-1 exhibiting about 4 times as many self-interactions as the cm2g-1 simulation. We additionally find that the differences in the number of DM self-interactions per time step are set early on in the simulation and stay consistent throughout a 10 Gyr run. For example, the Gizmo cm2g-1 run consistently exhibits about 10,000 DM self-interactions per Gyr throughout the entire 10 Gyr simulation and the Arepo cm2g-1 run consistently exhibits about 7,000 DM self-interactions per Gyr. Likewise, the Gizmo cm2g-1 run consistently has around 40,000 DM self-interactions per Gyr, and the corresponding Arepo run has around 30,000.
When comparing the self-interactions between the two codes, we find that for /m cm2g-1, Gizmo exhibits a greater number of DM self-interactions (25% more at each time step and overall), which results in the density profiles being more cored (i.e., less dense in the inner regions). For /m cm2g-1, Gizmo begins with slightly more self-interactions than Arepo (5% more). However, consistent with the above discussion, there is an inversion in this trend between 3 and 5 Gyr where the number of self-interactions in Arepo overtakes Gizmo. By 6 Gyr, Arepo exhibits more self-interactions than Gizmo which is maintained across the 10 Gyr.
3.4 Sensitivity to code-specific SIDM parameters
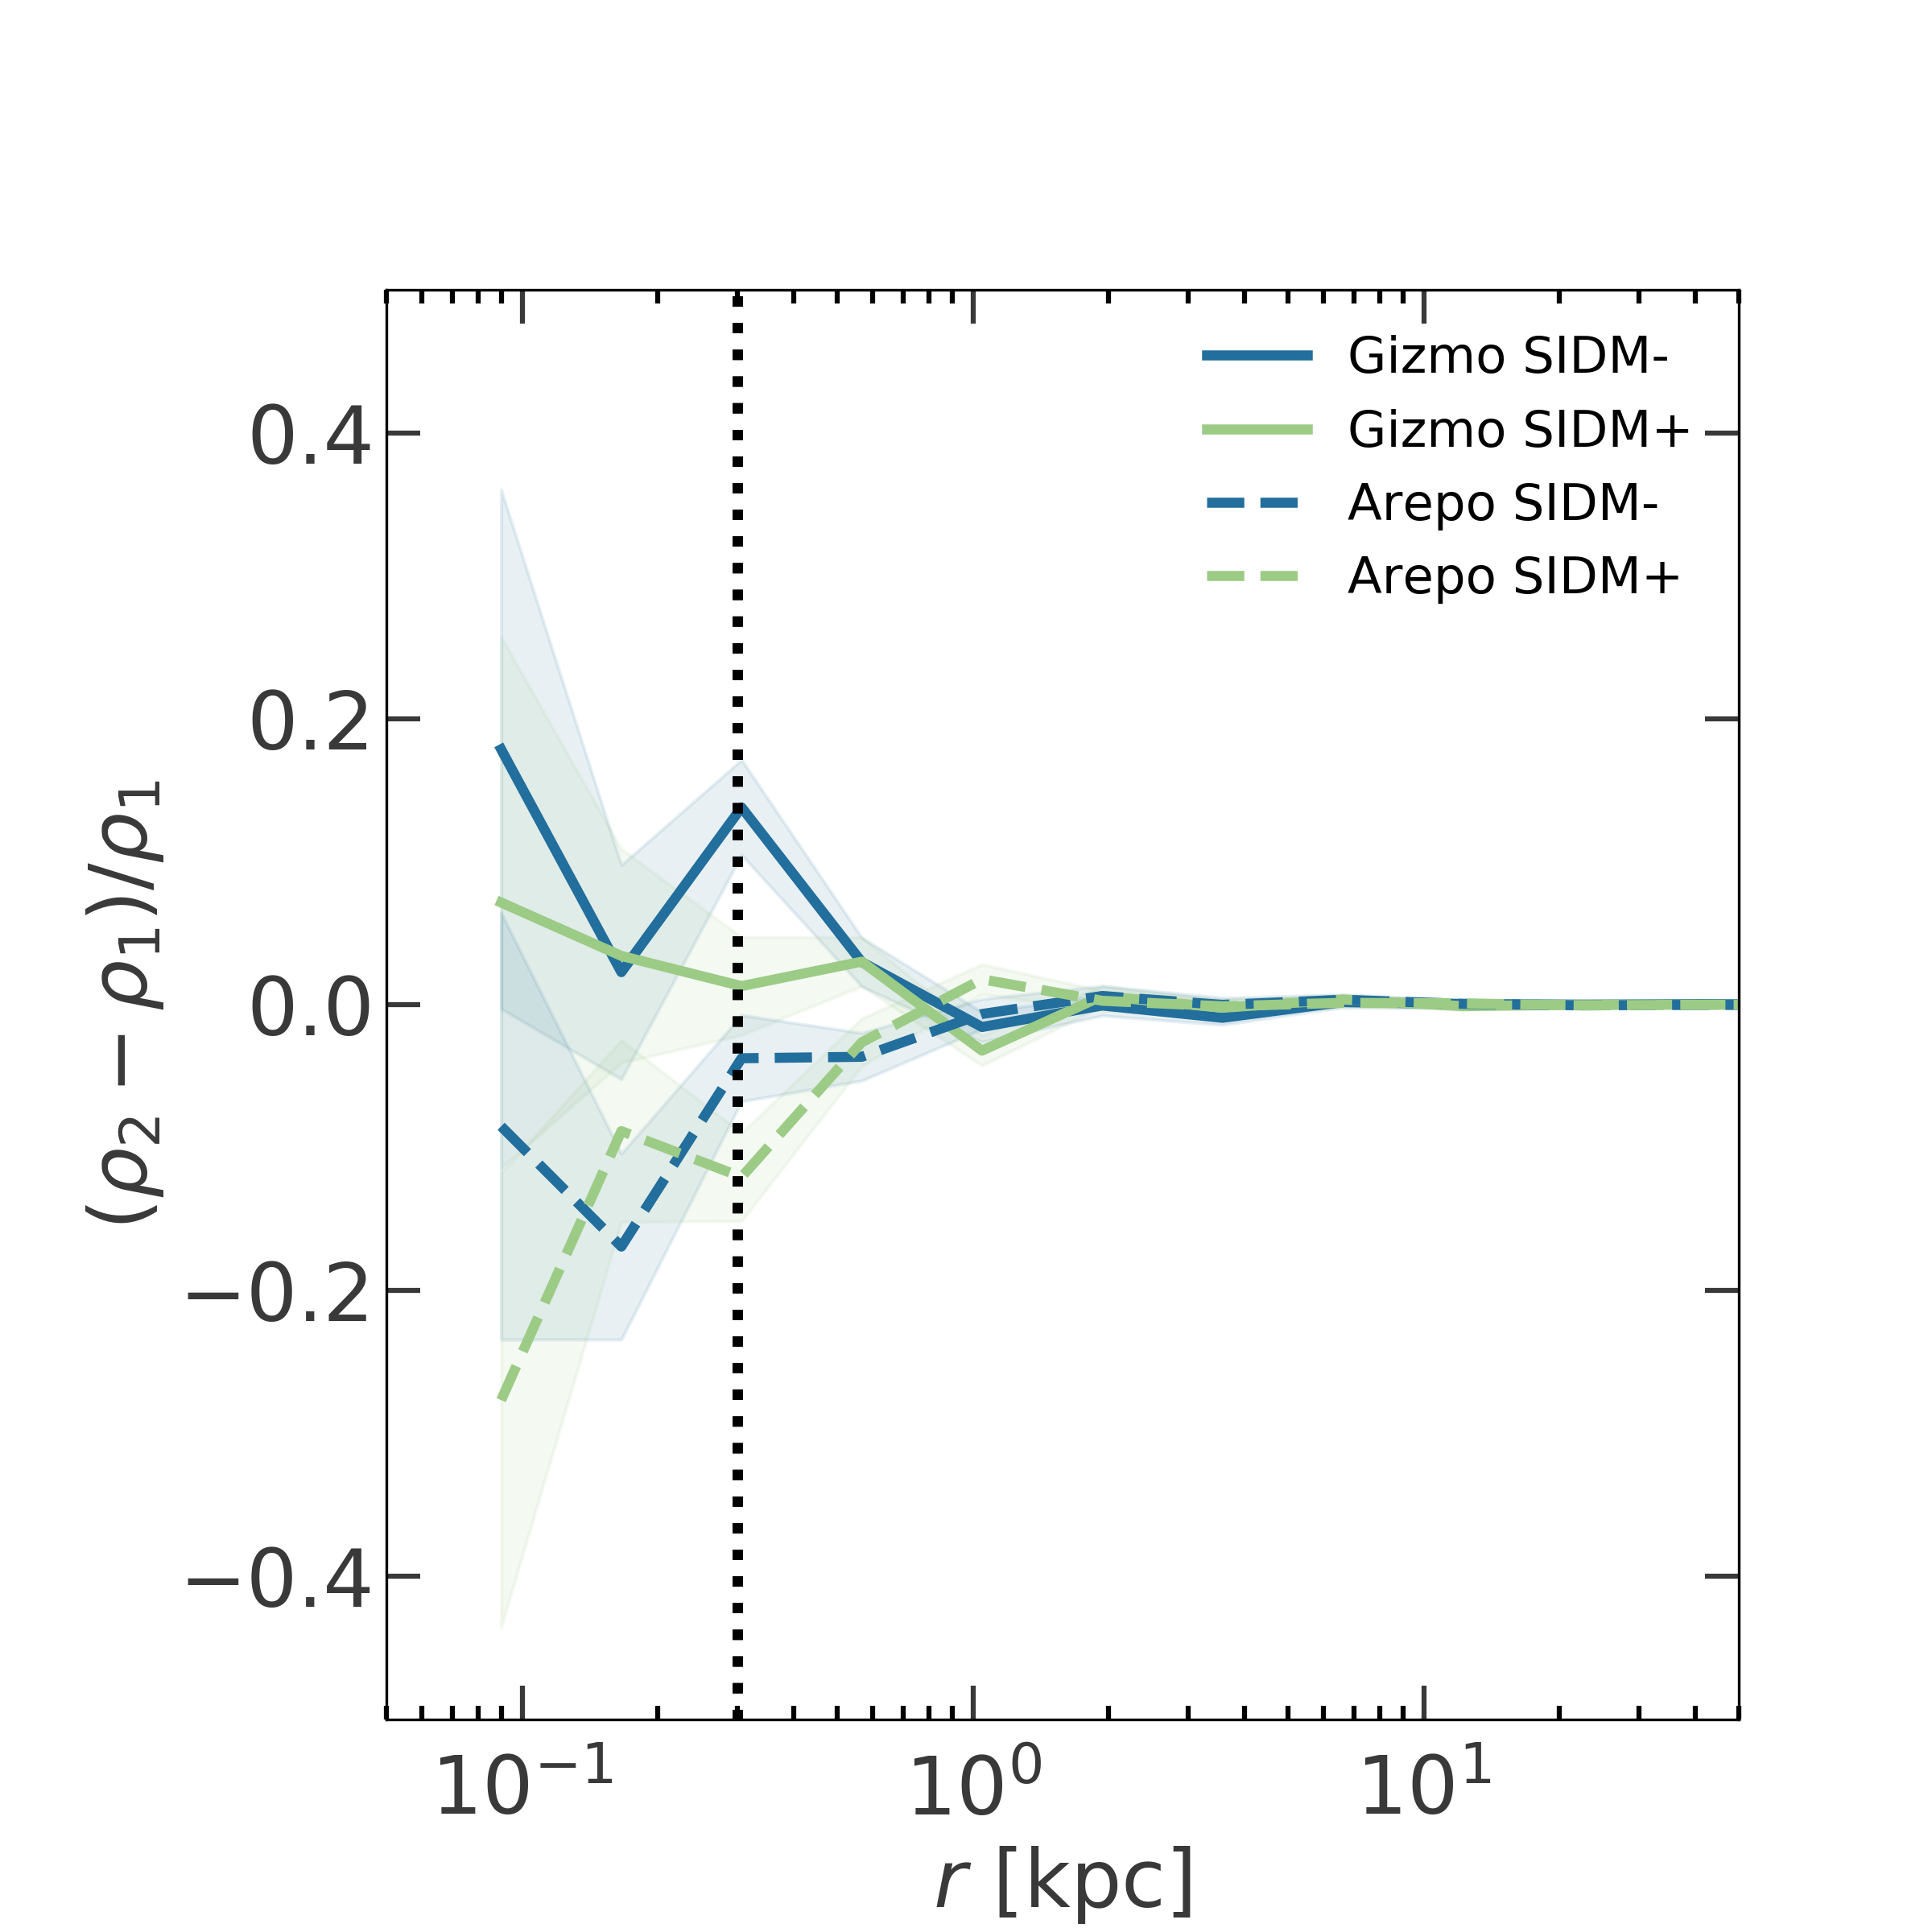
We also tested the sensitivity of each code to various code-specific SIDM parameters. In Figure 6, we plot the difference between the baseline halo density at 5 Gyr and the result of varying the smoothing factor and the number of neighbours in Gizmo and Arepo respectively. For Gizmo, a smoothing factor of 25% of the force softening is the default and has been used in, e.g., Elbert et al. (2015). For Arepo, the default number of neighbours searched is 32 5 but, e.g. Despali et al. (2019) search 64 of the nearest neighbours. We therefore check the sensitivity of both codes to increasing and decreasing the default values for these parameters by a factor of 2. As seen in that figure, these code-specific SIDM choices make up to 10% difference to the halo density at our innermost converged radius (300 pc). However, there is no general trend with respect to the halo density apparent when the values are increased or decreased.
4 Discussion and Conclusion
Using an N-body simulation suite of an isolated dwarf dark matter halo, we compare the SIDM implementations of two simulation codes: Gizmo and Arepo. We use SpherIC to generate an isolated halo with halo mass of as our initial conditions. We adopt constant elastic SIDM cross-sections /m throughout our analysis. Our main conclusions are summarized in the following.
We find that the core density of the halo tracks the number of self-interactions predicted by the code. We find that Gizmo predicts a greater number of self-interactions among the DM particles overall and that the density profiles are generally less dense in the inner region than Arepo. These general results are consistent with previous results that have found that DM self-interactions make the halo density profile more cored (see, e.g., Rocha et al. 2013; Elbert et al. 2015).
Increasing the resolution of the runs (from the baseline of to DM particles) brings the codes into better agreement. At this increased resolution, the two codes predict densities that are similar, to within 10-30%, with Arepo consistently slightly denser than Gizmo. Code-specific SIDM parameters made less than a 10% difference to the final density. Generally, it seems that one can reliably predict differences between SIDM cross-sections of /m = 1, 5, and 50 cm2g-1 based on the agreement between these two codes. However, the inferred 30% difference in density is large enough to preclude any finer-grained distinctions (e.g., between results obtained with with /m = 1.0 vs. 1.5 cm2g-1). Measuring the densities of halos may pose a larger issue than the uncertainties identified in this work.
We find that our limited scope, i.e. only comparing the SIDM implementations in each code, enables us to conduct a fruitful code comparison. In particular, instead of requiring a large comparison infrastructure and network of collaborators, we were able to isolate and discuss the effects of SIDM in the simulations. Naturally, this comparison can be extended to other codes implementing SIDM as well as to include baryonic physics and/or inelastic interactions. Having this underlying understanding of the SIDM module will be invaluable in turning to these larger projects.
Acknowledgements
The authors all thank the anonymous referee for their careful review of this manuscript. This article is partially based on work done while HM and FJM were graduate student researchers under the John Templeton Foundation grant “New Directions in Philosophy of Cosmology” (grant no. 61048). JSB and JOW also acknowledge partial support from the same grant. The opinions expressed here are those of the authors and not necessarily those of the John Templeton Foundation. FJM and JSB were also supported by National Science Foundation (NSF) grant AST-1910965. VHR acknowledges support by the Yale Center for Astronomy and Astrophysics Prize postdoctoral fellowship.
Data Availability
The data supporting the plots within this article are available on reasonable request to the corresponding author. A public version of the Gizmo code is available at http://www.tapir.caltech.edu/ phopkins/Site/GIZMO.html. A public version of the Arepo code is available at https://gitlab.mpcdf.mpg.de/vrs/arepo but we obtained a copy with the SIDM module by directly contacting the code developers.
References
- Ackerman et al. (2009) Ackerman L., Buckley M. R., Carroll S. M., Kamionkowski M., 2009, Phys. Rev. D, 79, 023519
- Ahn & Shapiro (2005) Ahn K., Shapiro P. R., 2005, MNRAS, 363, 1092
- Arkani-Hamed et al. (2009) Arkani-Hamed N., Finkbeiner D. P., Slatyer T. R., Weiner N., 2009, Phys. Rev. D, 79, 015014
- Bullock & Boylan-Kolchin (2017) Bullock J. S., Boylan-Kolchin M., 2017, ARA&A, 55, 343
- Colín et al. (2002) Colín P., Avila-Reese V., Valenzuela O., Firmani C., 2002, ApJ, 581, 777
- Davé et al. (2001) Davé R., Spergel D. N., Steinhardt P. J., Wandelt B. D., 2001, ApJ, 547, 574
- Despali et al. (2019) Despali G., Sparre M., Vegetti S., Vogelsberger M., Zavala J., Marinacci F., 2019, MNRAS, 484, 4563
- Di Cintio et al. (2014) Di Cintio A., Brook C. B., Dutton A. A., Macciò A. V., Stinson G. S., Knebe A., 2014, MNRAS, 441, 2986
- Elbert et al. (2015) Elbert O. D., Bullock J. S., Garrison-Kimmel S., Rocha M., Oñorbe J., Peter A. H. G., 2015, MNRAS, 453, 29
- Feng et al. (2009) Feng J. L., Kaplinghat M., Tu H., Yu H.-B., 2009, J. Cosmology Astropart. Phys., 2009, 004
- Fitts et al. (2019) Fitts A., et al., 2019, MNRAS, 490, 962
- Garrison-Kimmel et al. (2013) Garrison-Kimmel S., Rocha M., Boylan-Kolchin M., Bullock J. S., Lally J., 2013, MNRAS, 433, 3539
- Hopkins (2015) Hopkins P. F., 2015, MNRAS, 450, 53
- Hopkins et al. (2018) Hopkins P. F., et al., 2018, MNRAS, 480, 800
- Kamada et al. (2017) Kamada A., Kaplinghat M., Pace A. B., Yu H.-B., 2017, Phys. Rev. Lett., 119, 111102
- Kaplinghat et al. (2019) Kaplinghat M., Valli M., Yu H.-B., 2019, MNRAS, 490, 231
- Koda & Shapiro (2011) Koda J., Shapiro P. R., 2011, MNRAS, 415, 1125
- Lazar et al. (2020) Lazar A., et al., 2020, MNRAS, 497, 2393
- Loeb & Weiner (2011) Loeb A., Weiner N., 2011, Phys. Rev. Lett., 106, 171302
- Navarro et al. (1997) Navarro J. F., Frenk C. S., White S. D. M., 1997, ApJ, 490, 493
- Navarro et al. (2010) Navarro J. F., et al., 2010, MNRAS, 402, 21
- Nishikawa et al. (2020) Nishikawa H., Boddy K. K., Kaplinghat M., 2020, Phys. Rev. D, 101, 063009
- Oman et al. (2015) Oman K. A., et al., 2015, MNRAS, 452, 3650
- Ren et al. (2019a) Ren T., Kwa A., Kaplinghat M., Yu H.-B., 2019a, Phys. Rev. X, 9, 031020
- Ren et al. (2019b) Ren T., Kwa A., Kaplinghat M., Yu H.-B., 2019b, Physical Review X, 9, 031020
- Robertson et al. (2021) Robertson A., Massey R., Eke V., Schaye J., Theuns T., 2021, MNRAS, 501, 4610
- Robles et al. (2017) Robles V. H., et al., 2017, MNRAS, 472, 2945
- Rocha et al. (2013) Rocha M., Peter A. H. G., Bullock J. S., Kaplinghat M., Garrison-Kimmel S., Oñorbe J., Moustakas L. A., 2013, MNRAS, 430, 81
- Sameie et al. (2021) Sameie O., et al., 2021, MNRAS, 507, 720
- Spergel & Steinhardt (2000) Spergel D. N., Steinhardt P. J., 2000, Phys. Rev. Lett., 84, 3760
- Springel (2010) Springel V., 2010, MNRAS, 401, 791
- Tulin & Yu (2018) Tulin S., Yu H.-B., 2018, Phys. Rep., 730, 1
- Tulin et al. (2013) Tulin S., Yu H.-B., Zurek K. M., 2013, Phys. Rev. D, 87, 115007
- Turner et al. (2021) Turner H. C., Lovell M. R., Zavala J., Vogelsberger M., 2021, MNRAS, 505, 5327
- Vogelsberger et al. (2012) Vogelsberger M., Zavala J., Loeb A., 2012, MNRAS, 423, 3740
- Weinberger et al. (2020) Weinberger R., Springel V., Pakmor R., 2020, ApJS, 248, 32
- Zemp et al. (2008) Zemp M., Moore B., Stadel J., Carollo C. M., Madau P., 2008, MNRAS, 386, 1543