Achieving Reliable Human Assessment of Open-Domain Dialogue Systems
Abstract
Evaluation of open-domain dialogue systems is highly challenging and development of better techniques is highlighted time and again as desperately needed. Despite substantial efforts to carry out reliable live evaluation of systems in recent competitions, annotations have been abandoned and reported as too unreliable to yield sensible results. This is a serious problem since automatic metrics are not known to provide a good indication of what may or may not be a high-quality conversation. Answering the distress call of competitions that have emphasized the urgent need for better evaluation techniques in dialogue, we present the successful development of human evaluation that is highly reliable while still remaining feasible and low cost. Self-replication experiments reveal almost perfectly repeatable results with a correlation of . Furthermore, due to the lack of appropriate methods of statistical significance testing, the likelihood of potential improvements to systems occurring due to chance is rarely taken into account in dialogue evaluation, and the evaluation we propose facilitates application of standard tests. Since we have developed a highly reliable evaluation method, new insights into system performance can be revealed. We therefore include a comparison of state-of-the-art models (i) with and without personas, to measure the contribution of personas to conversation quality, as well as (ii) prescribed versus freely chosen topics. Interestingly with respect to personas, results indicate that personas do not positively contribute to conversation quality as expected.
1 Introduction
Evaluation of open-domain dialogue is particularly challenging and has been cited in high-profile competitions as a known open problem Dinan et al. (2019). Challenges arise primarily from the fact that in real-world conversations there exists such a vast number of possible appropriate responses. Subsequently, dialogue evaluation that relies on comparison with pre-created reference dialogues incur substantial false-negative rates as many appropriate responses are unfairly penalized simply for not corresponding closely with references. In addition, evaluation faces further challenges with respect to the ability to fully take into account dialogue history.111The protocol employed in this work was approved by the DCU Research Ethics Committee.
In this paper, we present a new method of open-domain dialogue evaluation based on human assessment of live conversations with models that avoids the need for pre-created reference dialogues and ensures full familiarity with dialogue history, ticking two important boxes in terms of validity. Although live human evaluation of models has the advantage of being highly valid, reliability unfortunately cannot be assumed and developing methods of evaluation for language tasks that achieve high rater consistency has been challenging, often resulting in low levels of agreement between annotators Finch and Choi (2020); Callison-Burch et al. (2011, 2012); Bojar et al. (2013, 2014); Mehri and Eskenazi (2020b). Despite challenges in this respect, our proposed method provides highly reliable evaluation, achieving a correlation of in self-replication experiments. Additionally, the evaluation can be carried out cheaply and on a large scale through strict quality controlled crowd-sourcing, as well as including score standardization for fairer ranking of competing models. We make the data and code publicly available to aid future research.222https://github.com/TianboJi/Dialogue-Eval
2 Problems in Past Evaluations
A common issue occurs that can potentially impact the validity of results is filtering the set of systems to be evaluated via automatic metric scores. Since metric scores are known to be a poor substitute for human assessment, this only results in the possibility that the best system according to human judges is inadvertently filtered out at this stage. For example, ConvAI2 Dinan et al. (2019) ranked models firstly using automatic metrics before top models according to metric scores were assessed by crowd-sourced workers on Mechanical Turk, while similarly in the sixth Dialog System Technology Challenge (DSTC6) systems were filtered according to metric scores prior to human evaluation.
In terms of the live evaluation, competitions such as Convai2 report such evaluations as highly challenging, with many of the resulting dialogues reported to be senseless, offensive, or simply not in line with instructions and ultimately live evaluation results have been discarded.
Despite challenges, competitions that operate in the public domain, making data and evaluation techniques available to researchers (such as ourselves) should be applauded for such efforts.
On the other hand, competitions that (for one reason or another) do not release data and evaluation techniques into the public domain have reported relative success in terms of human evaluation. However until such methods can be accessed and independently verified through replication studies, they will unfortunately have little impact . The first Amazon Alexa Socialbot Grand Challenge required human assessors to score how coherent and engaging conversations were on a 1–5 rating scale by two distinct groups: volunteer Amazon employees (experts), and general Alexa users (crowds) Ram et al. (2018), are reported to achieve a correlation of overall scores for the two types of human assessors at . The absolute average rating across all chatbots was reported to be 20% lower for experts compared to general users. In an additional effort to evaluate models, conversational user experience, coherence, engagement, domain coverage, topical diversity, and conversational depth were assessed (1–5 scale), with combined scores reported to correlate with those of general users at . In addition to methods and data not being publicly available, correlations are difficult to interpret since no detail is provided about the number of judgments on which the correlation is calculated for example.
In addition to competitions that generally aim to include human evaluation of systems, automatic metrics are often proposed for dialogue evaluation, themselves requiring a human evaluation data set on which to evaluate the proposed metric. However, inappropriate statistics are often applied. For example, Pang et al. (2020) propose a holistic metric to automatically evaluate four distinct aspects of dialogue, and a human evaluation experiment is deployed on Mechanical Turk using a 1–5 rating scale. The mean correlation between human assessors is reported as . However, mean correlations are unfortunately difficult to interpret, since correlation coefficients are not additive , averages calculated in the usual way cannot be assumed to reflect central tendency, and unfortunately, the distribution of correlations is not reported Alexander (1990).
Mehri and Eskenazi (2020b) propose USR (UnSupervised and Reference-free), an unsupervised model that predicts the quality of dialog for a range of criteria using various rating scales: understandable (0–1 rating scale), natural (1–3), maintains context (1–3), interesting (1–3), uses knowledge (0–1); overall quality (1–5). Despite human evaluation being carried out by experts inter-annotator agreement levels varied depending on criteria being measured, ranging from as low as . Additionally, although correlations between human assessments are reported as significant at , despite such statistics often being reported for correlations, they are unfortunately not very meaningful in terms of their impact on correlation interpretation and can be somewhat misleading. Contrary to common expectations, even small effect sizes (low ) can produce very low p-values (strong significance) in such tests. Aiming to achieve a significant correlation is an extremely low bar to reach in terms of consistency, since a low p-value in this case simply rejects the null hypothesis that the correlation is zero.
In addition to the above issues, human evaluation of dialogue systems rarely take into account the fact that differences in performance can occur simply by chance. The method of human evaluation we propose provides a means of applying standard tests for statistical significance to avoid concluding differences that are highly likely to have occurred simply by chance.
3 Crowd-sourcing Reliable Human Assessment of Open-Domain Dialogue
Crowd-sourcing with highly accurate quality control provides a potential mechanism to ensure the three most important criteria that makes an evaluation meaningful while still remaining feasible: validity, reliability and scalability. Subsequently, we ask crowd-workers to carry out live text-based chat with models prior to that same worker also rating the quality of the immediately preceding conversation.
3.1 Human Ratings of Dialogue Quality
A continuous (0–100) rating scale is employed with three main motivation points Graham et al. (2013); Novikova et al. (2018); Li et al. (2019); Santhanam and Shaikh (2019); Santhanam et al. (2020); Mille et al. (2020); Barrault et al. (2020); Howcroft et al. (2020). Firstly, continuous scales reduce potential bias when comparing the performance of competing models by enabling score standardization. The score distribution of each human assessor is standardized according to overall mean and standard deviation of all ratings provided by that assessor, thus removing any adverse effects of those employing overly harsh (or indeed lenient) scoring strategies. Secondly, the 0–100 rating scale allows standard significance tests to score distributions of models to help determine which models significantly outperform others. Thirdly, and possibly most importantly, a continuous rating scale facilitates highly accurate quality control of crowd-sourced workers so that the evaluation can scale while still maintaining validity at a low cost.
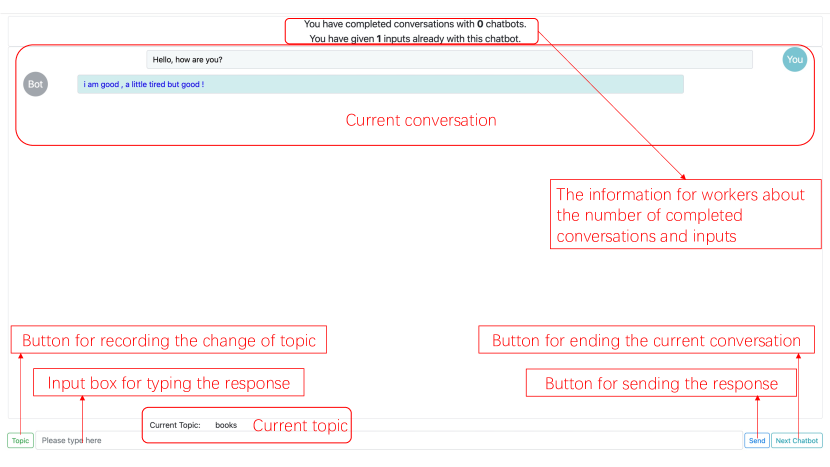
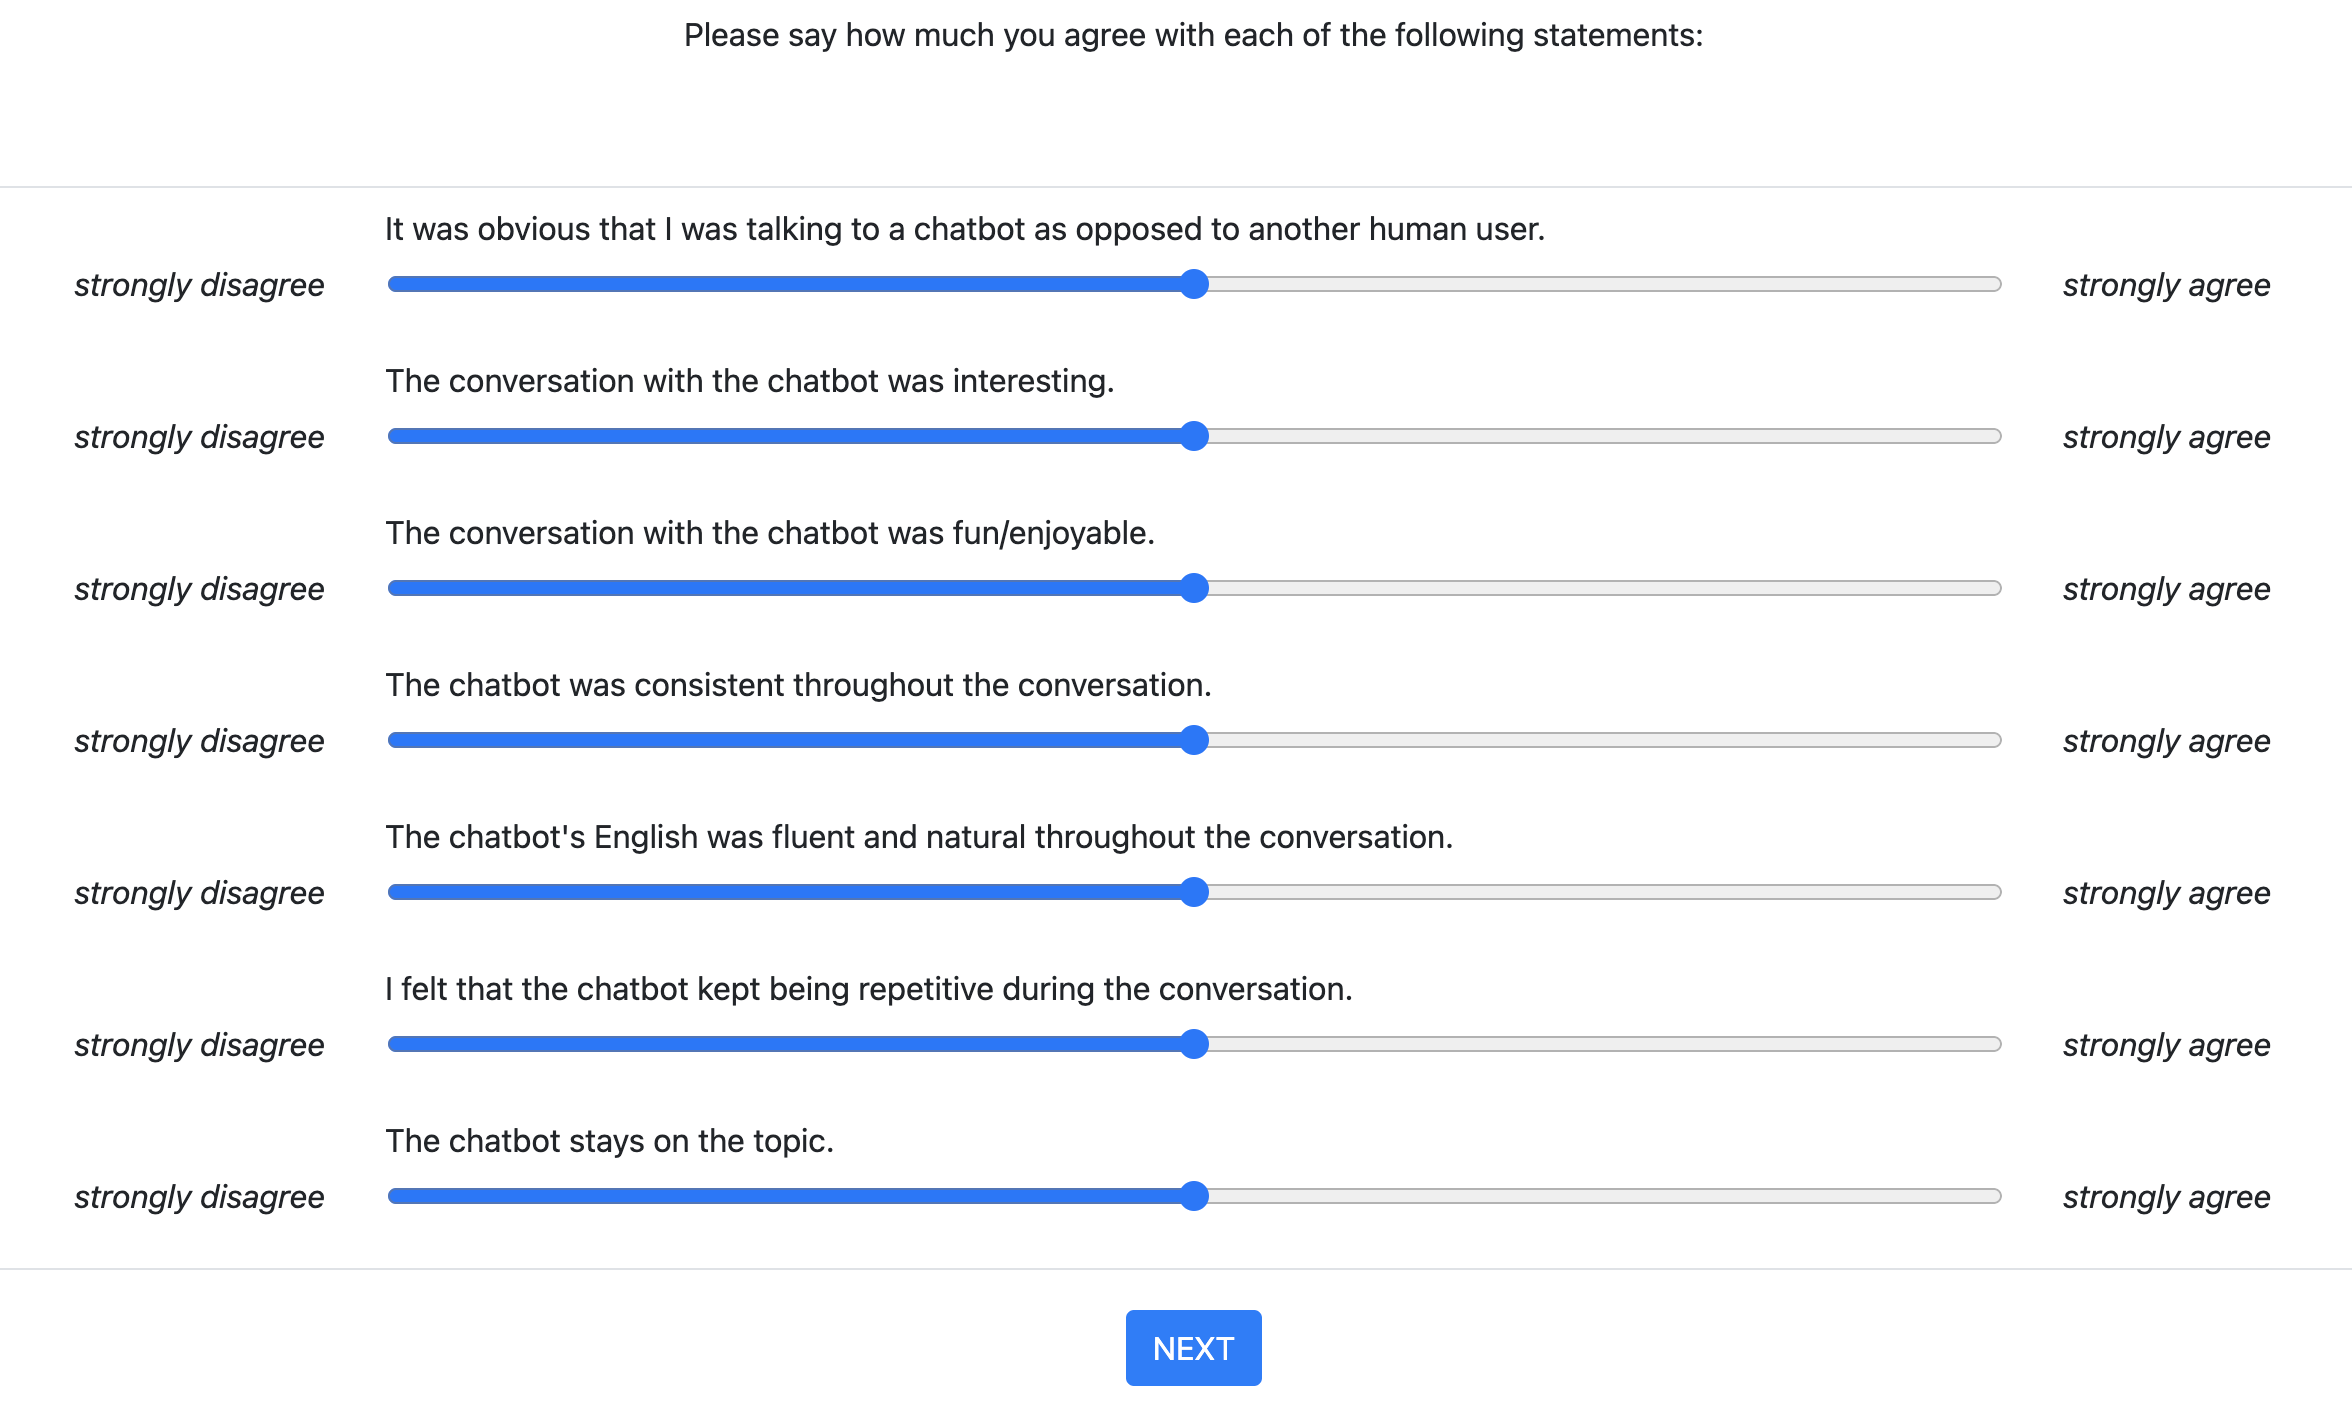
Each human assessor is firstly asked to carry out a live conversation with a randomly selected model, comprised of a minimum of 10 conversational inputs, before rating the quality of the conversation that just took place under a number of criteria shown in Figure 1. Note that the measurement criteria we employed are not immutable and we encourage to extend or adjust the criteria for future studies as necessary.
| Robotic: | It was obvious that I was talking to a chatbot as opposed to another human user. |
| Interesting: | The conversation with the chatbot was interesting. |
| Fun: | The conversation with the chatbot was fun/enjoyable. |
| Consistent: | The chatbot was consistent throughout the conversation. |
| Fluent: | The chatbot’s English was fluent and natural throughout the conversation. |
| Repetitive: | I felt that the chatbot kept being repetitive during the conversation. |
| Topic: | The chatbot stays on topic. |
A continuous rating scale is advantageous for several reasons but employment of such a scale raises the question of how it should be labeled. In evaluation of language tasks, adjectival scale labels, such as poor, low, medium, high, perfect/ okay, good, excellent, and so on, are often employed despite their likely contribution to annotator inconsistency Loukina et al. (2020); Sorodoc et al. (2017). This is despite evidence of adjectival scale labels being problematic in terms of bias resulting from positively and negatively worded items not being true opposites of one another, and items intended to have neutral intensity in fact proving to have specific conceptual meanings. Alexandrov (2010) provides a summary of issues associated with adjectival labels.
To avoid any such causes of inconsistency, we structure each rating as a simple Likert declarative statement and ask human assessors to rate the degree to which they agree with each of these statement, making it possible to keep the rating scale constant while only changing the statement for each measurement criteria. We ask judges to rate each conversation under the seven aforementioned measurement criteria (Figure 1) along with a continuous rating scale labeled only at each extreme with strongly disagree (left); strongly agree (right).
3.2 Quality Controlling the Crowd for Open-Domain Dialogue
We structure Human Intelligence Tasks (HITs) so that a sufficiently rich score distribution is collected from each individual worker who participated, asking each to hold six conversations, comprised of a shuffled arrangement of five dialogue models and a single quality control model.
Many approaches to quality controlling the crowd employ gold-standard items as quality checks Liu et al. (2013); Lasecki et al. (2014). This approach is however highly likely to allow low quality data to pollute the resulting evaluation, since any worker willing to assign high scores to all items will undeservedly pass this check.333Anecdotally, in our experience many workers on crowd-sourcing platforms attempt this strategy to pass quality checks. The approach also runs in contrast to our aim of the same individual who took part in a live conversation to also assess its quality, as it relies on the use of pre-created gold standard conversations.
Our quality control approach overcomes these challenges by deploying models in live conversations that have known distinct performance levels instead of asking workers to assess the quality of pre-existing known high quality conversations. Within a HIT, the five models can produce some quality level of conversation and the model produces known lower quality dialogues (lower than the five models). For a single worker who takes part in conversations with and , we then check how consistently the worker rated the conversations of lower than . This results in a quality control mechanism that does not ask workers to be consistent with other workers or to correctly rate gold standard dialogues but only assesses worker consistency by how consistently they distinguish between known distinct performance models and only with respect to their own conversation ratings.
From a practical standpoint, creating a low performance model, , is additionally far less challenging and costly than pre-creating a known set of high quality dialogues, and degraded models operate fully automatically. Low quality models produce outputs via generation of random responses with meaning distortion also applied.
For random response degradation: Low quality responses are generated by random sampling responses from training set dialogues with the intention of disregarding any previous input from the user, so responses from the model are likely to be perceived as low quality since they have low relevance. To reduce the quality of conversations further, we apply meaning distortion: each response, , is altered to distort its meaning by randomly selecting a sequence of words within that response and replacing it with a sequence of words sampled from a distinct training set dialogue, with the length of the replaced word sequence being determined by the number of words in . The specific details are provided in Appendix A.1, and Figure 4 in Appendix A.4 gives a typical example.
Hits subsequently consist of a total of six dialogues comprised of five genuine models and a single quality control model that generates meaning distorted and random responses. Crowd-sourced workers converse with each model before rating conversation quality (model order is shuffled and blind). Statistical significance tests are then applied to score distributions of workers for the ratings they attributed to ordinary models, , relative to the low quality model, . The resulting -value is then employed as a means of rating worker consistency, and any worker with shows no significant difference between low and ordinary model quality and is filtered out.
3.3 Calculating System-Level Scores
Scores are collected from workers who rate models on a 0–100 rating scale, and we refer to these scores as raw scores. Scores for negative attributes, i.e. robotic and repetitive, are then reversed for ease of further comparison, the original rating. A distribution of scores is extracted for each worker and raw scores are standardized according to each worker’s mean and standard deviation, in order to iron out any differences in worker scoring strategy.
Average standardized scores for each criteria are calculated, and an overall score is calculated as the average of all measurement criteria.
4 Meta-Evaluation
| Topic | Workers | Ave. Duration (min) | Dialogues \bigstrut | |||||||||
| Total | Passed | Pass Rate | Passed | Failed | All | Total | Passed | Pass Rate \bigstrut | ||||
| Free Run 1 | 249 | 173 | 69.5% | 6.53 | 7.04 | 6.68 | 1,525 | 1,075 | 70.5% \bigstrut[t] | |||
| Free Run 2 | 248 | 139 | 56.0% | 6.87 | 7.58 | 7.18 | 1,480 | 838 | 56.6% | |||
| Ice-breaker | 248 | 171 | 69.0% | 6.60 | 6.70 | 6.63 | 1,450 | 1,030 | 71.0% \bigstrut[b] | |||
In order to assess the reliability of the proposed method of human evaluation, we carry out a meta-evaluation in which we firstly examine individual human assessor consistency, before conducting a self-replication experiment. A number of models are required to function as a sample set of test systems, and for this purpose we employ available pre-trained models from ParlAI:444https://parl.ai/docs/zoo.html Poly-Encoder Transformer Humeau et al. (2019), Bi-Encoder Transformer Dinan et al. (2018), Sequence to Sequence Sutskever et al. (2014), Key-Value Memory Networks Miller et al. (2016), and a LSTM-based Model Hochreiter and Schmidhuber (1997). Within the evaluation setting of ConvAI2, each model is with a persona consisting of approximately five textual statements to emulate a personality. However, to increase the number of models and to provide an interesting comparison, we additionally include a version of each of the above models without any persona, resulting in 10 competing models.
Hits were posted on the crowd-sourcing platform Amazon Mechanical Turk.555https://www.mturk.com Firstly, and in order to evaluate the open-domain models in as realistic a setting as possible, we allow workers to choose the topic of conversation and input their chosen topic in a text field. The open nature of conversations should be noted however as something that influences the difficulty of producing consistent results in our self-replication experiment. The fact that we allow human assessors to freely choose the topic of conversation means that differences in ratings could result from legitimate differences in performance when different topics are chosen by human assessors. We nonetheless test our evaluation allowing the user to choose the topic as this is part of our core aim for developing evaluation of dialogue truly in the open domain.
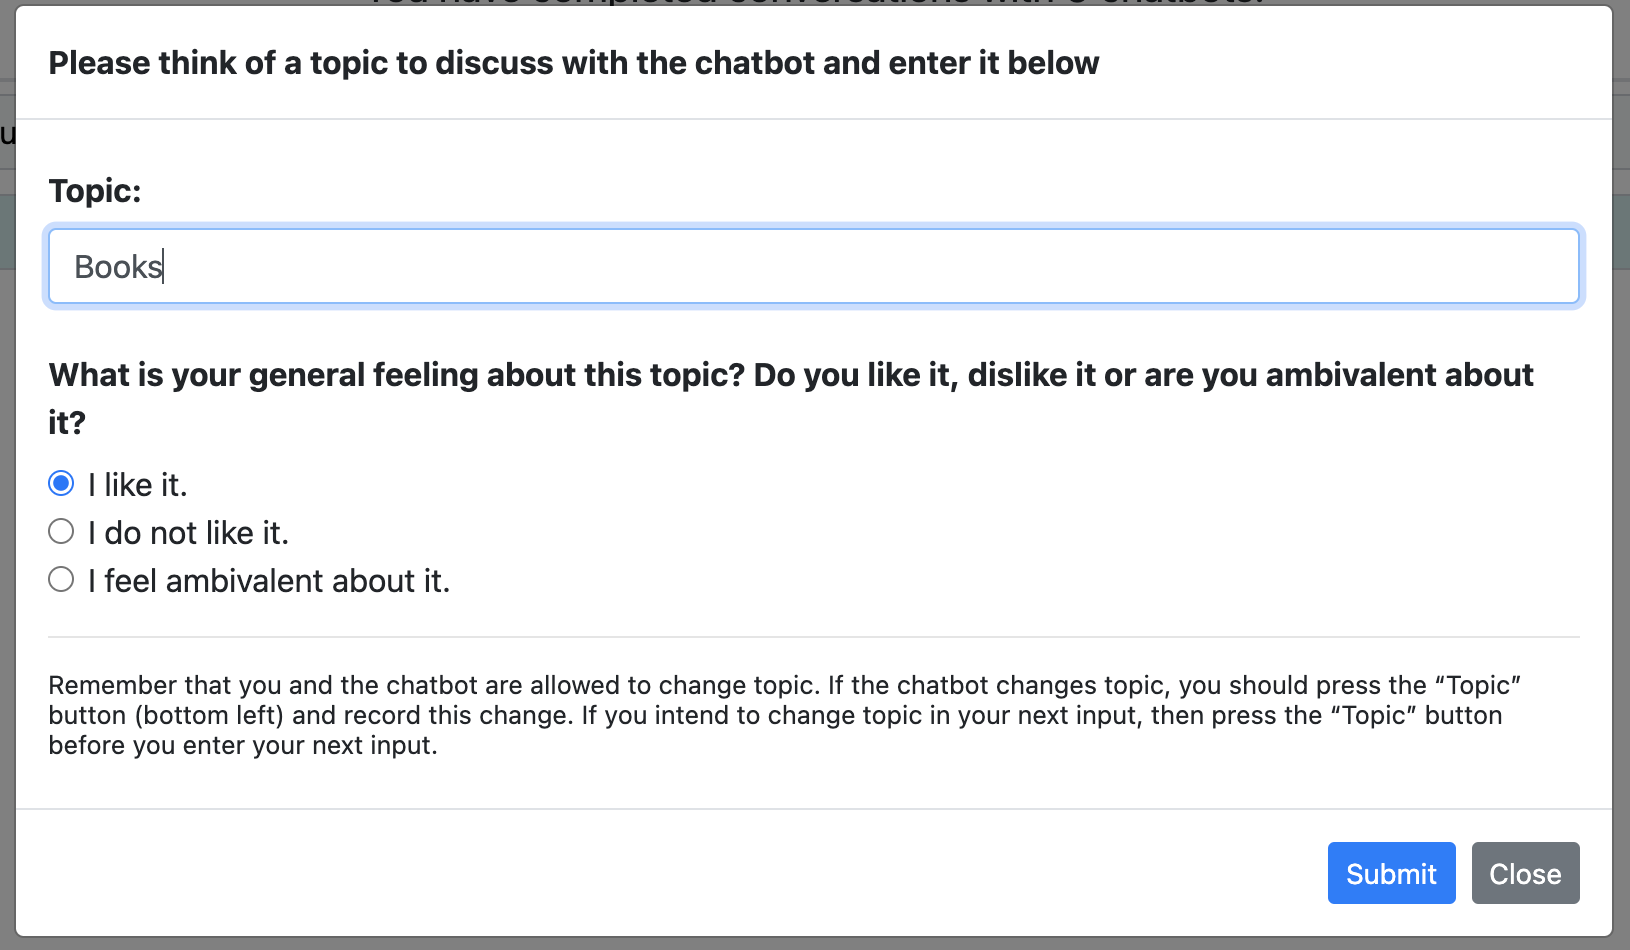
Besides choosing a topic, we additionally asked workers to input their opinion of the topic they chose to discuss with models, categorizing the topic as either liked, ambivalent about it, or disliked. For example, if the topic they chose to discuss was dogs, we were curious to know if this was motivated by the fact that the worker liked or disliked dogs or indeed that they had chosen to discuss something they had no particular feeling about. Table 2 shows subsequent proportions (%) of workers, and the detailed instructions are introduced in Figure 5 in Appendix A.4. Perhaps unsurprisingly, the vast majority of workers chose to discuss something they liked (84% for workers who passed quality control). Nonetheless 7% of good workers were ambivalent about the topic they chose and 9% chose a topic they reported as disliking.
| Free run 1 | Free run 2 | ||||
| Pass | Fail | Pass | Fail | ||
| Like | 83.9 | 88.6 | 86.4 | 93.8 | |
| Ambivalent | 7.4 | 3.8 | 6.2 | 2.3 | |
| Dislike | 8.7 | 7.7 | 7.4 | 3.9 | |
Table 1 shows the number of workers who participated in the initial data collection run who freely chose the topic of conversation with models (Free run 1), amounting to 1,525 dialogues 7 criteria 10,675 human ratings. The details of payment to each worker and the total experiment cost are provided in Appendix A.2. Table 1 also shows the proportion of workers who passed quality checks, numbers of dialogues assessed in total before and after quality filtering, as well as the average time taken for workers to complete a hit and average time taken to assess dialogues. As mentioned previously, we carry out a second data collection run with precisely the same settings (Free run 2) to measure the reliability of results and Table 1 shows equivalent statistics with respect to Free run 2 in which a total of 1,480 dialogues 7 ratings 10,360 human ratings were collected in total.
4.1 Human Assessor Consistency
Although the overall aim of our evaluation is to produce reliable results at the system level, which we test later in Section 4.2, we firstly examine ratings of workers at the level of individual dialogue ratings. Technically speaking, the most meaningful reliability measures for continuous ratings scales test consistency of aggregate (system-level) results because although a high level of random error is expected in individual continuous rating scale scores, when aggregates are calculated for large samples of ratings, positive and negative error that is truly random effectively cancels itself out, and does not negatively impact consistency. In other words, the rating scale we employ does not rely on consistency on the level of individual ratings. We nonetheless examine individual rater consistency, since it is the standard approach, but keep in mind that results in this part of our meta-evaluation are not crucial when testing reliability for an evaluation carried out via a continuous rating scale where consistency in overall system-level results are more important.
|
Model |
Overall |
Interesting |
Fun |
Consistent |
Fluent |
Topic |
Robotic |
Repetitive |
||
| Free Run 1 | A | 798 | 0.534 | 0.564 | 0.602 | 0.711 | 0.863 | 0.964 | 0.038 | 0.069 |
| B | 798 | 0.419 | 0.474 | 0.481 | 0.614 | 0.875 | 0.994 | 0.431 | 0.075 | |
| Ap | 707 | 0.318 | 0.399 | 0.372 | 0.443 | 0.821 | 0.404 | 0.330 | 0.116 | |
| C | 791 | 0.262 | 0.491 | 0.379 | 0.028 | 0.636 | 0.066 | 0.316 | 0.680 | |
| Cp | 714 | 0.189 | 0.409 | 0.373 | 0.159 | 0.672 | 0.114 | 0.521 | 0.349 | |
| Bp | 707 | 0.173 | 0.230 | 0.197 | 0.369 | 0.673 | 0.320 | 0.395 | 0.187 | |
| D | 707 | 0.087 | 0.190 | 0.208 | 0.166 | 0.311 | 0.401 | 0.637 | 0.449 | |
| Dp | 798 | 0.201 | 0.308 | 0.234 | 0.092 | 0.312 | 0.025 | 0.625 | 0.669 | |
| Ep | 763 | 0.217 | 0.181 | 0.201 | 0.196 | 0.380 | 0.455 | 0.605 | 0.264 | |
| E | 742 | 0.243 | 0.165 | 0.160 | 0.142 | 0.329 | 0.407 | 0.745 | 0.411 | |
| 0.969 | 0.952 | 0.927 | 0.899 | 0.960 | 0.951 | 0.646 | 0.936 \bigstrut[t] | |||
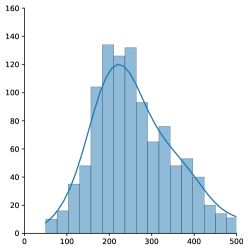
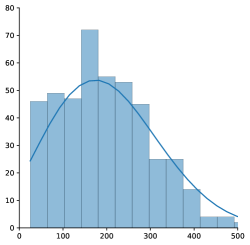
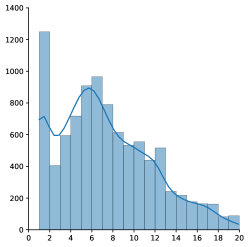
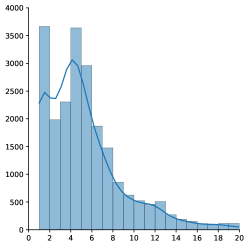
The distribution of Pearson correlation coefficients for pairs of workers who assessed the same hit is depicted in Figure 2.
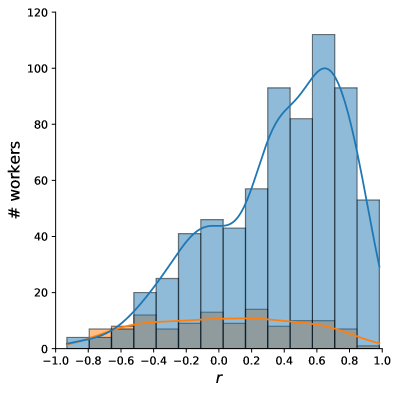
As can be seen from Figure 2, the likelihood of agreement between pairs of workers who failed quality control is close to random as the distribution is approaching uniformity across almost the range of possible coefficients. In contrast, for pairs of workers who pass quality control, the peak of agreement is between an of and , showing high agreement in general between such annotator pairs.
Some of the observed disagreement is likely to be the result of legitimate differences between scores of two workers who chose distinct topics to discuss with the same model however, an unavoidable source of inconsistency when testing models with respect to the open domain. Interestingly, in 5% of dialogues, worker pairs assigned the same hit happened to both freely choose an identical topic to discuss with the same model. Furthermore, remaining disagreement at the level of individual ratings might not be problematic at the level of overall scores in relation to aggregation of ratings collected on a continuous rating scale.
4.2 System-level Consistency
|
Model |
Overall |
Interesting |
Fun |
Consistent |
Fluent |
Topic |
Robotic |
Repetitive |
||
| Ice-breaker | A | 721 | 0.552 | 0.565 | 0.527 | 0.873 | 1.018 | 1.011 | 0.287 | 0.156 |
| Ap | 742 | 0.422 | 0.589 | 0.560 | 0.518 | 0.718 | 0.527 | 0.009 | 0.034 | |
| B | 721 | 0.376 | 0.379 | 0.340 | 0.634 | 0.769 | 0.820 | 0.221 | 0.087 | |
| C | 784 | 0.322 | 0.615 | 0.537 | 0.190 | 0.631 | 0.061 | 0.344 | 0.565 | |
| Bp | 658 | 0.273 | 0.406 | 0.340 | 0.414 | 0.633 | 0.423 | 0.369 | 0.063 | |
| Cp | 700 | 0.222 | 0.402 | 0.337 | 0.089 | 0.654 | 0.068 | 0.376 | 0.514 | |
| D | 728 | 0.139 | 0.277 | 0.204 | 0.123 | 0.349 | 0.295 | 0.638 | 0.620 | |
| Ep | 714 | 0.198 | 0.172 | 0.203 | 0.054 | 0.316 | 0.343 | 0.533 | 0.396 | |
| E | 721 | 0.240 | 0.125 | 0.161 | 0.196 | 0.318 | 0.393 | 0.631 | 0.489 | |
| Dp | 721 | 0.267 | 0.426 | 0.402 | 0.011 | 0.234 | 0.000 | 0.628 | 0.636 | |
| 0.984 | 0.967 | 0.944 | 0.958 | 0.951 | 0.981 | 0.715 | 0.950 | |||
Table 3 shows results of the system-level evaluation resulting from the initial data collection run on Mechanical Turk (Free run 1), where competing models are ordered by overall highest average z-score.666Average standardized scores for models in Free run 2 are additionally included in Table 9 in Appendix A.4; as well as equivalent average raw scores for models are in Table 10 in Appendix A.4.
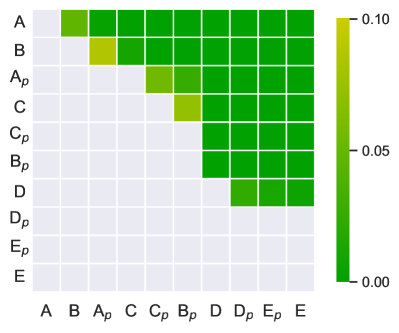
Table 3 additionally shows consistency of the evaluation between each experiment run via the Pearson correlation of scores for each measurement criteria as well as consistency overall. Across the board, consistency is very high, exceeding a correlation of in almost all cases with the exception of robotic which nonetheless achieved a correlation of over . Besides individual criteria, of crucial importance is the consistency of overall results, as this is the means by which models would ordinarily be ranked in terms of overall performance. As can be observed from Table 3, the correlation reached in terms of overall scores for systems is , which is very close to a perfect correlation, showing extremely high levels of reliability for the evaluation, evidence that the approach overcomes substantial challenges with respect to annotator consistency and expected difficulties with respect to evaluating models in the open domain, where assessors are legitimately free to choose distinct topics of conversation.
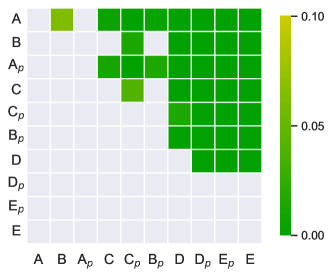
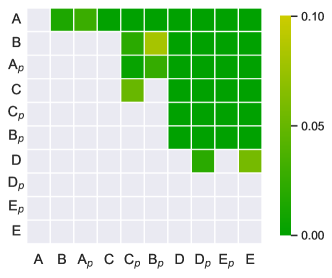
In any empirical evaluation, statistical significance tests should be applied to take into account the fact that small differences in scores between systems can occur simply by chance. We provide pairwise significance test results in Figure 3, where we apply standard significance test, Wilcoxon rank-sum to rating distributions for each pair of competing models for each data collection run, and corresponding results for run 2 in Figure 6 in Appendix A.4. Results showed a very high proportion of identical conclusions, , drawn from pairwise significance tests applied to data from the two data collection runs at . Results for , additionally showed high correspondence between pairwise significance test conclusions, only marginally lower with of the same conclusions being drawn for pairs of models in the two data collection runs. We additionally provide correlations between measurement criteria and overall scores in Table 8 of Appendix A.4.
5 Persona Contribution to System Performance
Since we have verified the reliability of the human evaluation, we take a closer look at the results and investigate dialogue quality when models employ a persona. Results in Table 3 reveal that perhaps unexpectedly in general are either rated more favorably by human assessors when they carry out dialogues without a persona or a tie occurs between models with and without a persona.
6 Evaluating with Prescribed Topics
In contrast to the initial experiment in which workers were permitted to choose the topic of conversation, we further investigate the performance of models in a slightly easier setting where the topic under discussion is known to the model, by selecting a statement from its persona, which we refer to as an ice-breaker topic statement. An ice-breaker topic statement is then provided to human assessors at the beginning of each conversation, and the assessor is instructed to talk about this topic with the model. We therefore provide the topic of conversation to workers in the form of an ice-breaker topic statement, corresponding to a randomly selected persona statement belonging to the agent. Again, we run this experiment on MTurk, this time contrasting results for our initial data collection run where workers freely chose a topic with one in which workers were instructed to talk about the ice-breaker statement with models.
Numbers of workers who participated in the Ice-breaker run are provided in Table 1, while a breakdown of results for each model and overall average scores are shown in Table 4 as well as the correlation between scores for systems when a topic is freely chosen. Interestingly, in terms of absolute differences in raw scores, the best performing model achieves higher fluency, consistency and is deemed less repetitive when evaluated in ice-breaker conversations compared those with freely chosen topics. Raw average scores for models in the Ice-breaker run are additionally provided in Table 11 in Appendix A.4. Relatively speaking, in terms of system rankings, no meaningful difference in relative performance is observed when models are tested in a scenario where the worker chooses a topic and when one is prescribed with an ice-breaker statement, as can be seen from the strong correlation between scores for models in Free run 1 and Ice-breaker evaluation as shown in Table 4. Additionally, significance test results for the Ice-breaker evaluation are provided in Figure 7 in Appendix A.4.
7 Comparison with Automatic Evaluation Metrics
7.1 Word-overlap-based Metrics
In this experiment, we employed four prevailing word-overlap-based metrics as described in the following, whose scores are computed on the ConvAI2 test set.
BLEU
BLEU (Bilingual Evaluation Understudy) evaluate the quality of a system output by computing the n-gram precision according to human-generated references (Papineni et al., 2002). It also uses the brevity penalty to penalize short outputs.
ROUGE-L
ROUGE (Recall-Oriented Understudy for Gisting Evaluation) is a recall-adaptation of BLEU, whose wildly-applied variant is ROUGE-L (Lin and Hovy, 2003). It computes the precision and recall using Longest Common Subsequence (LSC) instead of n-gram, and the F1 score of precision and recall is reported as the final score.
METEOR
METEOR (Metric for Evaluation of Translation with Explicit ORdering) was firstly proposed to overcome flaws of BLEU, like no usage of recall (Denkowski and Lavie, 2011). It computes the unigram precision and recall, and have a different mechanism of choosing the brevity penalty.
GLEU
GLEU (Google-BLEU) is a variety of BLEU (Wu et al., 2016) which computes the n-gram precision and recall instead of the standalone precision. The minimum of precision and recall is reported as the final GLEU score.
| Metric | |
| BLEU-4 | 0.883 |
| BLEU-1 | 0.707 |
| ROUGE-L | 0.799 |
| METEOR | 0.321 |
| GLEU | 0.816 |
7.2 Reference-free Metrics
| FEDm | FEDl | USR | USR-MLM | USR-DR(c) | USR-DR(f) | |||
| Overall | 0.590 | 0.530 | 0.230 | 0.419 | 0.046 | 0.205 | ||
| Interesting | 0.028 | 0.042 | 0.451 | 0.235 | 0.238 | 0.081 | ||
| Fun | 0.339 | 0.115 | 0.378 | 0.319 | 0.131 | 0.032 | ||
| Consistent | 0.236 | 0.227 | 0.214 | 0.620 | 0.518 | 0.652 | ||
| Fluent | 0.138 | 0.054 | 0.227 | 0.374 | 0.028 | 0.151 | ||
| Robotic | 0.528 | 0.461 | 0.070 | 0.290 | 0.106 | 0.191 | ||
| Repetitive | 0.841 | 0.752 | 0.713 | 0.182 | 0.690 | 0.568 | ||
| Topic | 0.046 | 0.004 | 0.222 | 0.754 | 0.606 | 0.746 |
The following introduces two reference-free automatic metrics we employed: FED and USR. Their scores are computed using the conversations collected in our experiment.
FED
FED (Fine-grained Evaluation of Dialog) is a pretrained-model based metric to evaluate a textual conversation history (Mehri and Eskenazi, 2020a). Given a conversation , a pretrained model , two predefined responses and (), the FED score is where computes the likelihood that the model will generate a response to a conversation . We employed medium and large DialoGPT (Zhang et al., 2020) as FED scorers, where the full list of predefined positive and negative responses are avaiable in Table 7 in Appendix.
USR
USR (an UnSupervised Reference-free metric) uses the pretrained model RoBERTa (Liu et al., 2019) to assess the quality of a conversation (Mehri and Eskenazi, 2020b). It consists of three sub-metrics: USR-MLM is to evaluate the understandability and naturalness, USR-DR(c) and USR-DR(f) are to evaluate the interestingness and consistency. The sub-metric scores then produce an overall score through a regression model.
7.3 Correlation between Automatic Metrics and Human Evaluation
We compute the correlation between commonly applied automatic metrics and our human evaluation methods, including word-overlap-based metrics and reference-free metrics, as shown in Tables 5 and 6 respectively.
As can be seen from Table 5, unfortunately no word-overlap metric achieves a strong positive correlation with human assessment, confirming once again that the invalidity of system rankings currently produced by automatic metric scores.
In terms of reference-free metrics, results correspond better and are more encouraging. FED has the ability of distinguishing “repetitive” models, but for other criteria, it correlates weakly or even negatively with human. Meanwhile, despite USR only correlating marginally with human in terms of consistency and topic loyalty, USR-DR(f) correlates closest to human among the three sub-metrics, while it performs best on evaluating consistency and topic loyalty.
8 Conclusion
Development of reliable evaluation of open-domain dialogue has been highlighted as a known open-problem. We overcome previous challenges and provide a new human evaluation methodology shown as highly consistent, with results for models correlating at in two separate data collection runs. Our evaluation has the advantage of highly accurate quality control of crowd-sourcing, differences in scoring strategies to be ironed out via score standardization, applicability of standard significance testing while increasing the reliability of results.
References
- Alexander (1990) Ralph A Alexander. 1990. A note on averaging correlations. Bulletin of the Psychonomic Society, 28(4):335–336.
- Alexandrov (2010) Aliosha Alexandrov. 2010. Characteristics of single-item measures in likert scale format. The Electronic Journal of Business Research Methods, 8(1):1–12.
- Barrault et al. (2020) Loïc Barrault, Magdalena Biesialska, Ondřej Bojar, Marta R. Costa-jussà, Christian Federmann, Yvette Graham, Roman Grundkiewicz, Barry Haddow, Matthias Huck, Eric Joanis, Tom Kocmi, Philipp Koehn, Chi-kiu Lo, Nikola Ljubešić, Christof Monz, Makoto Morishita, Masaaki Nagata, Toshiaki Nakazawa, Santanu Pal, Matt Post, and Marcos Zampieri. 2020. Findings of the 2020 conference on machine translation (wmt20). In Proceedings of the Fifth Conference on Machine Translation, pages 1–54, Online. Association for Computational Linguistics.
- Bojar et al. (2014) Ondrej Bojar, Christian Buck, Christian Federmann, Barry Haddow, Philipp Koehn, Johannes Leveling, Christof Monz, Pavel Pecina, Matt Post, Herve Saint-Amand, Radu Soricut, Lucia Specia, and Aleš Tamchyna. 2014. Findings of the 2014 workshop on statistical machine translation. In Proceedings of the Ninth Workshop on Statistical Machine Translation, pages 12–58, Baltimore, Maryland, USA. Association for Computational Linguistics.
- Bojar et al. (2013) Ondřej Bojar, Christian Buck, Chris Callison-Burch, Christian Federmann, Barry Haddow, Philipp Koehn, Christof Monz, Matt Post, Radu Soricut, and Lucia Specia. 2013. Findings of the 2013 Workshop on Statistical Machine Translation. In Proceedings of the Eighth Workshop on Statistical Machine Translation, pages 1–44, Sofia, Bulgaria. Association for Computational Linguistics.
- Callison-Burch et al. (2012) Chris Callison-Burch, Philipp Koehn, Christof Monz, Matt Post, Radu Soricut, and Lucia Specia. 2012. Findings of the 2012 workshop on statistical machine translation. In Proceedings of the Seventh Workshop on Statistical Machine Translation, pages 10–51, Montréal, Canada. Association for Computational Linguistics.
- Callison-Burch et al. (2011) Chris Callison-Burch, Philipp Koehn, Christof Monz, and Omar Zaidan. 2011. Findings of the 2011 workshop on statistical machine translation. In Proceedings of the Sixth Workshop on Statistical Machine Translation, pages 22–64, Edinburgh, Scotland. Association for Computational Linguistics.
- Denkowski and Lavie (2011) M. Denkowski and A. Lavie. 2011. Meteor 1.3: Automatic metric for reliable optimization and evaluation of machine translation systems. In Proceedings of the Sixth Workshop on Statistical Machine Translation, pages 85–91. Association for Computational Linguistics.
- Dinan et al. (2019) Emily Dinan, Varvara Logacheva, Valentin Malykh, Alexander H. Miller, Kurt Shuster, Jack Urbanek, Douwe Kiela, Arthur Szlam, Iulian Serban, Ryan Lowe, Shrimai Prabhumoye, Alan W. Black, Alexander I. Rudnicky, Jason Williams, Joelle Pineau, Mikhail Burtsev, and Jason Weston. 2019. The second conversational intelligence challenge (convai2). CoRR, abs/1902.00098.
- Dinan et al. (2018) Emily Dinan, Stephen Roller, Kurt Shuster, Angela Fan, Michael Auli, and Jason Weston. 2018. Wizard of wikipedia: Knowledge-powered conversational agents. CoRR, abs/1811.01241.
- Finch and Choi (2020) Sarah E. Finch and Jinho D. Choi. 2020. Towards unified dialogue system evaluation: A comprehensive analysis of current evaluation protocols. In Proceedings of the 21th Annual Meeting of the Special Interest Group on Discourse and Dialogue, pages 236–245, 1st virtual meeting. Association for Computational Linguistics.
- Graham et al. (2013) Yvette Graham, Timothy Baldwin, Alistair Moffat, and Justin Zobel. 2013. Crowd-sourcing of human judgments of machine translation fluency. In Proceedings of the Australasian Language Technology Association Workshop 2013 (ALTA 2013), pages 16–24, Brisbane, Australia.
- Hochreiter and Schmidhuber (1997) Sepp Hochreiter and Jürgen Schmidhuber. 1997. Long short-term memory. Neural Comput., 9(8):1735–1780.
- Howcroft et al. (2020) David M. Howcroft, Anya Belz, Miruna-Adriana Clinciu, Dimitra Gkatzia, Sadid A. Hasan, Saad Mahamood, Simon Mille, Emiel van Miltenburg, Sashank Santhanam, and Verena Rieser. 2020. Twenty years of confusion in human evaluation: NLG needs evaluation sheets and standardised definitions. In Proceedings of the 13th International Conference on Natural Language Generation, pages 169–182, Dublin, Ireland. Association for Computational Linguistics.
- Humeau et al. (2019) Samuel Humeau, Kurt Shuster, Marie-Anne Lachaux, and Jason Weston. 2019. Poly-encoders: Transformer architectures and pre-training strategies for fast and accurate multi-sentence scoring. CoRR, abs/1905.01969.
- Lasecki et al. (2014) Walter S. Lasecki, Jaime Teevan, and Ece Kamar. 2014. Information extraction and manipulation threats in crowd-powered systems. In Proceedings of the 17th ACM Conference on Computer Supported Cooperative Work & Social Computing, CSCW ’14, page 248–256, New York, NY, USA. Association for Computing Machinery.
- Li et al. (2019) Margaret Li, Jason Weston, and Stephen Roller. 2019. Acute-eval: Improved dialogue evaluation with optimized questions and multi-turn comparisons. arXiv preprint arXiv:1909.03087.
- Lin and Hovy (2003) Chin-Yew Lin and Eduard Hovy. 2003. Automatic evaluation of summaries using n-gram co-occurrence statistics. In Proceedings of the 2003 Conference of the North American Chapter of the Association for Computational Linguistics on Human Language Technology-Volume 1, pages 71–78. Association for Computational Linguistics.
- Liu et al. (2013) Qiang Liu, Alexander T Ihler, and Mark Steyvers. 2013. Scoring workers in crowdsourcing: How many control questions are enough? In Advances in Neural Information Processing Systems, volume 26. Curran Associates, Inc.
- Liu et al. (2019) Yinhan Liu, Myle Ott, Naman Goyal, Jingfei Du, Mandar Joshi, Danqi Chen, Omer Levy, Mike Lewis, Luke Zettlemoyer, and Veselin Stoyanov. 2019. Roberta: A robustly optimized BERT pretraining approach. CoRR, abs/1907.11692.
- Loukina et al. (2020) Anastassia Loukina, Nitin Madnani, Aoife Cahill, Lili Yao, Matthew S. Johnson, Brian Riordan, and Daniel F. McCaffrey. 2020. Using PRMSE to evaluate automated scoring systems in the presence of label noise. In Proceedings of the Fifteenth Workshop on Innovative Use of NLP for Building Educational Applications, pages 18–29, Seattle, WA, USA → Online. Association for Computational Linguistics.
- Mehri and Eskenazi (2020a) Shikib Mehri and Maxine Eskenazi. 2020a. Unsupervised evaluation of interactive dialog with DialoGPT. In Proceedings of the 21th Annual Meeting of the Special Interest Group on Discourse and Dialogue, pages 225–235, 1st virtual meeting. Association for Computational Linguistics.
- Mehri and Eskenazi (2020b) Shikib Mehri and Maxine Eskenazi. 2020b. USR: An unsupervised and reference free evaluation metric for dialog generation. In Proceedings of the 58th Annual Meeting of the Association for Computational Linguistics, pages 681–707, Online. Association for Computational Linguistics.
- Mille et al. (2020) Simon Mille, Anya Belz, Bernd Bohnet, Thiago Castro Ferreira, Yvette Graham, and Leo Wanner. 2020. The third multilingual surface realisation shared task (SR’20): Overview and evaluation results. In Proceedings of the Third Workshop on Multilingual Surface Realisation, pages 1–20, Barcelona, Spain (Online). Association for Computational Linguistics.
- Miller et al. (2016) Alexander H. Miller, Adam Fisch, Jesse Dodge, Amir-Hossein Karimi, Antoine Bordes, and Jason Weston. 2016. Key-value memory networks for directly reading documents. CoRR, abs/1606.03126.
- Novikova et al. (2018) Jekaterina Novikova, Ondřej Dušek, and Verena Rieser. 2018. RankME: Reliable human ratings for natural language generation. In Proceedings of the 2018 Conference of the North American Chapter of the Association for Computational Linguistics: Human Language Technologies, Volume 2 (Short Papers), pages 72–78, New Orleans, Louisiana. Association for Computational Linguistics.
- Pang et al. (2020) Bo Pang, Erik Nijkamp, Wenjuan Han, Linqi Zhou, Yixian Liu, and Kewei Tu. 2020. Towards holistic and automatic evaluation of open-domain dialogue generation. In Proceedings of the 58th Annual Meeting of the Association for Computational Linguistics, pages 3619–3629, Online. Association for Computational Linguistics.
- Papineni et al. (2002) Kishore Papineni, Salim Roukos, Todd Ward, and Wei-Jing Zhu. 2002. Bleu: A method for automatic evaluation of machine translation. In Proceedings of the 40th Annual Meeting on Association for Computational Linguistics, ACL ’02, pages 311–318, Stroudsburg, PA, USA. Association for Computational Linguistics.
- Ram et al. (2018) Ashwin Ram, Rohit Prasad, Chandra Khatri, Anu Venkatesh, Raefer Gabriel, Qing Liu, Jeff Nunn, Behnam Hedayatnia, Ming Cheng, Ashish Nagar, Eric King, Kate Bland, Amanda Wartick, Yi Pan, Han Song, Sk Jayadevan, Gene Hwang, and Art Pettigrue. 2018. Conversational AI: the science behind the alexa prize. CoRR, abs/1801.03604.
- Santhanam et al. (2020) Sashank Santhanam, Alireza Karduni, and Samira Shaikh. 2020. Studying the effects of cognitive biases in evaluation of conversational agents. In Proceedings of the 2020 CHI Conference on Human Factors in Computing Systems, pages 1–13.
- Santhanam and Shaikh (2019) Sashank Santhanam and Samira Shaikh. 2019. Towards best experiment design for evaluating dialogue system output. In Proceedings of the 12th International Conference on Natural Language Generation, pages 88–94, Tokyo, Japan. Association for Computational Linguistics.
- Sorodoc et al. (2017) Ionut Sorodoc, Jey Han Lau, Nikolaos Aletras, and Timothy Baldwin. 2017. Multimodal topic labelling. In Proceedings of the 15th Conference of the European Chapter of the Association for Computational Linguistics: Volume 2, Short Papers, pages 701–706, Valencia, Spain. Association for Computational Linguistics.
- Sutskever et al. (2014) Ilya Sutskever, Oriol Vinyals, and Quoc V. Le. 2014. Sequence to sequence learning with neural networks. In Proceedings of the 27th International Conference on Neural Information Processing Systems - Volume 2, NIPS’14, page 3104–3112, Cambridge, MA, USA. MIT Press.
- Wu et al. (2016) Yonghui Wu, Mike Schuster, Zhifeng Chen, Quoc V. Le, Mohammad Norouzi, Wolfgang Macherey, Maxim Krikun, Yuan Cao, Qin Gao, Klaus Macherey, Jeff Klingner, Apurva Shah, Melvin Johnson, Xiaobing Liu, Lukasz Kaiser, Stephan Gouws, Yoshikiyo Kato, Taku Kudo, Hideto Kazawa, Keith Stevens, George Kurian, Nishant Patil, Wei Wang, Cliff Young, Jason Smith, Jason Riesa, Alex Rudnick, Oriol Vinyals, Greg Corrado, Macduff Hughes, and Jeffrey Dean. 2016. Google’s neural machine translation system: Bridging the gap between human and machine translation. CoRR, abs/1609.08144.
- Zhang et al. (2020) Yizhe Zhang, Siqi Sun, Michel Galley, Yen-Chun Chen, Chris Brockett, Xiang Gao, Jianfeng Gao, Jingjing Liu, and Bill Dolan. 2020. DIALOGPT : Large-scale generative pre-training for conversational response generation. In Proceedings of the 58th Annual Meeting of the Association for Computational Linguistics: System Demonstrations, pages 270–278, Online. Association for Computational Linguistics.
Appendix A Appendix
A.1 Further Details of Meaning Distortion Degradation Procedure
To distort the meaning of responses in our quality control degraded performance model, a sequence of words of length is firstly selected from the response of length and replaced with a distinct sequence of words, also of length randomly selected from a distinct dialogue in the training set. Note that the position of the word sequence to be replaced is additionally random with the exception of response of length , the sequence of replaced words does not include the response initial or final words:
-
•
for : is 1 word;
-
•
for , is 2 words;
-
•
for , is 3 words;
-
•
for , is 4 words;
-
•
for , is 5 words;
-
•
for , is words.
A.2 Worker Payment
Each workers was paid 0.99 USD per hit consisting of 6 conversations. The total cost of one run of our evaluation did not exceed 250 USD, or 25 USD per model. Note that the quality control method we applied for removing unreliable data is not the criteria for deciding worker payment. A worker whose data is filtered out can still get paid.
A.3 Automatic Metrics
| Positive | Negative | |
| Interesting | Wow that is really interesting. | That’s not very interesting. |
| That’s really interesting! | That’s really boring. | |
| Cool! That sounds super interesting. | That was a really boring response. | |
| Fun | Wow that is very fun. | That’s not very fun. |
| Chat with you is enjoyable. | I am not having fun. | |
| You are fun. | ||
| Consistent | - | That’s not what you said earlier! |
| Stop contradicting yourself! | ||
| Fluent | That makes sense! | Is that real English? |
| You have a good point. | I’m so confused right now! | |
| That makes no sense! | ||
| Topic | - | Stop changing the topic so much. |
| Don’t change the topic! | ||
| Robotic | - | You are robot. |
| You do not sound like a person. | ||
| Repetitive | - | Stop saying the same thing repeatedly. |
| Why are you repeating yourself? | ||
| Stop repeating yourself! |
A.4 Additional Experiment Details and Results
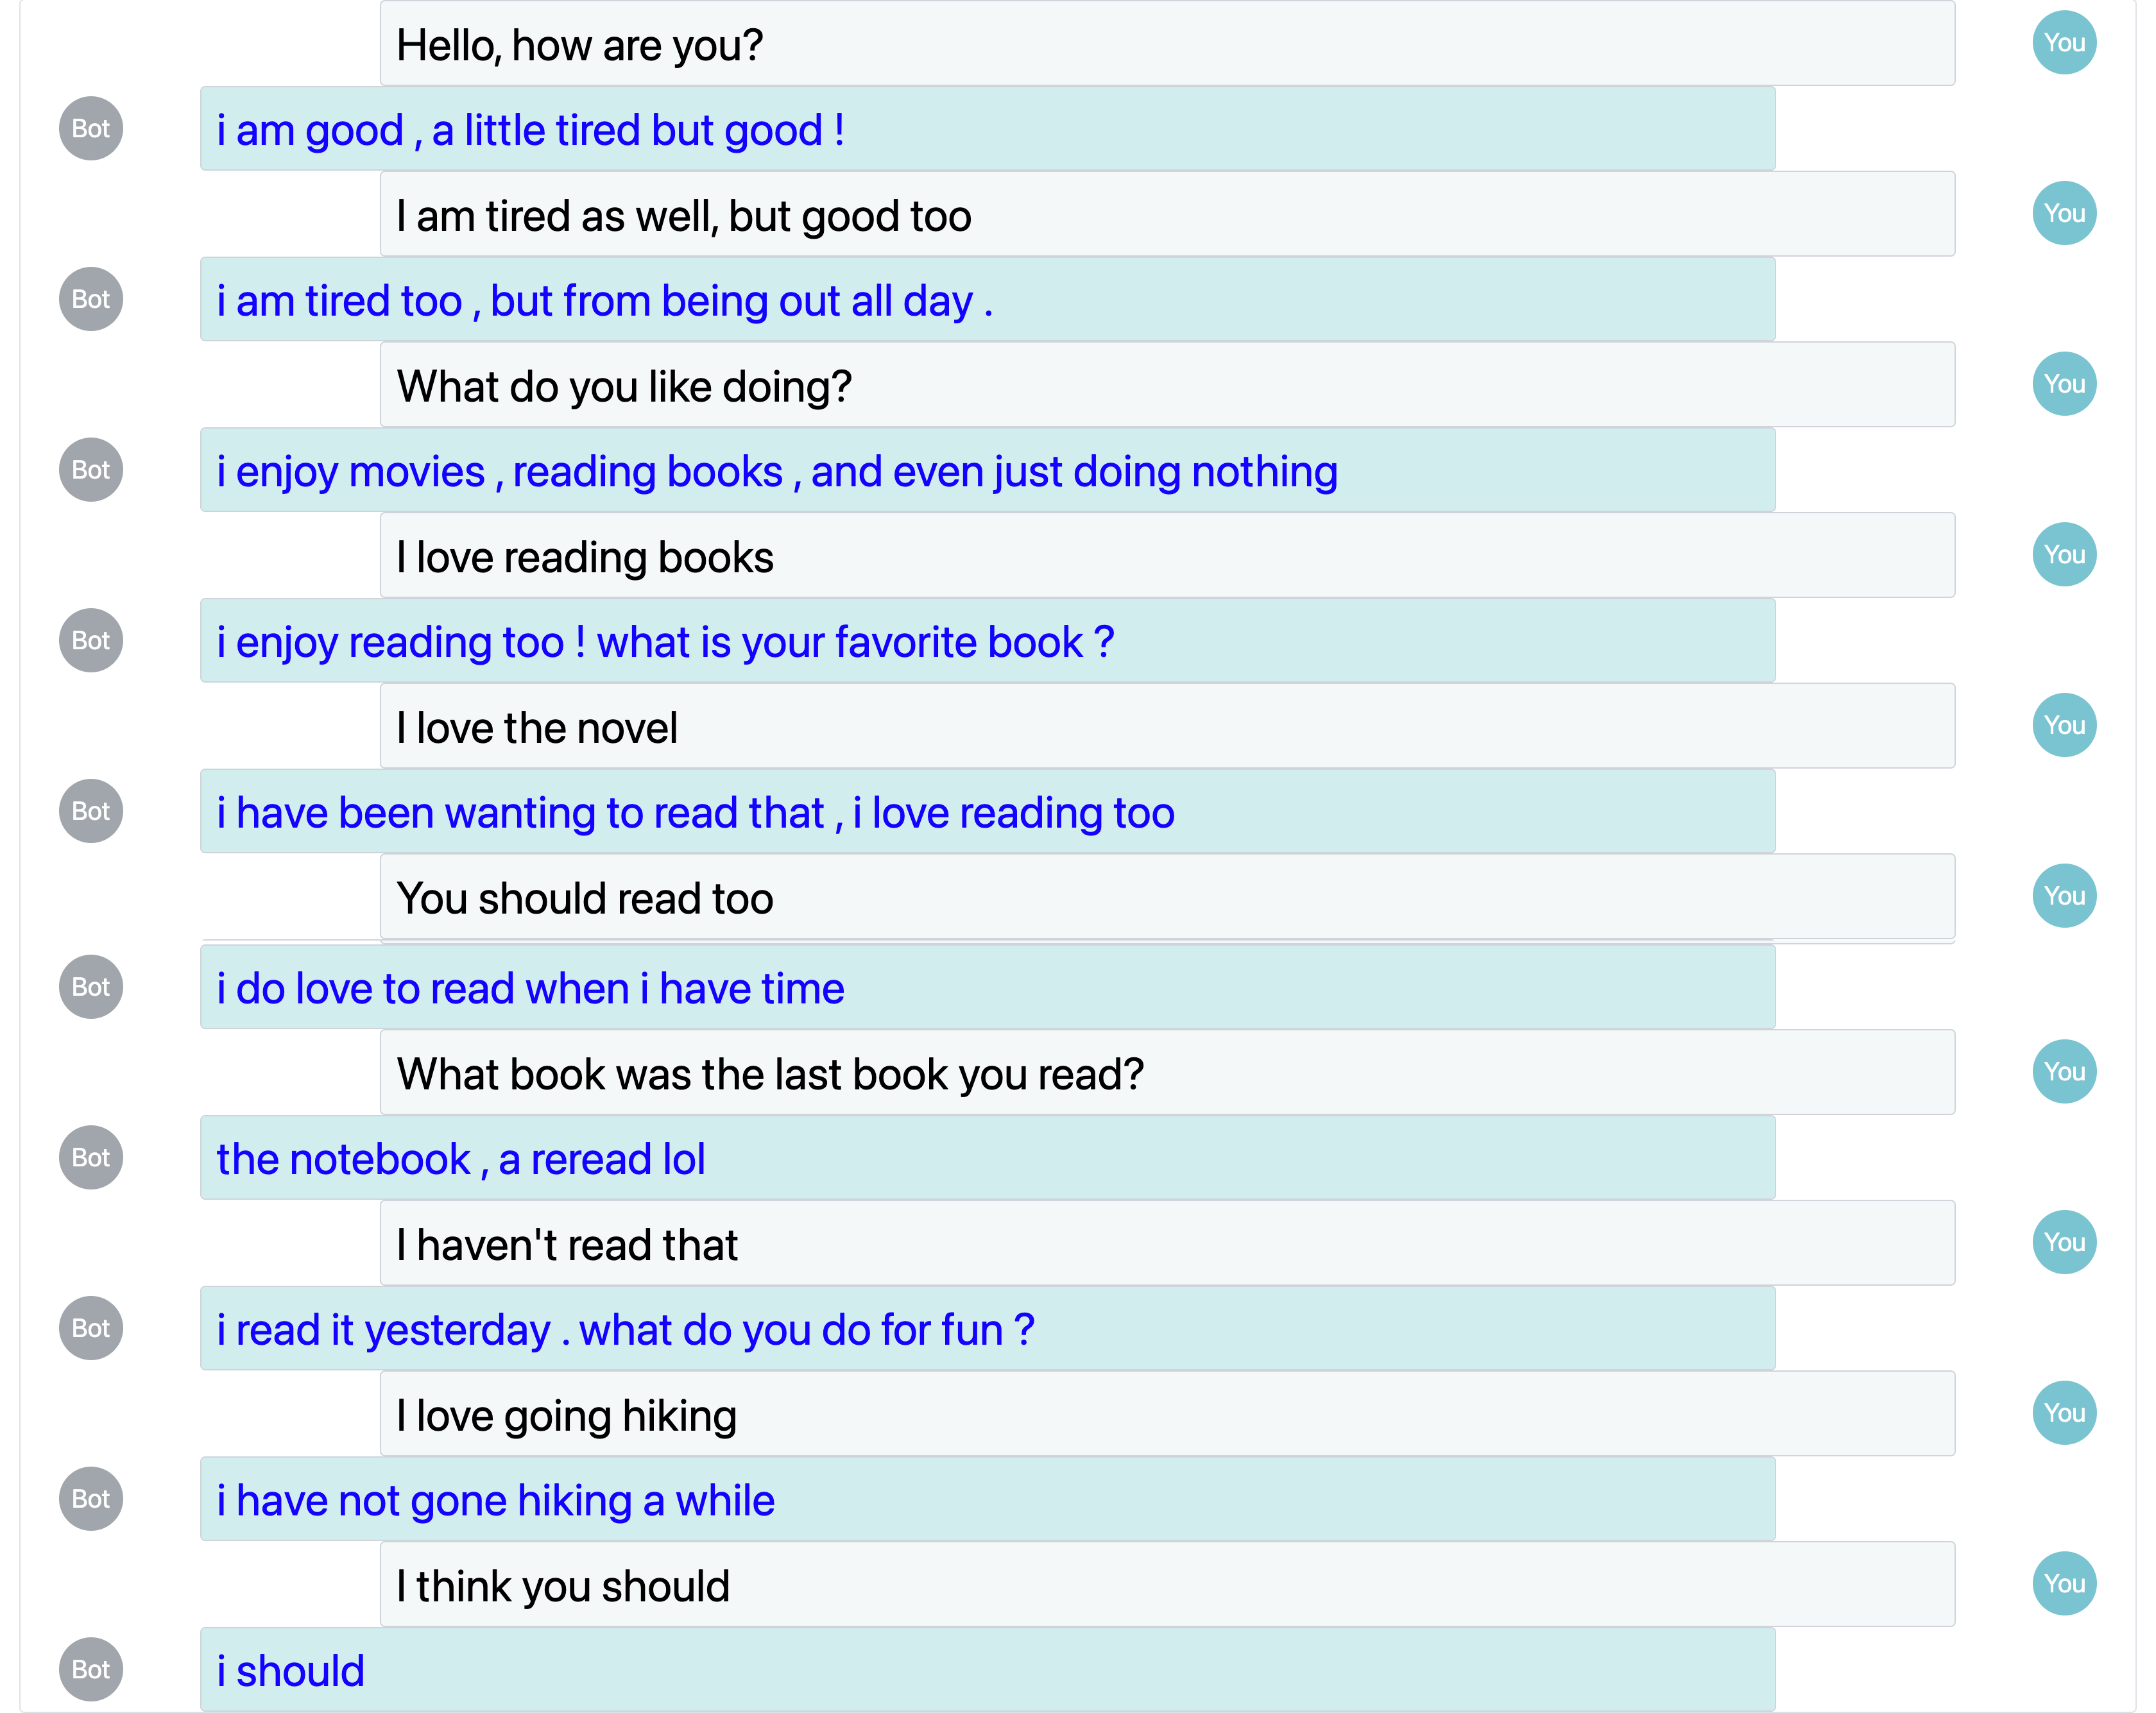
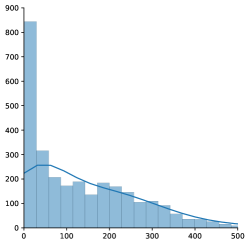
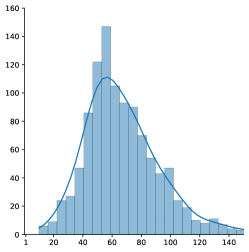
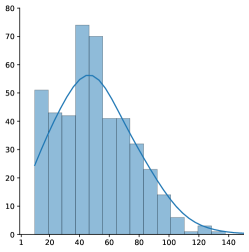
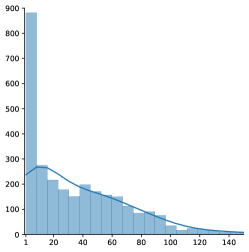
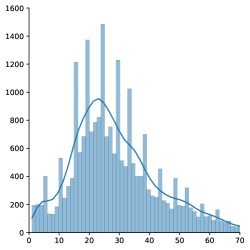
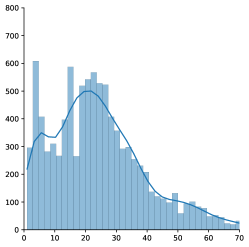
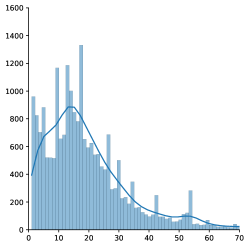
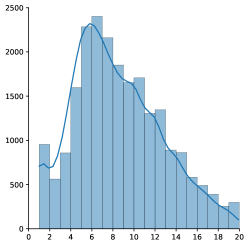
We additionally provide a comparison of conversations collected in our live human evaluation and that of ConvAI2 in Figures 8, 9, 10, and 11, as well as median number of words and characters for conversations and inputs in Table 12 , showing how challenges reported in the ConvAI2 live evaluation with respect to workers producing very short conversations are overcome by our quality control technique.
| Normal | Degraded \bigstrut | ||
| User: | Hello, how are you? | User: | How are you? \bigstrut[t] |
| Bot: | i am good , a little tired but good ! | Bot: | I do not have a job. I have broken have a job. |
| User: | I am tired as well, but good too | User: | Sorry about that? |
| Bot: | i am tired too , but from being out all day . | Bot: | Thanks. I the love watching old. |
| User: | What do you like doing? | User: | Tell me about it? |
| Bot: | i enjoy movies , reading books , and even just doing nothing | Bot: | that is cool, do you i supposed to I you travel? |
| User: | I love reading books | User: | I do not like travelling |
| Bot: | i enjoy reading too ! what is your favorite book ? | Bot: | I teach meet you, sorryy elementary school. |
| User: | I love the novel "voice of the heart" | User: | Okay, do you like to swim? |
| Bot: | i have been wanting to read that , i love reading too | Bot: | do you live sports are u skin am in a house. |
| User: | You should read too | User: | I love sports, especially soccer |
| Bot: | i do love to read when i have time | Bot: | I like but ishuold go, books |
| User: | What book was the last book you read? | User: | How often do you read? |
| Bot: | the notebook , a reread lol | Bot: | i are your think u r i am a pilot , so i do not have much time . |
| User: | I haven’t read that | User: | I envy you, I would love to be a pilot |
| Bot: | i read it yesterday . what do you do for fun ? | Bot: | I i am 4 felicia! |
| User: | I love going hiking | User: | I am Ben |
| Bot: | i have not gone hiking a while | Bot: | Oh, how nice. do you do for you have? |
| User: | I think you should | User: | I do not understand |
| Bot: | i should | Bot: | I is your favorite don’t I am sure you will find out soon. \bigstrut[b] |
| 1. | Your task is to have 6 conversations with a chatbot, and a different chatbot will talk to you in each conversation. \bigstrut[t] |
| 2. | Before each conversation, you should think of a topic to talk about with the chatbot (your choice of topic). You will be asked to enter this topic before the conversation starts. |
| 3. | The current topic will be displayed to you throughout the conversation. |
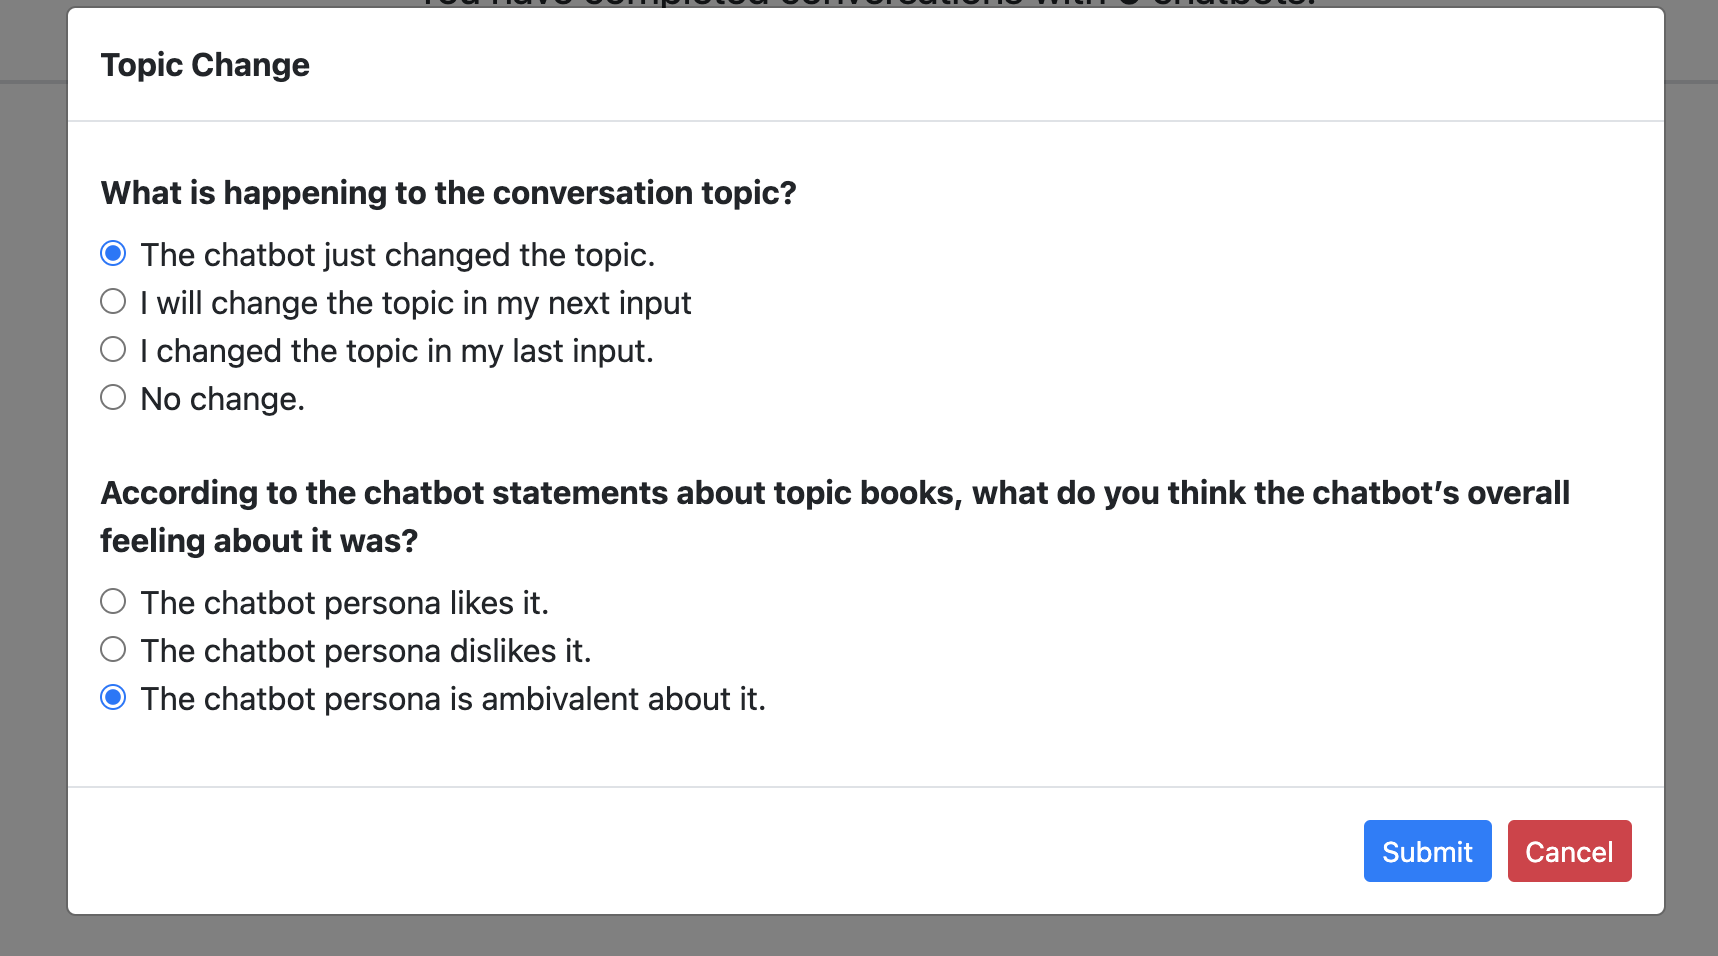
| 4. | If the chatbot changes the topic to a new one, you should record this by updating the conversation topic using the Topic button (bottom left). |
| 5. | You are also allowed to change the topic, you should use the same button to do this (bottom left). |
| 6. | At the end of each conversation, you should tell us what you think about the chatbot. |
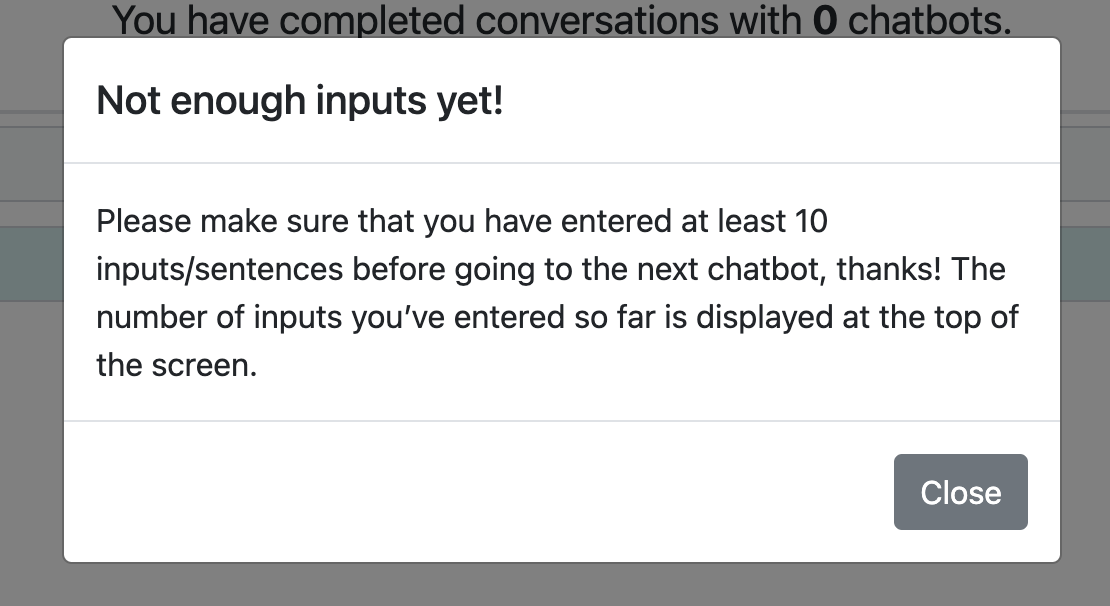
| 7. | In each conversation, you should type in a minimum of 10 inputs/sentences. |
| 8. | The purpose of these HITs where you will generate conversations with chatbots is to test how realistic their conversations are with users. In order for your data to be useful to us we require that your half of the conversation is also realistic. For example, your data will not be useful to us if you do the following: |
| User: Hi | |
| Bot: Hi | |
| User: Hi | |
| Bot: Hi | |
| .. and so on. | |
| 9. | Another example, if you are too repetitive or your responses are not appropriate given what the chatbot has just said, this will not be a useful test for them. For example, the following conversation is not ok: |
| User: Hi | |
| Bot: Hi | |
| User: wow (not appropriate response) | |
| Bot: I saw a good movie last night | |
| User: wow (repetitive) | |
| Bot: Do you like football? | |
| User: I have two children and one dog. (not appropriate response) | |
| .. and so on. | |
| 10. | We need realistic conversations, so please do your best to talk to the bot as if the bot was another person you actually want to talk to. Obvious attempts to game the process and ones that don’t make a real effort will unfortunately be rejected. |
| 11. | The chatbot may take a few seconds to respond, please be patient. |
| 12. | Please use Chrome and avoid special symbols if possible. |
| 13. | There is a feedback box at the end of the HIT. If you encounter any problems, please enter them in this box or email our MTurk account. \bigstrut[b] |
| Overall | Interesting | Fun | Consistent | Fluent | Topic | Robotic | Repetitive \bigstrut | |
| Overall | - | 0.959 | 0.976 | 0.861 | 0.966 | 0.796 | 0.916 | 0.674 \bigstrut[t] |
| Interesting | 0.927 | - | 0.992 | 0.691 | 0.949 | 0.599 | 0.875 | 0.840 |
| Fun | 0.903 | 0.988 | - | 0.753 | 0.961 | 0.660 | 0.889 | 0.783 |
| Consistent | 0.842 | 0.673 | 0.636 | - | 0.811 | 0.969 | 0.770 | 0.210 |
| Fluent | 0.879 | 0.939 | 0.915 | 0.648 | - | 0.724 | 0.857 | 0.667 |
| Topic | 0.745 | 0.552 | 0.503 | 0.915 | 0.503 | - | 0.676 | 0.122 |
| Robotic | 0.867 | 0.830 | 0.782 | 0.648 | 0.867 | 0.491 | - | 0.642 |
| Repetitive | 0.673 | 0.770 | 0.782 | 0.261 | 0.770 | 0.055 | 0.758 | - \bigstrut[b] |
|
Model |
Overall |
Interesting |
Fun |
Consistent |
Fluent |
Topic |
Robotic |
Repetitive |
||
| Free Run 2 | A | 623 | 0.455 | 0.635 | 0.629 | 0.728 | 0.924 | 0.922 | 0.443 | 0.212 |
| Ap | 539 | 0.423 | 0.747 | 0.763 | 0.555 | 0.728 | 0.474 | 0.348 | 0.040 | |
| B | 553 | 0.344 | 0.464 | 0.407 | 0.554 | 0.763 | 0.822 | 0.338 | 0.266 | |
| Bp | 630 | 0.260 | 0.464 | 0.372 | 0.560 | 0.581 | 0.496 | 0.412 | 0.238 | |
| C | 539 | 0.245 | 0.576 | 0.492 | 0.229 | 0.585 | 0.043 | 0.545 | 0.337 | |
| Cp | 609 | 0.154 | 0.453 | 0.390 | 0.027 | 0.544 | 0.200 | 0.515 | 0.382 | |
| D | 595 | 0.002 | 0.009 | 0.064 | 0.389 | 0.282 | 0.656 | 0.720 | 0.541 | |
| E | 567 | 0.202 | 0.063 | 0.044 | 0.075 | 0.300 | 0.346 | 0.646 | 0.539 | |
| Ep | 511 | 0.218 | 0.152 | 0.143 | 0.043 | 0.426 | 0.352 | 0.702 | 0.646 | |
| Dp | 679 | 0.258 | 0.285 | 0.304 | 0.033 | 0.209 | 0.226 | 0.550 | 0.683 | |
| 0.969 | 0.952 | 0.927 | 0.899 | 0.960 | 0.951 | 0.646 | 0.936 \bigstrut[t] | |||
|
Model |
Overall |
Interesting |
Fun |
Consistent |
Fluent |
Topic |
Robotic |
Repetitive |
|||
| Free run 1 | A | 798 | 52.49 | 53.03 | 54.07 | 58.12 | 61.78 | 65.24 | 35.73 | 39.47 | |
| B | 798 | 50.41 | 51.39 | 51.68 | 56.37 | 64.50 | 67.84 | 25.63 | 35.45 | ||
| Ap | 707 | 45.53 | 47.38 | 46.23 | 48.52 | 60.17 | 47.50 | 28.30 | 40.62 | ||
| C | 791 | 43.96 | 50.50 | 47.53 | 35.85 | 55.73 | 33.98 | 27.35 | 56.76 | ||
| Cp | 714 | 41.21 | 47.13 | 46.26 | 39.25 | 55.05 | 32.07 | 21.85 | 46.84 | ||
| Bp | 707 | 39.93 | 41.35 | 40.06 | 44.93 | 53.74 | 43.72 | 25.25 | 30.49 | ||
| D | 707 | 33.71 | 30.28 | 29.95 | 41.72 | 45.92 | 49.07 | 17.30 | 21.72 | ||
| Dp | 798 | 29.38 | 26.19 | 27.97 | 37.53 | 44.19 | 35.26 | 17.46 | 17.06 | ||
| E | 742 | 28.99 | 30.75 | 30.65 | 31.27 | 46.42 | 23.60 | 15.10 | 25.13 | ||
| Ep | 763 | 28.65 | 29.34 | 28.50 | 29.13 | 47.07 | 21.30 | 17.82 | 27.41 | ||
| Free Run 2 | A | 623 | 51.67 | 56.62 | 56.27 | 59.21 | 64.69 | 64.04 | 27.11 | 33.74 | |
| B | 539 | 49.07 | 52.42 | 50.66 | 54.88 | 60.86 | 63.73 | 29.57 | 31.38 | ||
| Ap | 553 | 50.56 | 59.95 | 60.23 | 54.28 | 60.61 | 52.06 | 27.59 | 39.22 | ||
| C | 630 | 45.87 | 55.60 | 53.02 | 45.16 | 54.70 | 38.72 | 24.40 | 49.50 | ||
| Cp | 539 | 42.27 | 51.19 | 49.61 | 37.90 | 54.17 | 30.42 | 22.74 | 49.84 | ||
| Bp | 609 | 46.71 | 51.92 | 49.95 | 54.62 | 56.01 | 52.85 | 28.48 | 33.10 | ||
| D | 595 | 38.17 | 38.31 | 35.39 | 50.99 | 46.38 | 57.94 | 16.09 | 22.08 | ||
| Dp | 567 | 30.89 | 31.07 | 30.37 | 38.37 | 44.64 | 31.47 | 21.85 | 18.48 | ||
| E | 679 | 31.70 | 35.67 | 36.32 | 35.26 | 46.91 | 26.79 | 18.98 | 21.99 | ||
| Ep | 511 | 31.66 | 33.63 | 33.26 | 38.77 | 51.53 | 26.99 | 17.63 | 19.79 | ||
| 0.959 | 0.947 | 0.919 | 0.880 | 0.951 | 0.951 | 0.783 | 0.945 \bigstrut[t] | ||||
|
Model |
Overall |
Interesting |
Fun |
Consistent |
Fluent |
Topic |
Robotic |
Repetitive |
|||
| Ice-breaker | A | 721 | 53.43 | 53.65 | 52.35 | 63.24 | 67.28 | 66.97 | 28.17 | 42.32 | |
| Ap | 721 | 50.21 | 54.53 | 53.50 | 52.84 | 58.83 | 53.18 | 38.87 | 39.70 | ||
| B | 742 | 49.55 | 49.23 | 47.76 | 57.79 | 60.64 | 62.22 | 32.56 | 36.65 | ||
| C | 784 | 47.93 | 56.18 | 53.69 | 43.15 | 56.88 | 40.46 | 29.61 | 55.54 | ||
| Bp | 700 | 44.94 | 48.83 | 46.70 | 49.58 | 55.86 | 49.21 | 25.82 | 38.61 | ||
| Cp | 658 | 42.41 | 47.98 | 45.48 | 37.66 | 54.51 | 32.50 | 26.00 | 52.72 | ||
| D | 728 | 35.14 | 30.32 | 33.13 | 42.90 | 49.92 | 48.51 | 20.11 | 21.09 | ||
| Ep | 721 | 31.58 | 31.73 | 30.82 | 35.44 | 47.12 | 27.06 | 21.90 | 26.97 | ||
| E | 721 | 30.09 | 33.17 | 31.95 | 31.14 | 47.12 | 24.90 | 19.10 | 23.23 | ||
| Dp | 714 | 27.22 | 22.56 | 22.53 | 35.22 | 41.70 | 34.98 | 17.44 | 16.09 | ||
| 0.970 | 0.955 | 0.918 | 0.949 | 0.928 | 0.972 | 0.738 | 0.968 \bigstrut[t] | ||||
| # conversations | |||
 |
 |
 |
|
| # characters | # characters | # characters | |
| (a) Pass Quality Control | (b) Fail Quality Control | (c) ConvAI2 Live |
| # conversations | |||
 |
 |
 |
|
| # words | # words | # words | |
| (a) Pass Quality Control | (b) Fail Quality Control | (c) ConvAI2 Live |
| # inputs | |||
 |
 |
 |
|
| # characters | # characters | # characters | |
| (a) Pass Quality Control | (b) Fail Quality Control | (c) ConvAI2 Live |
| # inputs | |||
 |
 |
 |
|
| # words | # words | # words | |
| (a) Pass Quality Control | (b) Fail Quality Control | (c) ConvAI2 Live |
| Passed QC | Failed QC | ConvAI2 | ||
| Characters | Median in an Input | 27 | 22 | 16 |
| Median in a Conversation | 249 | 188 | 105 | |
| Words | Median in an Input | 8 | 6 | 4 |
| Median in a Conversation | 63 | 48 | 28 |
A.5 User Interface
Figure 12, 13,15, 16 and 17 introduce the User Interfaces we designed in the experiment of our human evaluation method. In addition, Figure 18 provides an example of live chat between a worker and a chatbot.