∎
77email: quoc@khu.ac.kr
T.-D.Nguyen
77email: ntiendung@khu.ac.kr
V.-N.Pham
77email: nampv@khu.ac.kr
X.-Q.Pham
77email: pxuanqui@khu.ac.kr
Q.-T.Ngo
77email: nqthai@khu.ac.kr
E.-N.Huh
77email: johnhuh@khu.ac.kr
An Efficient Video Streaming Architecture with QoS Control for Virtual Desktop Infrastructure in Cloud Computing
Abstract
In virtual desktop infrastructure (VDI) environments, the remote display protocol has a big responsibility: to transmit video data from a data center-hosted desktop to the endpoint. The protocol must ensure a high level of client-perceived end-to-end quality of service (QoS) under heavy load conditions. Each remote display protocol works differently depending on the network and which applications are being delivered. In health care applications, doctors and nurses can use mobile devices directly to monitor patients. Moreover, the ability to implement tasks requiring high consumption of CPU and other resources is applicable to a variety of applications including research and cloud gaming. Such computer games and complex processes will run on powerful cloud servers and the screen contents will be transmitted to the client. To enable such applications, remote display technology requires further enhancements to meet more stringent requirements on bandwidth and QoS, and to allow real-time operation. In this paper, we present an architecture including flexible QoS control to improve the users’ quality of experience (QoE). The QoS control includes linear regression modeling of historical network data as a means to consider the network condition. Additionally, the architecture includes a novel compression algorithm of 2D images, designed to guarantee the best image quality and to reduce video delay; this algorithm is based on k-means clustering and can satisfy the requirements of real-time onboard processing. Through simulations with a real-world dataset collected by the MIT Computer Science and Artificial Intelligence Lab, we represent experimental as well as explain the performance of QoS system.
Keywords:
Video streaming Mobile thin-client K-means clustering Quality of service Remote protocol Cloud computing1 Introduction
Cloud computing has become a hot topic in todays world, largely due to the flexible and cost savings it can deliver. In the same manner as with visualization, cloud computing implementations started with server infrastructure and has moved to the desktop; the cloud is now ripe for desktop infrastructure. By moving desktops to the cloud rather than an internally deployed and managed VDI solution in a data center, businesses can realise all of the promised benefits of virtual desktops healthcare_system . Furthermore, the Internet has rapidly emerged as a mechanism for users to find and retrieve content, originally for webpages and recently for streaming media. Moreover, mobile phones and tablets or any thin client devices can run powerful applications from anywhere and at any time via the cloud. Therefore, there are a lot of case studies needed to transmit data from the virtual desktop in the data cloud center to the screen endpoints.
There are several ideas for deployment in real life. In health care, while the doctors tired all the time to check a patient’s status frequently, included their heart rate or other medical signs read by specialized equipment. With VDI solutions, a patient can get convenient health care from the comfort of their own home. This allows doctors to quickly and conveniently make such information available remotely on the mobile devices which are connected to a server by using a remote desktop protocol healthcare_system . Moreover, VDI helps save valuable time and satisfies the demand for personal control, while also reducing the cost of long-term medical care by avoiding waste of human resources on manual processing personal_cost . Because any mistakes is always leading cause of death, so new developments in health care are of considerable interest. Computer gaming is a very different application where remote display technology will also be useful. Gamers spent a lot of money on computer games, hardware, and accessories. Traditionally, computer games are delivered either in boxes or via Internet downloads. These games have to install the computer games on physical machines to play them. The installation process becomes extremely tedious because the games are too complicated and the computer hardware and system software are very fragmented. Take Blizzard’s Star-craft II as example, it may take more than an hour to install it on an i5 PC, and another hour to apply the online patches. Furthermore, gamers may find their computers are not powerful enough to enable all the visual effects yet achieve high frame rates. So, gamers have to repeatedly upgrade their computers so as to play the latest computer games. Hence, cloud gaming is a better way to deliver high-quality gaming experience and opens new business opportunity cloud_gaming . In a cloud gaming system, computer games run on powerful cloud servers and streaming video data to thin clients by using remote protocols thinclient_gaming . The thin clients are light-weight and can be ported to resource-constrained platforms, such as mobile devices and TV set-top boxes. With cloud gaming, the key benefit is that gamers can play the latest computer games anywhere and anytime, while the game developers can optimize their games for a specific PC configuration. Laboratory research is another excellent potential application for cloud-based remote display technology. By using remote desktop protocols, researchers perform complex tasks requiring intensive computation resources or specialized software. In addition to these example applications, there are other fields in which using remote display protocols would be useful for transmitting screen data from a cloud server to a client.
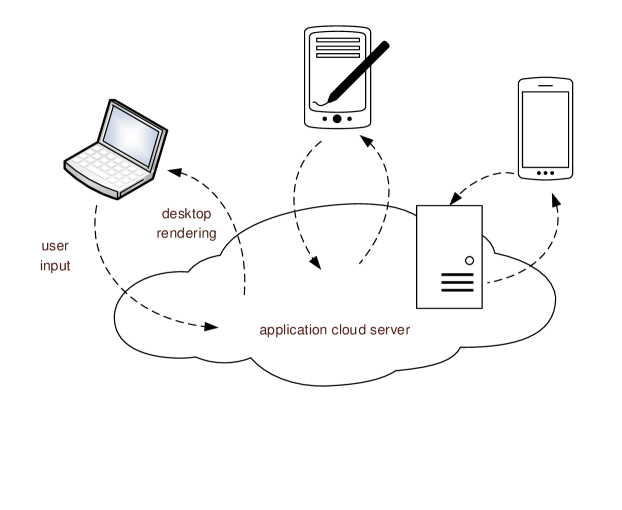
However, in the past there have been several challenges with deploying VDI. Main problems included the network condition, server overload, bandwidth and limitation of mobile device (hardware resource, storage, battery life time). Specifically, a client sends an input event request to a server, the sever receives and deploys several offloading computing tasks, then renders screen image, encodes, and finally transfers the results to the client (as shown in Fig 1). These graphical images will be decoded and displayed on the client side. Therefore, it is so importance to guarantee client-perceived end-to-end quality of service. We can summarize several important factors to measure performance of the system:
-
•
Network condition: latency and bandwidth utilization. Latency should be as small as possible. Furthermore, with many different bandwidth quotas, users always want to get the highest acceptable performance.
-
•
Hardware resource consumption: CPU has a critical meaning in the processing because the limited hardware resource of the client device and overhead consumption on the server.
-
•
User demands: Cross-platform adaptation because it is a great convenience for users who use many kinds of devices such as laptop, smart phone, tablet, etc. with different operating systems.
Above factors directly affect QoE (Quality of Experience) that user perceives in each request which is made from local desktop, where claims for more high fidelity of display. Many solutions have been developed and reported for improving QoE in content delivery networks; typically, solutions include hardware and software improvements. The general idea is that whatever graphical elements are painted to the screen on the host and then scraped by the protocol interface, are sent down to the client. This can happen in two ways:
- •
- •
In this paper, to avoid these above problems we present an architecture with flexible QoS control based on network condition analysis to improve users’ QoE. We carefully establish the best compression parameters based on statistical analysis of historical data on network conditions. Moreover, to improve the real-time video streaming quality we develop a novel compression algorithm for 2D images, based on k-means clustering. The contributions of this work can be summarized as follows:
-
1.
We develop a novel image compression algorithm based on k-means clustering which can be applied in real-world case studies.
-
2.
We present an efficient architecture including QoS control based on analysis of historical data to account for network conditions. This system applies multiple linear regression to make optimal decisions for the QoS policy.
We evaluate the proposed image compression algorithm by means of simulations in Matlab, using as input a dataset of real images collected by the MIT Computer Science and Artificial Intelligence Lab image_dataset . We demonstrate the QoS control system in a testbed cloud environment and analyze its performance.
The rest of this paper is organized as follows. Related work is reviewed in Section 2. Section 3 gives an image compression algorithm based on the k-means algorithm. Section 4 suggests an architecture to dynamically modify the compression rate of a video stream based on historical data of the recipients bandwidth. Section 5 describes experiments with the proposed QoS control and evaluates its performance. Finally, Section 6 gives conclusions.
2 Related Work
Popular remote display protocols offer high-resolution sessions, multimedia stream remoting, multi-monitor support, dynamic object compression, USB redirection, drive mapping and more. Microsoft Remote Desktop Protocol (RDP), VMwares PC-over-IP (PCoIP) and Citrixs HDX are the most com- monly used, but there are other protocols from companies such as Ericom and Hewlett-Packard. Teradici sells hardware solutions based on PCoIP technology pcoip and the Thin Client Internet Computing protocol is also applicable for remote displays thinc . But these protocols still have drawbacks; great performance requires a lot of bandwidth and energy, which can clog the network energy_solution . Plus, if the system is running with low CPU usage, protocols will hog bandwidth and weaken end user performance. So, an efficient system needs to cope with unstable network conditions, to operate in real time, and to satisfy the users’ demands. Almost all of these protocols have the disadvantages that they do not consider the network environment and are inconvenient to use with real-time applications such as video playback. Previous work has included the development of an adaptive encoding application to solve display performance problems encountered when using RDP related1 . The authors of another work have described problems that arise in the case of video conferencing and have developed a real-time camera control system to address the problems related2 .
To reduce the size of images transferred over the network to improve video streaming quality, compression technology has been one of the most important contributions. Some encoding and decoding formats such as motion MPEG related3 , related5 and H.264 AVC related4 , related6 have been developed in hybrid remote display protocol. The challenges for compressing images have been summarized previously related7 . Various compression techniques have been developed for image compression image_compression1 , image_compression2 .
In this work, we focus on the k-means clustering for encoding the image data. This method is probably the most popular technique of representative-based clustering. Cluster analysis clustering is a major data analysis method that is widely used for many practical applications in emerging areas. Clustering is the process of partitioning a given set of objects into disjoint clusters. This is done in such a way that objects in the same cluster are similar whereas objects belonging to different clusters differ considerably with respect to their attributes k_means_ . The k-means algorithm kmeans1 , kmeans2 is effective in producing clusters for many practical applications. But the original k-means algorithm is very computationally complex, especially for large data sets. Moreover, this algorithm yields different clusters depending on the random choice of initial centroids. For example, previous work has included the description of a 2D image compression scheme using k-means in a real-time multiprocessor system kmean_compression1 . Another work presented a novel k-means algorithm for compressing images, including exploration of the strategy of applying statistical parameters for choosing the initial seeds kmean_compression2 . Despite the efficiency of the latter scheme, it still has drawbacks like a priori fixation of the number of clusters and random selection of initial seeds. Various researchers have made several attempts to improve the performance of k-means clustering kmean_compression3 , kmean_compression4 , kmean_compression5 . In addition, hierarchical clustering algorithms also usually apply in image processing. But as the number of records increase the performance of hierarchical algorithm goes decreasing and time for execution increased. K-mean algorithm also increases its time of execution but as compared to hierarchical algorithm its performance is better. As a general conclusion, k-means algorithm is good for large dataset and hierarchical is good for small datasets compare_kmeans_hierarchical . Therefore k-means is most suitable for image processing in the video streaming scheme.
Beside, developing a model that efficiently provides QoS control is presently a challenging problem. Many researches have addressed the problem of providing QoS guarantees to various network applications and clients. Most of them have focused on servers without considering network delays related8 , related9 , on individual network routers related18 , related19 , related20 , or on clients with assumptions of QoS supports in networks related21 . Some recent work focused on end-to-end QoS guarantees in network cores related22 , related23 , with the aim of guaranteeing QoS as measured from server-side network edges to client-side network edges.
To solve this problem, previous approaches need to be revised to allow their application to a cloud environment in a manner that responds to various user behaviors and network conditions. In the present work, k-means clustering is used to reducing the size of one frame from the video. We then develop a scheme for the analysis of historical data as a means to consider network status and make a decision regarding the optimal compression ratio for QoS control. Eventually, we evaluate our system model using actual measurement results resulting from the processing of images from a realistic image dataset.
3 Image Compression Module
Clustering methods are widely used in pattern recognition, data compression, data mining, but the problem of using them in real-time systems has not been a focus of most algorithm designers. In this paper, we describe a practical clustering procedure that is designed specifically for compression of 2D images.
3.1 K-means Clustering
The k-means algorithm is one of the most commonly used methods for data clustering k_means_algorithm . Given a data set the objective of k-means is to partition X into K exhaustive and mutually exclusive clusters for by minimizing the sum of squared error (SSE):
| (1) |
where denotes the Euclidean norm euclidean and is the centroid of cluster calculated as the mean of the points that belong to this cluster. This problem is known to be NP-hard even for K = 2 np1 or D = 2 np2 because clustering algorithm could enumerate all the possible partitions in theory to obtain the best solution. But a heuristic method developed by Lloyd lloyd offers a simple solution. Lloyd’s algorithm starts with K arbitrary centers, typically chosen uniformly at random from the data points lloyd1 . Each point is then assigned to the nearest center, and each center is recalculated as the mean of all points assigned to it. These two steps are repeated until a predefined termination criterion is met. The classical k-means algorithm is given in Algorithm 1 (bold symbols denote vectors). Here, denotes the membership of point , i.e. index of the cluster center that is nearest to .
3.2 Proposed Image Compression Algorithm using k-Means
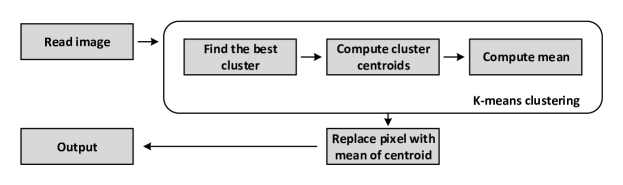
2D images typically use either 8-bit or 24-bit color. When using 8-bit color, there is a definition of up to 256 colors forming a palette for this image, each color denoted by an 8-bit value. A 24-bit color scheme, as the term suggests, uses 24 bits per pixel and provides a much better set of colors. For our purposes we’ll consider 24 bit RGB (R’G’B’) to be uncompressed color. The number 24 refers to the total number of bpp (bits per pixel) used to describe color. A 24 bit number has a range of 0 (no color or black) to 16,777,215 for a total of 16,777,216 different colors. Since Red, Green, and Blue are each described by 8 bits (24/3), which gives a range of 0 (no Red, no Green, or no Blue) to 255 for a total of 256 possible variations of each primary color. From this we can start to get an idea that the real-image contains thousands of colors and reduce the number of colors as a suitable number of colors. It can be 8, 16 or 32 colors, depend on the user demand and the network condition which is present in the next section. Procedure of image compression algorithm is shown in Figure 2.
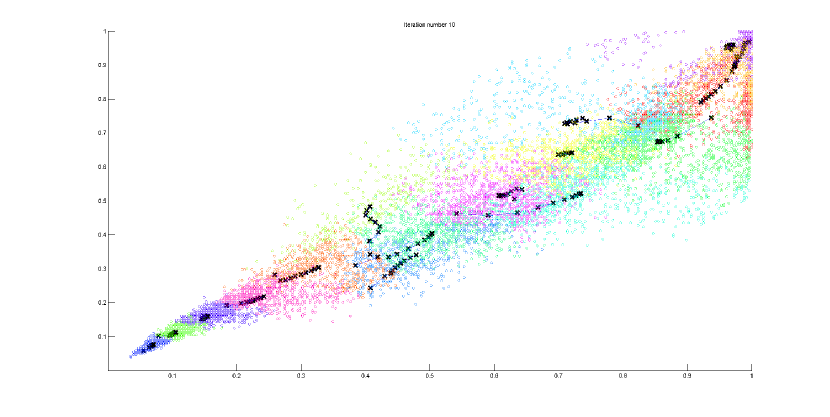
By making this reduction, it is possible to represent (compress) the photo in an efficient way. For example, suppose we want to reduce the number of colors to 16 of image . Specifically, we need to store the RGB values of the 16 selected colors, and for each pixel in the images we now need to only store the index of the color at that location (where only 4 bits are necessary to represent 16 possibilities). Concretely, we will treat every pixel in the original image as a data example and use the k-means algorithm to find the 16 colors that best group (cluster) the pixels in the 3 dimensional RGB space. Figure 3 shows that there are 16 groups of colors be created after applying the K-means clustering algorithm. First we have computed the cluster centroids on the image and then assigned each pixel position to its closest centroid. After that, we can view the effects of the compression by reconstructing the image based on the centroid assignments. Specifically, replace each pixel location with the mean of centroid assigned. Eventually, notice that after these steps we have significantly reduced the number of bits that are required to describe the image. The results can be summarized as follows: The original image required 24 bits for each one of the pixel locations, so total size of bits. The new representation requires some overhead storage in form of a dictionary of 16 colors, each of which require 24 bits, but the image itself then only requires 4 bits per pixel location. The final number of bits used is therefore bits, which corresponds to compressing the original image by about a factor of 6.
4 System Architecture
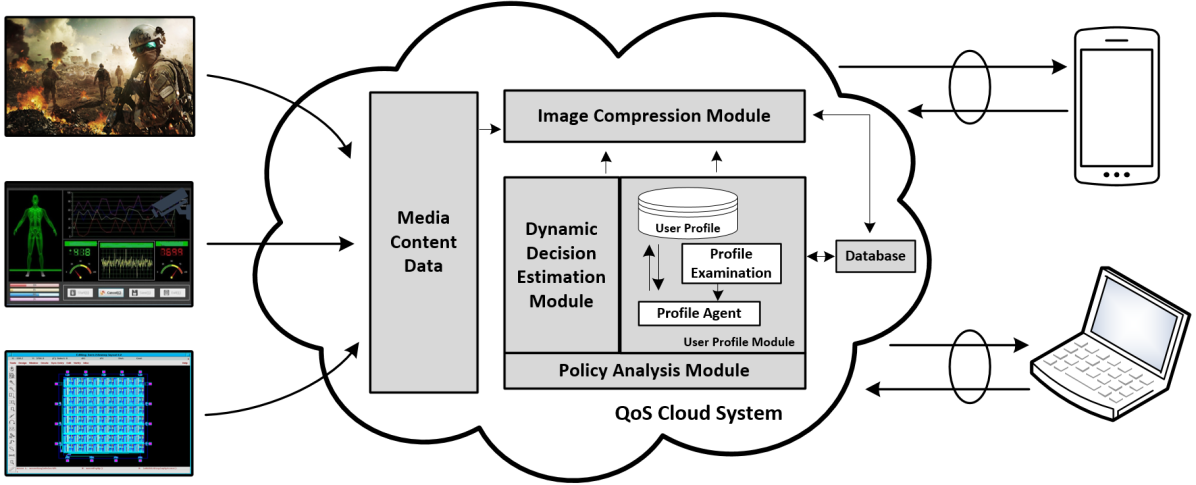
The proposed system provides an efficient interactive streaming desktop remote service for diversified client devices and dynamic network environments. The overall system structure is shown in Figure 4. Whenever a device requests a multimedia desktop streaming service, by the agent is installed on the client device, it helps transmit data included hardware and network environment parameters to User Profile Module (UPM). After that the UPM records the device codes and determines the required parameters, and then transmits them to the Dynamic Decision Estimated Module (DDEM). By analysis of historical data, the DDEM determines the most suitable compression ratio number for the device according to the parameters and the network condition. The number is transferred to the Image Compression Module (ICM) for use in the encode phase. Finally, the multimedia video file is transmitted to the mobile device through the service.
4.1 User Profile Module
| Data Type | Function | Description |
|---|---|---|
| int | Resolution | Supportable resolution |
| float | CPU | Operation ratio |
| float | Battery | Dump energy of the device |
| float | Bandwidth | Tested existing bandwidth |
The profile agent is used to receive the device hardware environment parameters and create a user profile. The device transmits its hardware specifications in XML-schema format to the profile agent in the cloud server, as shown in the Table 1. The XML-schema is meta-data, which is mainly semantic and assists in describing the data format of the file. The meta-data enables non-owner users to see information about the files, and its structure is extensible. However, any device that is using this cloud service for the first time will be unable to provide such a profile, so there shall be an additional profile examination to provide the test performance of the mobile device and sample relevant information. Through this function, the client device can generate an XML-schema profile and transmit it to the profile agent. The profile agent determines the required parameters for the XML-schema and creates a user profile, and then transmits the profile to the DDEM for identification.
4.2 Dynamic Decision Estimation Module with QoS Control
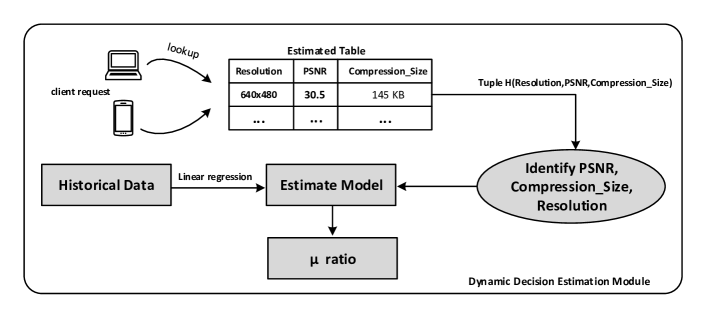
Figure 5 illustrates the DDEM used to estimate the value of . Specifically, the DDEM conducts this estimation after receiving the profile data from the User Profile Module. Based on multiple linear regression model in statistics, Based on multiple linear regression model in statistics, the DDEM determines the relationship between factors and predicts a suitable range for the number number. The problem is how to choose the best to obtain a suitable image size after the compression phase while also ensuring sufficiently high image quality and satisfying the image resolution demanded by the user. The ICM is used to obtain the compression data and calculate the corresponding values; these data are defined as historical data for the simulations, as shown in Table 3.
In the current application, PSNRs of 25 to 50 dB are considered to be acceptable in terms of transmission quality. Therefore, before the regression analysis, we need to extract a list of values filtered by the condition . After we have a suitable range for the ratio, the system will analyze which number is most suitable for the compression phase. Specifically, let be the available bandwidth and the bandwidth threshold. If is greater than , the system can transmit the video content with the best possible quality without further processing. Otherwise, the next step is to determine appropriate values of and to adapt to the current network conditions. In this case, the and values are looked up in the estimation table; this table comprises a set of tuples of the form , as described in the next section. Eventually, these tuples obtained is input to the estimate model, then the output value is asymptotic as well. The operation of QoS control is described algorithmically as Algorithm 3.
4.2.1 Proposed Estimation Model
In the present paper, we use multiple linear regression (MLR) to estimate the value of a variable based on the value of two or more other variables. The goal of MLR is to model the statistical relationship between response and predictor variables. A simple linear regression illustrates the relation between the dependent variable and the independent variable based on the regression equation
| (2) |
According to the multiple linear regression model the dependent variable is related to two or more independent variables. The general model for k variables is of the form
| (3) |
To simplify the computation, the multiple regression model in terms of the observations can be written using matrix notation. Using matrices allows for a more compact framework in terms of vectors representing the observations, levels of regression variables, regression coefficients and random errors. The model is in the form
| (4) |
and when written in matrix notation we have
| (5) |
where , denote respectively the response values for all observations into a -dimensional vector and predictor into a matrix. denote the intercepts and slopes into a -dimensional vector and is an vector of random errors.
The first step in multiple linear regression analysis is to determine the vector of least squares estimators which gives the linear combination that minimizes the length of the error vector. Basically the estimator provides the least possible value to sum of the squares difference between and . Now, since the objective of multiple regression is to minimize the sum of the squared errors, the regression coefficients that meet this condition are determined by solving the least squares normal equation
| (6) |
Now if the variables are linearly independent, then the inverse of , namely will exist. Multiplying both sides of the normal Eq. 6 by , we obtain
| (7) |
In the present work, is considered to be the response variable and the , and are used as predictor variables. In this case, we defined the as a value from 1 to 7 corresponding to one of seven common screen resolutions; these resolutions are listed in Table 3. Thus, from Eq. 3, we have the following linear model for this approach.
| (8) |
By filtering the historical data using the condition , we can now find the least squares estimators by using the Eq. 7. Finally, the resulting regression model is as follows.
| (9) |
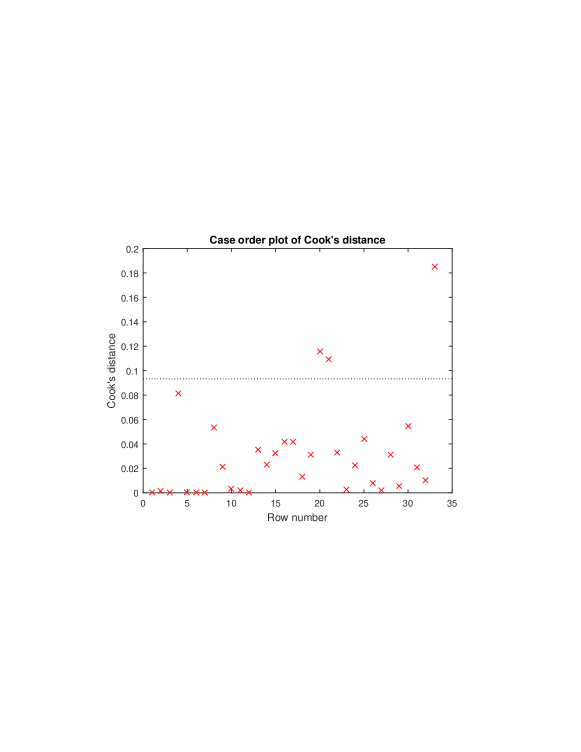
In linear regression, one problem with least squares occurs when there are one or more large deviations, i.e. cases whose values differ substantially from the other observations. These points are called outliers. There are various methods for outlier detection outlier . As shown in Figure 6, using Cook’s distance which is commonly used of the influence of a data point when performing least squares regression analysis. Cook’s distance used to indicate data points that are particularly worth checking for validity. In this case, there are several outliers above the reference line; these are identified and removed from the model.
After reducing the outliers, we obtain the following fitted regression model that represents the data adequately.
| (10) |
The difference between the observed and predicted score, Y-Y’, is called a residual. We analyze a histogram that shows the range of the residuals and their frequencies, and a probability plot that shows how the distribution of the residuals compares to a normal distribution with matching variance. As shown in Figure 7, the new residuals plot looks fairly symmetric and the probability plot seems reasonably straight, suggesting that the data fits reasonably to normally distributed residuals.
4.2.2 Estimated Table
At this point, we have obtained an expected range of values from 8 to 64 while ensuring that . Therefore, to estimate a suitable value, we need to define an estimation table comprising a set of tuples of the form (, , ), where the value is selected according to the average compressed image size of each group of images () in Table 3. Moreover, by analyzing the historical data, we have classified the further as mobile thin resolutions and desktop resolutions. denote the thin client resolutions, denote the desktop resolutions. These are listed in Table 2.
| Resolution | PSNR | Estimated_Size | |
| Thin Client | 300 x 212 | 28 | 20.6 kB |
| 600 x 450 | 30 | 42.2 kB | |
| Desktop | 800 x 600 | 25 | 373.9 kB |
| 1920 x 1080 | 40 | 657.2 kB |
Specifically, the system will automatically adjust to increase or decrease the PSNR according to the available bandwidth representing the current network status. Then, by looking up the predictor variables , and in the estimated table, we can find the best tuple to input into the estimate model. Obviously, the value obtained here satisfies the client demands.
For example, consider a case in which a thin client device sends a request to the system, and the available bandwidth is less than or equal to a predefined threshold value representing ò the full bandwidth. The system will then decrease the PSNR value. The default is dB. Assume we would decrease the PSNR down to dB. From the User Profile Module, the system will know what type of device the request is originating from. In this case, we get the tuple from the table. Thus, we obtain the following.
| (11) |
Then resulting is exactly the expected compression ratio; this value is input to the ICM. Thus, after the compression phase the output frame ensures the image quality as well as the screen resolution.
5 Experimental Results
5.1 Image Compression Results
The proposed method was tested on some images in a dataset collected by the MIT Computer Science and Artificial Intelligence Lab. The natural images in the set include Zebra Butterfly (, kB), Boston Street (, kB), Conference Room (, kB), Airport (, kB), Oxford Outdoor (, MB), Chip Designer (, kB), and Angry Bird (, kB). All of the image compression programs were implemented in Matlab 2010 and executed on an Intel Core i5-4670 CPU running at 3.40 GHz.
[5pt] Butterfly
\stackunder[5pt]
Butterfly
\stackunder[5pt]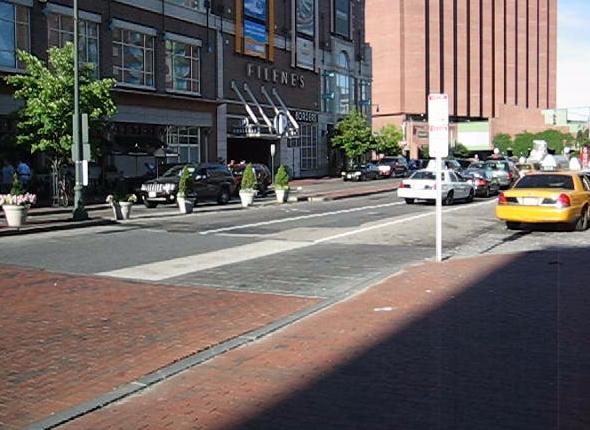 Boston Street
\stackunder[5pt]
Boston Street
\stackunder[5pt]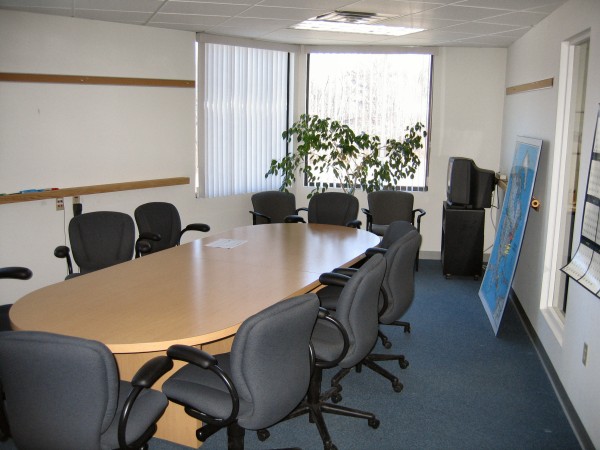 Room
Room
[5pt] Airport
\stackunder[5pt]
Airport
\stackunder[5pt] Oxford
\stackunder[5pt]
Oxford
\stackunder[5pt] Chip Designer
\stackunder[5pt]
Chip Designer
\stackunder[5pt] Angry Bird
The effectiveness of the compression was quantified by the mean squared error (MSE) measure:
| (12) |
where and respectively denote the of the original and compressed images in the RGB color space. MSE represent the average distortion with respect to the norm lloyd . Note that the Peak Signal-to-Noise Ratio (PSNR) measure can be easily calculated from the MSE value:
| (13) |
Let denote the color depth, the image dimensions , and let be defined as the number of colors (clusters) and as the number of bits necessary to represent the index of the colors at the location in the image. We computed the compression ratio (CR) by dividing the size of the original file in bits by the size of the compressed file:
| (14) |
where denotes the size of the original image. Figure 9 shows the original image Turtle and a compressed version of Turtle with . The compression was carried out using various values of ; the results are shown in Table 3 and Figure 15 .
[5pt] a) turtle.jpg - kB
\stackunder[5pt]
a) turtle.jpg - kB
\stackunder[5pt] b) turtle_32.jpg - kB
As can be seen, the presently proposed approach enabled compressing an image to of its original size while maintaining visual similarity to the original image. It is of extremely importance to reduce the frame loss rate when transmitting video data over the Internet. If the frame loss rate is small, it means that the video streaming quality is good.
Basically, if a packet is lost during transmission, a common method for error concealment on the decoder side is to replace the data lost by the last correctly received frame data. In this case, let denote the pixel of the reconstructed frame at the decoder, and denote the pixel of the original coded frame at the encoder. The total frame error at frame is defined by
| (15) |
where M is the number of pixels in each frame (i.e in QCIF video format). The Mean Square Error associated with frame error is
| (16) |

Then, the PSNR of the video signal of frame is given by
| (17) |
where is the maximum possible pixel value of the frame and RMSE is the root mean square error between received and original frames. In practice, if the frame size is small then the distortion arising from the loss of a single frame is small too. From the form of Eq. 17, it is clear that decreases as increases. So, it is a important problem we need to consider when ensuring performance of the compression.
5.2 Evaluation of QoS System
[5pt]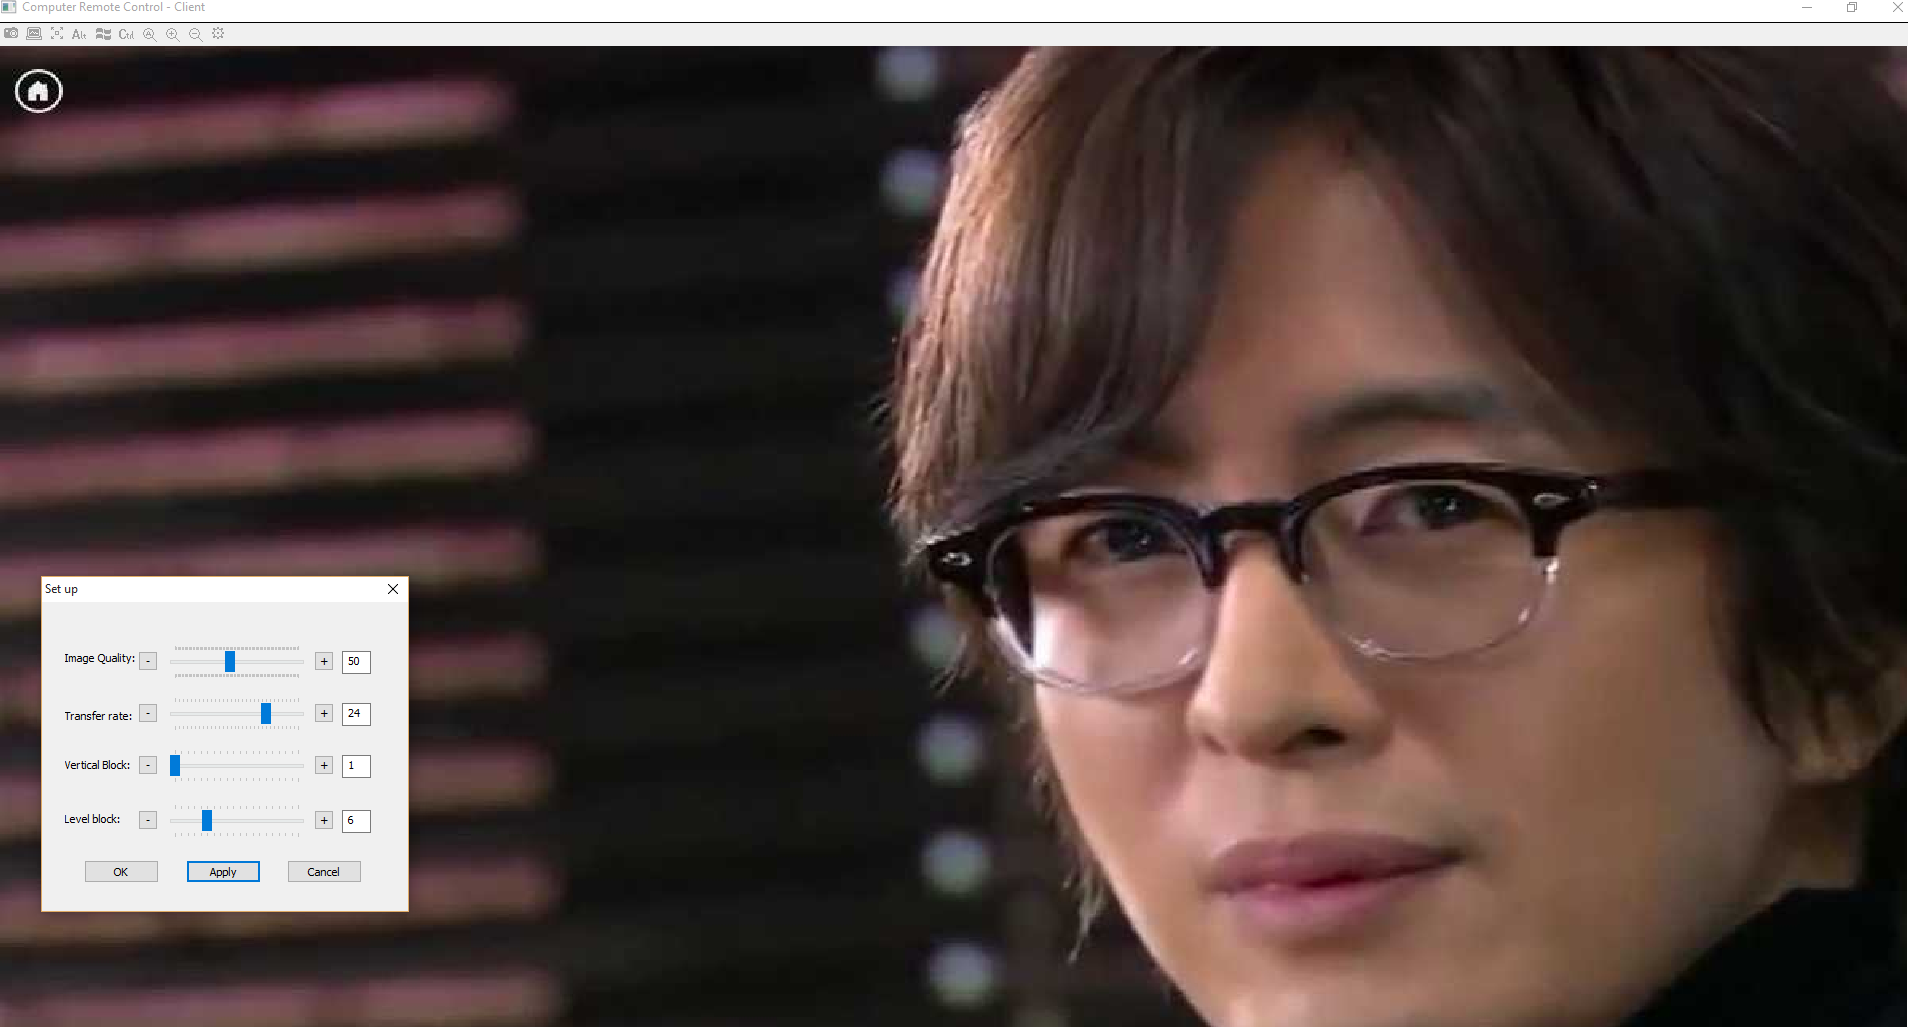 a) A Scene in the Korean Movie
\stackunder[5pt]
a) A Scene in the Korean Movie
\stackunder[5pt]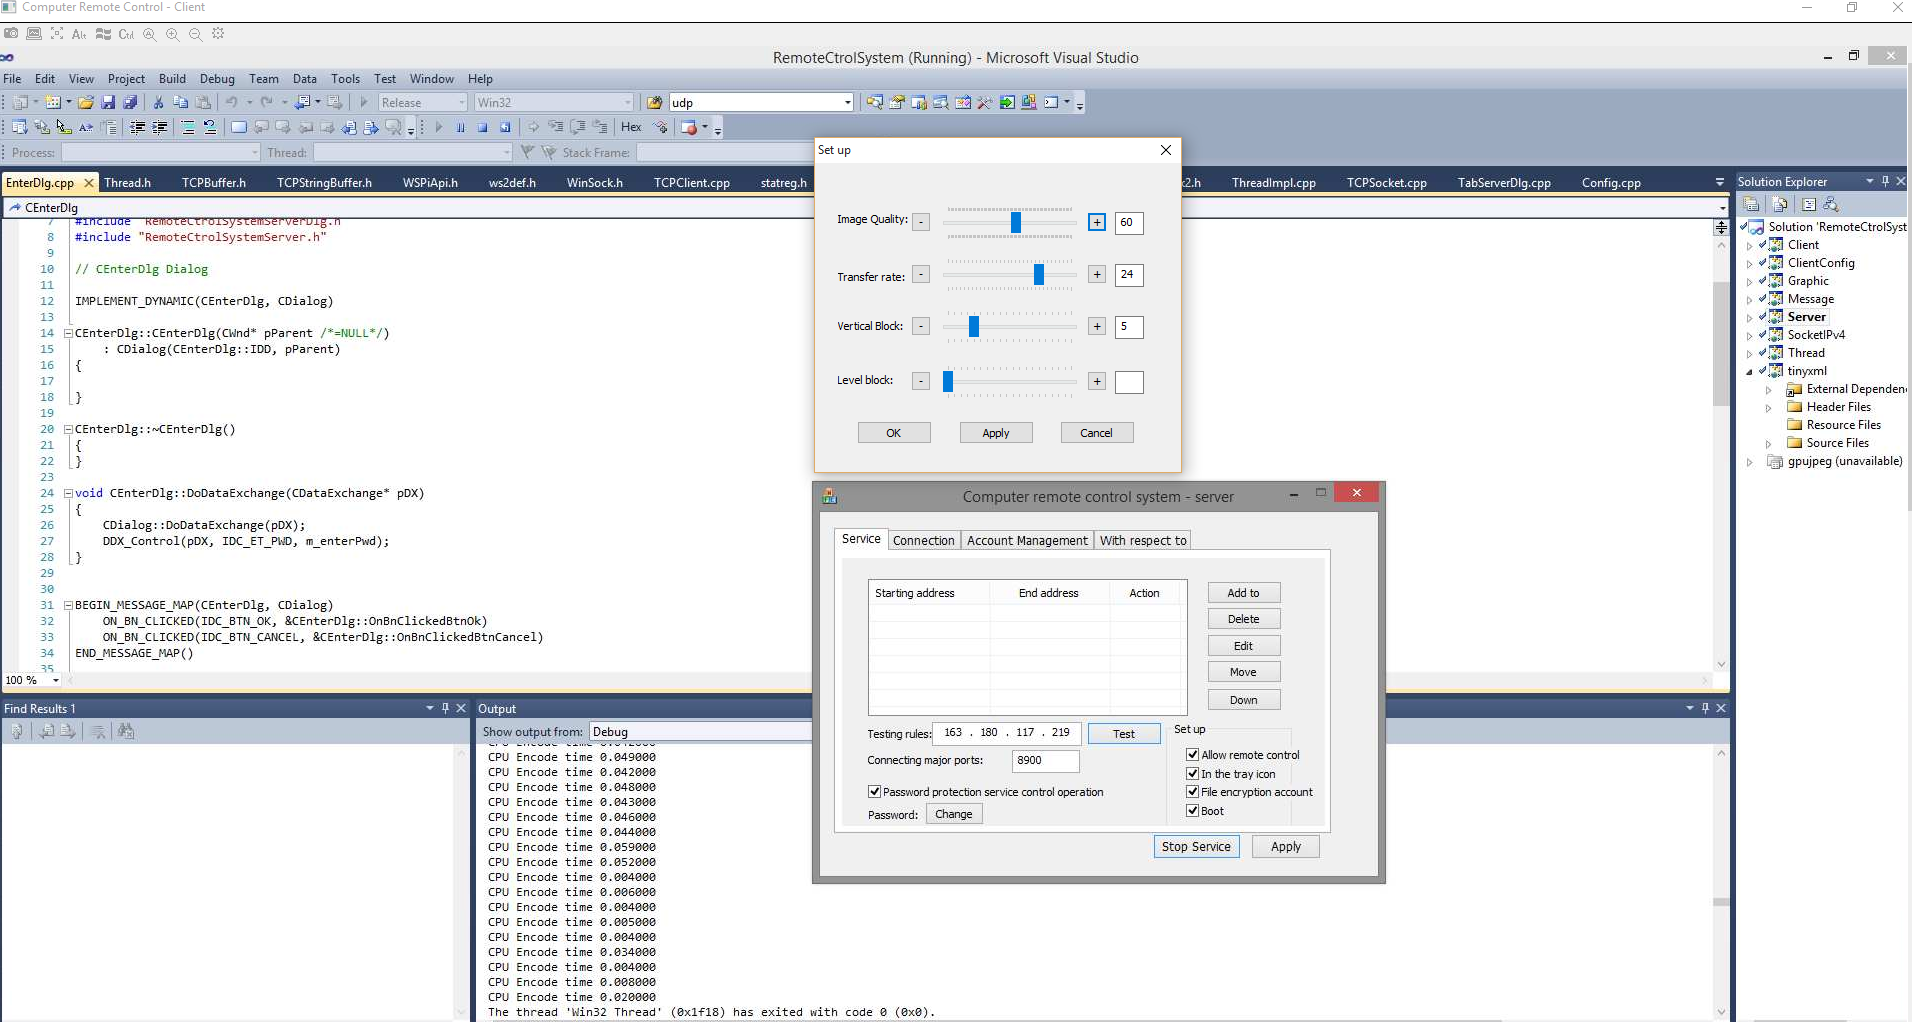 b) Screen Desktop
We built a testbed to carry out performance evaluations of the proposed system. Specifically, in the cloud environment, as a visualization platform we used an HP Server (4-core Intel Xeon CPU E3-1220 V2 running at 3.10 GHz, 32 GB RAM) with CentOS 6.5 and OpenStack (Icehouse version) openstack installed. Virtual machines (VMs) were installed with lightweight Windows. The VMs ran our server software, which was implemented in C/C++ using Microsoft Visual Studio 2010. We considered low-motion (Screen-Desktop) and high-motion (Korean Movie) videos for transmission Figure 11. For simplicity, we set up the environment to run two VMs and measured the frame loss rate during the transmission in two cases: with and without applying the QoS support system, for both video types. It was assumed that the client connected to the service side was a PC device, and the screen resolution and frame rate of all video sequences were SVGA () and 24 fps, respectively. Thus, the system predicted the best for each frame of desktop image data delivered.
[5pt] a) Normal Transmission
\stackunder[5pt]
a) Normal Transmission
\stackunder[5pt] b) Transmission with QoS Support
\stackunder[5pt]
b) Transmission with QoS Support
\stackunder[5pt] a) Normal Transmission
\stackunder[5pt]
a) Normal Transmission
\stackunder[5pt]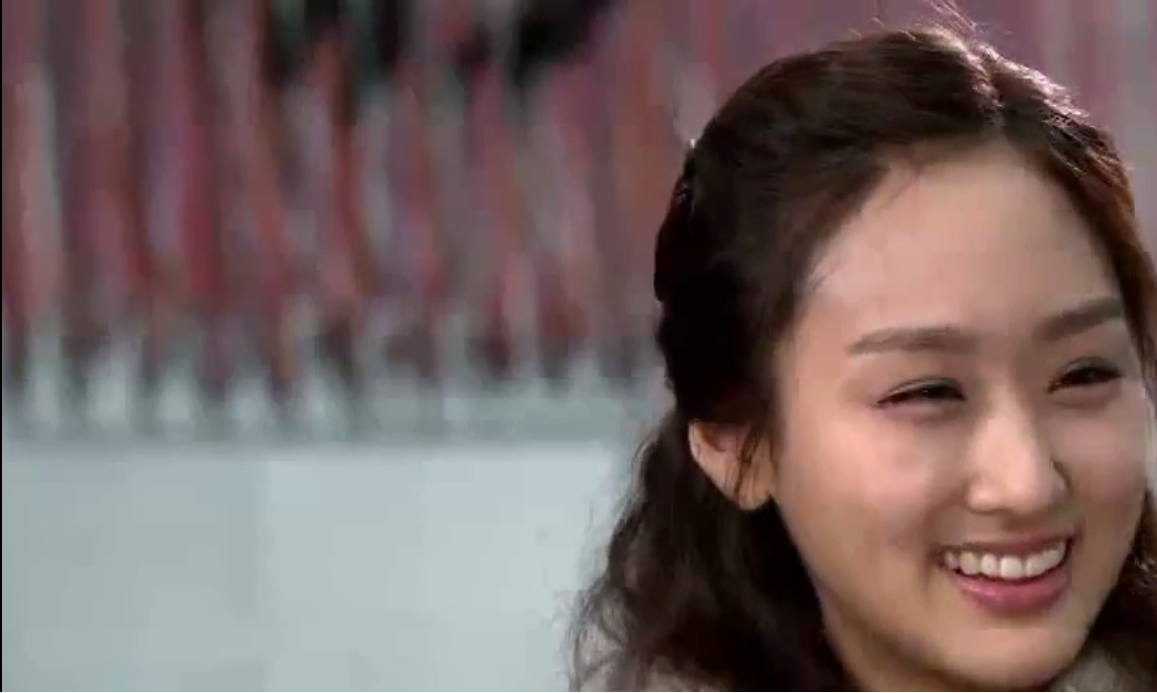 b) Transmission with QoS Support
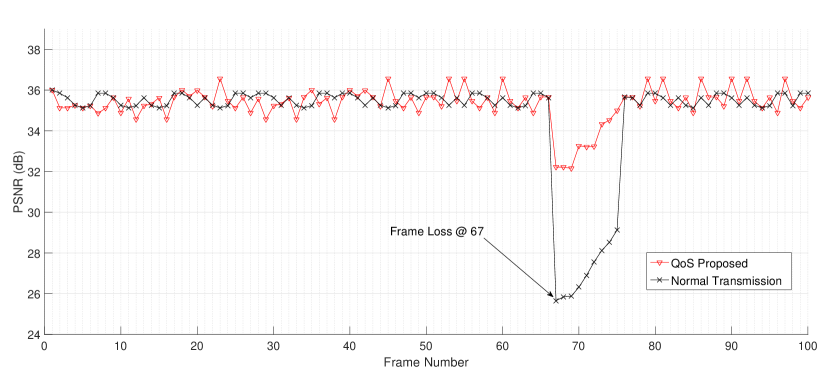
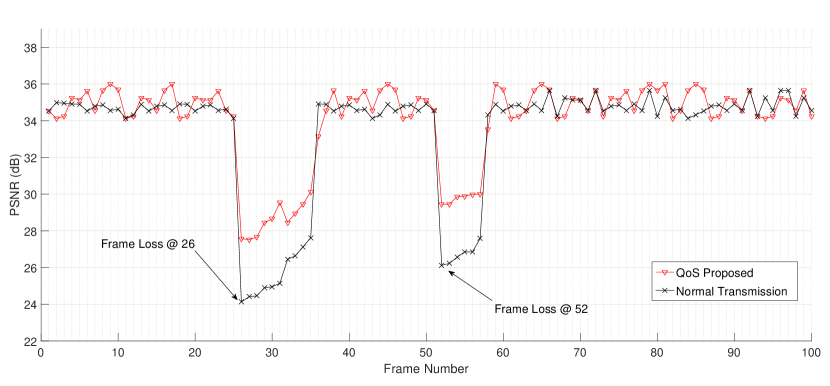
Figure 12 and 13 illustrate the changes that occur in the PSNR when a random single losses occurs during normal transmission and during transmission when the QoS support system is applied. These figures clearly demonstrate the distortion propagation for each type of video. Obviously, QoS policies can help the system to automatically adapt to the network condition. Specifically, the DDEM determines the suitable value. Then, the system automatically adjusts the size of the image to adapt the network status, mitigating the effects of the frame loss occurring at frame 63 in the low-motion video and at frames 26 and 52 in the high-motion videos while ensuring the highest possible quality.
As shown in Figure 14 something mismatch for a slice area in the whole picture. This accounts for mismatch that some performed area in the picture is decoded by copying the data from previous key frame, but which cannot match the other part because the right reference data were lost.
6 Conclusions
This paper presented a new architecture with flexible QoS control for Virtual Desktop Infrastructure. The proposed architecture includes a novel compression method for 2D images, based on k-means clustering. This method is applied to significantly reduce the size of video data transmitted while ensuring the highest quality possible. Additionally, to improve users’ quality of experience (QoE) by considering network conditions, we included a model to estimate the most suitable decision for streaming policies, based on the analysis of historical data using linear regression modeling. Through simulations with a real-world dataset, we show the experimental as well as the performance of QoS system that our approach outperforms previously reported methods. The present work is expected to open an important avenue for future related research.
Appendix A Compression Results
[5pt]Butterfly
\stackunder[5pt]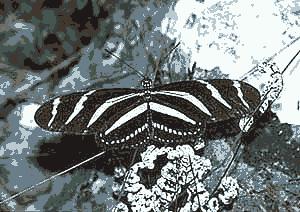 = 8
\stackunder[5pt]
= 8
\stackunder[5pt]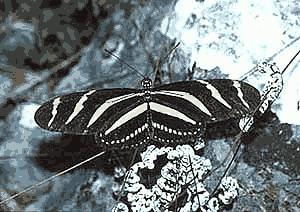 = 16
\stackunder[5pt]
= 16
\stackunder[5pt]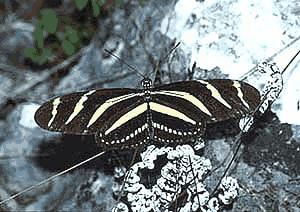 = 32
\stackunder[5pt]
= 32
\stackunder[5pt]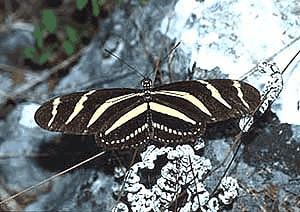 = 64
\stackunder[5pt]
= 64
\stackunder[5pt]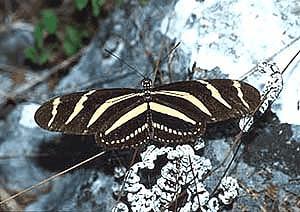 = 128
= 128
[5pt]Street
\stackunder[5pt]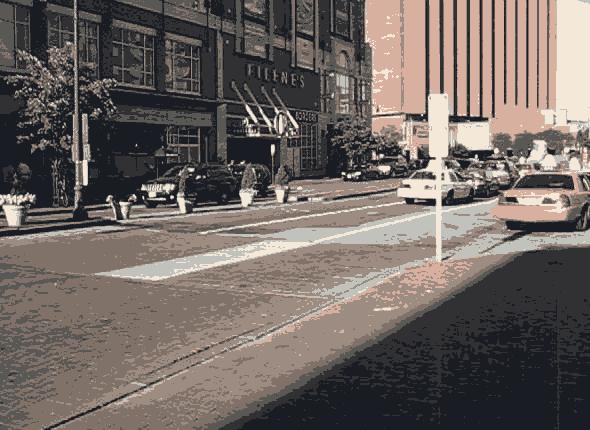 = 8
\stackunder[5pt]
= 8
\stackunder[5pt]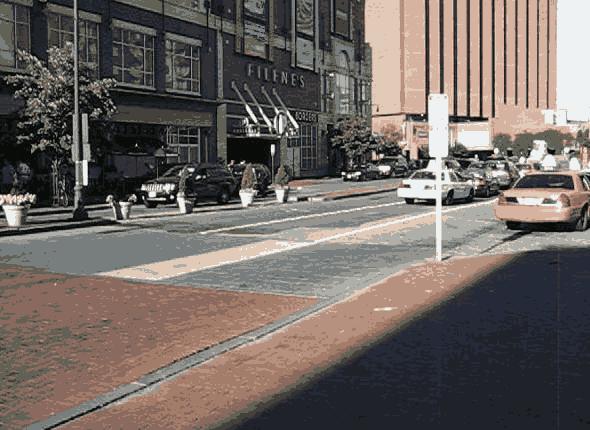 = 16
\stackunder[5pt]
= 16
\stackunder[5pt]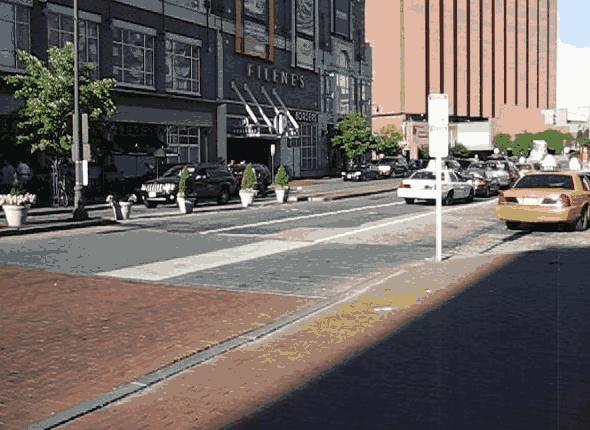 = 32
\stackunder[5pt]
= 32
\stackunder[5pt] = 64
\stackunder[5pt]
= 64
\stackunder[5pt]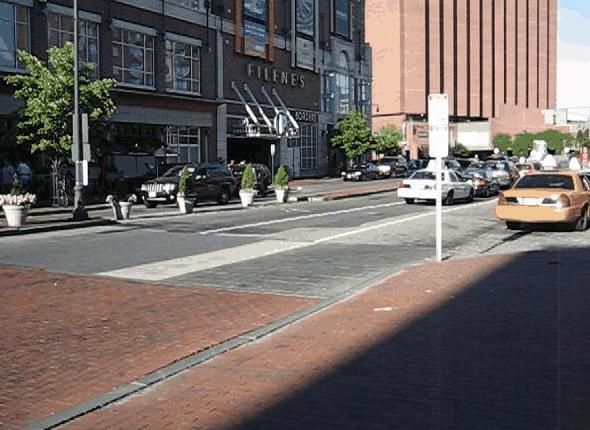 = 128
= 128
[5pt]Room
\stackunder[5pt]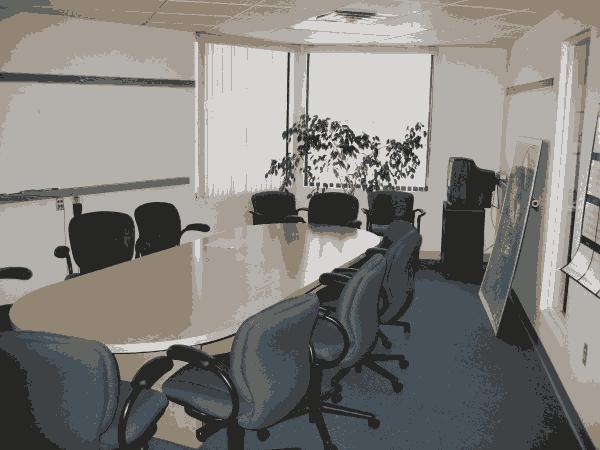 = 8
\stackunder[5pt]
= 8
\stackunder[5pt]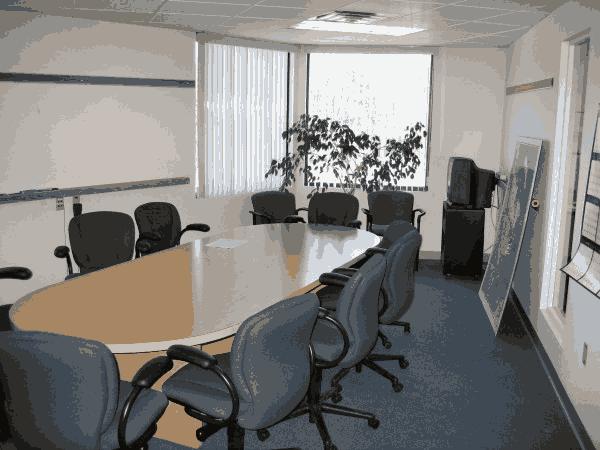 = 16
\stackunder[5pt]
= 16
\stackunder[5pt]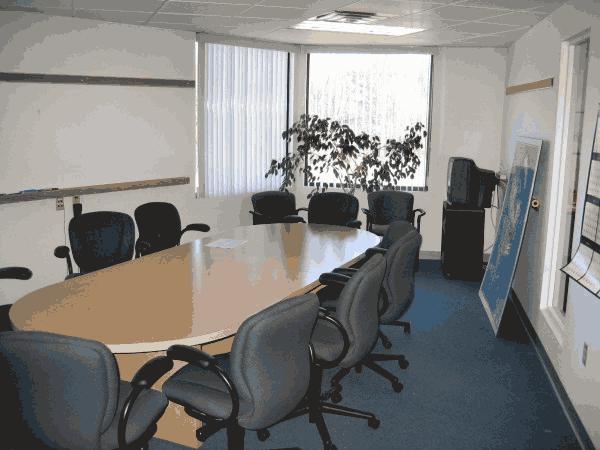 = 32
\stackunder[5pt]
= 32
\stackunder[5pt]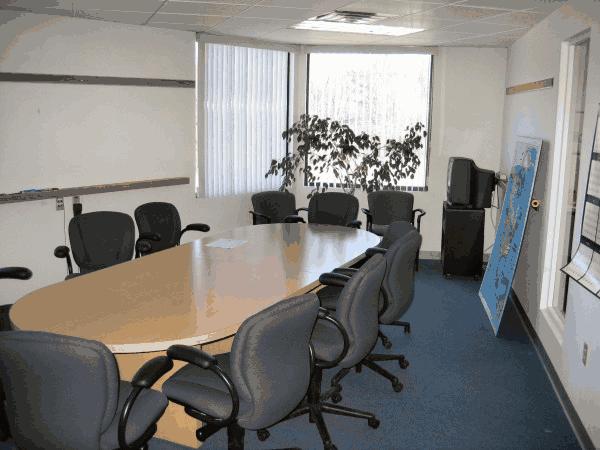 = 64
\stackunder[5pt]
= 64
\stackunder[5pt] = 128
= 128
[5pt]Airport
\stackunder[5pt] = 8
\stackunder[5pt]
= 8
\stackunder[5pt] = 16
\stackunder[5pt]
= 16
\stackunder[5pt] = 32
\stackunder[5pt]
= 32
\stackunder[5pt] = 64
\stackunder[5pt]
= 64
\stackunder[5pt] = 128
= 128
[5pt]Outdoor
\stackunder[5pt]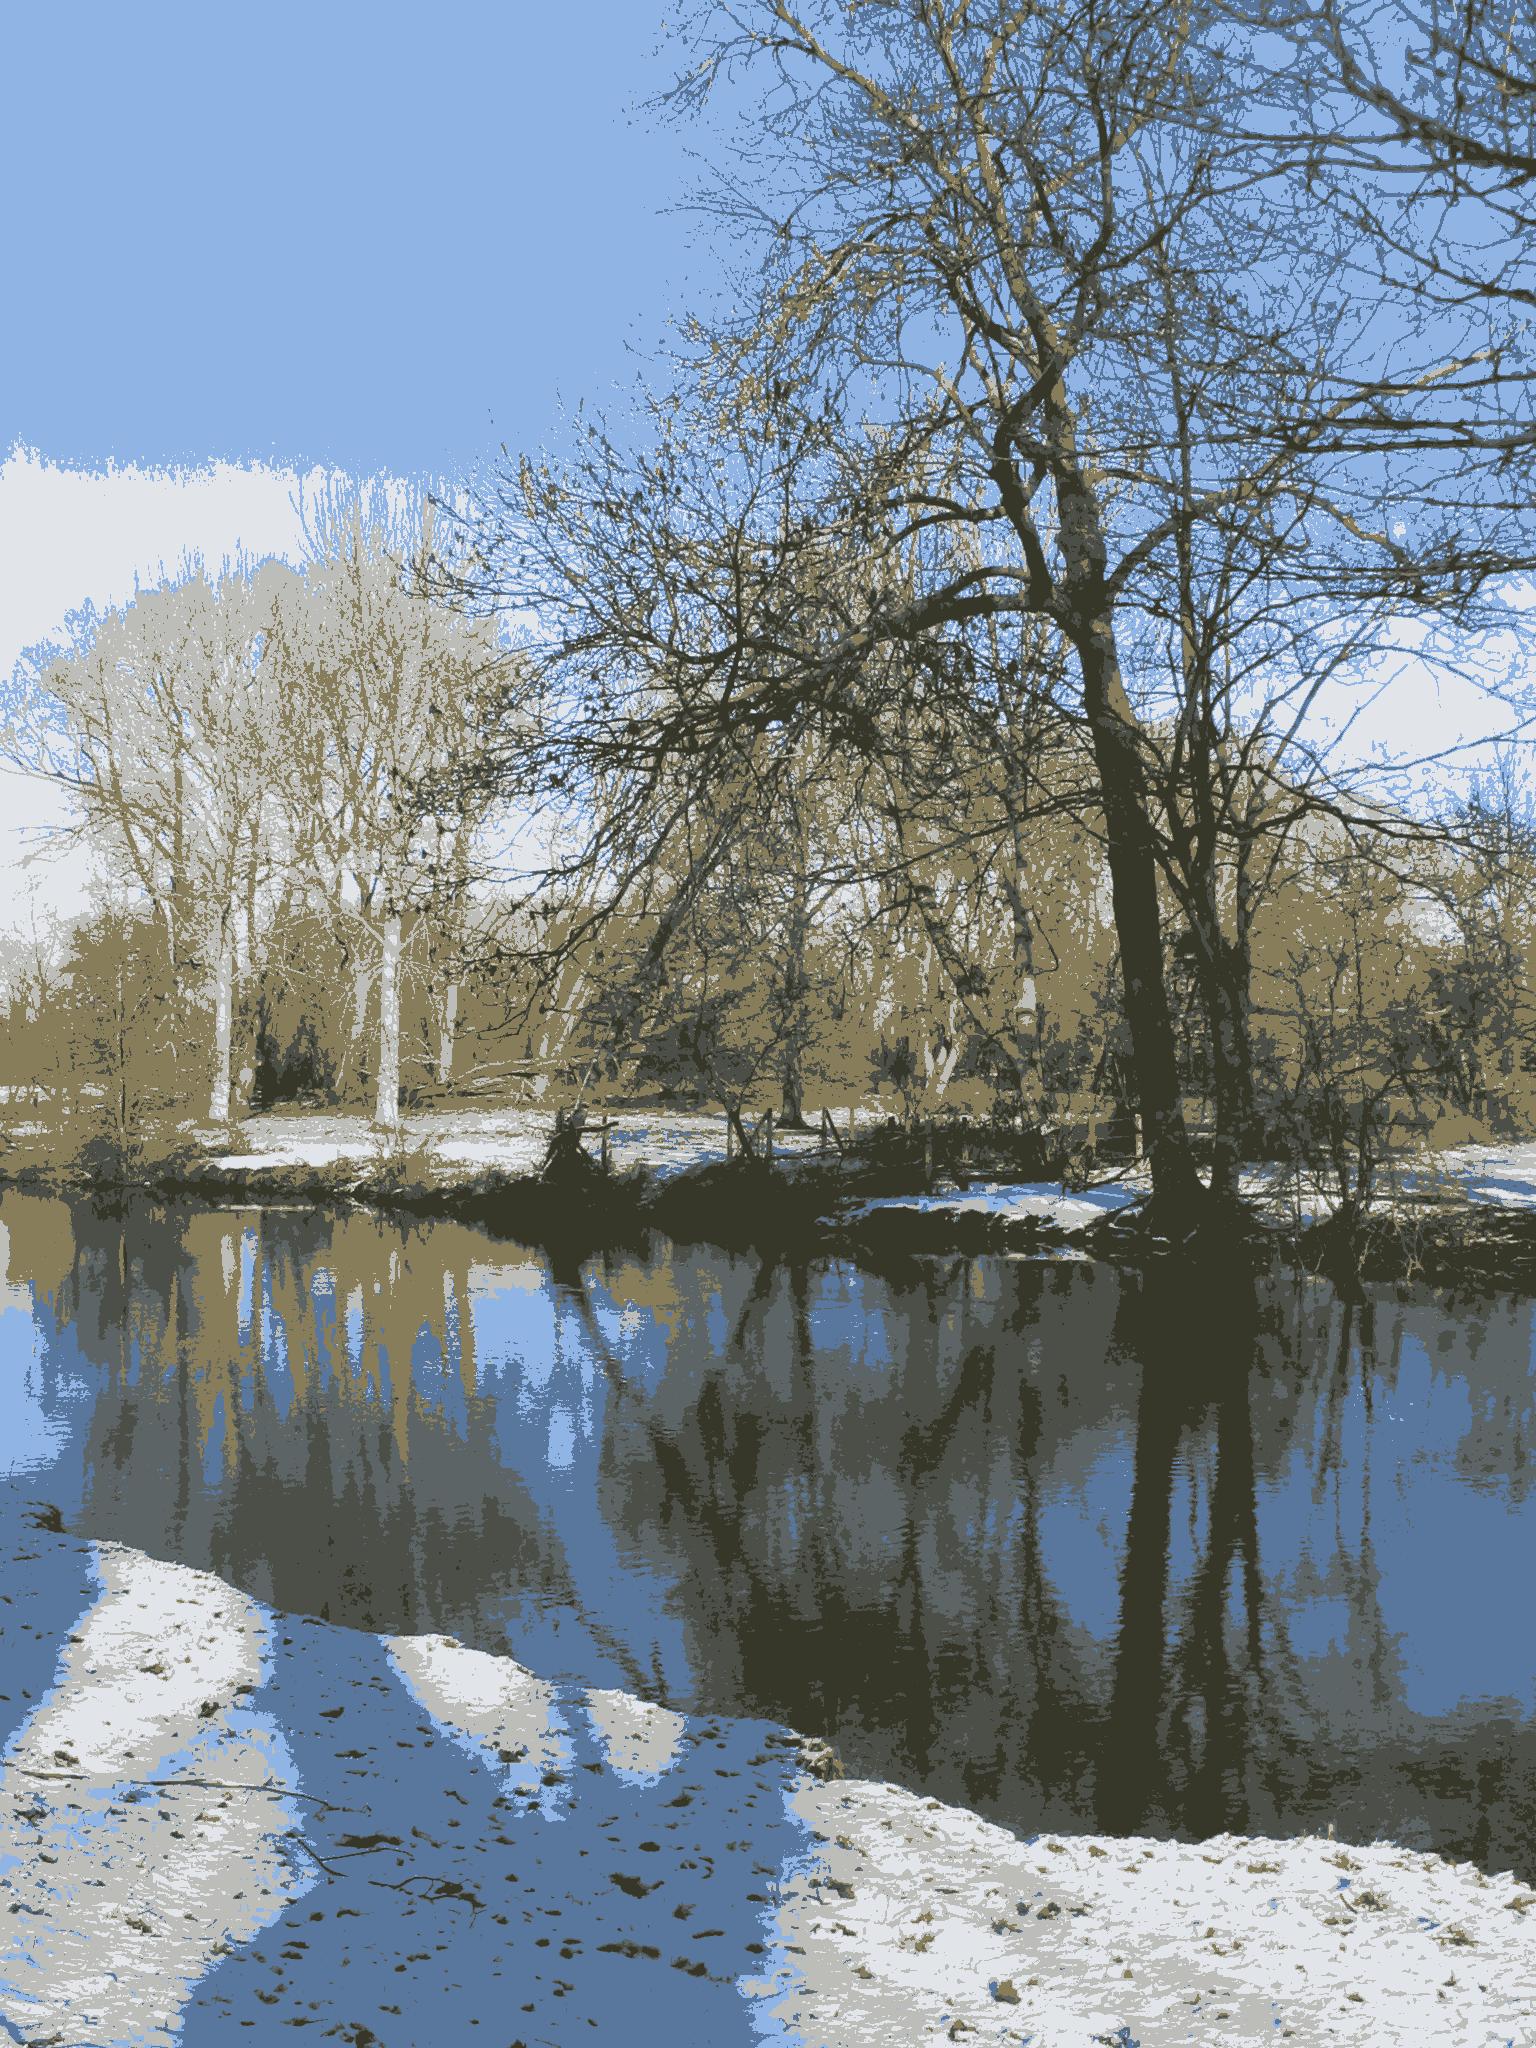 = 8
\stackunder[5pt]
= 8
\stackunder[5pt]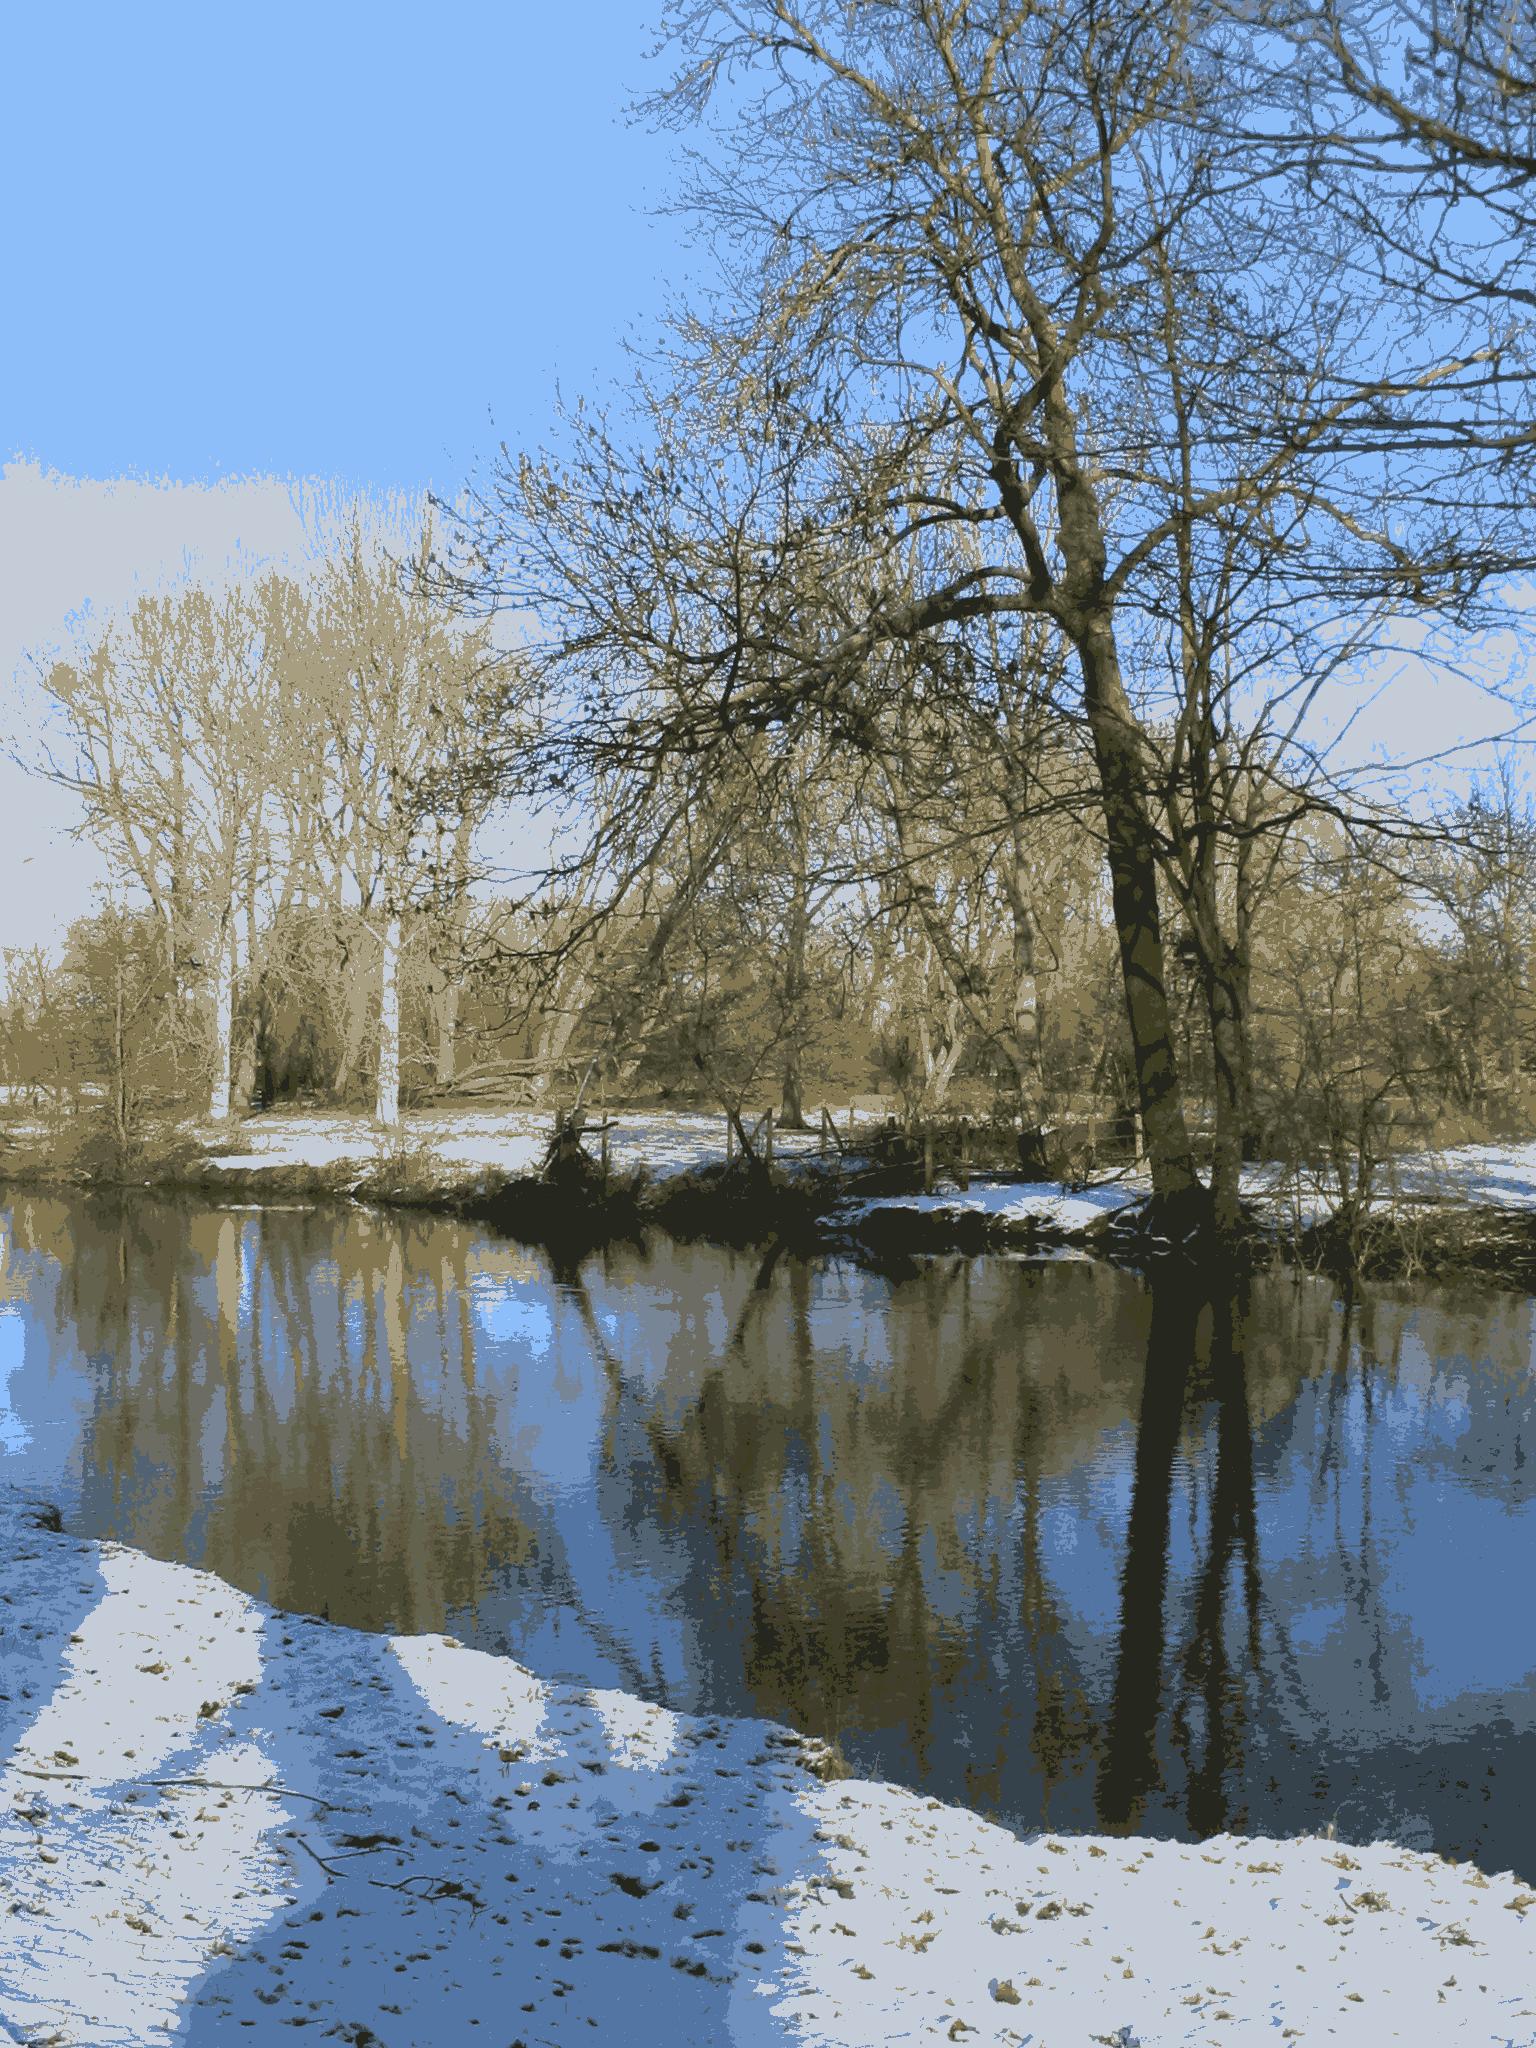 = 16
\stackunder[5pt]
= 16
\stackunder[5pt] = 32
\stackunder[5pt]
= 32
\stackunder[5pt] = 64
\stackunder[5pt]
= 64
\stackunder[5pt]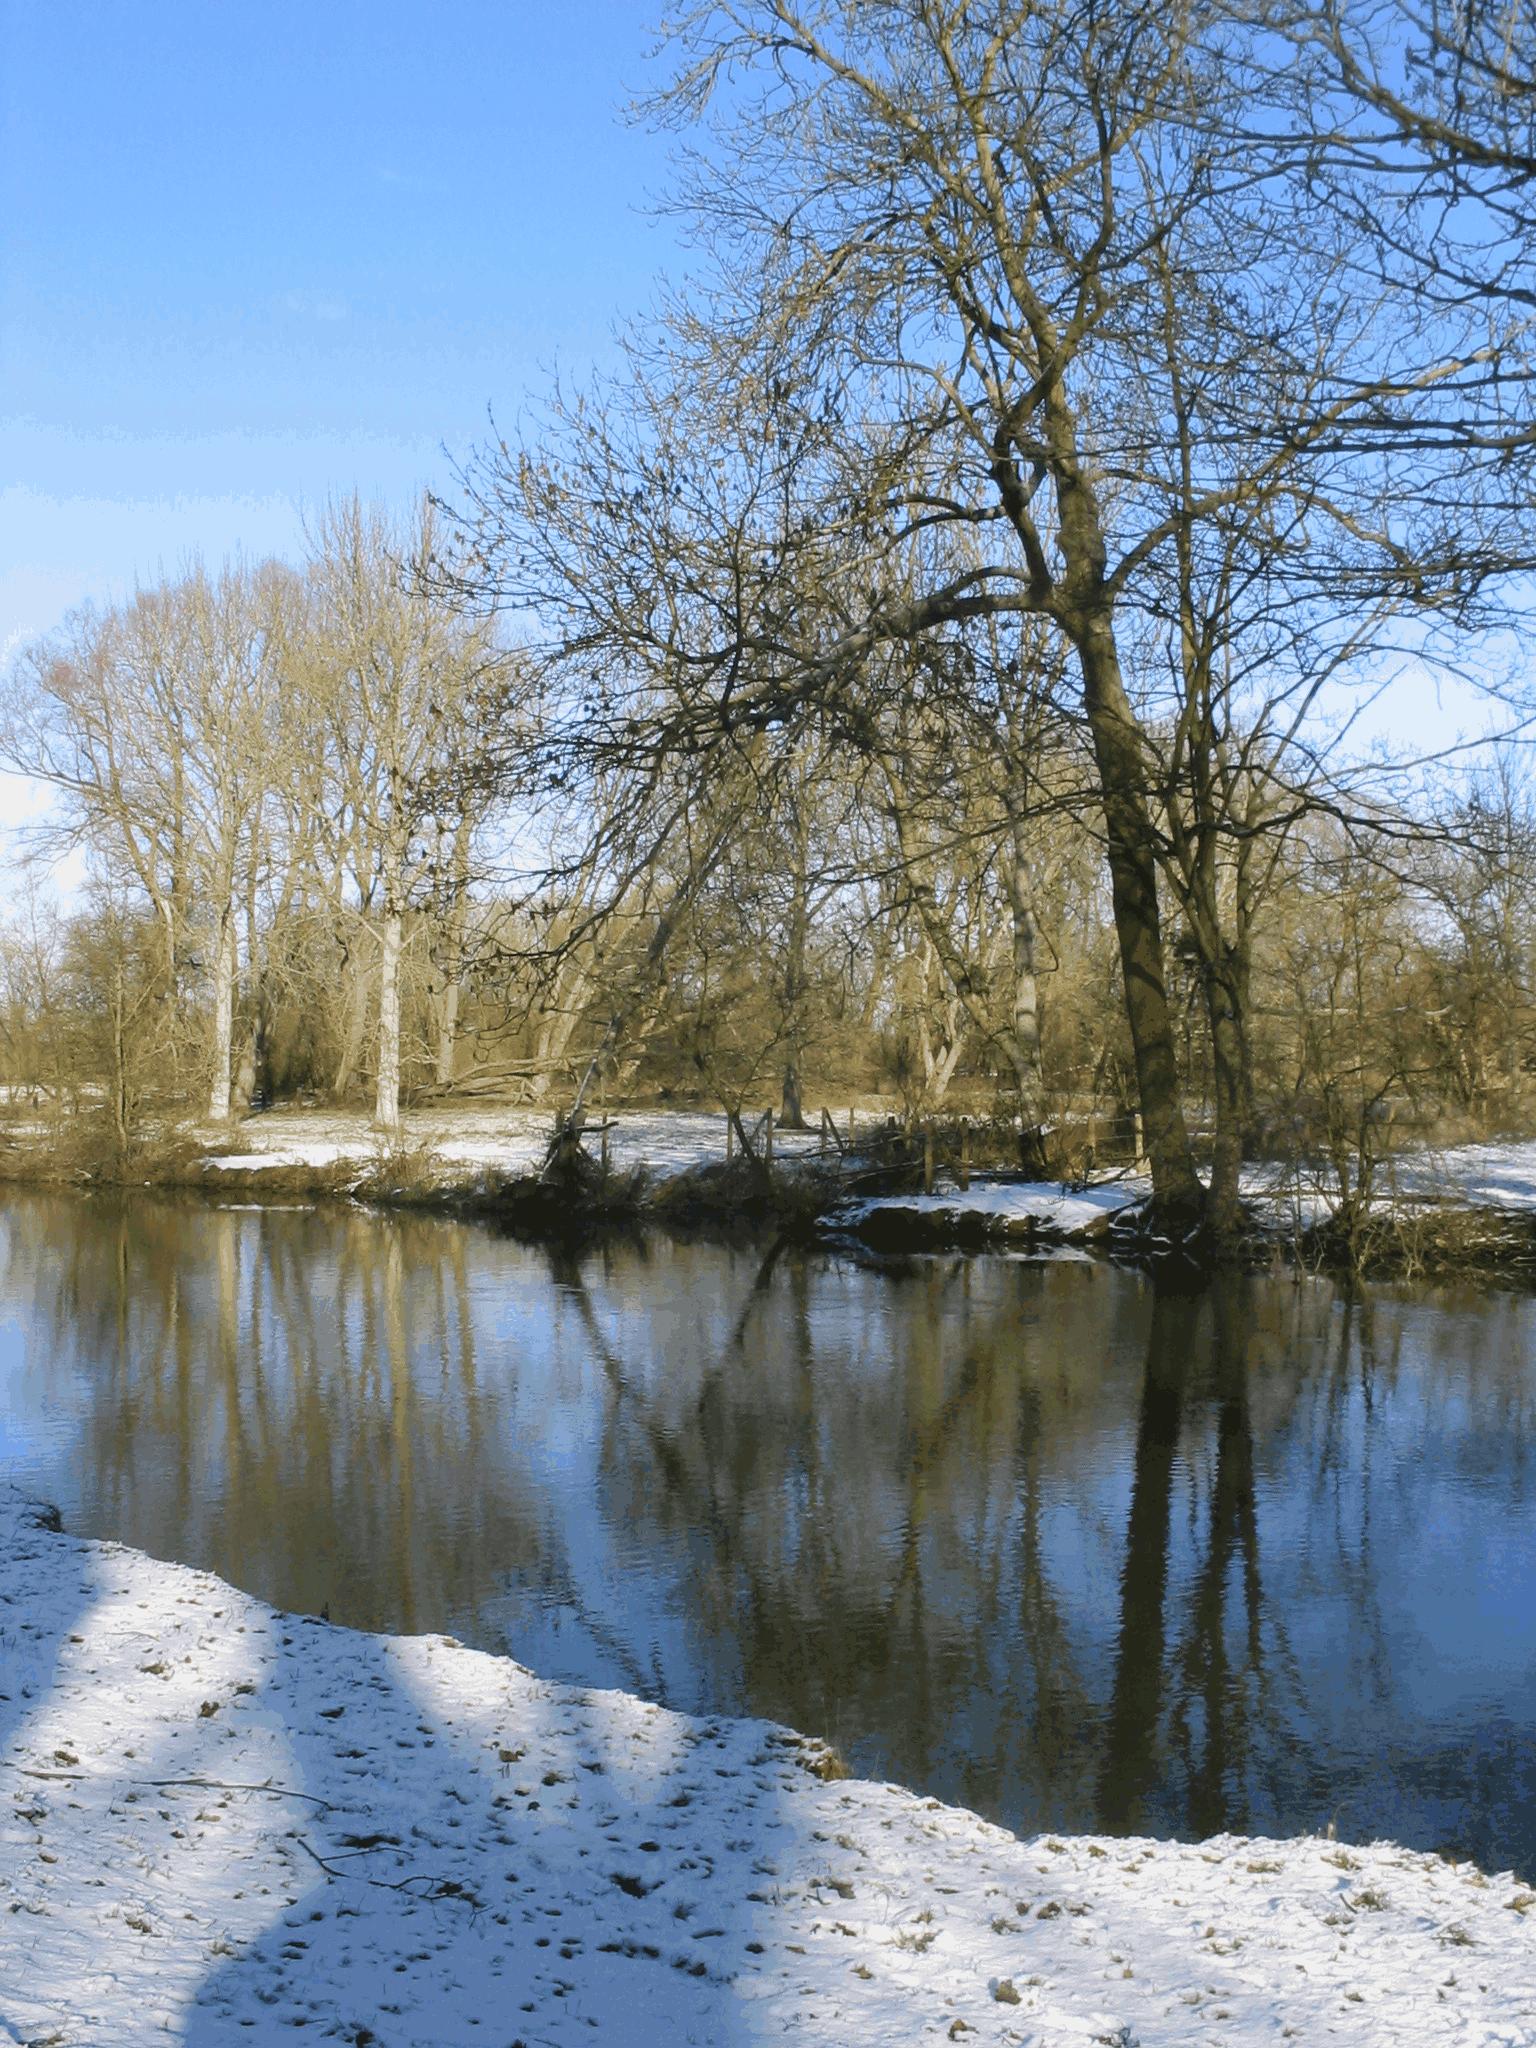 = 128
= 128
[5pt]Angry Bird
\stackunder[5pt] = 8
\stackunder[5pt]
= 8
\stackunder[5pt] = 16
\stackunder[5pt]
= 16
\stackunder[5pt] = 32
\stackunder[5pt]
= 32
\stackunder[5pt] = 64
\stackunder[5pt]
= 64
\stackunder[5pt] = 128
= 128
[5pt]Tool
\stackunder[5pt]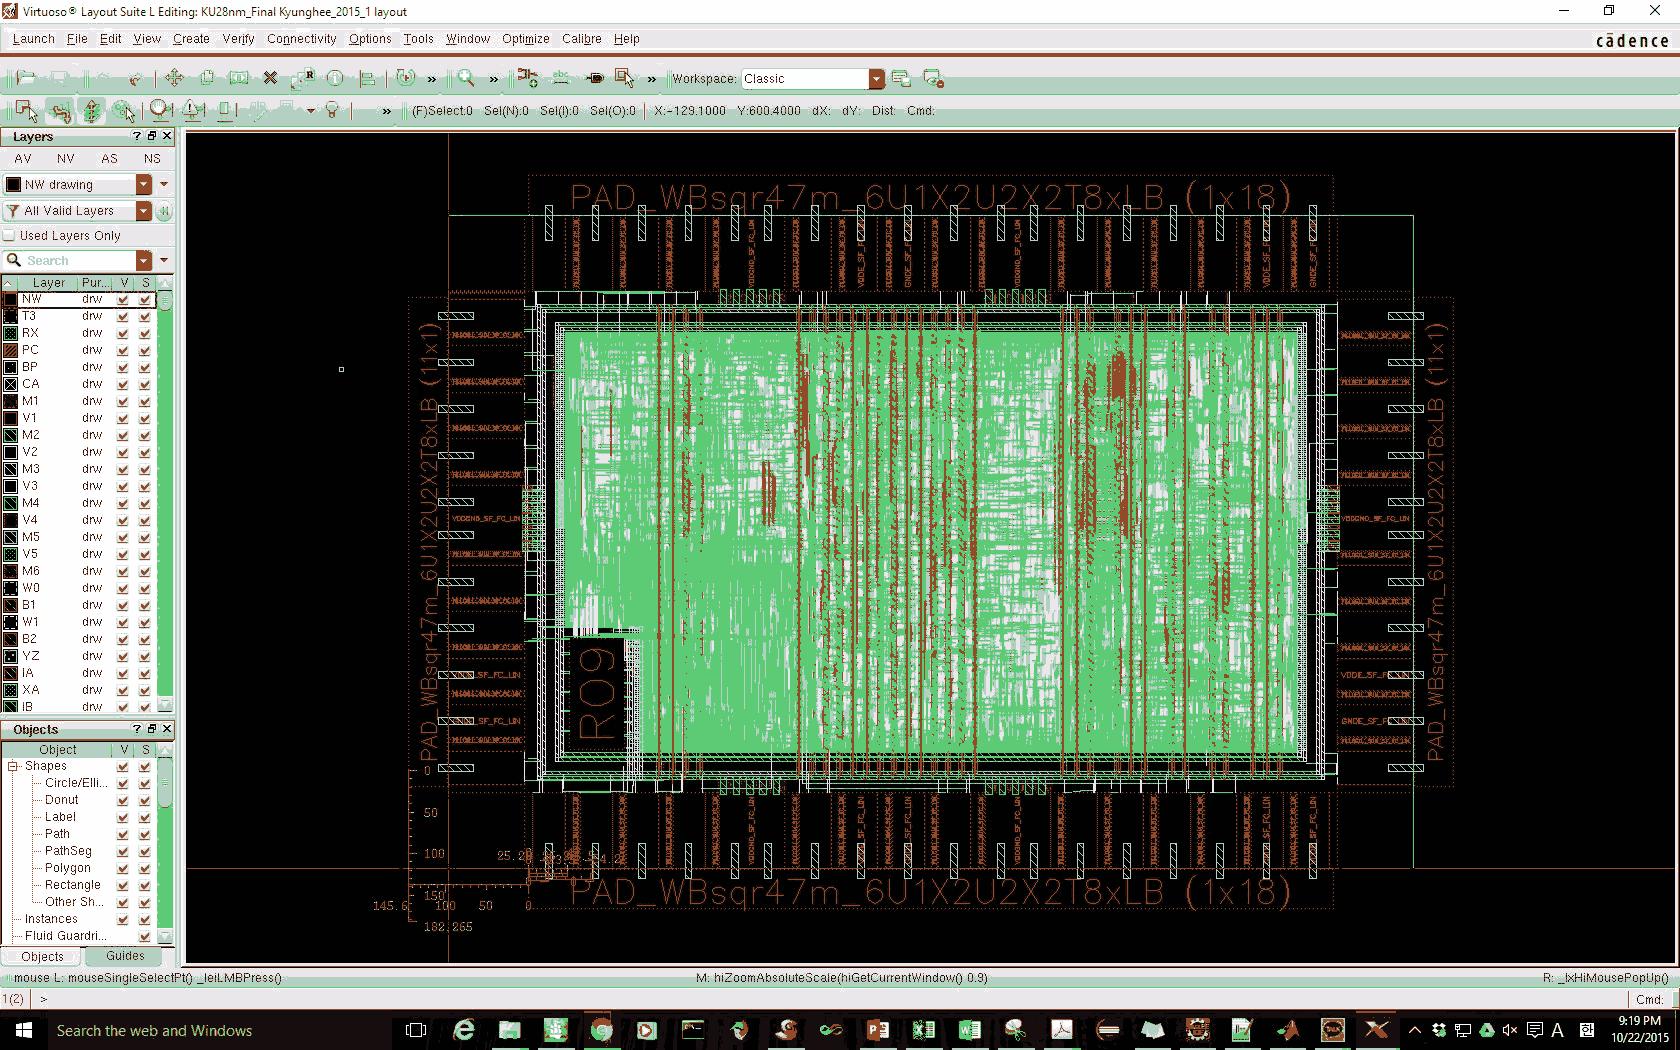 = 8
\stackunder[5pt]
= 8
\stackunder[5pt]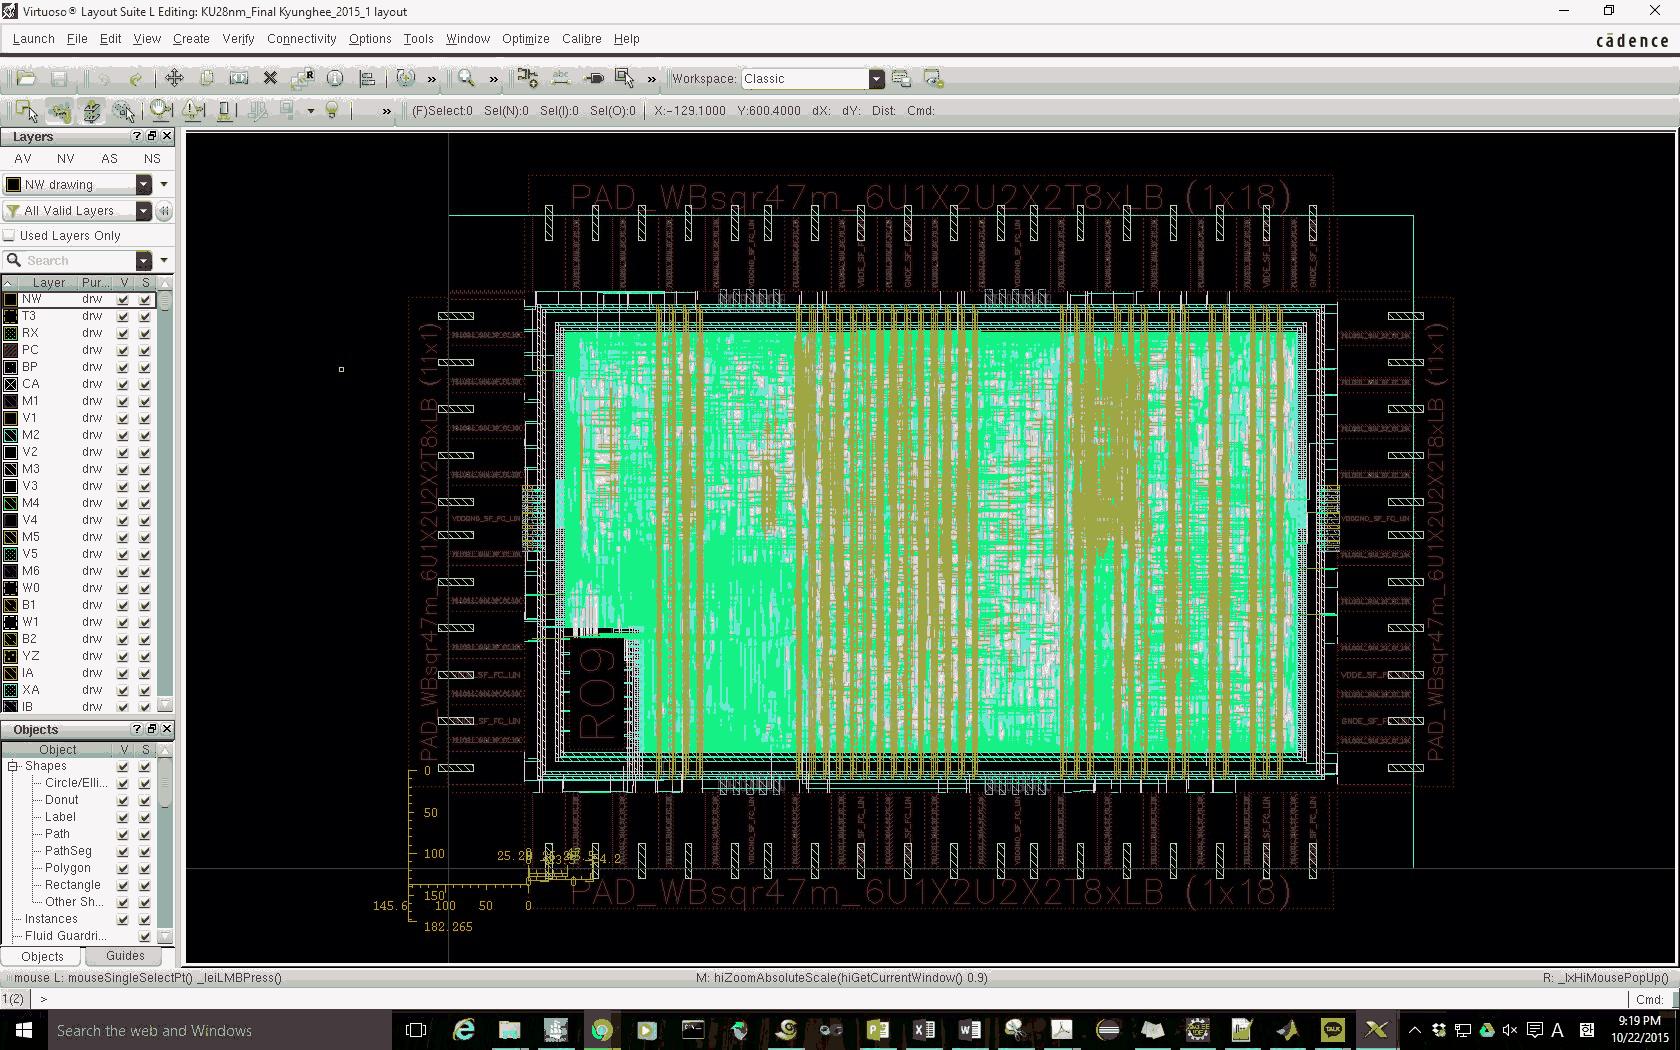 = 16
\stackunder[5pt]
= 16
\stackunder[5pt]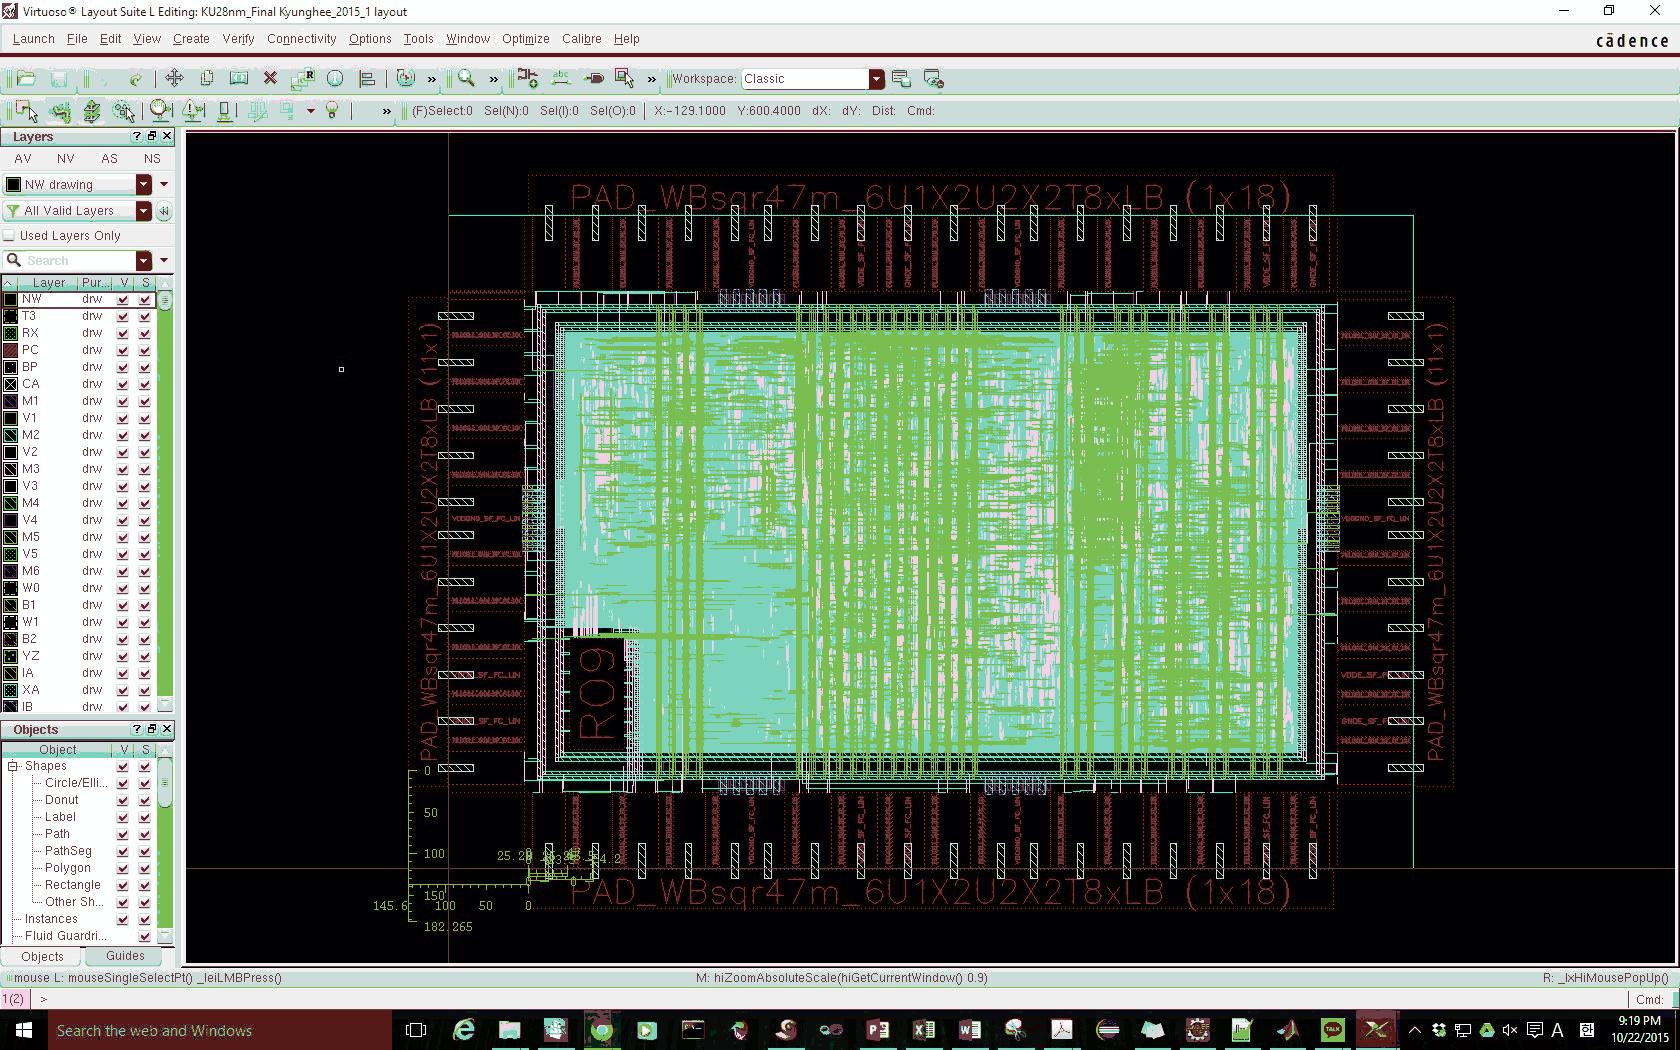 = 32
\stackunder[5pt]
= 32
\stackunder[5pt] = 64
\stackunder[5pt]
= 64
\stackunder[5pt] = 128
= 128
| 1. Zebra Buffterfly (300x212) - 27.4 kB | |||||
| Image Size (kB) | |||||
| PSNR (dB) | |||||
| CS | |||||
| 2. Boston Street (590x430) - 69.2 kB | |||||
| Image Size (kB) | |||||
| PSNR (dB) | |||||
| CS | |||||
| 3. Conference Room (600x450) - 61.4 kB | |||||
| Image Size (kB) | |||||
| PSNR (dB) | |||||
| CS | |||||
| 4. Airport (745x258) - 46.2 kB | |||||
| Image Size (kB) | |||||
| PSNR (dB) | |||||
| CS | |||||
| 5. Oxford Outdoor (1536x2048) - 1.21 MB | |||||
| Image Size (kB) | |||||
| PSNR (dB) | |||||
| CS | |||||
| 6. Chip Designer (1680x1050) - 503 kB | |||||
| Image Size (kB) | |||||
| PSNR (dB) | |||||
| CS | |||||
| 7. Angry Bird (1920x1080) - 153 kB | |||||
| Image Size (kB) | |||||
| PSNR (dB) | |||||
| CS | |||||
References
- (1) Nguyen Thuy An, Cong-Thinh Huynh, ByungKwan Lee, Choong Seon Hong and Eui-Nam Huh, An efficient block classification for media healthcare service in mobile cloud computing, Multimedia Tools Application, 74(14), pp 5209-5223 (2015)
- (2) Bayliss, E., Steiner, J.F., Fernald, D.H., Crane, L.A. and Main, D.S, Descriptions of barriers to self-care by persons with comorbid chronic diseases, Annals of Family Medicine, 1(1), pp 15-21 (2003)
- (3) P. Ross, Cloud computing’s killer app: Gaming, IEEE Spectrum, 46(3), (2003)
- (4) Yu-Chun Chang, Po-Han Tseng, Kuan-Ta Chen and Chin-Laung Lei, Understanding The Performance of Thin-Client Gaming, IEEE Communications Quality and Reliability (CQR), pp 1-6, Naples (2011)
- (5) Richardson T, Stafford-Fraser Q, Wood KR and Hopper A, Virtual network computing, Internet Computing IEEE, 2(1), pp 33-38, (2002)
- (6) Manpreet Kaur, Usvir Kaur, Comparison Between K-Mean and Hierarchical Algorithm Using Query Redirection, International Journal of Advanced Research in Computer Science and Software Engineering, Volume 3, Issue 7, (2013)
- (7) Sheng Feng Li, Quentin Stafford, Fraser and Andy Hopper, Integrating Synchronous and Asynchronous Collaboration with Virtual Network Computing, Internet Computing IEEE, 4(3), pp 26-33, (2002)
- (8) Windows Remote Desktop Protocol (RDP), https://msdn.microsoft.com/en-us/library/aa383015(v=vs.85).aspx
- (9) Wikipedia, Independent Computing Architecture (ICA), https://msdn.microsoft.com/en-us/library/aa383015(v=vs.85).aspx
- (10) Shen H, Lu Y, Wu F and Li S, A high-performance remote computing platform, Pervasive computing and communications, pp 1-6, Naples (2009)
- (11) Juliet SE and Florinabel DJ, Efficient block prediction-based coding of computer screen images with precise block classification, Image Processing IET, pp 306-314, (2011)
- (12) Wang Jing, Guan Xuetao and Zhang Yang, An Adaptive Encoding Application Sharing System Based on Remote Display Wang, Third International Conference on Intelligent System Design and Engineering Applications, pp 266-269, (2013)
- (13) Kouji Nishimura, Kaori Maeda and Reiji Aibara, Real-Time Camera Control for Videoconferencing over the Internet Kouji, Real-Time Computing Systems and Applications. Fifth International Conference on, p 121-124, Hiroshima (2011)
- (14) Tizon N, Moreno C, Cernea M and Preda M, MPEG-4-based adaptive remote rendering for video games, Proceedings of the 16th international conference on 3D web technology, pp 45-50, USA (2011)
- (15) Simoens P, Praet P, Vankeirsbilck B, DeWachter J, Deboosere L, De Turck F, Dhoedt B and Demeester P, Design and implementation of a hybrid remote display protocol to optimize multimedia experience on thin client devices, Telecommunication networks and applications conference, pp 391-396, Australasian, (2008)
- (16) Information technology, Coding of Audio-visual Objects – Part 2: Visual, International Organization for Standardization, ISO/IEC 14496-2:1999/Amd.1:2000(E), (2000)
- (17) Information technology, Coding of audio-visual objects – Part 10: Advanced Video Coding, ISO/IEC 14496-10:2003, (2003)
- (18) Yan Lu, Shipeng Li, and Huifeng Shen, Virtualized Screen: A Third Element for Cloud; Mobile Convergence, MultiMedia IEEE, 18(2), pp 4-11, (2011)
- (19) T.F. Abdelzaher, K.G. Shin, and N. Bhatti, “Performance Guaran- tees for Web Server End-Systems: A Control-Theoretical Approach, IEEE Trans. Parallel and Distributed Systems, 13(1), pp 80-96, (2002)
- (20) Y. Lu, T.F. Abdelzaher, C. Lu, L. Sha, and X. Liu, “Feedback Control with Queueing-Theoretic Prediction for Relative Delay Guarantees in Web Servers, Proc. IEEE Real-Time and Embedded Technology and Applications Symp, pp 208-217, (2003)
- (21) J. Almeida, M. Dabu, A. Manikutty, and P. Cao, Providing Differentiated Levels of Service in Web Content Hosting, Proc. ACM SIGMETRICS Workshop Internet Server Performance, pp 91-102, (1998)
- (22) P. Bhoj, S. Ramanathan, and S. Singhal, Web2K: Bringing QoS to Web Servers, Technical Report HPL-2000-61, HP Laboratories, (2000)
- (23) J.M. Blanquer, A. Batchelli, K. Schauser, and R. Wolski, Quorum: Flexible Quality of Service for Internet Services, Proc. Symp. Networked Systems Design and Implementation, (1998)
- (24) C. Lu, T.F. Abdelzaher, J.A. Sankovic, and S.H. Son, A Feedback Control Approach for Guaranteeing Relative Delays in Web Servers, Proc. IEEE Real-Time and Embedded Technology and Applications Symp, (2001)
- (25) Yan Lu, Shipeng Li, and Huifeng Shen, Virtualized Screen: A Third Element for Cloud; Mobile Convergence, MultiMedia IEEE, 18(2), pp 4-11, (2011)
- (26) L. Sha, X. Liu, Y. Lu, T.F. Abdelzaher, Queueing Model Based Network Server Performance Control, Proc. IEEE Real-Time Systems Symp, pp 81-90, (2002)
- (27) B. Urgaonkar, P. Shenoy, Cataclysm: Handling Extreme Over- loads in Internet Applications, Proc. Int’l World Wide Web Conf, (2005)
- (28) M. Welsh and D. Culler, Adaptive Overload Control for Busy Internet Servers, Proc. USENIX Symp. Internet Technologies and Systems, (2003)
- (29) S. Blake, D. Black, M. Carlson, E. Davies, Z.Wang, and W. Weiss, An Architecture for Differentiated Services, IETF, RFC 2475, (1998)
- (30) D. Grossman, New Terminology and Clarifications for Diffserv,RFC 3260, (2002)
- (31) C. Dovrolis, D. Stiliadis, and P. Ramanathan, Proportional Differentiated Services: Delay Differentiation and Packet Scheduling, IEEE/ACM Trans. Networking, 10(1), pp 12-26, (2002)
- (32) M.E. Gendy, A. Bose, S.-T. Park, and K.G. Shin, Paving the First Mile for QoS-Dependent Applications and Appliances, Proc. Int’l Workshop Quality of Service, pp 245-254, (2004)
- (33) J. Kaur and H. Vin, Providing Deterministic End-to-End Fairness Guarantees in Core-Stateless Networks, Proc. Int’l Workshop Quality of Service, pp 401-421, (2003)
- (34) W. Sun and K.G. Shin, Coordinated Aggregate Scheduling for Improving End-to-End Delay Performance, Proc. Int’l Workshop Quality of Service, (2004)
- (35) Tien-Dung Nguyen, Pham Phuoc Hung, Tran Hoang Dai, Nguyen Huu Quoc, Cong-Thinh Huynh and Eui-Nam Huh, Prediction-based energy policy for mobile virtual desktop infrastructure in a cloud environment, Information Sciences, pp 132-151, (2015)
- (36) B. C. Russell, A. Torralba, K. P. Murphy, W. T. Freeman and LabelMe, A database and web-based tool for image annotation, International Journal of Computer Vision, pp 157-173, (2008)
- (37) C. Amerijckx, J. D. Legaty and M. Verleysenz, Image Compression Using Self-Organizing Maps, Systems Analysis Modeling Simulation, 43(11), pp 1529-1543, (2003)
- (38) A.Namphol, S.Chin and M. Arozullah, Image compression with a hierarchical neural network, IEEE Trans. Aerospace Electronic Systems, 32(1), (1996)
- (39) Fradkin, D. Muchnik, I.B.Streltsov and S., Image compression in real-time multiprocessor systems using divisive K-means clustering, IEMC ’03 Proceedings. Managing Technologically Driven Organizations: The Human Side of Innovation and Change, (2003)
- (40) Somasundaram, K. and Mary Shanthi Rani, M., Novel K-means Algorithm for Compressing Images, International Journal of Computer Applications, 18(8), pp 9-13, (2011)
- (41) Somasundaram, K and Rani, M Mary Shanthi, Eigen Value based K-means Clustering for Image Compression, International Journal of Applied Information Systems (IJAIS), 3(7), pp 21-24, USA (2011)
- (42) Nazeer and Kaa, Improving the Accuracy and Efficiency of the k-means Clustering Algorithm, Proceedings of the World Congress on, pp 1-5, (2009)
- (43) Zhang. Zhe, Zhang. Junxi .Xue and Huifeng, Improved K-Means Clustering Algorithm, 2008 Congress on Image and Signal Processing, pp 169-172, (2008)
- (44) Jiawei Han M. K, Data Mining Concepts and Techniques, Morgan Kaufmann Publishers Inc, (2006)
- (45) Margaret H. Dunham, Data Mining- Introductory and Advanced Concepts, Pearson Education, (2008)
- (46) McQueen J, Some methods for classification and analysis of multivariate observations, Proc. 5th Berkeley Symp. Math. Statist. Prob, pp 281-297, (2008)
- (47) M. Emre Celebi, Fast Color Quantization Using Weighted Sort-Means Clustering, Journal of the Optical Society of America, 26(11), pp 2434-2443, (2009)
- (48) MacQueen J, Some methods for classification and analysis of multi-variate observations, Proceedings of the 5th Berkeley Symposium on Mathematics Statistic Problem, pp 281-297, (1967)
- (49) Wikipedia, Euclidean distance, https:/en.wikipedia.orgwikiEuclidean_distance
- (50) D. Aloise, A. Deshpande, P. Hansen and P. Popat, NP-Hardness of Euclidean Sum-of-Squares Clustering, Machine Learning, 75(2), pp 245-248, (2009)
- (51) M.Mahajan, P. Nimbhorkar and K. Varadarajan, The Planar k-Means Problem is NP-hard, Theoretical Computer Science, (2010)
- (52) S. Lloyd, Least Squares Quantization in PCM, IEEE Trans. on Information Theory, 28(2), pp 129-136, (2010)
- (53) E. Forgy, Cluster Analysis of Multivariate Data: Efficiency vs. Interpretability of Classificatio, Biometrics 21, (1965)
- (54) Victoria J. Hodge and Jim Austin, A Survey of Outlier Detection Methodologies, Kluwer Academic Publishers, CiteSeerX, (2004)
- (55) OpenStack, OpenStack Cloud Software, http://www.openstack.org/, (2014)