A hidden population of massive black holes in simulated dwarf galaxies
Abstract
We explore the characteristics of actively accreting MBHs within dwarf galaxies in the Romulus25 cosmological hydrodynamic simulation. We examine the MBH occupation fraction, x-ray active fractions, and AGN scaling relations within dwarf galaxies of stellar mass out to redshift . In the local universe, the MBH occupation fraction is consistent with observed constraints, dropping below unity at , . Local dwarf AGN in Romulus25 follow observed scaling relations between AGN x-ray luminosity, stellar mass, and star formation rate, though they exhibit slightly higher active fractions and number densities than comparable x-ray observations. Since , the MBH occupation fraction has decreased, the population of dwarf AGN has become overall less luminous, and as a result, the overall number density of dwarf AGN has diminished. We predict the existence of a large population of MBHs in the local universe with low x-ray luminosities and high contamination from x-ray binaries and the hot interstellar medium that are undetectable by current x-ray surveys. These hidden MBHs make up of all MBHs in local dwarf galaxies, and include many MBHs that are undermassive relative to their host galaxy’s stellar mass. Their detection relies not only on greater instrument sensitivity but on better modeling of x-ray contaminants or multi-wavelength surveys. Our results indicate dwarf AGN were substantially more active in the past despite being low-luminosity today, and indicate future deep x-ray surveys may uncover many hidden MBHs in dwarf galaxies out to at least .
1 Introduction
Observations over the past two decades have begun to explore the prevalence of massive black holes (MBHs) in dwarf galaxies (Shields et al., 2008; Reines et al., 2013; Moran et al., 2014; Miller et al., 2015; Trump et al., 2015; Nguyen et al., 2018; Kaviraj et al., 2019; Baldassare et al., 2020). There are now many observations out to that indicate dwarf galaxies are capable of hosting actively accreting MBHs (Reines et al., 2013; Lemons et al., 2015; Reines & Volonteri, 2015; Pardo et al., 2016; Baldassare et al., 2017; Ahn et al., 2018; Baldassare et al., 2018; Martín-Navarro & Mezcua, 2018; Mezcua et al., 2018; Birchall et al., 2020; Molina et al., 2021b), albeit at lower luminosities than in massive galaxies (Kormendy & Ho, 2013). Recent studies have leveraged the observed active galactic nuclei (AGN) fraction into constraints on the occupation fraction of MBHs in dwarf galaxies (Trump et al., 2015; Miller et al., 2015; Mezcua et al., 2018; Baldassare et al., 2020; Birchall et al., 2020).
Dwarf galaxies in the local universe provide a laboratory for studying how MBHs may have formed and grown in the early universe. Theoretical work suggests that MBHs in local dwarf galaxies have grown little relative to those found in massive galaxies (Volonteri et al., 2008; Bellovary et al., 2019). Hence MBHs in dwarf galaxies may provide insight into the early conditions of MBH seeding and growth, potentially explaining the origin of supermassive black holes found in the early universe (e.g, Vestergaard & Osmer, 2009; Willott et al., 2010; Mortlock et al., 2011; Venemans et al., 2013; Wu et al., 2015). Several mechanisms have been proposed which form either light seeds (Devecchi & Volonteri, 2009; Davies et al., 2011; Whalen & Fryer, 2012; Madau et al., 2014; Katz et al., 2015; Taylor & Kobayashi, 2014; Yajima & Khochfar, 2016) or heavy seeds (Begelman et al., 2006; Johnson et al., 2013; Ferrara et al., 2014). Each formation mechanism requires different density and metallicity characteristics of the local environment, and may ultimately imprint themselves on the MBH occupation fraction or mass function (Lodato & Natarajan, 2006; Volonteri & Natarajan, 2009; Ricarte & Natarajan, 2018). See Volonteri (2010, 2012); Latif & Ferrara (2016); Greene et al. (2020) for in-depth reviews of MBH seeding mechanisms.
MBHs within dwarf galaxies are difficult to detect outside the local universe because of their small sphere of influence (of order pc for an MBH of mass ). A small sphere of influence will 1) necessitate high resolving power in order to make dynamical MBH detections, and 2) restrict accretion rates, leading to less AGN activity and hence lower likelihood of detection (Baldassare et al., 2016). Recent searches for MBHs in dwarf galaxies have thus relied on searching for AGN via optical emission-line diagnostics (Barth et al., 2004; Greene & Ho, 2004; Peterson et al., 2005; Greene & Ho, 2007; Reines et al., 2013; La Franca et al., 2015; Sartori et al., 2015; Bentz et al., 2016b, a; Marleau et al., 2017; Onori et al., 2017; Chilingarian et al., 2018), IR color selection (Satyapal et al., 2014), IR/optical coronal line emission (Satyapal et al., 2007, 2008, 2009; Cann et al., 2018, 2020, 2021; Satyapal et al., 2021; Molina et al., 2021a; Bohn et al., 2021), nuclear x-ray emission (Mezcua et al., 2018; Birchall et al., 2020), and optical variability (Heinis et al., 2016; Baldassare et al., 2020). See Mezcua (2017) for an overview of the various techniques for observing dwarf AGN.
Observations indicate AGN may play a role in dwarf galaxy evolution by impacting cold star-forming gas, reminiscent of the feedback found in massive galaxies (Fabian, 2012; Kormendy & Ho, 2013; Somerville & Davé, 2015). Bradford et al. (2018) connect AGN-like line ratios to H i gas depletion and quiescence in galaxies in the ALFALFA % survey (Haynes et al., 2011). Penny et al. (2018) identify ionized gas kinematically-offset from stars in SDSS-IV AGN with stellar masses . Manzano-King et al. (2019) find dwarf AGN with high velocity ionized gas outflows, where have outflows with AGN-like line ratios. Dickey et al. (2019) detect AGN-like hard-ionizing radiation in of low-mass, isolated, quiescent galaxies with stellar masses . Liu et al. (2020) identify high-velocity, AGN-driven outflows in dwarf galaxies, where a small portion of outflowing material appear to escape into the circumgalactic medium.
On the theory side, the question of AGN impact on dwarf galaxy evolution has yielded mixed results. Cosmological simulations have historically ignored AGN in dwarf galaxies due to resolution limitations, or assumptions on the inefficiency of AGN feedback in low-mass galaxies (e.g, Sijacki et al., 2015). Only in recent years has it become more common to allow MBHs to form in galaxies below within cosmological simulations (e.g, Habouzit et al., 2017). Analytical models have found that dwarf AGN can eject gas with higher efficiencies than supernovae (Dashyan et al., 2018). Such a mechanism may help resolve certain anomalies in concordance CDM cosmology (Silk, 2017). Koudmani et al. (2019) explore the impact of AGN feedback by applying various AGN activity models to a high-resolution isolated dwarf galaxy simulation. They find that dwarf AGN do not directly impact star formation but do drive hotter, faster outflows that may inhibit gas inflows. Using cosmological hydrodynamic simulations, Barai & de Gouveia Dal Pino (2019) detect early star formation suppression via AGN feedback. Sharma et al. (2020) find that Romulus25 dwarf galaxies that form relatively over-massive MBHs exhibit both suppressed star formation and depleted H i gas. Koudmani et al. (2021) use the FABLE cosmological simulation to study population statistics of AGN in dwarf galaxies. They find AGN can drive the kinematic misalignment between ionized gas and stars observed by Penny et al. (2018).
On the other hand, many cosmological hydrodynamic simulations indicate that strong supernova (SN) feedback will disperse gas in the central regions of dwarf galaxies and preemptively halt accretion onto the MBH (Dubois et al., 2015; Bower et al., 2017; Anglés-Alcázar et al., 2017; Habouzit et al., 2017; Trebitsch et al., 2018; Barausse et al., 2020). The MBH can only begin growing again once the halo grows large enough to confine gas inflows. In particular, Habouzit et al. (2017) find that early, strong supernova feedback is an important ingredient to suppress MBH growth and match the observed relation in dwarf galaxies. Their SN feedback model drives winds that sweep away star-forming gas, thereby cutting off early MBH accretion. They find that a weaker thermal SN feedback model allows the MBHs to constantly grow, likely growing too large at low redshift. Barausse et al. (2020) find that MBH growth regulated by SN feedback is important for matching the bolometric luminosity function at high redshift. SN feedback suppresses MBH growth and reduces the number of low-luminosity AGN, particularly in simulations with light seeding mechanisms.
Recent analyses have shed light on the ability of cosmological simulations to model the low-mass MBHs found in low-mass galaxies. Haidar et al. (2022) perform a comparison of six large-scale cosmological simulations, finding that simulations tend to produce MBHs over-massive relative to their host galaxies. Their results indicate simulations typically power too many AGN relative to observations, which may result from generating over-massive MBHs that consistently over-accrete, or may indicate that MBHs in dwarf galaxies are more obscured than previously thought. They suggest that tighter constraints on the AGN fraction from future x-ray facilities may better illuminate the true prevalence of MBHs among low-mass galaxies. However, contamination from x-ray binaries and the hot interstellar medium will likely impact the detection of AGN with total x-ray luminosities fainter than erg s-1 . Similarly, Schirra et al. (2021) analyze the properties of faint AGN among four large-scale cosmological simulations, finding that the properties of low-luminosity AGN hosts differ strongly between simulations. Their results show that the population of low-luminosity AGN in some simulations are powered by MBHs in massive galaxies , while in other simulations they are powered by lower-mass MBHs in low-mass galaxies . These differences may be attributable to differing efficiencies of AGN feedback within each simulation. Regardless, nearly all simulations overestimate the total x-ray luminosity (AGN + non-AGN emission) in star-forming galaxies relative to observations.
In this work, we explore the properties of actively growing MBHs in dwarf galaxies out to in the Romulus25 cosmological simulation. We select dwarf galaxies between , straddling the mass threshold below which the effects of SN feedback are often thought to dominate over AGN feedback, (e.g, Habouzit et al., 2017). Romulus25 is one of the rare examples of large, high resolution, cosmological hydrodynamic simulations capable of resolving the evolution of dwarf galaxies as small as , while also modelling MBH growth and dynamics within these galaxies. The TNG-50 (Nelson et al., 2019; Pillepich et al., 2019) and FABLE (Henden et al., 2018) simulations reach comparable resolution, but a simplistic MBH seeding mechanism that will only track MBHs in more massive dwarfs at late times. These simulations also do not realistically follow the dynamical evolution of MBHs. The NewHorizon simulation (Volonteri et al., 2020; Dubois et al., 2021), which re-simulates a region of Horizon-AGN (Dubois et al., 2014) at higher resolution, is most comparable to Romulus25 as it allows MBHs to exist widely within well-resolved, low-mass galaxies while also implementing a prescription for gas dynamical friction (though, see Pfister et al. (2019) for a discussion on the effectiveness of gas dynamical friction relative to that of stars and dark matter). Our analysis provides insight into the prevalence of MBHs and their emitting characteristics across time. With this information, we may further learn more about the impact AGN may have on the evolution of dwarf galaxies.
In Section 2 we describe the physics of the Romulus25 cosmological simulation, including the resultant MBH occupation fraction. In Section 3.1 we consider local scaling relations between , and SFR. In Section 3.2 we explore the evolution of active fractions across time. In Section 3.3, we predict a population of MBHs with low x-ray luminosities and high contamination by x-ray binaries and the hot interstellar medium. In Section 3.4 we report on the number densities of MBHs, both hidden and visible, as well as AGN out to . We summarize our findings in Section 5.
2 Simulation
We now summarize the relevant aspects of the Romulus25 cosmological hydrodynamic simulation. See Tremmel et al. (2017) for a full description of the physical prescriptions.
The Romulus suite of cosmological hydrodynamic simulations, including Romulus25 (Tremmel et al., 2017) and RomulusC (Tremmel et al., 2019), were run with the N-Body + Smooth Particle Hydrodynamics (SPH) code ChaNGa (Menon et al., 2015; Wadsley et al., 2017). In this work, we focus on the Romulus25 ( Mpc)3 uniform-resolution volume. In Romulus25, dark matter particles have a mass of , gas particles have a mass of , and particles have a Plummer equivalent force softening of pc. Romulus25 contains more dark matter particles than gas particles to better resolve MBH dynamics (Tremmel et al., 2015). The simulations were run with a Planck 2014 CDM cosmology, with , , , and , (Planck Collaboration et al., 2014).
Throughout our analysis, we adjust simulated stellar masses with corrections from Munshi et al. (2013) that account for the impact of aperture photometry on observed stellar masses, such that . These corrections allow us to perform a more direct comparison between simulated and observed stellar masses. Romulus25 resolves galaxies down to corrected stellar masses .
2.1 Star Formation
Stars in Romulus25 form according to a star formation efficiency when cold gas has a density that exceeds a threshold for star formation.
-
•
Star formation efficiency ,
-
•
Gas density threshold mp cm-3,
-
•
Gas temperature K.
Additionally, erg of thermal energy is deposited in the ISM by SN II following the ‘blastwave’ mechanism (Stinson et al., 2006). Cooling is shut off in the gas particles that receive SN II energy for a time period representing the adiabatic expansion phase of a blastwave SN remnant.
These star formation parameters were tuned using a set of zoom-in simulations of halos with halo masses . A set of parameters were chosen by their ability to reproduce scaling relationships between stellar mass, halo mass, H i gas mass, and angular momentum (Moster et al., 2013; Obreschkow & Glazebrook, 2014; Cannon et al., 2011; Haynes et al., 2011).
Prescriptions for metal diffusion (Shen et al., 2010), thermal diffusion (Wadsley et al., 2017), and low-temperature radiative cooling (Guedes et al., 2011) are also included in Romulus25, with a Kroupa (2001) initial mass function for stars. Romulus25 does not include high temperature metal cooling, which should not have an effect in low mass halos with typically low metallicity gas (see Tremmel et al. (2019) for a more detailed discussion).
2.2 Black Hole Physics
MBHs in Romulus25 are seeded according to local, pre-collapse gas properties with thresholds and seed mass similar to a direct-collapse model (Haiman, 2013; Greene et al., 2020). A star-forming gas particle is instead marked to form a MBH if it meets the following criteria:
-
•
Low metallicity, ,
-
•
Gas density threshold, mp cm-3,
-
•
Temperature, K,
effectively restricting BH creation to high-density regions in the early universe. If these criteria are met, the gas particle forms an MBH with mass , accreting mass from nearby gas particles. This seed mass is somewhat higher than theoretical estimates (e.g, Volonteri, 2012). The high seed mass for MBHs allows us to well-resolve their dynamics over cosmic time (Tremmel et al., 2015, see below). Additionally, the early growth onto MBH progenitors may exceed yr-1, and is governed by processes below the resolution limits of the simulation (Hosokawa et al., 2013; Schleicher et al., 2013). In Romulus25, of MBHs form within the first Gyr of the simulation (Tremmel et al., 2017).
Romulus25 employs prescriptions for MBH dynamical friction that produce realistic MBH sinking timescales (Tremmel et al., 2015). This sub-grid model allows MBHs in large halos to stay centered (Kazantzidis et al., 2005; Pfister et al., 2017), but also allows some MBHs to “wander” within sufficiently shallow potentials, as has been discovered in recent observations (Reines et al., 2020) and simulations (e.g, Tremmel et al., 2018; Bellovary et al., 2019; Ricarte et al., 2021b, a; Bellovary et al., 2021). The dynamical friction prescriptions along with the “oversampling” of dark matter particles, the high seed mass, and high resolution of Romulus25 together help avoid unrealistic numerical heating of MBHs and help ensure accurate MBH dynamics.
MBH feedback takes the form of thermal energy injection into the surrounding environment. Thermal energy from the MBH, , is isotropically injected into the nearest gas particles in some time, , following:
| (1) |
where is the radiative efficiency, is the energy injection efficiency, and is the MBH accretion rate.
Accretion itself follows a modified Bondi-Hoyle prescription to incorporate angular momentum on unresolved spatial scales. The “instantaneous” accretion is averaged over the smallest simulation time element, typically yr, and remains Eddington limited at all times. We can write the accretion rate depending on whether the dominant gas motion is rotational, , or bulk flow, :
| (2) |
where
is the density-dependent boost factor that corrects for underestimated accretion rates due to resolution limitations (Booth & Schaye, 2009), is the corresponding boost coefficient, is the number density of the surrounding gas, is the star formation density threshold, is the mass density of the surrounding gas, is the local sound speed, is the rotational velocity of the surrounding gas at the smallest resolved scales, and is the bulk velocity of the surrounding gas. This calculation is performed over the 32 nearest particles. Free parameters related to accretion and feedback were optimized to reproduce various empirical scaling relations for low mass halos at (Tremmel et al., 2017), including the observed relationship between MBH mass and stellar mass (Schramm & Silverman, 2013).
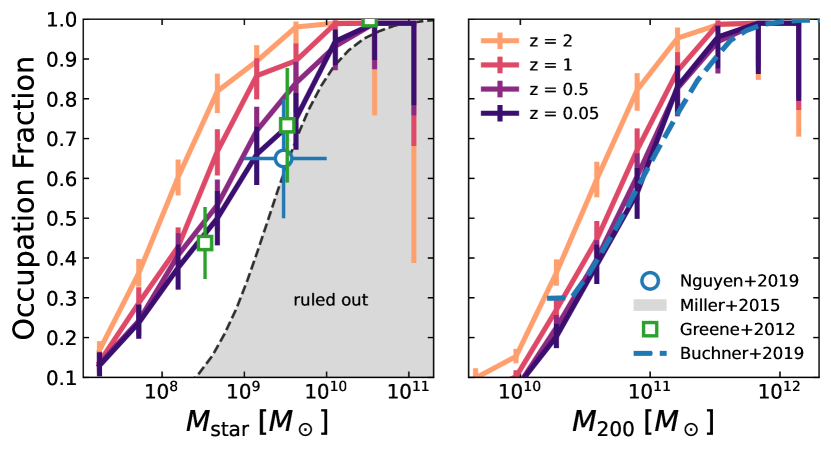
Figure 1 illustrates the evolution of the MBH occupation fraction in Romulus25, where the occupation fraction is defined as the fraction of halos of a given stellar/halo mass containing at least one MBH within the inner kpc. We do not include MBHs within substructure of the primary halo. The high-redshift MBH occupation fraction is determined by the seeding mechanism, while the time evolution is primarily driven by structure growth. We show the occupation fraction as both a function of stellar mass and halo mass. At , the MBH occupation fraction drops below unity at , .
The local occupation fraction is consistent with constraints from observations and empirical modelling. Dynamical MBH mass estimates (Nguyen et al., 2019) place the occupation fraction between % for dwarf galaxies between . X-ray selected AGN (Miller et al., 2015) provide lower limits on the occupation fraction as a function of stellar mass. Greene (2012) estimate the occupation fraction using x-ray observations of optically selected AGN with , as estimated from the relation (Desroches et al., 2009). Baldassare et al. (2020, not shown) use variability of optical light curves from the NASA–Sloan Atlas with Palomar Transient Factory coverage to identify local, low-mass AGN. They find that AGN variability fractions are approximately constant down to stellar masses , suggesting the MBH occupation fraction does not change much between , consistent with our estimates. The local occupation fraction also agrees with occupation fractions from Buchner et al. (2019, ), who use empirical models to explore valid regions of the parameter space of critical halo mass versus MBH seed probability.
2.3 Halo and Galaxy Extraction
We use the Amiga Halo Finder (Knollmann & Knebe, 2009) to extract gravitationally bound dark matter halos, as well as sub-halos, and the baryonic content associated with these structures. AHF utilizes a spherical top-hat collapse technique to define the virial radius (Rvir) and mass (Mvir) of each halo and sub-halo. AHF uses a spherical top-hat collapse technique to define the virial radius and total mass of each halo. The center of each halo/galaxy is calculated using a shrinking spheres approach (Power et al., 2003).
3 Results
In this work, we are primarily interested in dwarf galaxies between corrected stellar masses at redshifts . Aside from encompassing the regime where feedback is thought to change from AGN-dominated to SN-dominated (Habouzit et al., 2017), these limits are also similar to the ranges for dwarf AGN observed to date (e.g, Mezcua et al., 2018; Birchall et al., 2020, 2022).
Galaxies in Romulus25 frequently host multiple MBHs, and some galaxies have been found to host “wandering” MBHs at large radii from the center (Tremmel et al., 2018; Ricarte et al., 2021a, b). We restrict our sample to MBHs within kpc of the halo center, similar to the optical counterpart search radius from Birchall et al. (2020). In cases where there are multiple MBHs within the central region, we choose the most luminous. This choice is nearly always (% of the time) the same as choosing the most massive or most central MBH.
At low stellar masses in Romulus25, MBH seed masses often make up the majority of the total MBH mass. Further, the simulation does not impose restrictions on seeding multiple MBHs within close proximity, sometimes allowing multiple seeds to rapidly merge at high redshift. (Ricarte et al., 2019). When reporting on MBH masses, we subtract off the seed masses of all progenitor MBHs from the final mass such that:
| (3) |
Subtracting off all progenitor seed masses maintains the accreted mass from MBHs merging onto the main progenitor, but removes the contribution from seeding. Ricarte et al. (2019) find that MBHs in Romulus25 with total masses are dominated by accretion, and that the accreted MBH mass follows the observed relation down to dwarf galaxy scales. This result suggests that the accreted MBH mass may be a more realistic proxy for the true MBH mass within dwarf galaxies in Romulus25, (although, see Bellovary et al., 2019, for a discussion on MBH accretion properties in high resolution dwarf galaxy simulations.). It is important to note that without these adjustments, the total MBH masses in low-mass Romulus25 galaxies are over-massive compared to observed scaling relations (Sharma et al., 2020), which indicates the seed masses are unrealistically large. It is possible that the fiducial Bondi accretion model within Romulus25 is unsuitable for modeling accretion in dwarf galaxies – an alternate accretion model that allows for the same growth with lower seed masses may be more realistic.
In order to calculate bolometric luminosities for MBHs, we follow the Churazov et al. (2005) two-mode accretion model that distinguishes between radiatively efficient and inefficient AGN. Many simulations, including Romulus25, use a single, radiatively efficient accretion model for internally calculating feedback (Hirschmann et al., 2014). Using a two-mode accretion model in post-processing reduces the number of low-luminosity AGN, though it misses the feedback effects of radiatively inefficient AGN. We convert the instantaneous accretion rate, , such that:
| (4) |
with radiative efficiency and Eddington fraction . Note that we calculate the Eddington fraction using the accreted MBH mass, , and hence is higher than when calculated using the total MBH mass. In the two-mode accretion model, higher leads to higher luminosities (and hence higher, more conservative estimates of the active fractions in Section 3.2) among radiatively inefficient AGN. To estimate x-ray luminosities, , between keV, we apply Shen et al. (2020) bolometric corrections in the soft and hard x-ray bands.
As done in Koudmani et al. (2021); Haidar et al. (2022), we calculate mock x-ray luminosities for dwarf galaxies by modeling the contributions from x-ray binaries (XRBs) and emission from the hot interstellar medium. We model high- and low-mass x-ray binary contributions using the Lehmer et al. (2016) relation:
| (5) |
where for soft x-rays, and for hard x-rays. Emission from hot gas follows the Mineo et al. (2012) relation, which establishes a relationship between ( keV) x-ray luminosity of the diffuse interstellar medium and the star formation rate:
| (6) |
We calculate the hot gas contribution in the hard x-ray band by assuming a photon index . Hence we can write the total ( keV) x-ray luminosity for a galaxy:
| (7) |
In order to more closely compare with observations from Mezcua et al. (2018) and Birchall et al. (2020), we classify AGN in Romulus25 such that their x-ray luminosity is significantly greater than the contribution from non-AGN sources, . We do not model emission from background quasars, which have been found to contaminate observations (e.g, Reines et al., 2020).
Recent work by Kristensen et al. (2021) indicates that among low-mass galaxies in three large-scale cosmological simulations, non-AGN are more likely than AGN to be found in a denser environment with closer galactic neighbors. Their results also indicate that galaxies which maintain close proximity to other galaxies are less likely to exhibit star formation or AGN activity. While we do not show results from subhalos of the target halo in this work, we do not make further selections based on galaxy environment. Although we lose the ability to identify the impact of galaxy environment, we are able to make more direct comparisons with Mezcua et al. (2018) and Birchall et al. (2020), who similarly do not make selections on galaxy environment.
3.1 Dwarfs in the local universe
Dwarf galaxies have been found to exhibit relationships between MBH x-ray luminosity, stellar mass, and star formation rate (SFR) similar to those found in massive galaxies (e.g, Aird et al., 2017, 2018). These relationships may illuminate any connection between MBH activity and star formation, as well as provide insight into how readily dwarf AGN at each mass scale may be observed.
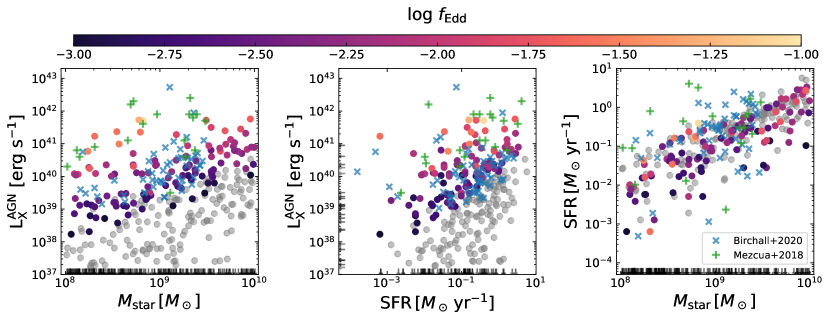
Figure 2 shows the relationships between , , and SFR for dwarf galaxies at that host an MBH in the central kpc. Each point that satisfies the contamination threshold is colored according to the instantaneous Eddington fraction. Dwarfs that fail the contamination threshold are marked in gray. Arrows mark dwarfs with extremely low luminosities or zero star formation, with star formation rates averaged over the past Myr.
We compare our results with x-ray selected dwarf AGN from Mezcua et al. (2018), who identify dwarf AGN between from the Chandra COSMOS-Legacy survey out to , in the full keV band. We only show their sample up to for better comparison with our local dwarfs. We also include results from Birchall et al. (2020) who provide x-ray selected dwarf AGN that fall within both the optical MPA-JHU footprint and x-ray 3XMM footprint. Birchall et al. (2020) identify dwarfs with out to in the harder keV band. Both observational sets calculate the AGN x-ray luminosity by subtracting off contributions to the total x-ray luminosity from XRBs and the hot interstellar medium.
Overall, the scaling relationships between our uncontaminated luminous dwarfs are consistent with observed relations of local dwarf AGN. Simulated dwarfs tend not to reach the highest luminosities found in the observations, erg s-1 , though these observed luminous dwarfs are typically at slightly higher redshifts, . Our dwarfs strike a middle ground between the higher luminosities found in Mezcua et al. (2018) and the lower luminosities found in Birchall et al. (2020), which are at least partially due to the harder x-ray band in which Birchall et al. (2020) observe.
There exists a large population of dwarfs at low luminosities and high contamination () that are not found in observations. These contaminated dwarfs make up of dwarfs with MBHs at . This hidden population that is missed by observations suggests that typical relationships between and both and SFR are dramatically impacted by a survey’s ability to detect low luminosities and distinguish contaminated AGN. Indeed the largest scatter in these relationships are found at dwarf galaxy masses, suggesting the relationships found in massive galaxies may break down for dwarf galaxies. We further explore the role of detection threshold and x-ray contaminants in Section 3.3.
Many simulated dwarfs also exhibit quenched star formation. Since MBH accretion is, on average, correlated with SFR among star-forming main sequence galaxies in Romulus25 (Ricarte et al., 2019), it is unsurprising that many low-luminosity MBHs are found in galaxies with little star formation. However, a surprising number of quenched dwarfs exhibit an actively accreting MBH, in-line with x-ray observations from Aird et al. (2019); Carraro et al. (2020), which both find elevated AGN activity among quiescent galaxies relative to star-forming galaxies at the same SFR. This phenomenon suggests the mechanism that fuels star formation is, at least in some dwarfs, separate from that which fuels MBH activity. It may also indicate a connection between active accretion and the suppression of star formation in some dwarfs.
It is worth noting that of quenched (zero SFR) dwarf galaxies in Romulus25 are isolated, meaning they are (i) outside the virial radius of a larger halo, and (ii) farther than Mpc from any neighboring galaxy with (Geha et al., 2012). The high number of quenched, isolated dwarf galaxies in Romulus25 is in tension with observations of local field dwarfs (Geha et al., 2012) where the quenched fraction in isolated dwarf galaxies is . Dickey et al. (2021) find that many other cosmological simulations similarly over-produce quenched, isolated dwarfs. Future work will explore the dwarf quenching mechanism in Romulus25, including the possible ties to AGN activity.
3.2 Active fraction of detectable MBHs

. The MBH occupation fraction (black dashed) sets upper limits on the active fraction. Error bars mark binomial uncertainties. Active fractions peak at and decrease with time, at all stellar masses below . Massive galaxies exhibit consistently higher active fractions than low-mass galaxies at all times. At , of dwarfs emit above erg s-1 , a factor of a few higher than found in x-ray observations from Birchall et al. (2020, circles, squares) and (Mezcua et al., 2018, pentagons).
Next, we examine the evolution of AGN prevalence across cosmic time. The active fraction is defined here as the fraction of all galaxies emitting above a given keV x-ray luminosity threshold. Figure 3 shows the active fraction for all galaxies in Romulus25 above as a function of stellar mass, in bins of redshift. We define activity using three x-ray luminosity thresholds and include observational constraints from x-ray observations (Mezcua et al., 2018; Birchall et al., 2020). We set a cut on acceptable contamination such that . Setting this cut on contamination impacts the active fractions in lower luminosity AGN, but does not change fractions among the two highest AGN luminosities shown here.
In addition to expressing a lower occupation fraction than massive galaxies, low-mass galaxies are overall less luminous and hence exhibit a lower active fraction. While the most massive galaxies consistently emit well above erg s-1 , only the higher mass dwarf galaxies between reach such high luminosities, and most prominently around . Dwarf galaxies peak in activity around and drop off in luminosities with time, steeply dropping around . By , approximately of galaxies between , and of galaxies between , host an x-ray detectable MBH brighter than erg s-1 . For reference, this luminosity threshold is similar to the detection threshold for the Ms Chandra-COSMOS-Legacy observations at in the full x-ray band (Suh et al., 2017). Despite the steep drops in luminosity, dwarf galaxies at in Romulus25 exhibit a factor of a few higher active fractions than found in x-ray observations.
There may be a few reasons why our dwarf active fractions are higher than the observed. 1) The high seed mass in Romulus25 may ultimately drive unrealistically high accretion rates onto dwarf AGN at the wrong times. Although our dwarf AGN follow observed local scaling relations, including the relation for more massive galaxies, dwarfs in reality may follow a different relation from massive galaxies (Reines & Volonteri, 2015). Further, it is possible to correctly predict the empirical relationships while still over-predicting the AGN fraction if the timing of the simulated MBH accretion history is wrong. Indeed, Ricarte et al. (2019) find that the luminosity density of AGN in Romulus25 is high relative to observations at . 2) MBHs in Romulus25 accrete on timescales greater than yrs. A duty cycle of order yrs may account for factor differences in observed fraction. 3) Although our occupation fractions are consistent with observations, changing the MBH seeding model to be more restrictive may alleviate the AGN fraction discrepancy while maintaining agreement with observational constraints on the occupation fraction. This change is largely equivalent to changing the seeding model of the simulation. 4) As with other cosmological simulations, we do not directly measure AGN luminosities but instead assume a radiative efficiency to convert MBH accretion rates. We convert accretion rates using a two-mode accretion model where radiative efficiency depends on Eddington fraction (Churazov et al., 2005). However, there is no consensus on the Eddington fraction distributions that underlie accretion models for low luminosity AGN, and hence the precise dependence on Eddington fraction is unclear (Trump et al., 2011; Weigel et al., 2017; Pesce et al., 2021). Further, we do not take into account AGN obscuration. Although the obscuration fraction among AGN is still uncertain, population synthesis models from Ananna et al. (2019) indicate that of AGN within may be Compton-thick. 5) Similarly, we rely on existing bolometric corrections from Shen et al. (2020) to calculate x-ray luminosities, but these corrections are calibrated for more massive galaxies. As with radiative efficiency, there is evidence that x-ray bolometric corrections depend on Eddington fraction (Lusso et al., 2012). Radiative efficiency and bolometric corrections are closely linked quantities, and together form a free parameter that is not well constrained within dwarf galaxies (Baldassare et al., 2017). Indeed, Latimer et al. (2021) find evidence that IR-selected dwarf AGN are comparatively under-luminous in the x-ray regime, suggesting a breakdown in typical luminosity scaling relations at dwarf masses, as we have found. Moreover, Molina et al. (2021b) identify AGN candidates using coronal line emission in the optical regime and find that cannot be correctly identified using other AGN-detection techniques, including x-ray detection.
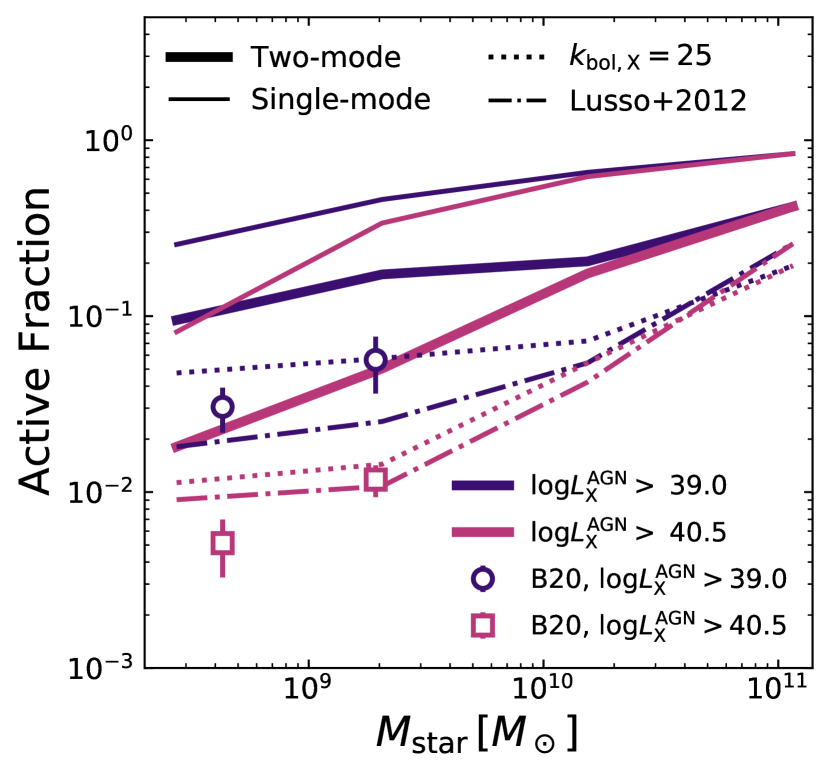
Figure 4 illustrates how the active fraction differs when switching from a two-mode accretion model to a single-mode model in which . We calculate the active fraction for the two-mode model using a flat bolometric correction, . We also explore the luminosity-dependent bolometric corrections obtained from x-ray selected AGN by Lusso et al. (2012), applying them to the two-mode accretion model. For the low luminosities found among Romulus25 dwarfs, the extrapolated luminosity-dependent corrections are approximately . Lusso et al. (2012) provide Eddington-fraction bolometric corrections for hard x-rays, but we do not use those corrections since their AGN do not extend down to the Eddington fractions found in Romulus25.
Single-mode accretion, wherein even MBHs with low Eddington fractions radiate equally efficiently, produces luminosities that are significantly higher than in two-mode accretion. Active fractions for single-mode accretion at a given stellar mass are approximately dex higher than observations from Birchall et al. (2020). On the other hand, applying a flat bolometric correction of ( larger than corrections from Shen et al. 2020) to the two-mode model yields even closer consensus with observations. The luminosity-dependent corrections derived from x-ray AGN yield even lower active fractions, despite having (only larger than corrections from Shen et al. 2020). It is worth noting that among massive galaxies, high bolometric corrections of order are typically only found in Compton-thick AGN and/or AGN with particularly high Eddington fraction (Vasudevan & Fabian, 2007; Lusso et al., 2012; Brightman et al., 2017), while the dwarfs in Romulus25 typically exhibit Eddington fractions .
3.3 Population of hidden MBHs
Next, we illuminate a population of MBHs within Romulus25 that may be hidden from current x-ray surveys. We explore the impact of current x-ray detection limits; contamination of low luminosity AGN by XRBs and the hot interstellar medium; and off-center (outside 2 kpc of the galaxy center) versus central (within 2 kpc of the galaxy center) MBHs within dwarf galaxies on the detected population of dwarf AGN.
Using semi-analytic models of MBH growth in low-mass galaxies, Pacucci et al. (2018) find that the tight scaling relationship between MBH mass and bulge stellar velocity dispersion, , found in high-mass galaxies tends to over-predict in low-mass galaxies.
Observations indicate that the tight scaling relationships between and (or velocity dispersion, ) found among massive galaxies tend to over-predict in low-mass galaxies (Reines & Volonteri, 2015). Using semi-analytic models, Pacucci et al. (2018) find that MBHs that are under-massive relative to the expected or relations tend to have grown from weakly accreting low-mass seeds, which may fall below typical survey detection thresholds. This trend suggests that the observed (and similarly the ) relation in massive galaxies only appears to extend to low-mass galaxies because those MBHs are detectable, when there may in fact be many undetected, low-luminosity MBHs that fall below the relation (Baldassare et al., 2020).
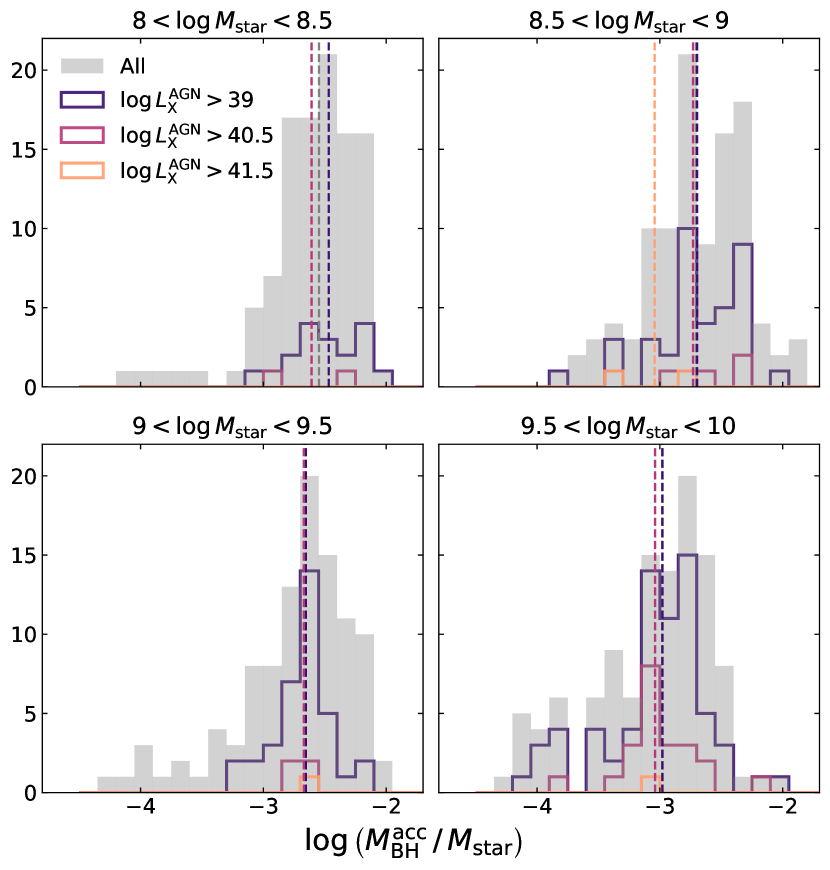
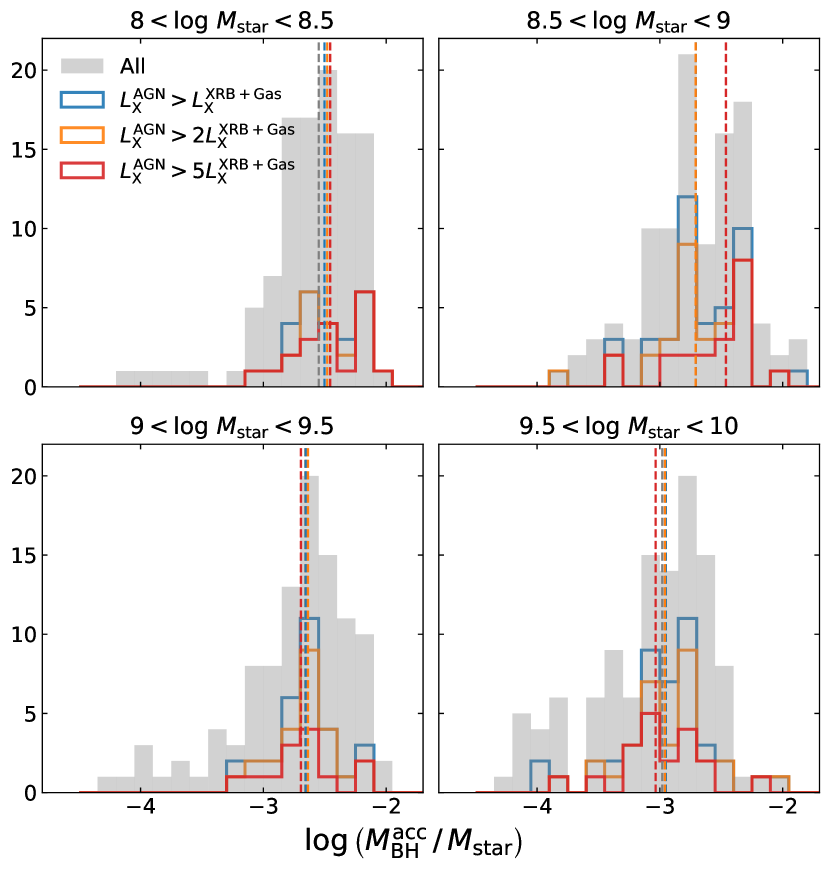
Figure 5 illustrates how varying the x-ray detection limit alters the detected distribution of for dwarf galaxies at . As a baseline, we show the underlying distribution of without cuts on x-ray luminosity for dwarfs in each stellar mass bin. In each stellar mass bin, setting luminosity thresholds as low as erg s-1 removes the majority of MBHs from detection, including many of the most under-massive MBHs. Setting a threshold at erg s-1 misses of MBHs in dwarfs between , and of MBHs in dwarfs between . Increasing the threshold to erg s-1 samples a strongly biased sample of MBHs, keeping only those few with . However, the median of the distribution changes little regardless of detection threshold, different from what is found by Pacucci et al. (2018).
Figure 6 further shows how varying the acceptable contamination from XRBs and hot gas impacts the detected distribution of , where we define . Throughout this work we have adopted as the standard contamination threshold. Setting a contamination threshold as low as similarly misses the most undermassive MBHs. A threshold set at misses of MBHs in dwarfs between , and of MBHs in dwarfs between . As with setting luminosity thresholds, the median of the distribution changes little when setting contamination thresholds.
Another complicating factor in MBH detection is distance from the galaxy center. Both simulations (Bellovary et al., 2019, 2021) and observations (Reines et al., 2020; Mezcua & Domínguez Sánchez, 2020; Greene et al., 2021) have found MBHs at large radii from the centers of dwarf galaxies. Galaxies in Romulus25 have also been found to frequently host off-center MBHs at radii kpc from the halo center (Ricarte et al., 2021a, b). Off-center MBHs frequently exhibit low luminosities (Mezcua & Domínguez Sánchez, 2020) and low accretion efficiencies (Ricarte et al., 2021b), implying that the detection of off-center MBHs is intrinsically tied to luminosity thresholds and contamination. When selecting our initial sample of MBH hosts, we search for the brightest MBH within kpc of the halo center, which includes the majority of off-center MBHs. At , of dwarfs with MBHs have their brightest MBH outside of kpc. Over time, bright off-center MBHs become even less common as the percentage drops to by . Regardless of redshift, approximately of MBHs in dwarf galaxies are found within kpc of the halo center.
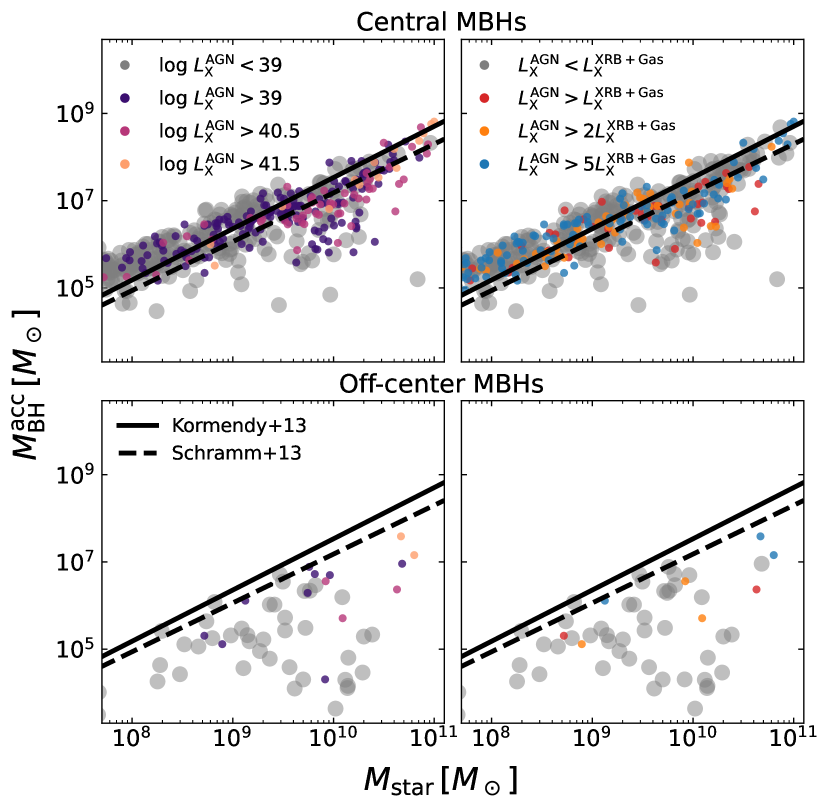
To further quantify the combined impact of off-center MBHs, x-ray luminosity limits, and contamination on the detection of MBHs, Figure 7 shows the relation up to with the same set of x-ray luminosity thresholds and acceptable contamination fractions. We distinguish between galaxies with central (within 2 kpc of the galaxy center) and off-center (outside 2 kpc of the galaxy center) MBHs. In cases where there are multiple central or multiple off-center MBHs, we choose the brightest one. For reference, we over-plot observed relations for massive galaxies from Schramm & Silverman (2013) and Kormendy & Ho (2013). There exists a “hidden” population of MBHs at both low luminosities and high contamination that are undetectable by current instruments. Approximately of central MBHs in dwarf galaxies are hidden by these criteria. While the majority of hidden central MBHs lie directly along the observed relation, a significant number are found well below the relation. On the other hand, of off-center MBHs in dwarf galaxies are further hidden by low luminosities and/or contamination, and the majority are significantly undermassive. These results indicate that increasing the detection sensitivity alone would not allow hidden MBHs to be reliably detected since they are often heavily contaminated and sometimes exist at large distances from the galaxy center. Detecting these hidden MBHs with x-rays, especially MBHs that are far off-center, would require higher instrument sensitivity in addition to (i) a better understanding of XRBs + hot ISM emission in dwarf galaxies (e.g, in the low metallicity, low SFR regimes as discussed in Lehmer et al. 2021), and/or (ii) multi-wavelength imaging of the AGN.
Although we predict that sensitivity limits will cause surveys to miss many undermassive MBHs, common detection limits only slightly impact the fit relation. Fits to the total (central + off-center) relation below at reveal that setting a detection limit simply shifts the relation up by dex while keeping the slope intact. The small change in predicted is not large enough to explain the dex difference found in Pacucci et al. (2018). Their abundant under-massive MBHs are likely the result of their mixed seeding mechanism which generates both high-mass and weakly accreting low-mass seeds.
3.4 Number density of detectable MBHs
Finally, we report on the spatial number density of hidden MBHs and AGN relative to the total number density of MBHs in Romulus25. The initial number of MBHs within Romulus25 is set by the seeding prescription, while the evolution with time is determined by the merger rates. In particular, the seeding prescription determines where and with what frequency MBHs can form. Since the majority of MBHs in Romulus25 form prior to (Tremmel et al., 2017), the evolution of the number density from to is driven by MBH mergers. Although we do not directly report on MBH merger rates, it is worth noting that (Volonteri et al., 2020) find MBH merger rates tend to increase among low-mass galaxies when moving to higher resolution simulations. Lower resolution simulations tend to miss mergers of low-mass galaxies, and hence underpredict the MBH merger fraction. It is likely that moving to higher resolutions than Romulus25 would lead to differing results for the evolution of the MBH number density.
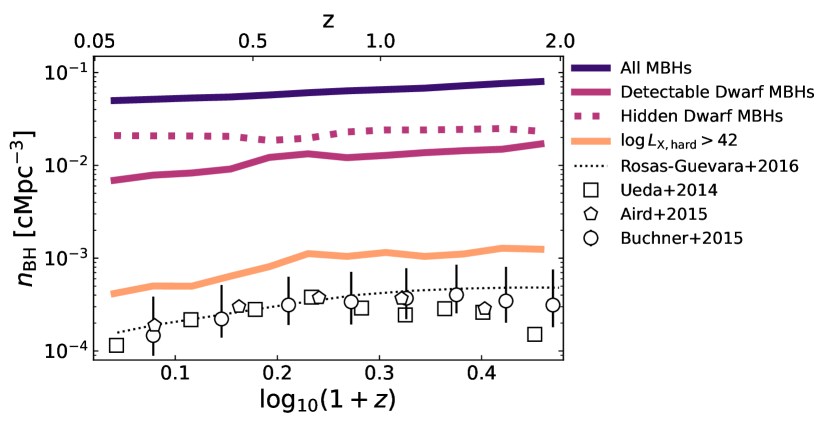
Figure 8 tracks the comoving number density of MBHs as a function of redshift. We include lines for all MBHs in well-resolved halos, “detectable” MBHs in dwarf galaxies ( erg s-1 and ), and hidden MBHs in dwarf galaxies ( erg s-1 and/or ). We also show the evolution of the AGN number density from Romulus25 alongside x-ray observations (Ueda et al., 2014; Aird et al., 2015; Buchner et al., 2015), and EAGLE (Rosas-Guevara et al., 2016) in the hard x-ray band with erg s-1 .
The total number density of MBHs decreases over time, from cMpc-3 at down to cMpc-3 at . These number densities are within a factor of a few of estimates from Volonteri (2010) who estimate cMpc-3 at ; slightly lower than those from Buchner et al. (2019), who find cMpc-3 at for their seed-independent empirical model; and in line with those from EAGLE (Rosas-Guevara et al., 2016), which finds cMpc-3 at with MBH seed mass . Among dwarf galaxies, visible and hidden MBHs are found in equal amounts at , approximately with densities cMpc-3, but at hidden dwarfs are more common by a factor of , around cMpc-3.
AGN follow a slightly different shape and evolution than the full population of MBHs. The number densities of AGN are instead determined by the accretion history of the underlying population of MBHs. As explored in Section 3.2, AGN have decreased in both luminosity and prevalence since within the simulation. The number of AGN above erg s-1 peaks at around cMpc-3. AGN are most rare at , at . These estimates are slightly higher than observations and EAGLE results in the same band (Ueda et al., 2014; Aird et al., 2015; Buchner et al., 2015; Rosas-Guevara et al., 2016) at . This difference is likely tied to our over-prediction of the AGN fraction.
4 Caveats
As discussed in Sharma et al. (2020), the primary caveat of our analysis is the relatively large seed mass of MBHs in Romulus25. Accretion rates in the lowest mass MBHs are inflated by the relatively large MBH seed mass. A lighter MBH seed mass might instead drive a different accretion history due to the lower average accretion rates. It is worth noting that our local dwarfs exhibit x-ray luminosities consistent with AGN observations down to (see Section 3.1), and follow the observed at low redshift (Sharma et al., 2020). It is not clear if a lighter MBH seed would push luminosities below what is observed or alter their agreement with local scaling relations. On the other hand, less accretion may mitigate the higher dwarf AGN fractions found in Romulus25 (see Section 3.2).
A lighter MBH seed mass may also lead to more frequent seeding of MBHs, though constraints from simulations indicate that a lighter seed formation channel may ultimately lead to similar present-day MBH number densities (Greene et al., 2020). Occupation fractions are often thought to differ between seed formation channels, though Ricarte & Natarajan (2018) find that light seeds may produce a large range of occupation fractions, with overlap with heavy seed mechanisms. Given these results, it is not obvious how MBH occupation would be impacted if Romulus25 had a lighter seed mass.
There are a number of uncertainties that we do not fully address when presenting results for the detected fraction of MBHs in dwarf galaxies. For one, we do not take into account uncertainties on the contaminant relations themselves. The observed relations that govern how we calculate and themselves have uncertainties that impact the contamination fraction. For example, Schirra et al. (2021) find that the XRB luminosity may vary by up to dex at (and by more at higher redshift) between different models of XRB emission. We also do not include the effects of AGN obscuration, which is still virtually unconstrained in how much it impacts low-luminosity AGN (e.g, Schirra et al., 2021). We also do not account for differences in star formation properties relative to observed dwarfs. The stellar masses and SFRs of dwarf galaxies in the simulation, which factor into calculating and , may differ from real dwarfs. Indeed, results derived from six large-scale cosmological simulations by Haidar et al. (2022) indicate that it is possible to qualitatively reproduce the observed and SFR relations, but still yield different estimates of the detected fraction. A closer examination of the quiescent fractions in Romulus25 may help validate the MBH detected fractions shown here.
As found in Section 3.2, comparisons with observations are sensitive to the choice of accretion model, bolometric corrections, and AGN obscuration. Active fractions are much closer to what is observed when we calculate luminosities with two-mode accretion, but Romulus25 internally uses a single-mode model when implementing feedback. It is only our post-processing results which suggest that the single-mode thermal feedback in Romulus25 does not properly emulate what happens in reality. A feedback model that depends on accretion rate, as found in some other cosmological simulations (Sijacki et al., 2015; Weinberger et al., 2017; Dubois et al., 2016; Davé et al., 2019) may better match reality. If it is true that the radiative efficiency decreases for low , it is still unclear what form the feedback (and hence the radiative efficiency) should take at low . A closer examination of the Eddington fraction distributions, full spectral energy distributions, and obscuration fraction among dwarf AGN will be required to constrain dwarf activity in the future.
5 Conclusions
In this work we explore the characteristics of activity in massive black holes within the high resolution cosmological hydrodynamic simulation Romulus25. We study the population statistics of MBHs in galaxies above , including the occupation and number densities of MBHs in galaxies out to . We focus on investigating the properties of MBH activity in dwarf galaxies between . In summary, we find that:
-
•
Figure 1 shows that the MBH occupation fraction at drops below unity for galaxies below , in broad agreement with observed constraints from x-ray selected AGN (Miller et al., 2015), x-ray observations of late-type spiral galaxies (Desroches et al., 2009; Greene, 2012), dynamical MBH estimates (Nguyen et al., 2019), and variability-selected dwarf AGN (Baldassare et al., 2020).
-
•
MBHs in dwarf galaxies around follow established scaling relations between , , and SFR that have been observed in dwarf AGN (Mezcua et al., 2018; Birchall et al., 2020). Figure 2 shows these relations hold for AGN relatively uncontaminated by XRBs and hot gas emission, but break down at low stellar masses for weakly accreting and/or strongly contaminated sources.
-
•
Dwarf AGN are rare in Romulus25 but not as rare as expected from x-ray observations. The dwarf active fractions in Figure 3 evolve strongly with time, peaking at and dropping steeply toward the present day. Despite the steep evolution, the active fractions at are slightly higher than observations of local dwarf AGN (Mezcua et al., 2018; Birchall et al., 2020).
-
•
Changes in radiative efficiency and bolometric corrections can dramatically affect activity among MBHs in simulated dwarf galaxies, as illustrated in Figure 4. Constraining these quantities will require observations of Eddington fraction distributions and spectral energy distributions among dwarf AGN.
-
•
We predict a considerable population of both central and off-center MBHs at that are undetectable by current x-ray facilities. These MBHs often exhibit luminosities lower than current x-ray detection limits in addition to high x-ray contamination . Figures 5 and 6 indicate that this population of hidden MBHs does not significantly change the observed relation for central MBHs, though off-center MBHs are nearly all undermassive. Figure 7 shows that of central MBHs in dwarf galaxies and of off-center MBHs in dwarf galaxies are hidden by low luminosities and/or high contamination.
-
•
Figure 8 shows that the number density of MBHs in Romulus25 are consistent with direct collapse seeding estimates from empirical models (Buchner et al., 2019), analytic models (Volonteri, 2010), and the EAGLE cosmological simulation (Rosas-Guevara et al., 2016). As expected from elevated active fractions, AGN are somewhat more common than in x-ray observations (Ueda et al., 2014; Aird et al., 2015; Buchner et al., 2015).
Detecting MBHs in dwarf galaxies with X-ray observatories has been a challenging endeavor, due to the combination of low intrinsic luminosities, the possibility of being off-center, and high chances of contamination from X-ray binaries, background quasars, and low surface brightness hot gas. Our work here highlights how a non-negligible fraction of MBHs are “hidden” to most observations due to a combination of low accretion luminosities and blending in with background sources. To maximize detection, one requires an X-ray observatory with both high sensitivity (to find faint sources) and high angular resolution (to disentangle a potential AGN from other X-ray sources). At present, the Chandra X-ray Observatory is the only instrument with sub-arcsecond spatial resolution. The purported angular resolution of the planned Athena telescope is 5 arcseconds, which is not sufficient to localize an AGN candidate and separate it from other sources. Only a probe-class X-ray mission, such as that recommended by the Astro2020 Decadal Survey (National Academies of Sciences, Engineering, and Medicine, 2021) (and based on the design of the Lynx Observatory, or as planned for the AXIS observatory) can meet the needs for discovering these elusive objects.
In future work, we will further explore the potential connection between AGN activity and the star formation quiescence we find in dwarf galaxies.
6 Acknowledgements
RSS and AMB acknowledge support from the National Science Foundation under grant No. NSF-AST-1813871. MT is supported by an NSF Astronomy and Astrophysics Postdoctoral Fellowship under award AST-2001810. JMB acknowledges support from NSF AST-1812642 and the CUNY JFRASE award. Romulus25 is part of the Blue Waters sustained-petascale computing project, which is supported by the National Science Foundation (awards OCI-0725070 and ACI-1238993) and the state of Illinois. Blue Waters is a joint effort of the University of Illinois at Urbana-Champaign and its National Center for Supercomputing Applications. Romulus25 used the Extreme Science and Engineering Discovery Environment (XSEDE), which is supported by National Science Foundation grant number ACI-1548562. RSS thanks Kristen Garofali for helpful conversations. We thank the anonymous referee for their insightful feedback that improved this manuscript.
References
- Ahn et al. (2018) Ahn, C. P., Seth, A. C., Cappellari, M., et al. 2018, The Astrophysical Journal, 858, 102, doi: 10.3847/1538-4357/aabc57
- Aird et al. (2017) Aird, J., Coil, A. L., & Georgakakis, A. 2017, Monthly Notices of the Royal Astronomical Society, 465, 3390, doi: 10.1093/mnras/stw2932
- Aird et al. (2018) —. 2018, Monthly Notices of the Royal Astronomical Society, 474, 1225, doi: 10.1093/mnras/stx2700
- Aird et al. (2019) —. 2019, Monthly Notices of the Royal Astronomical Society, 484, 4360, doi: 10.1093/mnras/stz125
- Aird et al. (2015) Aird, J., Coil, A. L., Georgakakis, A., et al. 2015, Monthly Notices of the Royal Astronomical Society, 451, 1892, doi: 10.1093/mnras/stv1062
- Ananna et al. (2019) Ananna, T. T., Treister, E., Urry, C. M., et al. 2019, The Astrophysical Journal, 871, 240, doi: 10.3847/1538-4357/aafb77
- Anglés-Alcázar et al. (2017) Anglés-Alcázar, D., Faucher-Giguère, C. A., Quataert, E., et al. 2017, Monthly Notices of the Royal Astronomical Society: Letters, 472, L109, doi: 10.1093/mnrasl/slx161
- Baldassare et al. (2018) Baldassare, V. F., Geha, M., & Greene, J. 2018, The Astrophysical Journal, 868, 152, doi: 10.3847/1538-4357/aae6cf
- Baldassare et al. (2020) —. 2020, The Astrophysical Journal, 896, 10, doi: 10.3847/1538-4357/ab8936
- Baldassare et al. (2017) Baldassare, V. F., Reines, A. E., Gallo, E., & Greene, J. E. 2017, The Astrophysical Journal, 850, 196, doi: 10.3847/1538-4357/aa9067
- Baldassare et al. (2016) Baldassare, V. F., Reines, A. E., Gallo, E., et al. 2016, The Astrophysical Journal, 829, 57, doi: 10.3847/0004-637X/829/1/57
- Barai & de Gouveia Dal Pino (2019) Barai, P., & de Gouveia Dal Pino, E. M. 2019, Monthly Notices of the Royal Astronomical Society, 487, 5549, doi: 10.1093/mnras/stz1616
- Barausse et al. (2020) Barausse, E., Dvorkin, I., Tremmel, M., Volonteri, M., & Bonetti, M. 2020, The Astrophysical Journal, 904, 16, doi: 10.3847/1538-4357/abba7f
- Barth et al. (2004) Barth, A. J., Ho, L. C., Rutledge, R. E., & Sargent, W. L. W. 2004, The Astrophysical Journal, 607, 90, doi: 10.1086/383302
- Begelman et al. (2006) Begelman, M. C., Volonteri, M., & Rees, M. J. 2006, Monthly Notices of the Royal Astronomical Society, 370, 289, doi: 10.1111/j.1365-2966.2006.10467.x
- Bellovary et al. (2019) Bellovary, J. M., Cleary, C. E., Munshi, F., et al. 2019, Monthly Notices of the Royal Astronomical Society, 482, 2913, doi: 10.1093/mnras/sty2842
- Bellovary et al. (2021) Bellovary, J. M., Hayoune, S., Chafla, K., et al. 2021, Monthly Notices of the Royal Astronomical Society, 505, 5129, doi: 10.1093/mnras/stab1665
- Bentz et al. (2016a) Bentz, M. C., Cackett, E. M., Crenshaw, D. M., et al. 2016a, The Astrophysical Journal, 830, 136, doi: 10.3847/0004-637X/830/2/136
- Bentz et al. (2016b) Bentz, M. C., Batiste, M., Seals, J., et al. 2016b, The Astrophysical Journal, 831, 2, doi: 10.3847/0004-637X/831/1/2
- Birchall et al. (2020) Birchall, K. L., Watson, M. G., & Aird, J. 2020, Monthly Notices of the Royal Astronomical Society, 492, 2268, doi: 10.1093/mnras/staa040
- Birchall et al. (2022) Birchall, K. L., Watson, M. G., Aird, J., & Starling, R. L. C. 2022, Monthly Notices of the Royal Astronomical Society, 510, 4556, doi: 10.1093/mnras/stab3573
- Bohn et al. (2021) Bohn, T., Canalizo, G., Veilleux, S., & Liu, W. 2021, arXiv e-prints, 2102, arXiv:2102.08397
- Booth & Schaye (2009) Booth, C. M., & Schaye, J. 2009, Monthly Notices of the Royal Astronomical Society, 398, 53, doi: 10.1111/j.1365-2966.2009.15043.x
- Bower et al. (2017) Bower, R. G., Schaye, J., Frenk, C. S., et al. 2017, Monthly Notices of the Royal Astronomical Society, 465, 32, doi: 10.1093/mnras/stw2735
- Bradford et al. (2018) Bradford, J. D., Geha, M. C., Greene, J. E., Reines, A. E., & Dickey, C. M. 2018, The Astrophysical Journal, 861, 50, doi: 10.3847/1538-4357/aac88d
- Brightman et al. (2017) Brightman, M., Baloković, M., Ballantyne, D. R., et al. 2017, The Astrophysical Journal, 844, 10, doi: 10.3847/1538-4357/aa75c9
- Buchner et al. (2019) Buchner, J., Treister, E., Bauer, F. E., Sartori, L. F., & Schawinski, K. 2019, The Astrophysical Journal, 874, 117, doi: 10.3847/1538-4357/aafd32
- Buchner et al. (2015) Buchner, J., Georgakakis, A., Nandra, K., et al. 2015, The Astrophysical Journal, 802, 89, doi: 10.1088/0004-637X/802/2/89
- Cann et al. (2018) Cann, J. M., Satyapal, S., Abel, N. P., et al. 2018, The Astrophysical Journal, 861, 142, doi: 10.3847/1538-4357/aac64a
- Cann et al. (2020) Cann, J. M., Satyapal, S., Bohn, T., et al. 2020, The Astrophysical Journal, 895, 147, doi: 10.3847/1538-4357/ab8b64
- Cann et al. (2021) Cann, J. M., Satyapal, S., Rothberg, B., et al. 2021, arXiv e-prints, 2104, arXiv:2104.05689
- Cannon et al. (2011) Cannon, J. M., Giovanelli, R., Haynes, M. P., et al. 2011, The Astrophysical Journal, 739, L22, doi: 10.1088/2041-8205/739/1/L22
- Carraro et al. (2020) Carraro, R., Rodighiero, G., Cassata, P., et al. 2020, Astronomy and Astrophysics, 642, A65, doi: 10.1051/0004-6361/201936649
- Chilingarian et al. (2018) Chilingarian, I. V., Katkov, I. Y., Zolotukhin, I. Y., et al. 2018, The Astrophysical Journal, 863, 1, doi: 10.3847/1538-4357/aad184
- Churazov et al. (2005) Churazov, E., Sazonov, S., Sunyaev, R., et al. 2005, Monthly Notices of the Royal Astronomical Society, 363, L91, doi: 10.1111/j.1745-3933.2005.00093.x
- Dashyan et al. (2018) Dashyan, G., Silk, J., Mamon, G. A., Dubois, Y., & Hartwig, T. 2018, Monthly Notices of the Royal Astronomical Society, 473, 5698, doi: 10.1093/mnras/stx2716
- Davé et al. (2019) Davé, R., Anglés-Alcázar, D., Narayanan, D., et al. 2019, Monthly Notices of the Royal Astronomical Society, 486, 2827, doi: 10.1093/mnras/stz937
- Davies et al. (2011) Davies, M. B., Miller, M. C., & Bellovary, J. M. 2011, The Astrophysical Journal Letters, 740, L42, doi: 10.1088/2041-8205/740/2/L42
- Desroches et al. (2009) Desroches, L.-B., Greene, J. E., & Ho, L. C. 2009, The Astrophysical Journal, 698, 1515, doi: 10.1088/0004-637X/698/2/1515
- Devecchi & Volonteri (2009) Devecchi, B., & Volonteri, M. 2009, The Astrophysical Journal, 694, 302, doi: 10.1088/0004-637X/694/1/302
- Dickey et al. (2019) Dickey, C. M., Geha, M., Wetzel, A., & El-Badry, K. 2019, The Astrophysical Journal, 884, 180, doi: 10.3847/1538-4357/ab3220
- Dickey et al. (2021) Dickey, C. M., Starkenburg, T. K., Geha, M., et al. 2021, The Astrophysical Journal, 915, 53, doi: 10.3847/1538-4357/abc014
- Dubois et al. (2016) Dubois, Y., Peirani, S., Pichon, C., et al. 2016, Monthly Notices of the Royal Astronomical Society, 463, 3948, doi: 10.1093/mnras/stw2265
- Dubois et al. (2015) Dubois, Y., Volonteri, M., Silk, J., et al. 2015, Monthly Notices of the Royal Astronomical Society, 452, 1502, doi: 10.1093/mnras/stv1416
- Dubois et al. (2014) Dubois, Y., Pichon, C., Welker, C., et al. 2014, Monthly Notices of the Royal Astronomical Society, 444, 1453, doi: 10.1093/mnras/stu1227
- Dubois et al. (2021) Dubois, Y., Beckmann, R., Bournaud, F., et al. 2021, Astronomy and Astrophysics, 651, A109, doi: 10.1051/0004-6361/202039429
- Fabian (2012) Fabian, A. C. 2012, Annu. Rev. Astron. Astrophys, 50, 455, doi: 10.1146/annurev-astro-081811-125521
- Ferrara et al. (2014) Ferrara, A., Salvadori, S., Yue, B., & Schleicher, D. 2014, Monthly Notices of the Royal Astronomical Society, 443, 2410, doi: 10.1093/mnras/stu1280
- Geha et al. (2012) Geha, M., Blanton, M. R., Yan, R., & Tinker, J. L. 2012, The Astrophysical Journal, 757, 85, doi: 10.1088/0004-637X/757/1/85
- Greene (2012) Greene, J. E. 2012, Nature Communications, 3, 1304, doi: 10.1038/ncomms2314
- Greene & Ho (2004) Greene, J. E., & Ho, L. C. 2004, The Astrophysical Journal, 610, 722, doi: 10.1086/421719
- Greene & Ho (2007) —. 2007, The Astrophysical Journal, 670, 92, doi: 10.1086/522082
- Greene et al. (2020) Greene, J. E., Strader, J., & Ho, L. C. 2020, Annual Review of Astronomy and Astrophysics, 58, 257, doi: 10.1146/annurev-astro-032620-021835
- Greene et al. (2021) Greene, J. E., Lancaster, L., Ting, Y.-S., et al. 2021, The Astrophysical Journal, 917, 17, doi: 10.3847/1538-4357/ac0896
- Guedes et al. (2011) Guedes, J., Callegari, S., Madau, P., & Mayer, L. 2011, The Astrophysical Journal, 742, 76, doi: 10.1088/0004-637X/742/2/76
- Habouzit et al. (2017) Habouzit, M., Volonteri, M., & Dubois, Y. 2017, Monthly Notices of the Royal Astronomical Society, 468, 3935, doi: 10.1093/mnras/stx666
- Haidar et al. (2022) Haidar, H., Habouzit, M., Volonteri, M., et al. 2022, arXiv e-prints
- Haiman (2013) Haiman, Z. 2013, The First Galaxies, 396, 293, doi: 10.1007/978-3-642-32362-1_6
- Haynes et al. (2011) Haynes, M. P., Giovanelli, R., Martin, A. M., et al. 2011, The Astronomical Journal, 142, 170, doi: 10.1088/0004-6256/142/5/170
- Heinis et al. (2016) Heinis, S., Gezari, S., Kumar, S., et al. 2016, The Astrophysical Journal, 826, 62, doi: 10.3847/0004-637X/826/1/62
- Henden et al. (2018) Henden, N. A., Puchwein, E., Shen, S., & Sijacki, D. 2018, Monthly Notices of the Royal Astronomical Society, 479, 5385, doi: 10.1093/mnras/sty1780
- Hirschmann et al. (2014) Hirschmann, M., Dolag, K., Saro, A., et al. 2014, Monthly Notices of the Royal Astronomical Society, 442, 2304, doi: 10.1093/mnras/stu1023
- Hosokawa et al. (2013) Hosokawa, T., Yorke, H. W., Inayoshi, K., Omukai, K., & Yoshida, N. 2013, The Astrophysical Journal, 778, 178, doi: 10.1088/0004-637X/778/2/178
- Johnson et al. (2013) Johnson, J. L., Whalen, D. J., Li, H., & Holz, D. E. 2013, The Astrophysical Journal, 771, 116, doi: 10.1088/0004-637X/771/2/116
- Katz et al. (2015) Katz, H., Sijacki, D., & Haehnelt, M. G. 2015, Monthly Notices of the Royal Astronomical Society, 451, 2352, doi: 10.1093/mnras/stv1048
- Kaviraj et al. (2019) Kaviraj, S., Martin, G., & Silk, J. 2019, Monthly Notices of the Royal Astronomical Society, 489, L12, doi: 10.1093/mnrasl/slz102
- Kazantzidis et al. (2005) Kazantzidis, S., Mayer, L., Colpi, M., et al. 2005, The Astrophysical Journal, 623, L67, doi: 10.1086/430139
- Knollmann & Knebe (2009) Knollmann, S. R., & Knebe, A. 2009, The Astrophysical Journal Supplement Series, 182, 608, doi: 10.1088/0067-0049/182/2/608
- Kormendy & Ho (2013) Kormendy, J., & Ho, L. C. 2013, Annu. Rev. Astron. Astrophys, 51, 511, doi: 10.1146/annurev-astro-082708-101811
- Koudmani et al. (2021) Koudmani, S., Henden, N. A., & Sijacki, D. 2021, Monthly Notices of the Royal Astronomical Society, 503, 3568, doi: 10.1093/mnras/stab677
- Koudmani et al. (2019) Koudmani, S., Sijacki, D., Bourne, M. A., & Smith, M. C. 2019, Monthly Notices of the Royal Astronomical Society, 484, 2047, doi: 10.1093/mnras/stz097
- Kristensen et al. (2021) Kristensen, M. T., Pimbblet, K. A., Gibson, B. K., Penny, S. J., & Koudmani, S. 2021, The Astrophysical Journal, 922, 127, doi: 10.3847/1538-4357/ac236d
- Kroupa (2001) Kroupa, P. 2001, Monthly Notices of the Royal Astronomical Society, 322, 231, doi: 10.1046/j.1365-8711.2001.04022.x
- La Franca et al. (2015) La Franca, F., Onori, F., Ricci, F., et al. 2015, Monthly Notices of the Royal Astronomical Society, 449, 1526, doi: 10.1093/mnras/stv368
- Latif & Ferrara (2016) Latif, M. A., & Ferrara, A. 2016, Publications of the Astronomical Society of Australia, 33, e051, doi: 10.1017/pasa.2016.41
- Latimer et al. (2021) Latimer, C. J., Reines, A. E., Hainline, K. N., Greene, J. E., & Stern, D. 2021, The Astrophysical Journal, 914, 133, doi: 10.3847/1538-4357/abfe0c
- Lehmer et al. (2016) Lehmer, B. D., Basu-Zych, A. R., Mineo, S., et al. 2016, The Astrophysical Journal, 825, 7, doi: 10.3847/0004-637X/825/1/7
- Lehmer et al. (2021) Lehmer, B. D., Eufrasio, R. T., Basu-Zych, A., et al. 2021, The Astrophysical Journal, 907, 17, doi: 10.3847/1538-4357/abcec1
- Lemons et al. (2015) Lemons, S. M., Reines, A. E., Plotkin, R. M., Gallo, E., & Greene, J. E. 2015, The Astrophysical Journal, 805, 12, doi: 10.1088/0004-637X/805/1/12
- Liu et al. (2020) Liu, W., Veilleux, S., Canalizo, G., et al. 2020, arXiv e-prints, 2010, arXiv:2010.09008
- Lodato & Natarajan (2006) Lodato, G., & Natarajan, P. 2006, Monthly Notices of the Royal Astronomical Society, 371, 1813, doi: 10.1111/j.1365-2966.2006.10801.x
- Lusso et al. (2012) Lusso, E., Comastri, A., Simmons, B. D., et al. 2012, Monthly Notices of the Royal Astronomical Society, 425, 623, doi: 10.1111/j.1365-2966.2012.21513.x
- Madau et al. (2014) Madau, P., Shen, S., & Governato, F. 2014, The Astrophysical Journal, 789, L17, doi: 10.1088/2041-8205/789/1/L17
- Manzano-King et al. (2019) Manzano-King, C. M., Canalizo, G., & Sales, L. V. 2019, The Astrophysical Journal, 884, 54, doi: 10.3847/1538-4357/ab4197
- Marleau et al. (2017) Marleau, F. R., Clancy, D., Habas, R., & Bianconi, M. 2017, Astronomy and Astrophysics, 602, A28, doi: 10.1051/0004-6361/201629832
- Martín-Navarro & Mezcua (2018) Martín-Navarro, I., & Mezcua, M. 2018, The Astrophysical Journal, 855, L20, doi: 10.3847/2041-8213/aab103
- Menon et al. (2015) Menon, H., Wesolowski, L., Zheng, G., et al. 2015, Computational Astrophysics and Cosmology, 2, 1, doi: 10.1186/s40668-015-0007-9
- Mezcua (2017) Mezcua, M. 2017, International Journal of Modern Physics D, 26, 1730021, doi: 10.1142/S021827181730021X
- Mezcua et al. (2018) Mezcua, M., Civano, F., Marchesi, S., et al. 2018, Monthly Notices of the Royal Astronomical Society, 478, 2576, doi: 10.1093/mnras/sty1163
- Mezcua & Domínguez Sánchez (2020) Mezcua, M., & Domínguez Sánchez, H. 2020, The Astrophysical Journal Letters, 898, L30, doi: 10.3847/2041-8213/aba199
- Miller et al. (2015) Miller, B. P., Gallo, E., Greene, J. E., et al. 2015, The Astrophysical Journal, 799, 98, doi: 10.1088/0004-637X/799/1/98
- Mineo et al. (2012) Mineo, S., Gilfanov, M., & Sunyaev, R. 2012, Monthly Notices of the Royal Astronomical Society, 426, 1870, doi: 10.1111/j.1365-2966.2012.21831.x
- Molina et al. (2021a) Molina, M., Reines, A. E., Greene, J. E., Darling, J., & Condon, J. J. 2021a, arXiv e-prints, 2101, arXiv:2101.12217
- Molina et al. (2021b) Molina, M., Reines, A. E., Latimer, C. J., Baldassare, V., & Salehirad, S. 2021b, A Sample of Massive Black Holes in Dwarf Galaxies Detected via [Fe X] Coronal Line Emission: Active Galactic Nuclei and/or Tidal Disruption Events
- Moran et al. (2014) Moran, E. C., Shahinyan, K., Sugarman, H. R., Vélez, D. O., & Eracleous, M. 2014, The Astronomical Journal, 148, 136, doi: 10.1088/0004-6256/148/6/136
- Mortlock et al. (2011) Mortlock, D. J., Warren, S. J., Venemans, B. P., et al. 2011, Nature, 474, 616, doi: 10.1038/nature10159
- Moster et al. (2013) Moster, B. P., Naab, T., & White, S. D. M. 2013, Monthly Notices of the Royal Astronomical Society, 428, 3121, doi: 10.1093/mnras/sts261
- Munshi et al. (2013) Munshi, F., Governato, F., Brooks, A. M., et al. 2013, The Astrophysical Journal, 766, 56, doi: 10.1088/0004-637X/766/1/56
- National Academies of Sciences, Engineering, and Medicine (2021) National Academies of Sciences, Engineering, and Medicine. 2021, Pathways to Discovery in Astronomy and Astrophysics for the 2020s (Washington, DC: The National Academies Press), doi: 10.17226/26141
- Nelson et al. (2019) Nelson, D., Pillepich, A., Springel, V., et al. 2019, Monthly Notices of the Royal Astronomical Society, 490, 3234, doi: 10.1093/mnras/stz2306
- Nguyen et al. (2018) Nguyen, D. D., Seth, A. C., Neumayer, N., et al. 2018, The Astrophysical Journal, 858, 118, doi: 10.3847/1538-4357/aabe28
- Nguyen et al. (2019) —. 2019, The Astrophysical Journal, 872, 104, doi: 10.3847/1538-4357/aafe7a
- Obreschkow & Glazebrook (2014) Obreschkow, D., & Glazebrook, K. 2014, The Astrophysical Journal, 784, 26, doi: 10.1088/0004-637X/784/1/26
- Onori et al. (2017) Onori, F., Ricci, F., La Franca, F., et al. 2017, Monthly Notices of the Royal Astronomical Society, 468, L97, doi: 10.1093/mnrasl/slx032
- Pacucci et al. (2018) Pacucci, F., Loeb, A., Mezcua, M., & Martín-Navarro, I. 2018, The Astrophysical Journal, 864, L6, doi: 10.3847/2041-8213/aad8b2
- Pardo et al. (2016) Pardo, K., Goulding, A. D., Greene, J. E., et al. 2016, The Astrophysical Journal, 831, 203, doi: 10.3847/0004-637X/831/2/203
- Penny et al. (2018) Penny, S. J., Masters, K. L., Smethurst, R., et al. 2018, Monthly Notices of the Royal Astronomical Society, 476, 979, doi: 10.1093/mnras/sty202
- Pesce et al. (2021) Pesce, D. W., Palumbo, D. C. M., Narayan, R., et al. 2021, The Astrophysical Journal, 923, 260, doi: 10.3847/1538-4357/ac2eb5
- Peterson et al. (2005) Peterson, B. M., Bentz, M. C., Desroches, L.-B., et al. 2005, The Astrophysical Journal, 632, 799, doi: 10.1086/444494
- Pfister et al. (2017) Pfister, H., Lupi, A., Capelo, P. R., et al. 2017, Monthly Notices of the Royal Astronomical Society, 471, 3646, doi: 10.1093/mnras/stx1853
- Pfister et al. (2019) Pfister, H., Volonteri, M., Dubois, Y., Dotti, M., & Colpi, M. 2019, Monthly Notices of the Royal Astronomical Society, 486, 101, doi: 10.1093/mnras/stz822
- Pillepich et al. (2019) Pillepich, A., Nelson, D., Springel, V., et al. 2019, Monthly Notices of the Royal Astronomical Society, 490, 3196, doi: 10.1093/mnras/stz2338
- Planck Collaboration et al. (2014) Planck Collaboration, P., Ade, P. a. R., Aghanim, N., et al. 2014, Astronomy and Astrophysics, 571, A16, doi: 10.1051/0004-6361/201321591
- Power et al. (2003) Power, C., Navarro, J. F., Jenkins, A., et al. 2003, Monthly Notices of the Royal Astronomical Society, 338, 14, doi: 10.1046/j.1365-8711.2003.05925.x
- Reines et al. (2020) Reines, A. E., Condon, J. J., Darling, J., & Greene, J. E. 2020, The Astrophysical Journal, 888, 36, doi: 10.3847/1538-4357/ab4999
- Reines et al. (2013) Reines, A. E., Greene, J. E., & Geha, M. 2013, The Astrophysical Journal, 775, doi: 10.1088/0004-637X/775/2/116
- Reines & Volonteri (2015) Reines, A. E., & Volonteri, M. 2015, The Astrophysical Journal, 813, 82, doi: 10.1088/0004-637X/813/2/82
- Ricarte & Natarajan (2018) Ricarte, A., & Natarajan, P. 2018, Monthly Notices of the Royal Astronomical Society, 481, 3278, doi: 10.1093/mnras/sty2448
- Ricarte et al. (2019) Ricarte, A., Tremmel, M., Natarajan, P., & Quinn, T. 2019, Monthly Notices of the Royal Astronomical Society, 489, 802, doi: 10.1093/mnras/stz2161
- Ricarte et al. (2021a) —. 2021a, arXiv e-prints, arXiv:2107.02132
- Ricarte et al. (2021b) Ricarte, A., Tremmel, M., Natarajan, P., Zimmer, C., & Quinn, T. 2021b, arXiv e-prints, 2103, arXiv:2103.12124
- Rosas-Guevara et al. (2016) Rosas-Guevara, Y., Bower, R. G., Schaye, J., et al. 2016, Monthly Notices of the Royal Astronomical Society, 462, 190, doi: 10.1093/mnras/stw1679
- Sartori et al. (2015) Sartori, L. F., Schawinski, K., Treister, E., et al. 2015, Monthly Notices of the Royal Astronomical Society, 454, 3722, doi: 10.1093/mnras/stv2238
- Satyapal et al. (2009) Satyapal, S., Böker, T., Mcalpine, W., et al. 2009, The Astrophysical Journal, 704, 439, doi: 10.1088/0004-637X/704/1/439
- Satyapal et al. (2021) Satyapal, S., Kamal, L., Cann, J. M., Secrest, N. J., & Abel, N. P. 2021, The Astrophysical Journal, 906, 35, doi: 10.3847/1538-4357/abbfaf
- Satyapal et al. (2014) Satyapal, S., Secrest, N. J., McAlpine, W., et al. 2014, The Astrophysical Journal, 784, 113, doi: 10.1088/0004-637X/784/2/113
- Satyapal et al. (2008) Satyapal, S., Vega, D., Dudik, R. P., Abel, N. P., & Heckman, T. 2008, The Astrophysical Journal, 677, 926, doi: 10.1086/529014
- Satyapal et al. (2007) Satyapal, S., Vega, D., Heckman, T., O’Halloran, B., & Dudik, R. 2007, The Astrophysical Journal Letters, 663, L9, doi: 10.1086/519995
- Schirra et al. (2021) Schirra, A. P., Habouzit, M., Klessen, R. S., et al. 2021, Monthly Notices of the Royal Astronomical Society, 508, 4816, doi: 10.1093/mnras/stab2863
- Schleicher et al. (2013) Schleicher, D. R. G., Palla, F., Ferrara, A., Galli, D., & Latif, M. 2013, Astronomy and Astrophysics, 558, A59, doi: 10.1051/0004-6361/201321949
- Schramm & Silverman (2013) Schramm, M., & Silverman, J. D. 2013, The Astrophysical Journal, 767, doi: 10.1088/0004-637X/767/1/13
- Sharma et al. (2020) Sharma, R. S., Brooks, A. M., Somerville, R. S., et al. 2020, The Astrophysical Journal, 897, 103, doi: 10.3847/1538-4357/ab960e
- Shen et al. (2010) Shen, S., Wadsley, J., & Stinson, G. 2010, Monthly Notices of the Royal Astronomical Society, 407, 1581, doi: 10.1111/j.1365-2966.2010.17047.x
- Shen et al. (2020) Shen, X., Hopkins, P. F., Faucher-Giguère, C.-A., et al. 2020, Monthly Notices of the Royal Astronomical Society, 495, 3252, doi: 10.1093/mnras/staa1381
- Shields et al. (2008) Shields, J. C., Walcher, C. J., Böker, T., et al. 2008, The Astrophysical Journal, 682, 104, doi: 10.1086/589680
- Sijacki et al. (2015) Sijacki, D., Vogelsberger, M., Genel, S., et al. 2015, Monthly Notices of the Royal Astronomical Society, 452, 575, doi: 10.1093/mnras/stv1340
- Silk (2017) Silk, J. 2017, The Astrophysical Journal, 839, L13, doi: 10.3847/2041-8213/aa67da
- Somerville & Davé (2015) Somerville, R. S., & Davé, R. 2015, Annual Review of Astronomy and Astrophysics, 53, 51, doi: 10.1146/annurev-astro-082812-140951
- Stinson et al. (2006) Stinson, G., Seth, A., Katz, N., et al. 2006, Monthly Notices of the Royal Astronomical Society, 373, 1074, doi: 10.1111/j.1365-2966.2006.11097.x
- Suh et al. (2017) Suh, H., Civano, F., Hasinger, G., et al. 2017, The Astrophysical Journal, 841, 102, doi: 10.3847/1538-4357/aa725c
- Taylor & Kobayashi (2014) Taylor, P., & Kobayashi, C. 2014, Monthly Notices of the Royal Astronomical Society, 442, 2751, doi: 10.1093/mnras/stu983
- Trebitsch et al. (2018) Trebitsch, M., Volonteri, M., Dubois, Y., & Madau, P. 2018, Monthly Notices of the Royal Astronomical Society, 478, 5607, doi: 10.1093/mnras/sty1406
- Tremmel et al. (2018) Tremmel, M., Governato, F., Volonteri, M., Pontzen, A., & Quinn, T. R. 2018, The Astrophysical Journal, 857, L22, doi: 10.3847/2041-8213/aabc0a
- Tremmel et al. (2015) Tremmel, M., Governato, F., Volonteri, M., & Quinn, T. R. 2015, Monthly Notices of the Royal Astronomical Society, 451, 1868, doi: 10.1093/mnras/stv1060
- Tremmel et al. (2017) Tremmel, M., Karcher, M., Governato, F., et al. 2017, Monthly Notices of the Royal Astronomical Society, 470, 1121, doi: 10.1093/mnras/stx1160
- Tremmel et al. (2019) Tremmel, M., Quinn, T. R., Ricarte, A., et al. 2019, Monthly Notices of the Royal Astronomical Society, 483, 3336, doi: 10.1093/mnras/sty3336
- Trump et al. (2011) Trump, J. R., Impey, C. D., Kelly, B. C., et al. 2011, The Astrophysical Journal, 733, 60, doi: 10.1088/0004-637X/733/1/60
- Trump et al. (2015) Trump, J. R., Sun, M., Zeimann, G. R., et al. 2015, The Astrophysical Journal, 811, 26, doi: 10.1088/0004-637X/811/1/26
- Ueda et al. (2014) Ueda, Y., Akiyama, M., Hasinger, G., Miyaji, T., & Watson, M. G. 2014, The Astrophysical Journal, 786, 104, doi: 10.1088/0004-637X/786/2/104
- Vasudevan & Fabian (2007) Vasudevan, R. V., & Fabian, A. C. 2007, Monthly Notices of the Royal Astronomical Society, 381, 1235, doi: 10.1111/j.1365-2966.2007.12328.x
- Venemans et al. (2013) Venemans, B. P., Findlay, J. R., Sutherland, W. J., et al. 2013, The Astrophysical Journal, 779, 24, doi: 10.1088/0004-637X/779/1/24
- Vestergaard & Osmer (2009) Vestergaard, M., & Osmer, P. S. 2009, The Astrophysical Journal, 699, 800, doi: 10.1088/0004-637X/699/1/800
- Volonteri (2010) Volonteri, M. 2010, Astron Astrophys Rev, 18, 279, doi: 10.1007/s00159-010-0029-x
- Volonteri (2012) —. 2012, Science, 337, 544, doi: 10.1126/science.1220843
- Volonteri et al. (2008) Volonteri, M., Haardt, F., & Gültekin, K. 2008, Monthly Notices of the Royal Astronomical Society, 384, 1387, doi: 10.1111/j.1365-2966.2008.12911.x
- Volonteri & Natarajan (2009) Volonteri, M., & Natarajan, P. 2009, Monthly Notices of the Royal Astronomical Society, 400, 1911, doi: 10.1111/j.1365-2966.2009.15577.x
- Volonteri et al. (2020) Volonteri, M., Pfister, H., Beckmann, R. S., et al. 2020, Monthly Notices of the Royal Astronomical Society, 498, 2219, doi: 10.1093/mnras/staa2384
- Wadsley et al. (2017) Wadsley, J. W., Keller, B. W., & Quinn, T. R. 2017, Monthly Notices of the Royal Astronomical Society, 471, 2357, doi: 10.1093/mnras/stx1643
- Weigel et al. (2017) Weigel, A. K., Schawinski, K., Caplar, N., et al. 2017, The Astrophysical Journal, 845, 134, doi: 10.3847/1538-4357/aa803b
- Weinberger et al. (2017) Weinberger, R., Springel, V., Hernquist, L., et al. 2017, Monthly Notices of the Royal Astronomical Society, 465, 3291, doi: 10.1093/mnras/stw2944
- Whalen & Fryer (2012) Whalen, D. J., & Fryer, C. L. 2012, The Astrophysical Journal Letters, 756, L19, doi: 10.1088/2041-8205/756/1/L19
- Willott et al. (2010) Willott, C. J., Albert, L., Arzoumanian, D., et al. 2010, The Astronomical Journal, 140, 546, doi: 10.1088/0004-6256/140/2/546
- Wu et al. (2015) Wu, X.-B., Wang, F., Fan, X., et al. 2015, Nature, 518, 512, doi: 10.1038/nature14241
- Yajima & Khochfar (2016) Yajima, H., & Khochfar, S. 2016, Monthly Notices of the Royal Astronomical Society, 457, 2423, doi: 10.1093/mnras/stw058