Dielectric and thermodynamic study of Carbon dioxide (CO2) - methanol (CH3OH) mixture.
Abstract
In this paper is calculated and analyzed the dielectric behavior of carbon dioxide - methanol mixture and evaluate how the correct reproduction of the electrical properties of carbon dioxide and methanol influences the mixture of these two molecules.
A comparison of two carbon dioxide models and three methanol models is made, where the CO2/ model reproduces and improves the dielectric constant and for the methanol the TraPPE 2015 and MeOH-4P models improve the dielectric constant , the surface tension , and the liquid density of the pure liquid at T=298.15 K and p=1 bar.
I. Introduction
The potential for using supercritical fluids for processing a wide range of
solutes has been of increased interest over the past century
[1]. Choosing a supercritical fluid solvent for a particular
task depends on the properties of the solvent at high pressures as well as
the phase behavior exhibited by the solvent-solute mixture at processing
conditions. Progress in applying high-dielectric, polar supercritical fluids to
processing polar or ionic solutes has not been very successful since, in
general, the critical temperature for a polar solvent such as methanol
(T = 240°C) is high enough to result in very low values for the dielectric
constant. Water is the classic example of a polar solvent that switches to
non-polar behavior at temperatures greater than its critical
temperature (T, = 374°C) [2]. One technique to increase the
polarity or dielectric nature of a supercritical solvent is to add a polar
cosolvent to it.
The objective is to design a mixed solvent which has modest critical
properties as well as reasonable dielectric properties. While a great deal
has been published on the phase behavior of mixtures, only four studies have
been published on the dielectric behavior of binary mixtures at high
pressures.[3]Diguet et al. reported on the dielectric behavior of
methane-methanol mixtures at the very high pressures needed to obtain a
single phase.[4] Deul and Franck investigated the water-benzene
system at both high temperatures and high pressures.[5] Drake and
Smith investigated the dielectric behavior of the CO2-argon system and the
CO2-methanol
system at low methanol mole fractions. Dombro et al.[6] reported
on the dielectric behavior of mixtures of carbon dioxide and methanol in the
liquid and mixture-critical regions at 90 to 115°C and pressures to 240 bar.
The CO2-methanol
system is of particular interest from a processing standpoint since these
mixtures have been suggested for use with polar substrates in a wide variety
of potential applications as well as in supercritical fluid chromatography.
However, the effect of methanol on the dielectric behavior of CO2-methanol
mixtures is complicated by the
occurrence of pairwise associates which form between these two
molecules [7, 33]. Modeling and interpreting dielectric
data is a formidable task. For pure liquids, such as methanol, the
Kirkwood-Frohlich equation has been used successfully to interpret dielectric
data [9, 4, 10].
Typically the value of the structure correlation parameter for alcohols
is greater than unity since alcohol “monomers’ from linear, hydrogen bonded
multimers, which possess a dipole moment greater than that of a single
isolated alcohol molecule [11]. For example, the value of gK
for pure methanol is between 2 and 3, depending upon density and
temperature [4]. Although increasing density promotes the
formation of long-chain multimers, above a certain density
further increases in density decreases Gk since the large linear alcohol
multimers break into shorter chain segments at high densities[4].
Although the analytical expression suggested by Bottcher et al [12] has
been used to describe the dielectric behavior of a mixture consisting of
polar and non-polar components, the parameter Gk in that expression is an
empirically fitted function of temperature, density and composition. Also,
this equation does not account for quadrupolar interactions between the
molecules as are found for the
CO2-methanol system.
One of the challenges of molecular dynamics simulation is the
formulation of realistic potential energy functions describing
molecular interactions in the condensed phase with accurate
force-field parameters. The dielectric constant has particular
relevance in solubility processes and for the appropriate
description of the separation of liquid phases in mixtures
having polar components. Unfortunately, nonpolarizable force
fields are known to have dificulties in reproducing this
property. [13]
New force fields capable of more accurately reproducing electrical properties [14, 16, 17, 18, 19] are helping to better understand mixtures[15, 17, 19, 20].
Regarding CO2, the new force field of Fuentes et al CO2/[21] is used in this work, this model reproduces the dielectric constant, surface tension and density at various conditions of pressure and temperature, was also taken into account the TraPPE model of CO2/TraPPEflex[22]. For the methanol molecule we used the TraPPE [23] the TraPPE2015 [18] and MeOH-4P[26] models, the last two were reparameterized to reproduce the dielectric constant , the surface tension , and the liquid density of the pure liquid at T=298.15 K and p=1 bar.
The remaining of the paper goes as follows. In section 2 the models are introduced. Section 3 shows the simulation details,Section 4 the results are analysed in Section 5. Conclusions are presented.
II. The Models
A. Carbon dioxide, CO2
The two CO2 models used in this work have the same type of potential. The Carbon - Oxygen bond is fixed and the angle formed by the two Oxygens with the Carbon is flexible; To add flexibility, a harmonic potential is used in the angle, which is described by the three atoms that form the molecule. The flexibility that is added to the potentials has helped to improve the reproduction of various properties at different conditions of pressure and temperature. [24, 25]
| (S.1) |
where is the angle O-C-O and referes to the equilibrium value, is the spring constant. Table 1 shows the potential parameters for the CO2 models used in this work
| model | d OC | Kθ | q | qC | |||||
|---|---|---|---|---|---|---|---|---|---|
| Å | deg | K | Å | K | Å | e | e | ||
| CO | 1.17 | 500 | 180 | 45.712 | 3.760 | 284.257 | 2.62600 | -0.3760 | 0.7520 |
| CO2/TraPPEFlex | 1.16 | 1236 | 180 | 79 | 3.05 | 27 | 2.8 | -0.35 | 0.7 |
B. Methanol, CH3OH
Table 2 shows the potential parameters for the methanol models used in this work; all methanol models in this table use rO-H= 0.945 Å, rO-Me= 1.43 Å, = 108.5∘, flexural constant is k=460.67 kJ mol -1 rad 2 .
| Model | qO /e | qH /e | q /e | qM /e | lOM / Å | ||||
|---|---|---|---|---|---|---|---|---|---|
| TraPPE | 92.9950 | 3.0200 | 97.9980 | 3.7500 | -0.7000 | 0.4350 | 0.2650 | - | - |
| TraPPE2015 | 83.7142 | 3.0200 | 88.2126 | 3.7500 | -0.7490 | 0.4650 | 0.2840 | - | - |
| MeOH-4P | 90.1180 | 3.1655 | 106.0320 | 3.6370 | 0.0000 | 0.4998 | 0.1546 | -0.6544 | -0.037 |
For the intermolecular potentail between two molecules the LJ and Coulomb interactions are used,
| (S.2) |
where is the distance between sites and , is the electric charge of site , is the permitivity of vacuum, is the LJ energy scale and the repulsive diameter for an pair. The cross interactions between unlike atoms are obtained using the Lorentz-Berthelot mixing rules,
| (S.3) |
III. The Simulation Details
Simulations on binary mixtures, CO2/methanol in the liquid phase were performed using GROMACS [27] software, version 2018. In the simulations 864 total molecules were used, 633 CO2 and 231 methanol, which forms a mole fraction of XCH3OH=0.267. The NPT ensemble was used and the equations of motion were solved using the leapfrog algorithm with a time step of 2 fs with a parameter of 0.5 and LINCS[28] algorithm to keeps bond distances, using the Nosé-Hoover thermostat and Parrinello-Rahman barostat were applied with parameters of 0.6 and 1.0 ps, respectively . Electrostatic interactions were handle with the particle mesh Ewald (PME) method [29] with a grid space of 0.35 nm and a spline of order 4 and a truncation distance.The cutoff distance was 1.0 nm for both the real part of Coulomb potential and LJ interactions, within a simulation box of Lx = Ly = and Lz = 4.39186 nm. The average properties were obtained for at least 30 million configurations (60 ns) after equilibration. The simulation error for the dielectric constant was estimated from the results of three independent simulations.
IV. Results
A. CO2 - CH3OH mixture
Density,
The liquid density is obtained using,
| (S.4) |
where M is the mass of the system and the average volume of the
simulation cell.
For this molecular dynamic study, the mixtures simulations were
at the concentration of XCH3OH=0.267 at isothermal condition of T = 323 K
using different pressures. The choice of the isothermal
temperature of 323 K and the X CH3OH = 0.267 has been determined by the wealth of experimental data available at this temperature and concentration, including the data used as the input of the simulations.
In figure 1 the total density as function of the pressure is shown
for the different force fields combination. As general trend the
CH3OHMeOH-4P - CO2/TraPPE flex has higher values than the other mixtures,
however when the experimental data are compared with the simulations
the using CO2/ mixtures are slightly better at different pressures.
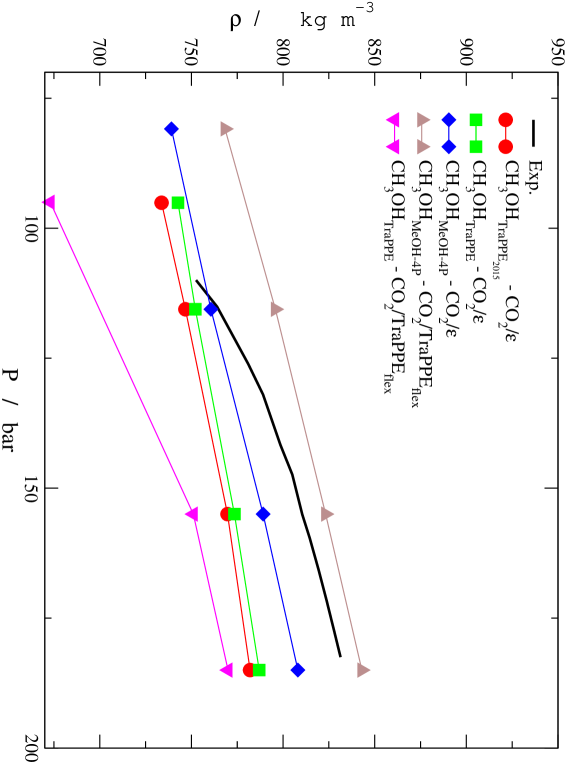
The mixture represented by CH3OHMeOH-4P - CO2/ is more close to the experimental data than the other force fields combination in the region of 115 bars and 130 bars. This result is because the molecule is flexible in the angle, in such a way that it is capable of changing its structure under certain thermodynamic conditions, as will be seen in the structural analysis that follows in this work.
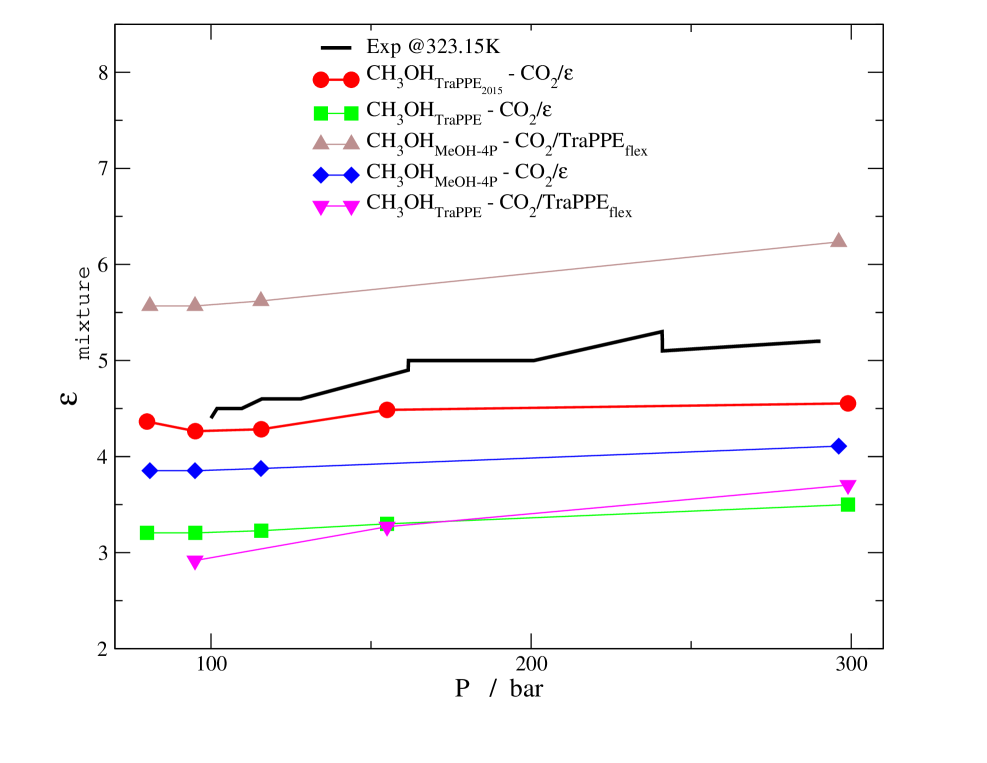
Dielectric properties
The dielectric constant as function of the pressure is calculated and plotted in figure 2. It is observed in all cases that the dielectric constant increases with the pressure, however it is noted that the CH3OH - CO2/ mixture fits better the experiments than the other models. The CH3OH4sites - CO2/TraPPE flex overestimate the value by 10% and the other combinations underestimate the experimental value by more than 15%. Although the two models CH3OH4sites and CO2/ reproduce the dielectric constant better than others force fields, the combination in this case did not improve the reproduction at these conditions of pressure and temperature, being the combination of the model CH3OH with CO2/ that is closest to the experimental value. The freedom that the CO2/ molecule has in the angle through the harmonic potential, helps to have a better calculation of electrical properties; in recent work[24, 25] it has been shown that this type of parameterization helps a closer reproduction of the experimental data.
The calculations of the dielectric constant was obtained by the fluctuations [30] of the total dipole moment M,
| (S.5) |
where is the Boltzmann constant, V and M denote the volume and the total dipole moment of the simulation box and the absolute temperature. The dielectric constant is obtained for long simulations at constant pressure and temperature, isothermal-isobaric emsamble.
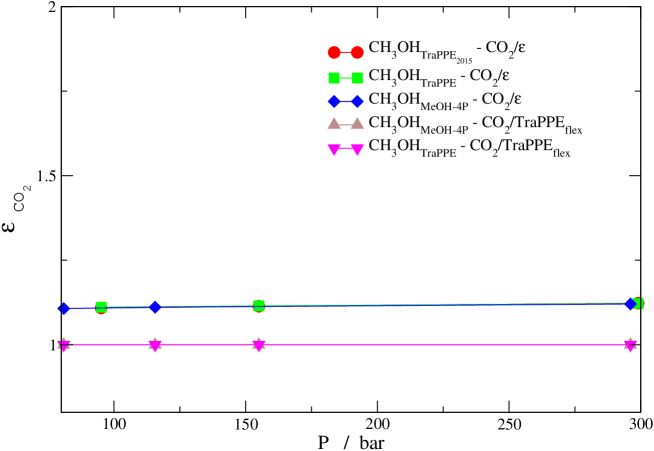
A relevant part of molecular dynamics is that the molecules can be studied separately in the mixture and thus obtain the average of their dipole moment, as reported in the table 3; through that is calculated the dielectric constant of each component, which is induced by the presence of the other component. In the figure 3, we can see the behavior at different pressures of CO2 component in the mixeture with CH3OH, where independent of the CH3OH model, the flexible CO2/ model describes a dielectric constant closer to the experimental value of 1.3 when it is in an unmixed phase at 323.15 K.
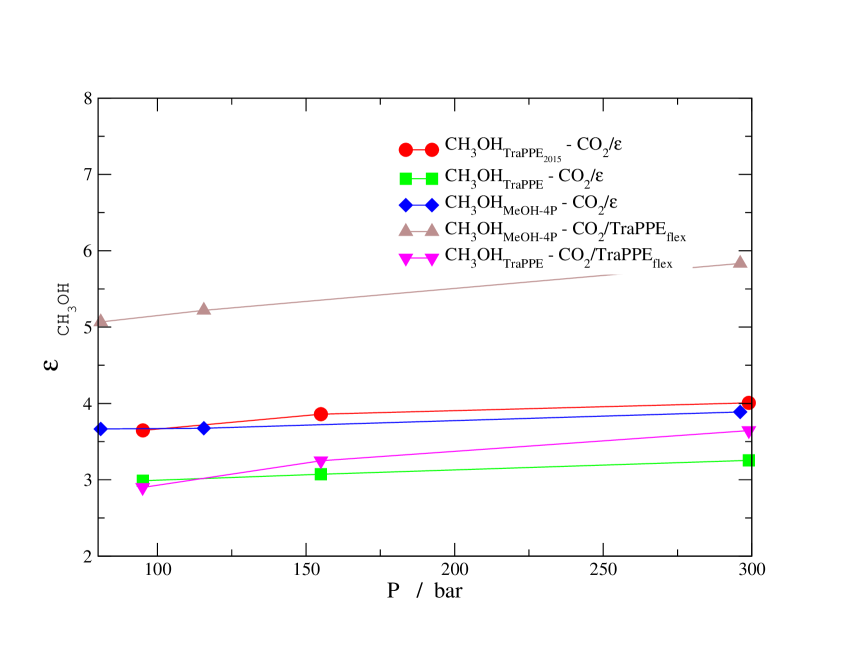
The dielectric constant of the CH3OH in the mixture is presented in the figure 4, although the model CH3OH4sites is parameterized to reproduce the dielectric constant, it does not have the same dipole moment in the mixture with different models of CO2 as seen in the figure 4 and reported in the table 3. When changing the CO2 model, the dielectric constant increases, it is noted that CO2 modifies the average structure and that with the combination of CO2/ and with the models of methanol CH3OHMet-4P and CH3OHTraPPE-2005 describe an almost similar dielectric constant, which makes these combinations make the best reproduction of the experimental value, figure 2
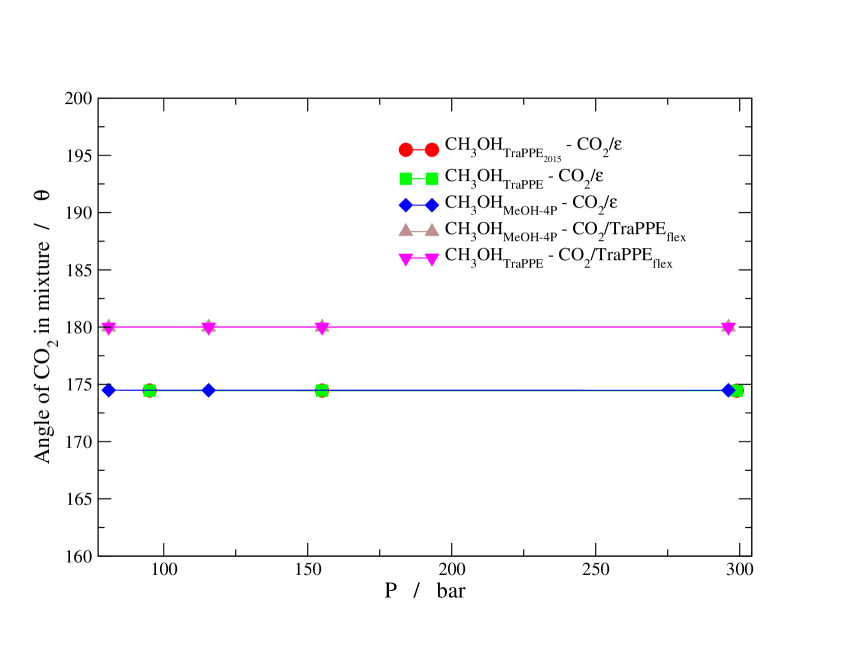
The average angle is plotted in figure 5. The value of the angle is the average value of the distribution in the simulation, and it is a normal distribution with averages in the value that is reported. As a general trend, the angle is lower for the CO2/ model than that for the CO2/TraPPE Flex model that does not change despite containing the harmonic potential in the angle
The flexibility of the CO2/ give the posibility to the molecule to change the angle, an analysis of this, from 80 to 300 bar of pressure, is represent in the figure 5. In previous work by Fuentes et al [31], was found that under an electric field the CO2 molecule undergoes a change in its structure (angle, dipole moment) and with the results in this work, indicate that the molecule changes its structure what makes the molecule modifies its dipole moment under electrical conditions, either by an electric field or by a polar solvent such as methanol. The change in angle remains constant independent of the occupied methanol model, as seen by using the models CH3OHMeOH-4P, CH3OH and CH3OHTraPPE,then the freedom, in the molecule, to adapt the structure in addition to the reparametrization with target properties helps to better reproduce the experimental values as seen in the tables 4 and 5.
The value in the average of the angle is related to the instantaneous values of the polarization of the sample at every step of simulation. The dielectric constant with periodic boundary conditions was calculated from
| (S.6) |
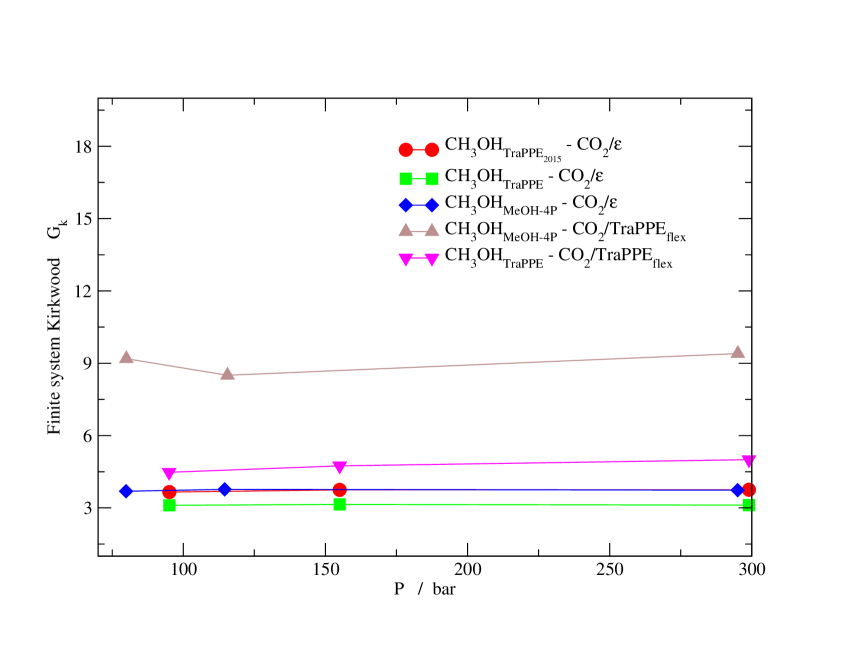
where Gk is the finite system Kirkwood factor related to the relative orientation of individual molecular dipoles
| (S.7) |
where is the dipole of a reference molecule, 1, at the center of a sphere of radius r. M1(r) is the sum total of dipoles in the sphere (including the dipole of molecule 1). Local orientational correlations are averaged out by thermal motion after the first few coordination shells.The short-range character of Gk(r) was demonstrated by integral equation theory for the simplest of models for dipolar fluids: hard spheres with a point dipole fixed at the center.[32] This relation can be shown to hold for any point dipole system assuming that the dielectric constant is local. [33]
Is important to specify that the simulations are long at least 60 ns to get reliable statistics from models having enhanced dipole moments because of the large fluctuations in the dynamics. The polarisation factor GK (equation S.7) [34]is described in figure 7, in order to compare if the force field change its polarisation, is noted that the polarization of the combinations CH3OH - CO and CH3OHMeOH-4P - CO are similar and this combinations reproduce better the dielectric constant.
| model CH3OH | model CO2 | dm mixture | dm | dm |
|---|---|---|---|---|
| debye | debye | debye | ||
| TraPPE2005 | CO | 0.8943 | 2.421 | 0.3371 |
| TraPPE | CO | 0.8494 | 2.253 | 0.337 |
| MeOH-4P | CO | 0.8565 | 2.2848 | 0.3348 |
| MeOH-4P | CO2/TraPPEflex | 0.6109 | 2.2848 | 0 |
| TraPPE | CO2/TraPPEflex | 0.6784 | 2.2512 | 0 |
The argument of the dipole moment can be explained in terms of the O-C-O angle , the results for the CO2/ force field indicate that a dipole moment is induced between the oxygens and the carbon in the molecule, due to the interaction with methanol independent of the model used.
The electric polarization of a polar molecule is made up of orientation, atomic and electric polarization. The orientation polarization can be determined from complex permittivity or so-called dielectric spectroscopy measurements, with the results in this work help to have more teorical data to compare with the dielectric spectroscopy data. In figure 7, the CO2/TraPPEflex molecule induces a greater polarization to the system, that is, to the methanol molecules, which causes the dielectric constant to be underestimated by around 20. In the case of the combination of CO2/ and CO3OH/TraPPE there is a slight decrease in the polarization of the system, but because the CH3OH/TraPPE does not reproduce the dielectric constant [18] the calculated value is underestimated by almost 80 figure 2.
Self Diffusion coefficient
The diffusion coefficient was obtained from the long-time limit of the mean square displacement according to the Einstein relation [Allen],
| (S.8) |
where r(t) corresponds to the position vector of the center of mass at time t and the averaging is performed over both time origins.
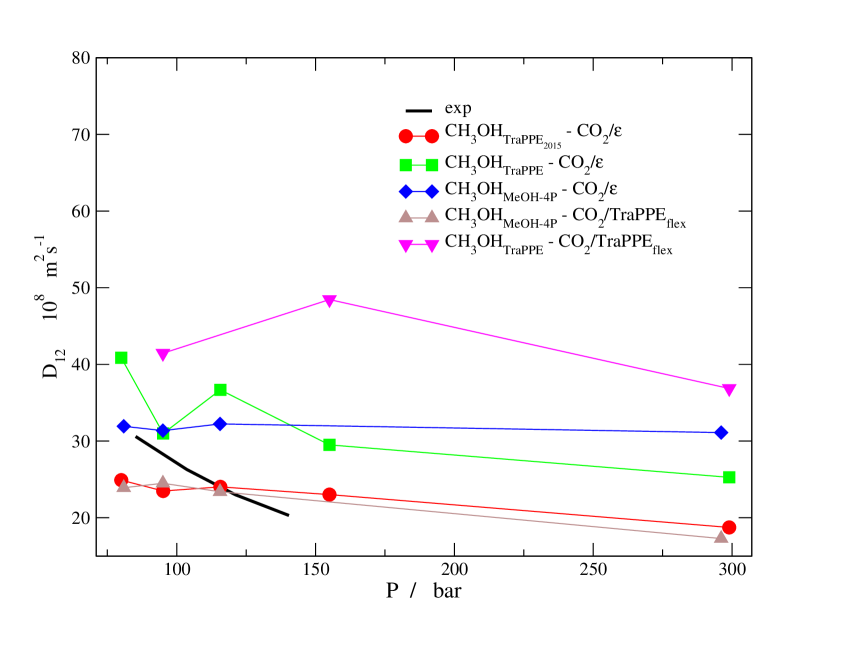
The self Diffusion coefficients are also study in the mixtures, figure 7 show the different features, the CH3OH/CO and CH3OHMeOH-4P/CO2/ mixtures have similar values and they reproduce the experimental data[37] at 115 bar but at lower pressures the values have a difference of more than 10 percent. The CH3OHMeOH-4P/CO have a percent of difference in the 95.1 bar but at high pressures deviates from the reproduction of the experimental values. The other combination are further away from the experimental values,
In tables 4 and 5 are compared the combination of the CO2 and CH3OH in the mixture with X=0.257 respect to the experimental data that can reproduce follow the procedure used to qualify water models [25] for a certain property the prediction of the mixture model adopts the value X, and the experimental value is Xexp. The score is calculated by the equation S.9
| (S.9) |
where the tolerance tol is given as a percentage and anint is the nearest integer function.
The values that reproduce the force fields CH3OH - CO are the closest to the experimental value, taking into account a tolerance of 2 percent for the density and dielectric constant and a 5 percent tolerance for diffusion, which takes into account the error that this property has in the simulation.
| Force fields | CO2/ | CO2/ | CO2/ | CO2/ , | CO2/ | CO2/ | ||
| CH 3OH | CH 3OH TraPPE | CH 3OH MeOH-4P | CH 3OH | CH 3OH TraPPE | CH 3OH MeOH-4P | |||
| Property | Exp. | Quantity | Quantity | Quantity | Tol. (%) | Score | Score | Score |
| Densities at 323.15K | ||||||||
| [115.6 bar] | 765 | 746.7 | 752.152 | 760.634 | 2 | 8.80 | 9.16 | 9.71 |
| [155 bar] | 810.36 | 769.712 | 773.485 | 789.12 | 2 | 7.49 | 7.72 | 8.69 |
| Static dielectric constant at 323.15K | ||||||||
| [100 bar] | 4.41 | 4.27 | 3.22 | 5.59 | 2 | 8.41 | 0.00 | 0.00 |
| [115.6 bar] | 4.57 | 4.27 | 3.22 | 5.63 | 2 | 6.72 | 0.00 | 0.00 |
| [155 bar] | 4.82 | 4.49 | 3.33 | 5.77 | 2 | 6.58 | 0.00 | 0.15 |
| [280 bar] | 5.19 | 4.57 | 3.46 | 6.19 | 2 | 4.03 | 0.00 | 0.37 |
| Self-diffusion coefficient/cm2s-1 at 323.15K | ||||||||
| D | 28.2 | 23.43 | 30.64 | 31.37 | 5 | 6.62 | 8.27 | 7.75 |
| D | 24.05 | 24.04 | 36.7 | 32 | 5 | 9.99 | 0.00 | 3.39 |
| Overall score (out of 10) | 7.33 | 3.14 | 3.76 | |||||
| Force fields | CO2/TraPPEFlex | CO2/TraPPEFlex | CO2/TraPPEFlex | CO2/TraPPEFlex | ||
| CH 3OH MeOH-4P | CH 3OH TraPPE | CH 3OH MeOH-4P | CH 3OH TraPPE | |||
| Property | Exp. | Quantity | Quantity | Tol. (%) | Score | Score |
| Densities at 323.15K | ||||||
| [115 bar] | 765 | 796.44 | 700.3 | 2 | 7.95 | 5.77 |
| [155 bar] | 810.36 | 823.38 | 751.9 | 2 | 9.20 | 6.39 |
| Static dielectric constant at 323.15K | ||||||
| [100 bar] | 4.41 | 5.58 | 2.96 | 2 | 0.00 | 0.00 |
| [115.6 bar] | 4.57 | 5.63 | 3.05 | 2 | 0.00 | 0.00 |
| [155 bar] | 4.82 | 5.75 | 3.26 | 2 | 0.35 | 0.00 |
| [280 bar] | 5.19 | 6.18 | 3.65 | 2 | 0.46 | 0.00 |
| Self-diffusion coefficient/cm2s-1 at 323.15K | ||||||
| D | 28.2 | 24.47 | 41.41 | 5 | 7.35 | 0.63 |
| D | 24.05 | 23.42 | 43.92 | 5 | 9.48 | 0.00 |
| Overall score (out of 10) | 4.35 | 1.60 | ||||
V. Conclusions
This paper present the calculations of the dielectric behavior
CO2-methanol mixtures at different termodynamics conditions. In previous work by Fuentes et al [31], was found that under an electric field the CO2 molecule undergoes a change in its structure and therefore the dipole moment. The results in this paper indicate that the molecule changes its structure what makes the molecule modifies its dipole moment due to contact with a polar solvent such as methanol as happened under electrical conditions.
The force fields CH3OH - CO transfer the values they reproduce to the mix and this helps to have results closer to the experimental data. These force fields have been parameterized to reproduce the dielectric constant, surface tension and the density.
The above indicates that the formulation of realistic potential energy functions describing molecular interactions in the condensed phase with accurate force-field parameters allows the study of mixtures with a better approximation to the experimental data. The dielectric constant has particular relevance in solubility processes of liquid phases in mixtures having polar components.
VI. Acknowledgements
RFA thanks DGAPA-UNAM for a postdoctoral fellowship. and also thank the SECTEI of Mexico city for financial support.
References
- [1] McHugh, M.A.; Krukonis, V.J. Supercritical Fluid Extraction: Principles and Practice. Butterworth-Heinemann, Boston, MA 1993.
- [2] Franck, E.U. Thermophysical properties of supercritical fluids with special consideration of aqueous systems. Fluid Phase Equilibria 1983, 10, 211-222.
- [3] Diguet, R.; Deul, R.; Franck, E.U. Static dielectric constant and density of supercritical methane-methanol-mixtures to 200 MPa. Ber Bunsenges. Phys. Chem.1987, 91, 551-556.
- [4] Deul, R. and Franck, E.U., The static dielectric constant of the water-benzene mixture system to 400°C and 2800 bar. Ber Bunsenges. Phys. Chem.1991, 95, 847-853.
- [5] Drake, B.D.; Smith, R.L. Measurement of static dielectric constants of supercritical fluid solvents and cosolvents: Carbon dioxide and argon, carbon dioxide, and methanol at 323 K and pressures to 225 MPa. J. Supercritical Fluids 1990, 3, 162-168.
- [6] Dombro, R.A.; Prentice, G.A.; Westgate, CF.; McHugh, M.A. Dielectric constant behavior of carbon dioxide-methanol mixtures in the mixture critical and liquid-phase regions. Fluid Phase Equilibria1991, 61, 227-241
- [7] Hemmaplardh, B.; King, A.D. Solubility of methanol in compressed nitrogen, argon, methane, ethylene, ethane, carbon dioxide, and nitrous oxide. Evidence for association of carbon dioxide with methanol in the gas phase. J. Phys. Chem. 1972, 76, 2170-2175.
- [8] Fulton, J.L.; Yee, G.G.; Smith, R.D. Hydrogen bonding of simple alcohols in supercritical fluids: An FT-IR study. Paper presented at the AIChE meeting, Los Angeles, CA, November. 1991
- [9] Akhadov, Y.Y. Dielectric Properties of Binary Solutions. Pergamon Press, Oxford. 1981.
- [10] Smyth, C.P., Dielectric Behavior and Structure. International Chemical Series, Mc-Graw-Hill Book Company, New York.1955.
- [11] Prausnitz, J.M.; Lichtenthaler, R.N.; de Azevedo, E.G. Molecular Thermodynam-ics of Fluid Phase Equilibria, Prentice-Hall, Englewood Cliffs, NJ.1986.
- [12] Bottcher, C.J.F.; Bordewijk, P. Dielectrics in Time-Dependent Fields. Theory of Electric Polarization. Elsevier, Amsterdam. 1978.
- [13] Caleman, C.; van Maaren, P. J.; Hong, M.; Hub, J. S.; Costa, L. T.; van der Spoel, D. Force Field Benchmark of Organic Liquids: Density, Enthalpy of Vaporization, Heat Capacities, Surface Tension, Isothermal Compressibility, Volumetric Expansion Coefficient, and Dielectric Constant. J. Chem. Theory Comput. 2012, 8, 61-74.
- [14] Fuentes-Azcatl, R. Mendoza, N.; Alejandre, J.; Improved SPC force field of water based on the dielectric constant: SPC/. J.Physica A. 2015, 420, 116-123.
- [15] Núñez-Rojas, E.; García-Melgarejo, V.; de la Luz, A.P.; Alejandre, J. Systematic parameterization procedure to develop force fields for molecular fluids using explicit water. Fluid Phase Equilibria 2019, 490, 1-12.
- [16] Fuentes-Azcatl R.; Alejandre, J.; Non-Polarizable Force Field of Water Based on the Dielectric Constant: TIP4P/. J. Phys. Chem. B. 2014, 118(5), 1263-1272.
- [17] Fuentes-Azcatl, R.; Barbosa, M.C.; Sodium Chloride, NaCl/: New Force Field. J.Phys.Chem.B. 2016, 120, 2460-2470.
- [18] Salas,F.J.; Méndez-Maldonado,G.A.; Núñez-Rojas, E.; Aguilar-Pineda,G.E.; Domínguez,H.; Alejandre, J. J. Chem. Theory Comput.2015, 11, 683-693.
- [19] Fuentes-Azcatl, R.; Barbosa,M.C. Potassium bromide, KBr/: New Force Field, Physica A. 2018, 491, 480.
- [20] Fuentes-Azcatl, R.; Araujo, G.J.C.; Lourenço,T.C. ; Costa,C.T.O.G.; Carneiro,J.W. de M.; Costa, L.T. Dielectric behavior of Water in [bmim] [Tf2N] room-temperature Ionic Liquid, molecular dynamic study. Theor Chem Acc 2021,140, 125.
- [21] Fuentes-Azcatl, R.; Dominguez,H.; Prediction of experimental properties of CO2: improving actual force fields. J. Mol. Modeling. 2019, 25, 146.
- [22] Orozco GA, Economou IG, Panagiotopoulos AZ. Optimization of intermolecular potential parameters for the CO2/H2O mixture. J Phys Chem B 2014, 118, 11504-11511.
- [23] Chen, B.; Potoff, J. J.; Siepmann, J. I. Montecarlo Calculations for Alcohols and their Mixtures with Alkanes. Transferable Potentials for Phase Equilibria. 5. United-atom Description of Primary, Secondary, and Tertiary Alcohols. J. Phys. Chem. B 2001, 105, 309-3104.
- [24] Fuentes-Azcatl, R.; Barbosa,M.C. Flexible Bond and Angle, FBA/ model of water model of water. Journal of Molecular Liquids. 2020, 303, 112598.
- [25] Fuentes-Azcatl, R. Flexible Model of Water Based on the Dielectric and Electromagnetic Spectrum Properties: TIP4P/. Flex. J.Mol. Liq. 2021, 120, 116770.
- [26] Martínez-Jiménez, M.; Saint-Martin, H. A four-site molecular model for simulations of liquid methanol and water–methanol mixtures: MeOH-4P. J. Chem. Theory Comput. 2018 14, 2526-2537.
- [27] Hess, B.; Kutzner, C.; van der Spoel, D.; Lindahl, E. J. Chem.Theory Comput. 2008, 4, 435-447.
- [28] Hess, B.; Bekker, H.; Berendsen, H. J. C.; Fraaije, J. G. E. M. LINCS: A Linear Constraint Solver for Molecular Simulations. J. Comput. Chem. 1997, 18, 1463-1472.
- [29] Essmann, U.; Perera, L.; Berkowitz, M. L.; Darden, T.; Lee, H.; Pedersen, L. G. J. Chem. Phys. 1995, 103, 8577-8593.
- [30] M. Neumann, Dipole moment fluctuation formulas in computer simulations of polar systems. Mol. Phys. 1983, 50, 841.
- [31] Fuentes-Azcatl, R.; Domínguez, H. Carbon Dioxide Confined between Two Charged Single Layers of Graphene: Molecular Dynamics Studies. J. Phys. Chem. C 2019, 123, 23705-23710.
- [32] Stell, G.; Patey, G. N.; Høye, J. S. Dielectric Constants of Fluids Models: Statistical Mechanical Theory and Its Quantitative Imple- mentation. Adv. Chem. Phys. 1981, 48, 185-323
- [33] Fulton, R. L. On the theory of dielectric relaxation. Mol. Phys. 1975, 29, 405-413.
- [34] Glattli,A.; Daura, X.; van Gunsteren, W. F. J. Chem. Phys. 2002, 116, 9811.
- [35] Richard L. Smith, Jr., Sung B. Lee, Sachio Suzuki, Chie Saito, Hiroshi Inomata, and Kunio Arai. Densities of Carbon Dioxide + Methanol Mixtures at Temperatures from 313.2 to 323.2 K and at Pressures from 10 to 20 MPa. J. Chem. Eng. Data 2002, 47, 608-612.
- [36] Roškar, V.; Dombro, R.A.; Prentice, G.A.; Westgate, C.R.; McHugh, M.A. Comparison of the dielectric behavior of mixtures of methanol with carbon dioxide and ethane in the mixture-critical and liquid regions. Fluid Phase Equilib. 1992, 77, 241.
- [37] Frank, M.J.W.; Kuipers, J.A.M.; van Swaaij, W.P.M. Diffusion Coefficients and Viscosities of CO2 + H2O, CO2 + CH3OH, NH3 + H2O, and NH3 + CH3OH Liquid Mixtures. J. Chem. Eng. Data 1996 41, 297-302.