Strong influence of the Pd-Si ratio on the valence transition in EuPd2Si2 single crystals
Abstract
Single crystals of intermediate valent EuPd2Si2 were grown from an Eu-rich melt by the Bridgman as well as the Czochralski technique. The chemical and structural characterization of an extracted single crystalline Czochralski-grown specimen yielded a slight variation of the Si-Pd ratio along the growth direction and confirms the existence of a finite Eu(Pd1-mSim)2Si2 homogeneity range. The thorough physical characterization carried out on the same crystal showed that this tiny variation in the composition strongly affects the temperature at which the valence transition occurs. These experiments demonstrate a strong coupling between structural and physical properties in the prototypical valence-fluctuating system EuPd2Si2 and explain the different reported values of .
I Introduction
The study of emergent phenomena due to strong electron-electron interactions is at the heart of research in condensed matter. For these type of systems, the coupling of electronic degrees of freedom to the lattice are usually not that much in the focus of research. In recent years, however, more and more physical phenomena have arisen in materials which additionally show a strong coupling of the electronic degrees of freedom to the lattice. Examples are tetragonal iron-based superconductors, where a so-called collapsed tetragonal phase appears upon cooling or application of pressure which is connected to an abrupt change in the -lattice parameter [1]. In the organic conductor -(BEDT-TTF)2CuN(CN)Cl, the breakdown of Hooke’s law was observed in a certain pressure-temperature range at the Mott-metal insulator transition and the appearance of critical elasticity was proposed [2]. In the past, intermetallic Eu systems were studied due to the intermediate valent nature of Eu in these compounds. The change of the Eu valence can be tuned by temperature [3] and/or pressure [4]. Nowadays, these compounds attract attention due to the large volume changes accompanied by the valence transition. Eu can occur in different valence states which are very close in energy. The magnetic Eu(2+δ)+ ( configuration) leading to a larger unit cell volume, appears at low pressures and high temperatures whereas the non-magnetic Eu ( configuration) leading to a smaller unit cell volume is adopted at high pressures and low temperatures. In a general phase diagram, the two regions are separated at low temperatures by a line of first-order valence transitions [5]. Of special interests are intermediate-valent Eu-122 compounds which can be tuned by pressure (temperature) towards the second order critical endpoint of the line of the first order valence transitions. In particular, EuPd2Si2 is proposed to be located very close to the critical pressure in the generic phase diagram. The extrapolation of results obtained on polycrystalline samples yielded that EuPd2Si2 is located on the high-pressure side of the critical endpoint [6, 7]. It is expected that also in EuPd2Si2 critical elasticity meaning a strong lattice softening and non-linear strain-stress relations might occur.
First reports on EuPd2Si2 appeared in the 1980’s where the intermediate-valent nature of Eu was studied. Here, a strong temperature dependence of the Mössbauer isomer shift together with a maximum in the temperature dependence of the magnetic susceptibility was observed for the first time in a Eu-based intermediate valent compound [8]. The rare earth ion undergoes a valence transition from Eu2.2+ at room temperature to Eu2.9+ in the bulk at low temperature while photoemission spectroscopy revealed divalent Eu at the surface in the whole temperature range [8, 9, 3]. The increase of the Eu valence in the bulk upon cooling strongly influences the lattice parameters. In particular, it causes a change of the parameter while the parameters remains nearly unchanged. The analysis of the Bragg line-widths shows a broadening of the () and therefore suggested the existence of a temperature dependent distribution of parameters in powder samples [10]. A valence transition can be induced not only by decreasing the temperature but also by applying pressure which was revealed first by electrical resistivity and thermoelectric power measurements [11]. Later on, from the temperature as well as the pressure dependence of the electrical resistivity, the linear compressibility and the thermal expansion a pressure-temperature (p-T) phase diagram was constructed by Batlogg et al. [6]. From these data it was concluded that EuPd2Si2 shows a continuous phase transition and is situated near the critical endpoint of a line of first order phase transitions in the p-T diagram. It was proposed that this endpoint can be reached by applying low negative chemical pressure for instance via substitution of the smaller Pd atoms by larger Au atoms [12]. It was shown by Mössbauer effect measurements that the transition becomes first order when applying negative chemical pressure as for instance for in Eu(Pd1-xAux)2Si2 [13]. EuPd2Si2 was studied by neutron scattering and by measurements of the magnetic susceptibility. It turned out that the tail in the static susceptibility at low temperatures can be caused by the ordering of a magnetic secondary phase [14]. Although, EuPd2Si2 is one of the prototypical valence-fluctuating systems, previous studies were mostly carried out on polycrystalline samples. It should be mentioned that the crystal growth of Eu compounds is challenging due to the high vapour pressure of Eu and its affinity to oxygen. Only recently small single crystals of EuPd2Si2 grown by the Bridgman method became available [5]. The comparison of poly and single crystal heat capacity data from different sources [15, 5] shows strong sample dependencies concerning the temperature at which the valence transition occurs. From this fact one might speculate that EuPd2Si2 is a compound that exists in a homogeneity range as it was already found for the related material ErPd2Si2 [16]. In [17] an EuPd2-xSi2+x alloy series was studied, the respective samples were prepared by arc-melting followed by an annealing step. The samples studied contained either secondary phases or grain boundaries where magnetic impurities accumulated. Due to this fact, the information that can be gained from their magnetic characterization is limited. This motivates further attempts to grow single crystals with a minimum of magnetic inclusions which enable studies of the physical properties in connection with the study of the structural details of the material in a reliable manner.
We used the Czochralski method to provide large and pure single crystals of EuPd2Si2 and studied the influence of the Pd-Si composition change in a sample on its physical properties. This will help to figure out in future studies whether the scenario of critical elasticity [18], which was recently proposed for the Mott transition in -(BEDT-TTF)2CuN(CN)Cl, can be found in EuPd2Si2.
II Experimental Details
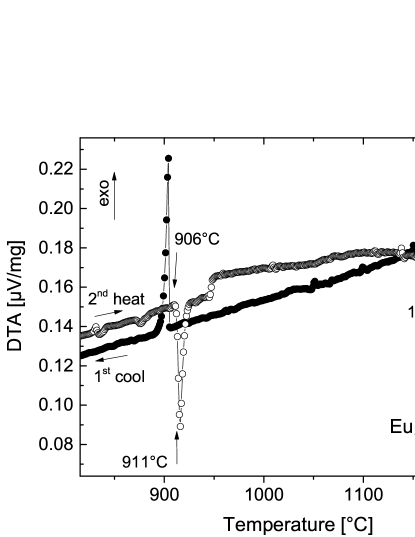
A Simultaneous Thermal Analysis device (STA 449 C, Netzsch), which allows simultaneous thermogravimetry (TG) and differential thermal analysis (DTA) was used to get insight in the solidification process of an Eu-enriched starting stoichiometry. DTA under Ar flow was done with a heating/cooling rate of using different stoichiometries EuPdSi (Eu1.4, Fig. 1) and EuPdSi (Eu1.5) in Al2O3 and graphite crucibles. We observed a strong evaporation of Eu leading to a weight loss of up to and a reaction with the Pt wires of the thermocouple. Furthermore, we found that the Al2O3 crucible was attacked by the melt and that Al was incorporated in the sample. The DTA signal of the second cooling from a run in a graphite crucible, Fig. 1, shows two features. One which indicates the solidification of EuPd2Si2 in the flux at 1186∘C for the Eu1.4 sample (1205∘C for Eu1.5) and a second which belongs to the solidification of the flux itself at 906∘C. For the crystal growth from a Eu-rich melt, high purity elements Eu (99.99%, chunks, Alpha Aesar), Pd (99.999%, rod, Heraeus), Si (99.99%, pieces, Cerae) were used in a ratio of EuPdSi as proposed by [5]. The Bridgman growth was done from the elements in a vertical resistive furnace (GERO HTRV70-250/18). Since the crucible material tantalum was attacked by the melt, we used an additional graphite inner crucible.
The Czochralski growth was done using prereacted material with a total weight of up to . The initial stoichiometry varied from Eu1.2-1.5Pd2Si2. In the first step, the binary compound PdSi (C) was prepared by arc melting, to reduce the high melting points Tm of Pd (1555∘C) and Si (1414∘C). Afterwards using a glove box, this material together with elementary Eu (TC) was put in a glassy carbon inner crucible and enclosed in a niobium outer crucible. We used a box furnace (Linn) to heat the precursor up to 835∘C under Ar flow. The Czochralski crystal growth was done in an Arthur D. Little growth chamber equipped with a high-frequency generator from Hüttinger. The chamber was filled with an Ar pressure of 20 bar to slow down the evaporation of Eu at high temperature. The air-sensitive precursor was quickly put in a cold copper crucible of a levitation setup followed by an extended purging to remove oxygen. This setup enables a quasi crucible-free crystal growth from a levitating melt which is necessary due to the strong reaction of the melt with any tested crucible material.
In a fist, initial step and for the T dependence we used powder X-ray diffraction (PXRD, Cu-Kα radiation) to check the lattice parameters of crushed single crystals and energy- and wavelength-dispersive X-ray spectroscopy (EDX, WDX) to determine their chemical composition.
EDX measurements were performed at the Kristall- und Materiallabor, Goethe Universität Frankfurt, using a scanning electron microscope, Zeiss DSM 940 A, with an additional energy dispersive detector (EDAX Ametek GmbH). At the KIT, the chemical composition of the crystals was examined by energy-dispersive x-ray spectroscopy employing a Coxem EM-30N benchtop scanning electron microscope equipped with an Oxford Instruments detection system.
WDX measurements were performed with a JEOL-8530F Plus Hyperprobe at the Institut für Geowissenschaften, Goethe Universität Frankfurt. Individual points were measured with spot sizes at an acceleration voltage of and a current of , with counting times of (peak) and (background). Pure Si and Pd metals, as well as a Eu-Phosphate (EuPO4) were used as standards. As some oxidation of the standards cannot be excluded, some minor systematic shift of the measured concentrations (typically below for Pd and Si, and up to for Eu) can not be excluded. Internal reproducibility is typically below .
For a more detailed structural characterization
X-ray diffraction (XRD) data on representative Eu(Pd1-mSim)2Si2 single-crystal samples were collected at 295 K on a STOE imaging plate diffraction system (IPDS-2T) using Mo radiation. All accessible reflections () were measured up to a maximum angle of . The data were corrected for Lorentz, polarization, extinction, and absorption effects. Using SHELXL [19] and JANA2006 [20], all averaged symmetry-independent reflections () have been included for the respective refinements in the tetragonal space group (SG) . For all compositions the unit cell and the space group were determined, the atoms were localized in the unit cell utilizing random phases as well as Patterson superposition methods, the structure was completed and solved using difference Fourier analysis, and finally the structure was refined. In all cases the refinements converged quite well and show excellent reliability factors (see GOF, , and in the Table 1).
| SG | ||||
|---|---|---|---|---|
| (Å) | 4.2392(6) | 4.2406(5) | 4.2408(7) | |
| (Å) | 9.8674(12) | 9.8690(11) | 9.8631(12) | |
| (°) | 90 | 90 | 90 | |
| (°) | 90 | 90 | 90 | |
| (°) | 90 | 90 | 90 | |
| V (Å3) | 177.3 | 177.5 | 177.4 | |
| Eu | Wyck. | |||
| 0 | 0 | 0 | ||
| 0 | 0 | 0 | ||
| 0 | 0 | 0 | ||
| (Å2) | 0.00898(14) | 0.00786(11) | 0.00836(12) | |
| Pd/Si | Wyck. | |||
| 0 | 0 | 0 | ||
| occ. (%) | 97.0/3.0(5) | 98.1/1.9(4) | 98.8/1.2(5) | |
| (Å2) | 0.00978(13) | 0.00889(10) | 0.00943(13) | |
| Si | Wyck. | |||
| 0 | 0 | 0 | ||
| 0 | 0 | 0 | ||
| 0.37783(19) | 0.37754(14) | 0.37719(23) | ||
| (Å2) | 0.01039(35) | 0.00897(27) | 0.00947(34) | |
| GOF | 1.90 | 1.47 | 1.38 | |
| (%) | 4.15 | 3.20 | 3.33 | |
| (%) | 1.72 | 1.24 | 1.21 | |
| bond lengths | ||||
| Eu-Si (Å) | 3.2309(9) | 3.2330(7) | 3.2341(11) | |
| (Pd,Si)-Si (Å) | 2.4665(11) | 2.4657(8) | 2.4637(13) | |
| Si-Si (Å) | 2.4110(30) | 2.4170(19) | 2.4220(28) |
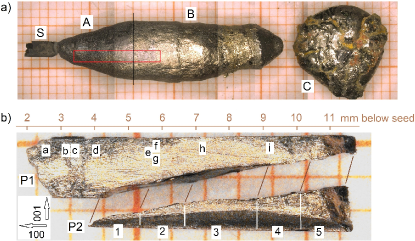
The samples , and for the single crystal analysis were extracted from the Czochralski grown sample at distances of , and below the seed. Low-temperature PXRD was done in a Siemens D500 diffractometer (Cu-Kα radiation). A Laue camera with X-ray radiation from a tungsten anode was used to determine the orientation of our single crystals and to localize grain boundaries in the Czochralski grown samples. Heat capacity, four-point resistivity and magnetization measurements were performed using the commercial measurement options of a Quantum Design PPMS.
III Results
III.1 Crystal Growth
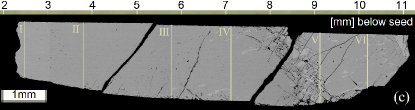
The DTA experiments, Fig. 1, showed that the compound solidifies in flux already at about 1200∘C at the initial weight stoichiometry of . This means that the growth temperatures can be chosen significantly lower than previously assumed and used for Bridgman growth [5] if a pre-reacting step is carried out. Both types of samples prepared by DTA and by Bridgman method showed a large amount of included secondary phases. Furthermore, these samples showed a very broad transition in the specific heat above . The valence transition temperatures which were determined by heat capacity and magnetization measurements exhibited strong sample dependencies. During reproduction experiments using the Bridgman method, it was noticed that the grown crystals were on the one hand small (platelets, ), and on the other hand also contained many Eu-rich flux inclusions, which motivated us to develop the growth of this compound using the Czochralski method. The Czochralski growth of EuPd2Si2 is highly challenging: (i) Eu has a high vapor pressure at high temperatures, (ii) the melt attacks all tested crucible materials (tantalum, Al2O3, graphite, glassy carbon) at high temperatures, and (iii) the ideal starting stoichiometry for obtaining inclusion-free samples is unknown so far. We performed 10 crystal growth experiments each of which consisted of the pre-reaction steps followed by Czochralski growth. In all experiments, rod-shaped seeds were used with the long edges cut in a crystallographic direction perpendicular to the -direction. Using these seeds all samples were pulled out of the melt in a direction perpendicular to the direction. A typical growth result at the end of the optimization process is shown in Fig. 2a). During the optimization of the growth process, it was found that the evaporation of Eu from the melt can be slowed down sufficiently by an Ar over pressure of 20 bar in the growth chamber. Due to the high reactivity of the melt, the growth was carried out from the levitating melt. We observed that the higher the Eu content, the larger the proportion of the target phase that can be drawn from the melt. The optimization process revealed that up to an initial stoichiometry of EuPdSi , the EuPd2Si2 phase is the first to crystallize. Higher Eu contents lead to unstable conditions during the seeding phase which is possibly caused by the formation of a different phase at the beginning of the growth process.
III.2 Structural and Chemical Characterization
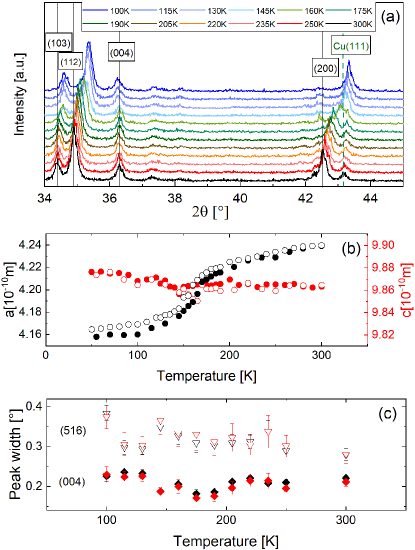
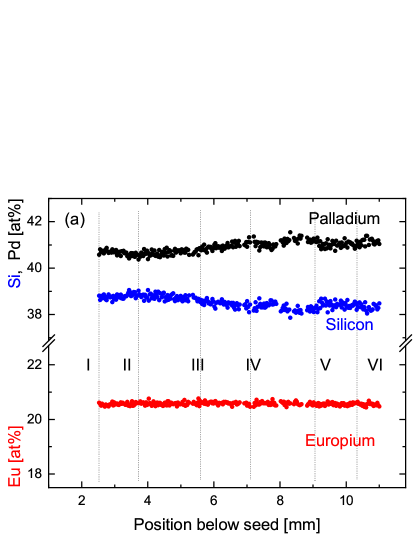
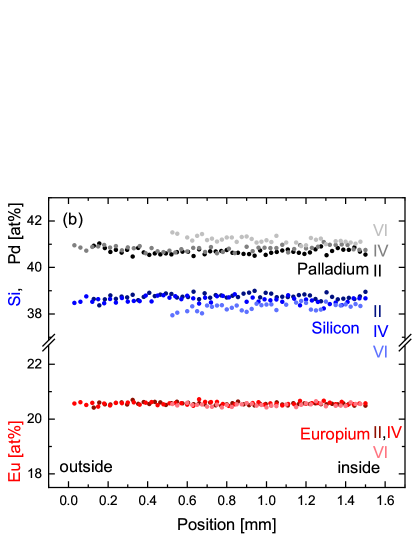
PXRD confirmed the ThCr2Si2 structure of the samples with lattice parameters at of Å and Å which is in good agreement with literature [4]. Low-temperature PXRD was performed on a Czochralski grown sample between and , Fig. 3(a). For this sample, a large shift of the , the and the reflections was observed between and . The reflection exhibits no change of its position. Fig. 3(b) shows the temperature dependent lattice parameters of samples from two different Czochralski growth experiments. The lattice parameter changes about while the length of the parameter remains nearly unchanged in the studied temperature range. The full width at half maximum (FWHM) of two reflections was analyzed by fitting their shapes with Gauss and Lorentz line shape. Our analysis of the and the reflections, shown in Fig. 3(c), yields no change of the FWHM upon cooling. From this we can conclude that no peak broadening of these reflections appears. Low-temperature PXRD was additionally performed on a sample grown by the Bridgman method. In this case, we found a broadening of the peak between and . Such a peak broadening was already observed in [10] and assigned to a distribution of lattice parameters in the sample. Since the physical properties reported in literature so far show a strong sample dependence, we performed the single crystal analysis, the WDX and the EDX analysis very carefully to find deviations from the ideal 122 stoichiometry. Prior to EDX analysis, we examined the sample by scanning electron microscopy (SEM) for visible flux inclusions. We found that the sample was free of inclusions up to a length of below the seed. The EDX analysis was performed on a longitudinal section for which a long rod-shaped single crystal (P1), Fig. 2b, was cut out of the grown sample. This sample was finely polished for the analysis. The analysis of this longitudinal section, showed that the Eu content remained constant over the entire length of the sample studied. Furthermore, we found a small shift in the stoichiometry for Pd and Si within the first of the sample. While the Pd content increases slightly, the Si content decreases at the same time. At a larger distance than from the seed, no reliable statements can be made about the stoichiometry of the sample, since in this area the content of flux inclusions increases. The first hint for a slight change of the Pd-Si ratio in the grown samples came from the EDX analysis. To get a quantitative statement subsequently, we performed a WDX analysis on the same sample and could verify this observation for the longitudinal analysis, Fig. 4a). At a distance of below the seed, we determined a ratio of EuPdSi , while a ratio of EuPdSi at a distance of was found. We additionally investigated radial lines of the sample, Fig. 4b), and found the same trend. Concerning the reproducibility, the occurring error is smaller than the size of the symbols used in Fig. 4a,b. To get a better insight in how this slight change of the composition might influence the bond lengths, we performed a single crystal analysis on small single crystals extracted from the same sample. The single crystal analysis yields that while for all samples the Wyckoff position is completely occupied with Si, a certain amount of up to 3 % Si is found on the Pd site (Wyckoff position ). With decreasing Si content on the Pd site, the (Pd,Si)-Si bond length slightly decreases while the Eu-Si and the Si-Si distance along the crystallographic c direction are slightly increasing. Moreover, the parameter of the Si site (Wyckoff position ) is directly correlated with the changes in the amount of Si on the Pd site (see Table 1). In our DTA, Bridgman and Czochralski growth experiments, we found different compositions of the included or remaining flux according to an EDX analysis. In DTA experiments, a silver-looking phase EuPdSi was found besides the main phase. In Bridgman growth experiments, the flux consisted of Eu, EuPdSi and EuPdSi . In the Czochralski experiments we always found that the remaining material decomposed in air and the determination of its composition was impossible.
III.3 Magnetic susceptibility
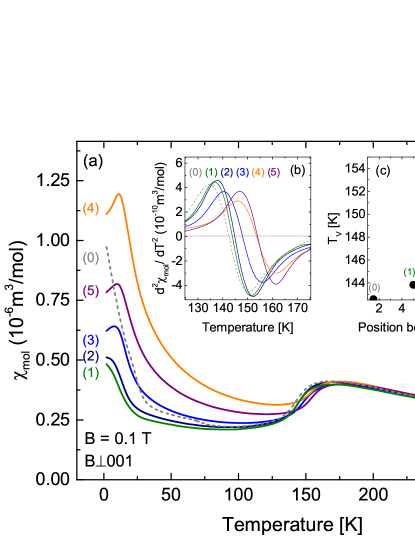
The magnetic susceptibility, Fig. 5, measured with , , shows a strong change of the slope in the valence transition region. The valence transition temperature of a sample can be determined directly from the inflection point of the susceptibility curve. It is known from previous work that minor phases and impurities leave strong traces in the magnetization. Magnetization measurements are thus a sensitive tool to detect the presence of magnetic impurity phases. The magnetization of EuPd2Si2 was measured on 5 pieces, (1)-(5), whose exact extraction position from the sample is known (P2), Fig. 2(b). From these measurements, we can conclude two different trends. i) The smaller the distance from the seed of a piece in the sample, the lower . ii) The amount of impurity contaminations, seen at low temperatures, increases with larger distance from the seed. If the content of side phases is very high, then the side phase signal influences the susceptibility so strongly that the inflection point in the susceptibility at shifts or can no longer be determined. The grey curve (0) in Fig. 5 exemplary shows the susceptibility of a sample extracted at a distance of about below the seed. The data show that the valence transition temperature is lowest for this sample. Furthermore we observed for these early grown parts of the sample a change of the characteristics of the impurity contribution at low temperatures compared to pieces (1)-(5). Samples (1) and (2) show a small increase of the susceptibility below which might be assigned to a paramagetic defect contribution [21]. Samples (3)-(5) contain a side phase with a magnetic transition at about which might correspond to the ordering of Eu2PdSi3 [22]. Contributions to the susceptibility below were already assigned to inclusions of magnetic side phases in this material in the past [14].
III.4 Heat capacity
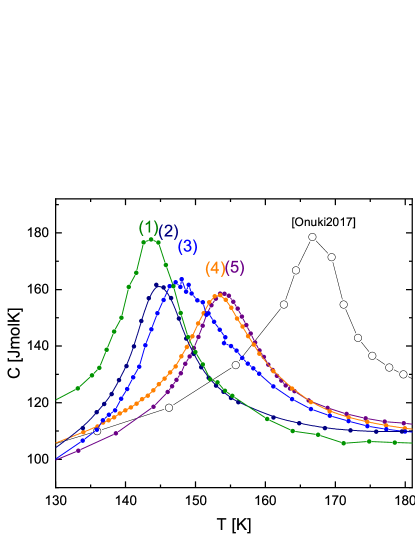
The heat capacity of EuPd2Si2 shows a peak at the valence transition. It is known from the literature that determined from heat capacity data, is strongly sample dependent: A polycrystalline sample showed [15] while on a single crystalline sample was determined [5]. To systematically investigate this strong sample dependence and also to look for latent heat as an indication of a 1st order phase transition, we performed heat capacity measurements on the same samples (1)-(5) of piece P2, Fig. 2(b), where the magnetization was measured. It was found that the position of the inflection point in the magnetization coincides with the position of the peak in the specific heat, Fig. 6. Thus, in the heat capacity one also observes a dependence of the valence transition temperature on the position of extraction from the grown sample ranging from . It has to be mentioned that in other Czochralski grown samples an even lower was detected. None of the samples investigated so far showed signs of a 1st order phase transition.
III.5 Electrical resistivity
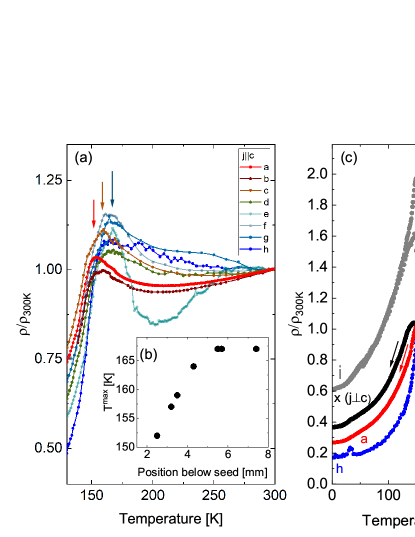
The temperature dependence of the electrical resistivity Fig. 7 was systematically measured on a long rod-shaped sample at different positions (a-i, Fig. 2(b)) along this sample P1. The different positions of the contacts correspond to different distances from the seed. We observed that the measurements with current flow perpendicular to the -direction succeeded only in a few cases. This was possibly related to a damage of the sample due to the strong change of the lattice parameter. In many cases it was not possible to obtain reliable data. For position i which is already in the region with macroscopic flux inclusion we observe a different shape of the curve and a large hysteresis due to a possible damage of the sample during the temperature change. However, the measurement of the resistivity with was possible in most cases. We observed a shift in the maximum for different contact positions a-h on sample P1, Fig. 7(a). The temperature at which the maximum occurs, Fig. 7(b), depends on the contact position. The residual resistivity varies between RR (position (a)) and RR (position (h)). For , we observed a small increase in the resistivity at followed by a sharp drop towards low T during cooling. The curve shape between the two current directions differs only slightly. For , black curve, x, in Fig. 7(c), the resistivity curve shows a similar characteristics at but a lower residual resistivity ratio RR.
IV Discussion
The growth of Eu-based systems as single crystals is challenging mainly due to the incongruent solidification of the materials and due to the strong tendency of Eu to oxidize. In this work, we developed the process for growing crystals of EuPd2Si2 by the Czochralski method. We found that with an initial stoichiometry of EuPdSi , the EuPd2Si2 phase is the first to crystallize from the melt. We performed the structural and chemical characterization to compare the properties of our samples with that reported in literature for powder samples and Bridgman grown single crystals. Low temperature PXRD experiments, performed between and on Czochralski grown samples, showed that the parameter undergoes a large change of about 2% upon cooling, while the parameter remains almost constant. The valence transition manifests itself in strong shift of the reflections, which can be observed e.g. at the reflection. For a Bridgman grown sample we found in contrast a peak broadening for the reflection similar as it was reported in [10]. For the purer Czochralski grown samples there is no peak broadening observable which shows that this is not an intrinsic property of this material. The chemical characterization by WDX yielded that during the Czochralski growth process the compound solidifies in a homogeneity range Eu(Pd1-mSim)2Si2. The analysis confirmed small changes in the Pd:Si ratio in the order of along the growth direction of the crystal. Although, the systematic error in the absolute values might be larger than that change the relative trend is robust among different measurements. To get more microscopic insight into the structural variations, we conducted in parallel a single crystal analysis on samples which where extracted from the same grown ingot. The careful analysis of different single crystals showed that the Pd site is partially occupied by Si which is accompanied by a small change of the Si position and correspondingly in the bond distances. The small change in the Pd-Si ratio accompanied by the change in the bond lengths, has a large impact on the temperature at which the valence transition occurs. In the electrical resistivity, measured with current parallel to the direction on the same crystal used for the WDX analysis, we found maxima between . The neighbouring part of that crystal was used to determine the valence transition from thermodynamic quantities. We determined from the inflection point in the magnetic susceptibility and heat capacity measurements showed that the peak temperature corresponds to determined from the magnetic susceptibility. From this thorough analysis of the structural and physical properties, we conclude that with increasing distance to the seeding crystal, the stoichiometry of EuPd2Si2 moves towards the ideal 122 composition, accompanied by an increase of and an increase of the residual resistivity ratio. However, among our samples we could not observe crystals with an ideal 122 stoichiometry, as there remains some Si excess on the Pd site. In all cases the transition at is rather a crossover than a second order phase transition, none of the samples showed signs of a first order transition. This is consistent with EuPd2Si2 being located at the high pressure side, very close to the critical endpoint of a line of first order phase transitions in a general diagram for Eu compounds [5].
V Summary
We showed that the intermediate valent, tetragonal EuPd2Si2 can be grown from a Eu-rich levitating melt using the Czochralski method with an Ar over pressure of . The combined chemical and structural analysis yielded that the material grows in a Pd-Si homogeneity range and that this small change of the order of in the composition along the grown ingot of the material has a large impact on the temperature where the valence transition occurs. In this sample, we observe a shift in of about . Samples with lower formed at the beginning of the growth while samples with higher formed at at late stage of the process. The here presented growth procedure using the Czochralski method will now enable us to provide doped samples and chemically tune this material to further explore the phase diagram and it shows that EuPd2Si2 is an excellent candidate for the study of possible critical elasticity.
Acknowledgements.
We thank K.-D. Luther for technical support. We acknowledge funding by the Deutsche Forschungsgemeinschaft (DFG, German Research Foundation) via the TRR 288 (422213477, projects A03 and B03).VI References
References
- Kreyssig et al. [2008] A. Kreyssig, M. Green, Y. Lee, G. Samolyuk, P. Zajdel, J. Lynn, S. Bud’ko, M. Torikachvili, N. Ni, S. Nandi, J. Leo, S. Poulton, D. Argyriou, B. Harmon, R. McQueeney, P. Canfield, and A. Goldman, Phys. Rev. B 78, 184517 (2008).
- Gati et al. [2016] E. Gati, M. Garst, R. S. Manna, U. Tutsch, B. Wolf, L. Bartosch, H. Schubert, T. Sasaki, J. A. Schlueter, and M. Lang, Sci. Adv. 2, e1601646 (2016).
- Mimura et al. [2004] K. Mimura, Y. Taguchi, S. Fukuda, A. Mitsuda, J. Sakurai, K. Ichikawa, and O. Aita, J. Electron Spectrosc. Relat. Phenom. 137-140, 529 (2004).
- Adams et al. [1991] D. M. Adams, A. E. Heath, H. Jhans, A. Norman, and S. Leonard, J. Phys.: Cond. Mat. 3, 5465 (1991).
- Ōnuki et al. [2017] Y. Ōnuki, A. Nakamura, F. Honda, D. Aoki, T. Tekeuchi, M. Nakashima, Y. Amako, H. Harima, K. Matsubayashi, Y. Uwatoko, S. Kayama, T. Kagayama, K. Shimizu, S. E. Muthu, D. Braithwaite, B. Salce, H. Shiba, T. Yara, Y. Ashitomi, H. Akamine, K. Tomori, M. Hedo, and T. Nakama, Philos. Mag. 97, 3399 (2017).
- Batlogg et al. [1982] B. Batlogg, A. Jayaraman, V. Murgai, L. Gupta, R. D. Parks, and M. Croft, Valence instabilities (P. Wachter and H.Boppart eds., North-Holland Publishing Company, 1982) p. 229.
- Schmiester et al. [1982] G. Schmiester, B. Perschied, G. Kaindl, and J. Zukrowski, Valence Instabilities (P. Wachter and H.Boppart eds., North-Holland Publishing Company, 1982) p. 219.
- Sampathkumaran et al. [1981] E. Sampathkumaran, L. Gupta, R. Vijayaraghavan, K. Gopalakrishnan, R. Pillay, and H. Devare, J. Phys. C: Solid State Phys. 14, L237 (1981).
- Martensson et al. [1982] N. Martensson, B. Reihl, W.-D. Schneider, V. Murgai, L. C. Gupta, and R. D. Parks, Phys. Rev. B 25, 1446 (1982).
- Jhans et al. [1987] H. Jhans, M. Croft, E. Kemly, B. Grier, and C. Segre, Theoretical and Experimental Aspects of Valence Fluctuations and Heavy Fermions (Plenum Press, New York, 1987) p. 655.
- Vijayakumar et al. [1981] V. Vijayakumar, S. Vaidya, E. Sampathkumaran, L. Gupta, and R. Vijayaraghavan, Physics Letters 83A, 469 (1981).
- Croft et al. [1982] M. Croft, C. Segre, J. Hodges, A. Krishnan, V. Murgai, L. Gupta, and R. Parks, Valence instabilities (P. Wachter and H. Boppart eds., North-Holland Publishing Company, 1982) p. 121.
- Segre et al. [1982] C. U. Segre, M. Croft, J. A. Hodges, V. Murgai, L. C. Gupta, and B. D. Parks, Phys. Rev. Lett. 49, 1947 (1982).
- Holland-Moritz et al. [1987] E. Holland-Moritz, E. Braun, B. Roden, B. Perscheid, E. V. Sampathkumaran, and W. Langel, Phys. Rev. B 35, 3122 (1987).
- Wada et al. [2001] H. Wada, H. Gomi, A. Mitsuda, and M. Shiga, Solid State Commun. 117, 703 (2001).
- Mazilu et al. [2008] I. Mazilu, A. Teresiak, J. Werner, G. Behr, C. Cao, W. Löser, J. Eckert, and L. Schultz, J. Alloys Compd. 454, 221 (2008).
- Kuzhel et al. [2010] B. Kuzhel, B. Belan, V. Kuzhel, I. Stets, and R. Serkiz, Chem. Met. Alloys 3, 83 (2010).
- Zacharias et al. [2015] M. Zacharias, I. Paul, and M. Garst, Phys. Rev. Lett. 115, 025703 (2015).
- Sheldrick [2008] G. M. Sheldrick, Acta Crystallogr. Sect. A 64, 112 (2008).
- Petricek et al. [2014] V. Petricek, M. Dusek, and L. Palatinus, Z. Kristallogr., Cryst. Mater. 229, 345 (2014).
- Kemly et al. [1985] E. Kemly, M. Croft, V. Murgai, L. C. Gupta, C. Godart, R. D. Parks, and C. U. Segre, J. Magn. Magn. Mater. 47, 403 (1985).
- Mallik et al. [1998] R. Mallik, E. Sampathkumaran, M. Strecker, G. Wortmann, P. Paulose, and Y. Ueda, J. Magn. Magn. Mater. 185 (1998).