Two types of charge order in the superconducting kagome material CsV3Sb5
The kagome metals of the family V3Sb5, featuring a unique structural motif, harbor an array of intriguing phenomena such as chiral charge order and superconductivity. CsV3Sb5 is of particular interest because it displays a double superconducting dome in the region of the temperature-pressure phase diagram where charge order is still present. However, the microscopic origin of such an unusual behavior remains an unsolved issue. Here, to address it, we combine high-pressure, low-temperature muon spin relaxation with first-principles calculations. We observe a pressure-induced threefold enhancement of the superfluid density, which also displays a double peak feature, similar to the superconducting critical temperature. This leads to three distinct regions in the phase diagram, each of which features distinct slopes of the linear relation between superfluid density and the critical temperature. These results are attributed to a possible evolution of the charge order pattern from the superimposed tri-hexagonal Star-of-David phase at low pressures (within the first dome) to the staggered tri-hexagonal phase at intermediate pressures (between the first and second domes). Our findings suggest a change in the nature of the charge ordered state across the phase diagram of CsV3Sb5, with varying degrees of competition with superconductivity.
Among the series V3Sb5 ( = Rb, K, Cs) Neupert et al. (2022); Jiang et al. (2021); Mielke III et al. (2022), the Cs compound manifests the highest superconducting critical temperature 2.5 K. CsV3Sb5 also features multi-gap superconductivity and more importantly, a time reversal symmetry breaking (TRSB) chiral charge order below = 94 K Yu et al. (2021a); Wu et al. (2021); Khasanov and et al. (2022); Wang et al. (2021a), as reported by scanning tunneling microscopy Zhao et al. (2021), polar Kerr rotation Wu et al. (2021), and SR experimentsYu et al. (2021a); Khasanov and et al. (2022). A comprehensive understanding of the interdependence between charge order (CO) and superconductivity (SC) is thus essential, and can be studied by using an appropriate external perturbation. In the quest to obtain an efficient tuning knob, hydrostatic pressure was found to be optimal. Indeed, pressure suppresses the charge order and results into an unusual but well-pronounced double superconducting dome in the temperature-pressure phase diagram. Compared to the Rb and K counterparts Wang et al. (2021b); Zhu et al. (2021); Du et al. (2021), the double peak behavior is most distinguishable in the case of CsV3Sb5 Yu et al. (2021b); Wang et al. (2021c); Chen et al. (2021); Zhang et al. (2021a) where is roughly tripled to 8 K around the optimal pressure of 2 GPa from its value = 2.5 K at ambient pressure. Thus, pressure tuned CsV3Sb5 offers a rich framework for studying the nature of the interplay between superconductivity and charge order.
To systematically characterize and to obtain a microscopic understanding of the complex temperature-pressure phase diagram of CsV3Sb5, here we report high-pressure zero-field and transverse-field SR as well as AC susceptibility (up to 1.75 GPa) measurements combined with first principles calculations. Transverse field (TF) SR experiments serve as an extremely sensitive local probe technique to measure the magnetic penetration depth in the vortex state of bulk type II superconductors. This quantity is directly related to the superfluid density via 1/ = (where is the effective mass). Zero-field SR has the ability to detect internal magnetic fields as small as 0.1 G without applying external magnetic fields, making it a highly valuable tool for probing spontaneous magnetic fields due to TRSB in exotic superconductors. The techniques of SR and DFT complement each other ideally, as we are able to sensitively probe the fundamental microscopic properties of CsV3Sb5 with SR experiments and correlate them with the pressure-evolution of the charge ordered state calculated by DFT.
I results
I.1 Superfluid density as a function of pressure
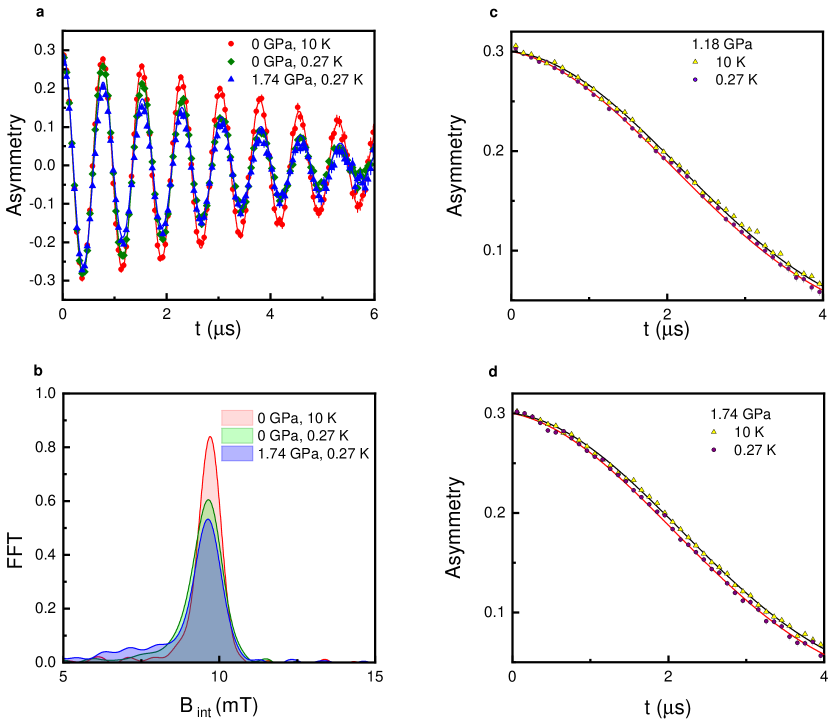
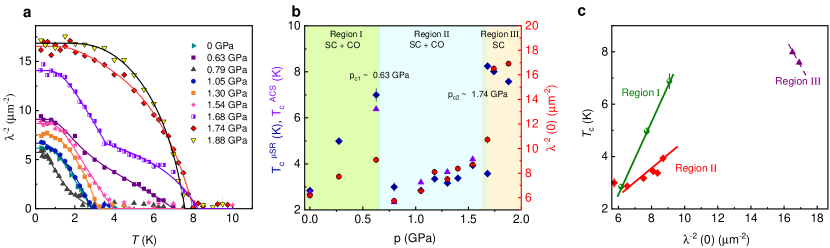
Figure 1(a) shows the TF-SR time spectra of CsV3Sb5 well below (0.25 K) and above (10 K) in the presence of an applied magnetic field of 10 mT for ambient as well as the highest applied pressure, 1.74 GPa. The weakly damped oscillations above are essentially due to the randomly distributed local fields created by nuclear magnetic moments. The spectra below show a sizable increase in relaxation because of the inhomogeneous distribution of internal fields arising due to the formation of the flux line lattice in the vortex state. The Fourier transform of the spectra, shown in Fig. 1b, gives the internal field distribution, which showcases a clear broadening in the superconducting state compared to the normal state. From the TF-SR data, the superconducting relaxation rate is extracted. The latter is related to the magnetic penetration depth via , where = 2135.5 MHz/T is the muon gyromagnetic ratio and is the flux quanta Brandt (1988, 2003) (details of the analysis of the TF-SR data are given in the Supplementary section). The resulting temperature dependence of the inverse squared magnetic penetration depth , measured under various hydrostatic pressures, are shown in Fig. 2(a).
The curves in Fig. 2(a) are well described by a two-gap model across the entire pressure range probed (see details in the Methods section). This indicates that the multi-gap nature of the superconducting state of CsV3Sb5, which was previously reported by various techniques for ambient conditions Xu et al. (2021); Duan et al. (2021); Gupta et al. (2021); Nakayama et al. (2021), is robust against the application of hydrostatic pressure. As we show below, a sharp increase of both and occurs at pressures in the range 1.5 – 1.7 GPa, suggesting the complete suppression of the CO and thus a transition between the SC+CO state to the pure SC state. It is quite remarkable, therefore, that at the intermediate pressure 1.68 GPa, which is at the border between the SC+CO and pure SC phases, the temperature evolution of the penetration depth shows a prominent two-step like feature [purple curve in Fig. 2(a)]. This is a signature of inhomogeneity, whose origin can be either extrinsic, e.g., due to pressure inhomogeneity inside the cell, or intrinsic, due to phase separation caused by a first-order SC+CO to SC transition.
Figure 2(b) shows the pressure dependence of and of the zero-temperature value of , which is directly proportional to the superfluid density . Interestingly, both and show a similar non-monotonic pressure dependence, featuring three distinct regions marked as I, II and III in Fig 2(b). Initially, as pressure increases, shows an increase from 2.85(9) K at ambient pressure to 6.9(3) K at a critical pressure 0.63 GPa. Upon further increase in pressure, shows a sharp and substantial decrease down to 2.87(7) K at 0.8 GPa. This marks the onset of Region II, where increases only slightly with pressure. Remarkably, a sudden jump in is seen around a second critical pressure 1.74 GPa, reaching a maximum value of = 8.0(1) K – which is almost three times larger than the ambient pressure value – and nearly saturating beyond this pressure. This regime is denoted as Region III in the phase diagram.
The maximum value of 8 K extracted from SR is fairly close to the value obtained through electrical transport, AC and DC magnetization measurements Chen et al. (2021). Moreover, qualitatively shows a similar trend to with regard to pressure, also featuring a double-peak behavior. Indeed, there is a nearly threefold increase in the value of from 6.5(1) at ambient pressure to 17.3(9) at 1.74 GPa, followed by saturation upon further increase in pressure. The relative variation of the value at the highest applied pressure compared to its ambient pressure value is = 63 %. This is rather unusual in comparison to BCS superconductors, where the superfluid density either depends weakly on pressure or remains pressure independentDas et al. (2021). The sudden enhancement of and has an intimate connection with the collapse of CO at the critical pressure , and is consistent with a first-order transition from the SC+CO phase to the pure SC phase.
I.2 Superconducting transition temperature vs. superfluid density
Figure 2(c) displays the correlation between the superconducting transition temperature and the superfluid density obtained from SR experiments under different pressures. There are three distinct types of lines, each associated with one of the three regions of the phase diagram in Fig 2(b). For the data points belonging to Region I, we obtain a slope of 2.72 Km2, which is 3.5 times larger than the slope obtained for the data points from Region II (0.78 Km2). For Region III, seems to be almost independent on .
These linear relationships between and are characteristic of unconventional superconductors. In the present case, for Regions I and II, the ratio lies far away from the values typically seen in BCS superconductors, where 0.00025–0.015 Km2. The large values of , despite the small values of the superfluid density in Regions I and II, are also signatures of unconventional SC, where 1–20 Uemura et al. (1989); Guguchia et al. (2022); Mielke et al. (2021). Moreover, the change in the slope from Region I to Region II, both of which display coexisting CO and SC, suggests a subtle modification in the CO state. Combined with the sudden suppression in and upon crossing the Region I to Region II boundary in Fig. 2b, this provides strong evidence for a distinct competition between SC and CO in these two regions. Finally, the fact that is nearly independent of in Region III can be attributed to the absence of a competing CO state in this region.
I.3 Spontaneous fields in the superconducting state
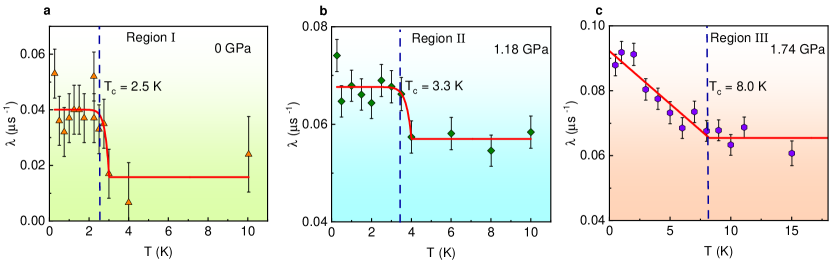
Zero-field SR experiments have been successfully implemented to probe TRSB in well-known unconventional superconductors, e.g., Sr2RuO4Luke et al. (1998); Grinenko et al. (2021a, b), UPt3Luke et al. (1993), LaNiC2Hillier et al. (2009), LaPt3PBiswas et al. (2021). We have conducted ZF-SR experiments for three different applied pressures: 0, 1.18, and 1.74 GPa. Representative ZF-SR spectra above and below for the pressures of 1.18 and 1.74 GPa are shown in Figs. 1(c) and (d). Both display an increase in relaxation within the superconducting state. The data were fitted using the Gaussian-Kubo-Toyabe (GKT) depolarization function Kubo and Toyabe (1967) multiplied by an exponential decay function exp. The Gaussian-Kubo-Toyabe function accounts for the random magnetic fields created by the nuclear moments. As was discussed previously for KV3Sb5 Mielke III et al. (2022), the exponential relaxation rate is sensitive to the temperature dependence of the electronic contribution to the muon spin relaxation. The temperature dependences of the electronic relaxation rate for the applied pressures of 0, 1.18 and 1.74 GPa are shown in Fig. 3.
At ambient pressure, we observe an enhancement of the exponential relaxation rate, with an onset slightly above , by a small amount of = 0.024(8) . Since time-reversal symmetry is already broken by charge order at 95 K Yu et al. (2021a); Khasanov and et al. (2022); Wu et al. (2021), we speculate that the effect in the superconducting state is caused by the Meissner screening of the small fields induced by the CO loop currents created at . A similar argument holds for 1.18 GPa (Region II), where both CO and SC coexist and the associated increase in electronic relaxation is .
However, at 1.74 GPa (Region III), where the CO is completely suppressed, we still observe an increase in with the onset of SC at 8 K. The increase of with decreasing temperature in Region III is smooth, contrasting with the sharp increase observed in Regions I and II. As there is no CO at this pressure, a plausible origin for the enhancement of the internal field width is the spontaneous breaking of time reversal symmetry in the superconducting state. The increase in by a magnitude of is associated with a characteristic field strength of = / = 0.04 mT. This value is comparable to what is observed in well-known TRSB superconductors, such as 0.05 mT for the chiral superconductor Sr2RuO4Grinenko et al. (2021b, a), 0.01 mT for the heavy-fermion superconductor UPt3Luke et al. (1993), and 0.01 mT for the non-centrosymmetric superconductor LaNiC2 Hillier et al. (2009). These results indicate that the SC state without charge order breaks time-reversal symmetry. Interestingly, a recent SR investigation of the other kagome compounds, RbV3Sb5 and KV3Sb5, also reported evidence for TRSB in the pure SC state Guguchia et al. (2022).
II Discussion
One of the intriguing findings of this paper is the observation of a double superconducting dome inside the region where SC and CO coexist, associated with a more than threefold enhancement of and of the superfluid density, . Indeed, Fig. 2(b) shows that with increasing pressure, and the superfluid density first increase up to 0.63 GPa, followed by a sudden drop in these parameters with further increase in pressure, defining the boundary between Regions I and II. Within Region II, and increase slowly with increasing pressure up to 1.54 GPa, beyond which a dramatic enhancement is seen in these two quantities, marking the onset of Region III. This behavior is suggestive of a state of coexistence between competing SC and CO orders, which undergoes a transition to a pure SC state at . Such a scenario would naturally explain why not only but also displays a sudden change from Region II to Region III, as is suppressed in the coexisting state due to the partial gapping of the Fermi surface promoted by CO order.
Analogously, the strong variation of and between and is indicative of a subtle modification in the nature of either the CO or the SC state from Region I to Region II. The SC state seems qualitatively the same in both regions: first, the curves are indicative of a fully-gapped SC state in both regions. Second, the temperature dependence of the electronic relaxation is very similar in both Regions I and II (see Figs. 3(a) and 3(b)). Consequently, it is plausible that the changes in and are a consequence of a change in the CO state, in such a way that the CO of Region II competes more strongly with SC than the CO of Region I. Experimentally, it has been proposed that more than one CO state can be realized in these kagome metalsWang et al. (2021c, a); Zhao et al. (2021). Different theoretical calculations also suggest multiple nearby CO instabilities Ratcliff et al. (2021); Denner et al. (2021); Feng et al. (2021); Lin and Nandkishore (2021); Christensen et al. (2021); Subedi (2022); Park et al. (2021). To investigate the possibility of a change in the nature of the CO state from Region I to Region II in CsV3Sb5, we performed DFT calculations at different hydrostatic pressures.
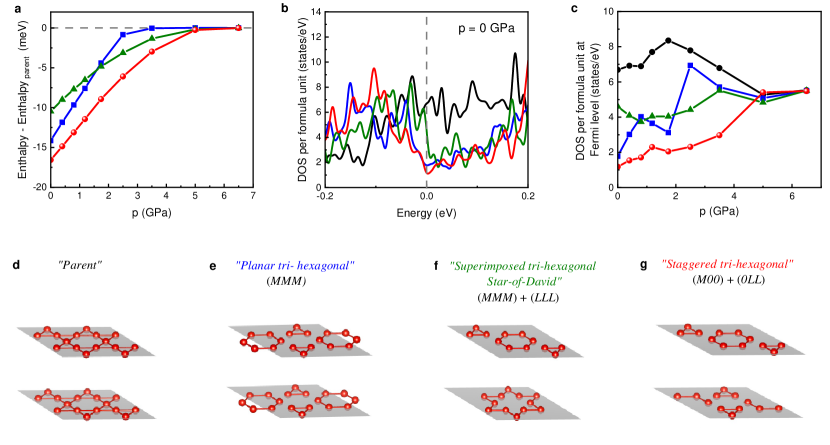
The V3Sb5 compounds are predicted to have phonon instabilities at the and points of their hexagonal Brillouin zones Cho et al. (2021); Qian et al. (2021). Both of the unstable phonons transform as three-dimensional irreducible representations of the space group, which means that the high-temperature undistorted kagome lattice may lower its energy via lattice distortions along six independent atomic displacement patterns. Superpositions of these patterns give rise to a large family of candidate structures and bond order patterns, a subset of which are shown in Fig. 4 Christensen et al. (2021).
While there is growing evidence of time-reversal symmetry breaking in the CO phase, the predominant effect of pressure is expected to be on the lattice, and not directly on the properties of the CO state affected by TRSB. This is because interatomic force constants depend strongly on the bond lengths in ionic compounds, where there is a fine balance between the repulsive and the attractive components of the interatomic interactions. Moreover, the TRSB CO state is generally expected to induce a regular (i.e. time-reversal symmetry preserving) CO pattern of bond distortions due to nonlinear terms in the free energy Lin and Nandkishore (2021); Park et al. (2021). For these reasons, despite the fact that our first-principles approach cannot directly account for TRSB, understanding how the crystal structure of CsV3Sb5 evolves under pressure using non-spin-polarized DFT calculations is a viable approach to elucidate the behavior of the CO in this material.
In Fig. 4(a), we present the enthalpy per formula unit of the three lowest energy CO structures of CsV3Sb5 calculated from DFT as a function of pressure. The parent structure, without CO, is shown in Fig. 4(d). Two of these CO phases, dubbed the “staggered tri-hexagonal” state (red, pane (g)) and the “superimposed tri-hexagonal Star-of-David” phase (green, panel (f)), host a superposition of both and point lattice instabilities, and therefore have the periodicity consistent with the available X-ray data. The third low energy phase, the so-called “planar tri-hexagonal” phase (blue, panel (e)), is only associated with the point instability. As a result, it has a periodicity that seems inconsistent with the currently available experimental structure data.
Fig. 4(a) shows that at pressures above 5 GPa, CO is completely suppressed, and we predict the undistorted kagome lattice to be the equilibrium structure. This is consistent with previous results that predicted the phonon instabilities at both and to vanish at pressures between 3 GPa and 5 GPa Zhang et al. (2021b). The threefold difference with respect to the experimental value is not unexpected. Indeed, an accurate prediction of the pressure at which the structural instabilities disappear is hard to achieve in DFT because of the large unit cell, the sensitivity of the electronic structure of the kagome layers on pressure, and lattice parameters errors due to the exchange correlation approximations. Nevertheless, the qualitative trends with pressure extracted from DFT are expected to be reliable.
While the staggered tri-hexagonal phase (red) has lower enthalpy than the other CO phases throughout the pressure range considered, the enthalpy differences between the distinct CO phases are on the order of a few meV’s per formula unit. This implies that entropic effects not captured by DFT are large enough to switch the ordering of these phases and cause the equilibrium structure to be a different phase from the one that minimizes the Kohn-Sham enthalpy. The two most likely candidates consistent with the experimentally observed periodicity of the CO state are the staggered tri-hexagonal (red) and the superimposed tri-hexagonal Star-of-David phases (green). Since the energy difference between these phases become smaller with increasing pressure, it is plausible that there is a transition from one to the other under pressure.
To elucidate which of these two CO phases is realized in Region I, we compute their densities of states (DOS). As shown in Fig. 4(b), there are important differences between the DOS curves of the staggered tri-hexagonal phase (red), the superimposed tri-hexagonal Star-of-David phase (green), and the undistorted kagome lattice (black). In particular, the latter has a larger DOS at the Fermi level, as well as van Hove singularities (signaled by the central “satellite” peaks in the DOS) closer to the Fermi level, when compared to the red and green curves (the blue curve, referring to the planar tri-hexagonal phase, is also shown for completeness). In contrast, the red curve has the smallest Fermi level DOS and farthest separated van Hove singularity peaks among the three curves. While the mechanism for superconductivity in CsV3Sb5 remains under debate, one generally expects that a higher Fermi-level DOS correlates with a higher . Moreover, if van Hove singularities are important for the SC mechanism, it is reasonable to assume that the closer their peaks are to the Fermi level, the higher the will be. If these assumptions hold for CsV3Sb5, then a possible explanation for the unusual double-peak SC dome revealed by our SR data is a transition from the superimposed tri-hexagonal Star-of-David phase (green) in Region I to the staggered tri-hexagonal phase (red) in Region II. This is because the latter should compete more strongly with SC due to the larger reduction in the DOS and further separation between the van Hove peaks. Similarly, because the undistorted lattice (i.e. without CO) has the highest DOS, this would also account for being the highest when all types of CO are suppressed at .
III Conclusion
Our results uncover two different regions in the part of the phase diagram of the kagome metal CsV3Sb5 where both charge order and superconductivity are present. Based on our DFT calculations, we propose that two distinct types of CO order are realized: a superimposed tri-hexagonal Star-of-David phase at low pressures and a staggered tri-hexagonal phase at intermediate pressures, before CO is fully suppressed. These charge orders display different degrees of competition with superconductivity, which leads to the complex phase diagram featuring a double-peak in the pressure dependence of both the superconducting transition temperature and the superfluid density. Throughout the pressure range investigated, the nodeless multigap nature of the superconducting state remains persistent, in contrast to KV3Sb5 and RbV3Sb5, where a nodal gap emerges at higher pressures Guguchia et al. (2022). Furthermore, we show that once charge order is fully suppressed, the superconducting state breaks time-reversal symmetry, which makes this compound, together with its K- and Rb-counterparts, one of the rare cases of unconventional superconductors with spontaneously broken time reversal symmetry.
IV Methods
Sample growth: Single crystals of CsV3Sb5 used for for this study were grown by using self-flux method from Cs ingots (purity 99.9%), V 3-N powder (purity 99.9%) and Sb grains (purity 99.999%)Yin et al. (2021). The detailed description about the growth and characterization of crystals is provided in detail in Refs. Gupta et al. (2021); Ortiz et al. (2020, 2019)
SR experiment: Muon spin relaxation/rotation (SR) measurements under pressure were performed at E1 beam line using GPD spectrometer at Paul Scherrer Institute, Switzerland. This spectrometer is a dedicated worldwide unique instrument for carrying out high pressure SR experiments. For SR experiments, 100 % spin polarized muons are implanted inside the sample one by one, where the spin of muon will Larmor precess around the local magnetic field at the muon site. Detailed description about the SR technique can be found in the Refs.Yaouanc and De Reotier (2011); Hillier et al. (2022) In case of a superconductor, the characteristic length scale namely penetration depth can be determined by probing the inhomogeneous field distribution of vortex lattice. Heliox cryostat with a He-3 insert was used to access temperature down to 250 mK. Pressure upto 1.9 GPa were achieved using low and pre-defined background double wall pressure cell made from MP35N/CuBe alloy, specifically designed for high pressure experiments Shermadini et al. (2017); Khasanov et al. (2016). Single crystals of CsV3Sb5 were filled with random orientations inside the pressure cell in a compact cylindrical area of height 12 mm and diameter 6 mm. Daphne 7373 was used as a pressure medium to ensure the hydrostatic pressure conditions as it solidifies at much higher pressure 2.5 GPa. Low temperature values of pressures were determined by tracking the superconducting transition of Indium, measured using ac susceptibility experiment. The fraction of muon stopping inside the sample was maximized to 40 %.
We performed transverse-field (TF) and zero-field SR experiments at different pressures. Pressure cell is surrounded by four detectors: Forward, backward, left, and right with muon initial spin parallel to its momentum. The TF-SR experiments were performed in field cooled condition to get homogeneous vortex lattice formation. Approximately 106 positrons were recorded for each data point. The asymmetry vs. time spectra were analyzed using the open software package Musrfit Suter and Wojek (2012).
Analysis of : The temperature variation of magnetic penetration depth is analyzed within the local (London) approach using following expressionServenti et al. (2004):
| (1) |
where is the Fermi distribution function. The temperature and angular dependence of gap is given by , where is the gap value at 0 K, represents the temperature dependence of gap. The angular dependence of the gap is represented by , which adapts a value 1 for isotropic - wave model. We have fitted the data at various pressures by separating it into two gaps:
| (2) |
In the above equation, is the weight factor of the bigger gap . Fig. S3 shows the pressure dependence of the superconducting gaps ( and ). In the regions where SC and CO coexists, i.e. Region I and II, fitting was done by considering the weight factor as a global parameter for all pressures in the mentioned regimes. Similarly, for Region III, the fitting was done by assuming as a global parameter in that region. The data at intermediate pressure 1.68 GPa is fitted by considering a linear combination of Eq. 2 with parameter values fixed from that obtained for 1.54 GPa (corresponding to the SC+CO state) and 1.74 GPa (corresponding to the SC state).
Analysis of ZF relaxation rate: at various pressures are fitted with following empirical relation:
| (3) |
where is a characteristic temperature below which the increase in electronic relaxation starts. is the relaxation value above , and is the change in relaxation after entering into the superconducting ground state. In Region I and II, the value of is considerably high (14 and 15 respectively) indicating the step like increase in the relaxation rate. On the other hand, in Region III, where CO suppress completely, the value of is 1 suggesting a linear increase in below which coincides with . As discussed in the main text, we conclude that in region III, corresponds to the time reversal symmetry breaking transition .
DFT-calculations: All DFT calculations were performed using Projector Augmented Waves (PAW) as implemented in the Vienna Ab initio simulation package (VASP) version 5.4.4 Kresse and Hafner (1993); Kresse and Furthmüller (1996a, b). We used the PBEsol exchange correlation functional, with valence configurations of 5s25p66s1, 3s23p63d44s1, and 5s25p3 corresponding to Cs, V, ans Sb, respectively. Lattice parameters were found to be converged to within 0.001 Å using a plane wave cutoff energy of 450 eV, a Monkhorst-Pack k-point mesh of 202010 in the primitive cell, and a 2nd order Methfessel-Paxton smearing parameter of 10 meV Methfessel and Paxton (1989). Different phases have different specific volumes, and hence at finite pressure, the phase that minimizes the enthalpy, rather than the Kohn-Sham energy only, is the equilibrium structure at that volume.
Bilbao Crystallographic Server and tools therein were used for symmetry analysis of various theoretically obtained crystal structures Aroyo et al. (2011).
Acknowledgments
We thank B. Andersen and M. Christensen for fruitful discussions. SR experiments were performed at the Swiss Muon Source (SS), Paul Scherrer Institute (PSI), Switzerland. H.C.L. was supported by National Key R&D Program of China (Grant No. 2018YFE0202600) and the Beijing Natural Science Foundation (Grant No. Z200005). T.B. and E.R. were supported by the NSF CAREER grant DMR-2046020. RMF (theory) was supported by the Air Force Office of Scientific Research under award
number FA9550-21-1-0423.
Author contributions
R.G., D.D., C.M., Z.G., F. H., and R.K. performed SR experiments. R.G., D.D. and R.K. analyzed the SR data. Q.Y., Z.T., C.G., and H.C.L. synthesized and characterized samples. R. M. F., T. B., and E.R. performed the theoretical analysis. R. K. and H.L. supervised the work at PSI. R.G., D.D., Z.G., and R. M. F. prepared the manuscript with notable inputs from all authors.
Competing interests
The authors declare no competing interests.
Data availability:
The data supporting the findings of this study are available within the paper and in the Supplementary Information. The raw data are available from the corresponding authors upon reasonable request.
References
- Neupert et al. (2022) T. Neupert, M. Denner, J.-X. Yin, R. Thomale, and M. Hasan, Nature Physics 18, 137 (2022).
- Jiang et al. (2021) K. Jiang, T. Wu, J.-X. Yin, Z. Wang, M. Hasan, S. Wilson, X. Chen, and J. Hu, arXiv preprint: arXiv:2109.10809 (2021).
- Mielke III et al. (2022) C. Mielke III, D. Das, J.-X. Yin, H. Liu, R. Gupta, Y.-X. Jiang, M. Medarde, X. Wu, H. Lei, et al., Nature 602, 245 (2022).
- Yu et al. (2021a) L. Yu, C. Wang, Y. Zhang, M. Sander, S. Ni, Z. Lu, S. Ma, Z. Wang, Z. Zhao, H. Chen, et al., arXiv preprint arXiv:2107.10714 (2021a).
- Wu et al. (2021) Q. Wu, Z. Wang, Q. Liu, R. Li, S. Xu, Q. Yin, C. S. Gong, Z. Tu, H. C. Lei, T. Dong, et al., arXiv preprint: arXiv:2110.11306v2 (2021).
- Khasanov and et al. (2022) R. Khasanov and et al., Under preparation (2022).
- Wang et al. (2021a) Z. Wang, Y.-X. Jiang, J.-X. Yin, Y. Li, G.-Y. Wang, H.-L. Huang, S. Shao, J. Liu, P. Zhu, N. Shumiya, et al., Physical Review B 104, 075148 (2021a).
- Zhao et al. (2021) H. Zhao, H. Li, B. R. Ortiz, S. M. L. Teicher, T. Park, M. Ye, Z. Wang, L. Balents, S. D. Wilson, and I. Zeljkovic, Nature 599, 216–221 (2021).
- Wang et al. (2021b) N. Wang, K. Chen, Q. Yin, Y. Ma, B. Pan, X. Yang, X. Ji, S. Wu, P. Shan, S. Xu, et al., Physical Review Research 3, 043018 (2021b).
- Zhu et al. (2021) C. Zhu, X. Yang, W. Xia, Q. Yin, L. Wang, C. Zhao, D. Dai, C. Tu, B. Song, Z. Tao, et al., arXiv preprint arXiv:2104.14487 (2021).
- Du et al. (2021) F. Du, S. Luo, B. R. Ortiz, Y. Chen, W. Duan, D. Zhang, X. Lu, S. D. Wilson, Y. Song, and H. Yuan, Physical Review B 103, L220504 (2021).
- Yu et al. (2021b) F. Yu, D. Ma, W. Zhuo, S. Liu, X. Wen, B. Lei, J. Ying, and X. Chen, Nature communications 12, 1 (2021b).
- Wang et al. (2021c) Q. Wang, P. Kong, W. Shi, C. Pei, C. Wen, L. Gao, Y. Zhao, Q. Yin, Y. Wu, G. Li, et al., Advanced Materials 33, 2102813 (2021c).
- Chen et al. (2021) K. Chen, N. Wang, Q. Yin, Y. Gu, K. Jiang, Z. Tu, C. Gong, Y. Uwatoko, J. Sun, H. Lei, et al., Physical Review Letters 126, 247001 (2021).
- Zhang et al. (2021a) Z. Zhang, Z. Chen, Y. Zhou, Y. Yuan, S. Wang, J. Wang, H. Yang, C. An, L. Zhang, X. Zhu, et al., Physical Review B 103, 224513 (2021a).
- Brandt (1988) E. Brandt, Physical Review B 37, 2349 (1988).
- Brandt (2003) E. H. Brandt, Physical Review B 68, 054506 (2003).
- Xu et al. (2021) H.-S. Xu, Y.-J. Yan, R. Yin, W. Xia, S. Fang, Z. Chen, Y. Li, W. Yang, Y. Guo, D.-L. Feng, et al. (2021).
- Duan et al. (2021) W. Duan, Z. Nie, S. Luo, F. Yu, B. R. Ortiz, L. Yin, H. Su, F. Du, A. Wang, Y. Chen, et al., arXiv preprint arXiv:2103.11796 (2021).
- Gupta et al. (2021) R. Gupta, D. Das, C. H. Mielke III, Z. Guguchia, T. Shiroka, C. Baines, M. Bartkowiak, H. Luetkens, R. Khasanov, Q. Yin, et al., arXiv preprint arXiv:2108.01574 (2021).
- Nakayama et al. (2021) K. Nakayama, Y. Li, T. Kato, M. Liu, Z. Wang, T. Takahashi, Y. Yao, and T. Sato, Physical Review B 104, L161112 (2021).
- Das et al. (2021) D. Das, R. Gupta, C. Baines, H. Luetkens, D. Kaczorowski, Z. Guguchia, and R. Khasanov, Physical review letters 127, 217002 (2021).
- Uemura et al. (1989) Y. J. Uemura, G. M. Luke, B. J. Sternlieb, J. H. Brewer, J. F. Carolan, W. N. Hardy, R. Kadono, J. R. Kempton, R. F. Kiefl, S. R. Kreitzman, et al., Phys. Rev. Lett. 62, 2317 (1989).
- Guguchia et al. (2022) Z. Guguchia, C. Mielke III, D. Das, R. Gupta, J.-X. Yin, H. Liu, Q. Yin, M. Christensen, Z. Tu, C. Gong, et al., arXiv:2202.07713 (2022).
- Mielke et al. (2021) C. Mielke, Y. Qin, J.-X. Yin, H. Nakamura, D. Das, K. Guo, R. Khasanov, J. Chang, Z. Q. Wang, S. Jia, et al., Phys. Rev. Materials 5, 034803 (2021).
- Luke et al. (1998) G. M. Luke, Y. Fudamoto, K. Kojima, M. Larkin, J. Merrin, B. Nachumi, Y. Uemura, Y. Maeno, Z. Mao, Y. Mori, et al., Nature 394, 558 (1998).
- Grinenko et al. (2021a) V. Grinenko, S. Ghosh, R. Sarkar, J.-C. Orain, A. Nikitin, M. Elender, D. Das, Z. Guguchia, F. Brückner, M. E. Barber, et al., Nature Physics 17, 748 (2021a).
- Grinenko et al. (2021b) V. Grinenko, D. Das, R. Gupta, B. Zinkl, N. Kikugawa, Y. Maeno, C. W. Hicks, H.-H. Klauss, M. Sigrist, and R. Khasanov, Nature Communications 12 (2021b).
- Luke et al. (1993) G. Luke, A. Keren, L. Le, W. Wu, Y. Uemura, D. Bonn, L. Taillefer, and J. Garrett, Physical review letters 71, 1466 (1993).
- Hillier et al. (2009) A. D. Hillier, J. Quintanilla, and R. Cywinski, Physical review letters 102, 117007 (2009).
- Biswas et al. (2021) P. K. Biswas, S. K. Ghosh, J. Zhao, D. A. Mayoh, N. Zhigadlo, X. Xu, C. Baines, A. Hillier, G. Balakrishnan, and M. Lees, Nature communications 12, 1 (2021).
- Kubo and Toyabe (1967) R. Kubo and T. Toyabe, North Holland, Amsterdam (1967).
- Ratcliff et al. (2021) N. Ratcliff, L. Hallett, B. R. Ortiz, S. D. Wilson, and J. W. Harter, arXiv preprint arXiv:2104.10138 (2021).
- Denner et al. (2021) M. M. Denner, R. Thomale, and T. Neupert, Physical Review Letters 127 (2021).
- Feng et al. (2021) X. Feng, K. Jiang, Z. Wang, and J. Hu, Science Bulletin (2021).
- Lin and Nandkishore (2021) Y.-P. Lin and R. M. Nandkishore, Phys. Rev. B 104, 045122 (2021).
- Christensen et al. (2021) M. H. Christensen, T. Birol, B. M. Andersen, and R. M. Fernandes, Phys. Rev. B 104, 214513 (2021).
- Subedi (2022) A. Subedi, Phys. Rev. Materials 6, 015001 (2022).
- Park et al. (2021) T. Park, M. Ye, and L. Balents, Phys. Rev. B 104, 035142 (2021).
- Cho et al. (2021) S. Cho, H. Ma, W. Xia, Y. Yang, Z. Liu, Z. Huang, Z. Jiang, X. Lu, J. Liu, Z. Liu, et al., Phys. Rev. Lett. 127, 236401 (2021).
- Qian et al. (2021) T. Qian, M. H. Christensen, C. Hu, A. Saha, B. M. Andersen, R. M. Fernandes, T. Birol, and N. Ni, Phys. Rev. B 104, 144506 (2021).
- Zhang et al. (2021b) J.-F. Zhang, K. Liu, and Z.-Y. Lu, Phys. Rev. B 104, 195130 (2021b).
- Yin et al. (2021) Q. Yin, Z. Tu, C. Gong, Y. Fu, S. Yan, and H. Lei, Chinese Physics Letters 38, 037403 (2021).
- Ortiz et al. (2020) B. R. Ortiz, S. M. Teicher, Y. Hu, J. L. Zuo, P. M. Sarte, E. C. Schueller, A. M. Abeykoon, M. J. Krogstad, S. Rosenkranz, R. Osborn, et al., Physical Review Letters 125, 247002 (2020).
- Ortiz et al. (2019) B. R. Ortiz, L. C. Gomes, J. R. Morey, M. Winiarski, M. Bordelon, J. S. Mangum, I. W. Oswald, J. A. Rodriguez-Rivera, J. R. Neilson, S. D. Wilson, et al., Physical Review Materials 3, 094407 (2019).
- Yaouanc and De Reotier (2011) A. Yaouanc and P. D. De Reotier, Muon spin rotation, relaxation, and resonance: applications to condensed matter, vol. 147 (Oxford University Press, 2011).
- Hillier et al. (2022) A. D. Hillier, S. Blundell, I. McKenzie, I. Umegaki, L. Shu, J. A. Wright, T. Prokscha, F. Bert, K. Shimomura, A. Berlie, et al., Nat. Rev. Method Primers 2, 4 (2022).
- Shermadini et al. (2017) Z. Shermadini, R. Khasanov, M. Elender, G. Simutis, Z. Guguchia, K. Kamenev, and A. Amato, High Pressure Research 37, 449 (2017).
- Khasanov et al. (2016) R. Khasanov, Z. Guguchia, A. Maisuradze, D. Andreica, M. Elender, A. Raselli, Z. Shermadini, T. Goko, F. Knecht, E. Morenzoni, et al., High Pressure Research 36, 140 (2016).
- Suter and Wojek (2012) A. Suter and B. Wojek, Physics Procedia 30, 69 (2012).
- Serventi et al. (2004) S. Serventi, G. Allodi, R. De Renzi, G. Guidi, L. Romano, P. Manfrinetti, A. Palenzona, C. Niedermayer, A. Amato, and C. Baines, Physical review letters 93, 217003 (2004).
- Kresse and Hafner (1993) G. Kresse and J. Hafner, Phys. Rev. B 47, 558 (1993).
- Kresse and Furthmüller (1996a) G. Kresse and J. Furthmüller, Comput. Mater. Sci. 6, 15 (1996a).
- Kresse and Furthmüller (1996b) G. Kresse and J. Furthmüller, Phys. Rev. B 54, 11169 (1996b).
- Methfessel and Paxton (1989) M. Methfessel and A. Paxton, Phys. Rev. B 40, 3616 (1989).
- Aroyo et al. (2011) M. I. Aroyo, J. M. Perez-Mato, D. Orobengoa, E. Tasci, G. De La Flor, and A. Kirov, Bulgarian Chemical Communications 43, 183 (2011), ISSN 08619808.