2INAF – Osservatorio Astronomico di Trieste, Via G. B. Tiepolo 11, I-34143 Trieste, Italy
3Centre for Astrophysics Research, Department of Physics, Astronomy and Mathematics, University of Hertfordshire, Hatfield, AL10 9AB, UK
4INAF – OAS, Osservatorio di Astrofisica e Scienza dello Spazio di Bologna, via Gobetti 93/3, I-40129 Bologna, Italy
5Departamento de Astronomía, Universidad de La Serena, Av. Juan Cisternas 1200 Norte, La Serena, Chile
6Instituto de Investigación Multidisciplinar en Ciencia y Tecnología, Universidad de La Serena, Raúl Bitrán 1305, La Serena, Chile
7Scuola Normale Superiore, Piazza dei Cavalieri 7, I-56126 Pisa, Italy
8Sorbonne Université, CNRS, UMR7095, Institut d’Astrophysique de Paris, F-75014, Paris, France
9Astrophysics, The Denys Wilkinson Building, University of Oxford, Keble Road, Oxford, OX1 3RH
10Kapteyn Astronomical Institute, University of Groningen, P.O. Box 800, 9700 AV Groningen, The Netherlands
11NSF’s NOIRLab, Tucson, AZ 85719, USA
The ionizing properties of two bright Ly emitters in the BDF reionized bubble at z=7
Abstract
Aims. We investigate the ionizing properties of the pair of bright Ly emitting galaxies BDF521 and BDF2195 at z=7.012 in order to constrain their contribution to the formation of the BDF ”reionized bubble” (Castellano et al., 2016a, 2018) in which they have been shown to reside.
Methods. We obtain constraints on UV emission lines (CIV doublet, HeII, OIII] doublet, and CIII] doublet) from deep VLT-XSHOOTER observations and compare them to those available for other high-redshift objects, and to models with mixed stellar and AGN emission. We use this spectroscopic information together with the photometry available in the field to constrain the physical properties of the two objects using the spectro-photometric fitting code BEAGLE.
Results. We do not detect any significant emission at the expected position of UV lines, with 3 upper limits of EW2-7Å rest-frame. We find that the two objects have lower CIII] emission than expected on the basis of the correlation between the Ly and CIII] EWs. The EW limits on CIV and HeII emission exclude pure AGN templates at significance, and only models with a 40% AGN contribution are compatible with the observations. The two objects are found to be relatively young (20-30 Myrs) and metal-poor () with stellar masses of a few . Their production rate of hydrogen ionizing photons per intrinsic UV luminosity is log(/Hz erg-1)=25.02-25.26, consistent with values typically found in high-redshift galaxies, but more than twice lower than values measured in 7 galaxies with strong CIII] and/or optical line emission (25.6-25.7).
Conclusions. The two BDF emitters have no evidence of higher than average ionizing capabilities and are not capable of reionizing their surroundings by their own means under realistic assumptions on the escape fraction of ionizing photons. Therefore, a dominant contribution to the formation of the reionized bubble must have been provided by companion fainter galaxies. These objects will need JWST capabilities for spectroscopic confirmation.
Key Words.:
galaxies: evolution — galaxies: high-redshift — dark ages, reionization, first stars1 Introduction
The epoch of reionization (EoR) marked a major phase transition of the Universe, during which the intergalactic medium (IGM) became transparent to UV photons. Determining the physical processes involved in the reionization process, its timeline and topology represents the latest frontier in observational cosmology (Dayal & Ferrara, 2018).
The first indication of an increased neutral hydrogen fraction () in the IGM at 6 was obtained by observations of the Gunn-Peterson effect in distant quasars (Fan et al., 2002). However, a substantial step in our knowledge of the reionization timeline has been made possible only by constraints on the redshift evolution of the fraction of Lyman-break galaxies (LBGs) that have an appreciable Ly emission line (e.g., Malhotra & Rhoads, 2006; Stark et al., 2010; Fontana et al., 2010). In fact, the neutral hydrogen in the IGM scatters Ly photons out of the line-of-sight, such that a lower line visibility indicates a higher IGM neutral fraction if the properties of the inter-stellar medium remain unchanged (e.g., Dayal et al., 2011; Dijkstra, 2019). As of today, a decrease in the Ly fraction at 6 has been confirmed by many independent analyses and interpreted as indication of an increasing neutral hydrogen fraction in the IGM (e.g., Pentericci et al., 2011; Schenker et al., 2012; Ono et al., 2012; Mason et al., 2018; Pentericci et al., 2018; Mason et al., 2019). Together with measurements of the CMB Thomson optical depth (Planck Collaboration et al., 2020), of the clustering of Ly-emitters (LAEs, Hutter et al., 2015; Sobacchi & Mesinger, 2015) and with measurements of ionized regions around the most distant QSOs (e.g., Bañados et al., 2018), the available observations point to a scenario in which the universe was still substantially neutral at 10 (90%) and was rapidly reionized in 500Myrs, ending the EoR at 5.5-6 (e.g., Mitra et al., 2015; Greig & Mesinger, 2017; Mitra et al., 2018; Hutter et al., 2021). Star-forming galaxies are currently considered as the most likely responsible of reionization (e.g., Robertson et al., 2015; Bouwens et al., 2015a; Dayal et al., 2020; Endsley et al., 2021b; Romanello et al., 2021), although our poor knowledge of galaxy physical properties does not allow us to rule out that active galactic nuclei (AGN) also contributed (Finkelstein et al., 2019; Giallongo et al., 2015).
The rate of ionizing photons escaping into the IGM from a given population is , where is the total, dust-corrected UV luminosity density at 1500Å, is the ionizing photon production efficiency per unit UV luminosity, and is the fraction of ionizing photons leaked into the surrounding environment. Currently, the UV luminosity density from star-forming galaxies is well constrained by measurements of their UV luminosity function (LF) at 6 down to (e.g., Bouwens et al., 2015b; Livermore et al., 2017; Ishigaki et al., 2018; Yue et al., 2018; Oesch et al., 2018). On the other hand, the escape fraction of ionizing photons can only be directly constrained at 3-4 and on average is quite modest in LBGs with values lower than 5-10% (Boutsia et al., 2011; Marchi et al., 2017; Grazian et al., 2017; Steidel et al., 2018; Pahl et al., 2021). Only in few rare objects it reaches values of 50% (de Barros et al., 2016; Vanzella et al., 2016; Naidu et al., 2017; Vanzella et al., 2018; Izotov et al., 2018a, b; Flury et al., 2022). As of today, no real constraints exist on a possible increase of with redshift and we can only make assumptions on its value in the EoR.
The ionizing efficiency can be directly obtained by measuring, at the same time, the non-ionizing UV continuum and the Balmer emission lines, the latter yielding the emission rate of ionizing photons (e.g., Shivaei et al., 2018), or from the equivalent width of the [OIII] doublet (Chevallard et al., 2018; Tang et al., 2019). At higher redshifts where optical emission lines are not directly observable through spectroscopy, constraints on were derived by the analysis of the rest-frame UV colors (e.g., Duncan & Conselice, 2015) or from the contamination from strong emission lines to the mid-IR colors, finding a typical log(/Hz erg-1)25.3 at 4-5 (Bouwens et al., 2016; Lam et al., 2019), with indication of higher ionizing efficiencies in LAEs (Harikane et al., 2018; Sobral & Matthee, 2019) and strong [OIII] emitters (Tang et al., 2019).
For galaxies in the EoR, constraints on the ionizing capabilities can be derived using UV emission lines. These however are extremely faint and have been detected only in a handful of objects (e.g., Stark et al., 2015a, b; Laporte et al., 2017; Mainali et al., 2018; Hutchison et al., 2019; Topping et al., 2021).
Such features might be associated to AGN or metal poor stellar populations (Gutkin et al., 2016; Feltre et al., 2016; Nakajima et al., 2018b) as also shown at lower redshifts (e.g., Amorín et al., 2017; Calabrò et al., 2017; Nakajima et al., 2018a). The spectro-photometric analysis of a CIV emitter at z=7.045 allowed Stark et al. (2015b) to estimate a ionizing efficiency log(/Hz erg-1)25.68 much higher than the typical value measured at lower redshifts, and comparable to values measured in rare, extreme emission line galaxies at 3-4 (Nakajima et al., 2016). Similarly, spectroscopically confirmed 7 galaxies with mid-IR colors suggestive of intense H+[OIII] emission show a log(/Hz erg-1)25.5 (Stark et al., 2017; Endsley et al., 2021a). These results point to an increased fraction of galaxies with high ionizing efficiency in the EoR.
A promising way to shed light on the sources of reionization is the investigation of regions where this process is more advanced and observations point to the presence of ”reionized bubbles” (Castellano et al., 2016a; Higuchi et al., 2019; Tilvi et al., 2020; Jung et al., 2021; Leonova et al., 2021; Endsley & Stark, 2021). The analysis of the Ly fraction in independent lines-of-sight suggests that reionization was a spatially inhomogeneous process (Treu et al., 2012; Pentericci et al., 2014). A detailed spectroscopic investigation of the Bremer Deep Field (BDF) (Lehnert & Bremer, 2003; Castellano et al., 2010), led to the first discovery of a likely reionized ”bubble” at 7 (Castellano et al., 2016a, hereafter C16). The BDF hosts three bright () Ly emitting galaxies with EW50Å (Vanzella et al., 2011; Castellano et al., 2018, hereafter V11 and C18), and the density of 7 faint LBGs in this area is 3-4 times higher than the average (C16). Two of the Ly emitting galaxies (BDF521 and BDF2195) have exactly the same redshift and are at a projected physical separation of only 91.3kpc, the third one, BDF3299, being at 1.9 proper Mpc projected distance.
The high number density of LBGs in the BDF region is consistent with the clustered faint galaxies being key contributors to the local reionization history (C16, Rodríguez Espinosa et al., 2021), as expected in “inside-out” reionization scenarios (Choudhury et al., 2009; Dayal et al., 2009; Trebitsch et al., 2021). However, significant uncertainties remain due to the lack of Ly detections in the faint companion galaxies, despite the significant observational efforts (C18). Lacking a spectroscopic confirmation of the faint LBGs in the field, it is fundamental to fully constrain the physical properties of the bright emitters and assess whether they can create the reionized region possibly thanks to hard-ionizing stellar populations or AGN.
In this paper we analyse deep VLT-XSHOOTER observations of the BDF521 and BDF2195 pair to put constraints on the ionizing budget of the two emitters from UV rest-frame metal emission lines, and to ascertain whether these galaxies play a major role in the creation of the BDF bubble.
The paper is organised as follows: in Sect. 2 we present the observations and data reduction, in Sect. 3 we discuss the constraints on emission lines and compare the BDF galaxies to other high redshift sources. We place constraints on the contribution from AGN in Sect. 4, and quantify their physical properties and their contribution to the creation of the BDF bubble in Sect. 5. The results are summarised in Sect. 6.
Throughout the paper we adopt AB magnitudes (Oke & Gunn, 1983), a solar metallicity =0.02, and a -CDM concordance model ( = 70 km s-1 Mpc-1, , and ).
2 The XSHOOTER observations
The BDF521 and BDF2195 pair was observed by XSHOOTER in nodding mode with 110.9 arcsec slits and 900 and 865 seconds per single exposure in the NIR and VIS arms, respectively. Observations were acquired between 26 September 2019 and 8 June 2021. The total observing time was of 15 and 12 hours for BDF521 and BDF2195, respectively, corresponding to on-target exposure times of 12.0 (11.5) and 9.5 (9.1) hours in NIR (VIS).
Science frames were reduced with the official XSHOOTER pipeline (Modigliani et al., 2010), v. 3.3.5, using the associated raw calibrations from the ESO archive. Sky subtraction was performed using the XSHOOTER nodding strategy, combining frames acquired at two different positions in the sky for each OB execution. A fixed boxcar window was used to extract the target on the rectified 2D spectra, to ensure that the target was correctly localized along the slit (extractmethod=LOCALIZATION and localizemethod=MANUAL in pipeline recipe xsh_scired_slit_nod). The position of the window with respect to the slit center and its half height (in arcsec) were fine-tuned for the two targets independently, based on the position of the Ly line which is well detected in the 2D VIS median stacked spectra (and visible in each single OB); we used localize-slit-position=-1.0, localize-slit-hheight=0.5 for BDF521 and localize-slit-position=-3.2, localize-slit-hheight=0.6 for BDF2195 in pipeline recipe xsh_scired_slit_nod.
The 1D extracted spectra, one for each XSHOOTER arm and OB execution, were corrected to the barycentric reference frame in vacuum and combined with the data analysis package Astrocook (Cupani et al., 2020). The combined spectra were rebinned to 18 km s-1 in the NIR arm and to 11 km s-1 in the VIS arm, roughly corresponding to 3 pixels per resolution element, given the nominal resolution FWHMs of the instrument in the three arms for the adopted slit. Undersampled spectra with larger spectral bins (54 km s-1 in the NIR arm, 33 km s-1 in the VIS arm) were also produced to facilitate the identification of spectral features by visual inspection.
While the slits are not designed to include the total flux from the observed objects, following Lemaux et al. (2009) we expect slit losses to be small (10-15%) on the basis of the slit dimension, the compact size of the sources (0.15”) and the median seeing (0.8”) of the XSHOOTER observations. In order to quantitatively assess the significance of potential slit losses we smoothed the HST F125W image (C16) of the objects to the seeing of the spectroscopic observations and measured the fraction of the total flux observed within the slit size. We find corrections of 10% that are, however, uncertain due to effects of light contamination from other objects and local background subtraction of the images. Therefore, we decided not to apply correction factors in the following.
3 Constraints on UV rest-frame line emission
At the Ly redshift estimated from FORS2 (z=7.008, C18), the VIS arm of the instrument covers the Ly line, while the NIR arm covers the range of the CIV doublet (1548Å-1550Å), HeII, the OIII] doublet (1661Å-1666Å), and the CIII] doublet (1907Å-1909Å). We first visually inspected the spectra to localize Ly emission and obtain a precise positioning of the object within the slit.
3.1 Ly emission
| Line | BDF521 | BDF2195 | ||
| Flux | EW Å | Flux | EW Å | |
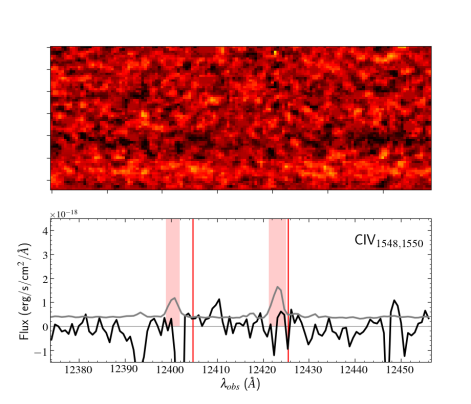
| CIV1548.20 | 1.40 | 7.18 | 1.93 | 5.77 |
| CIV1550.78 | 1.42 | 7.30 | 1.79 | 5.58 |
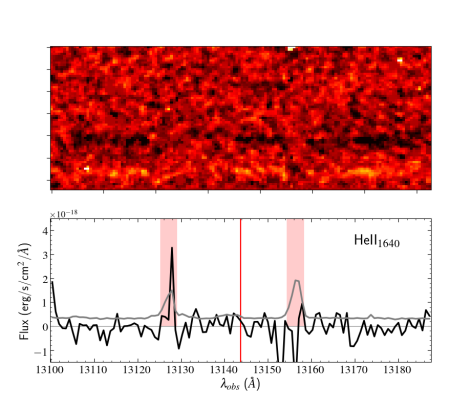
| HeII1640.42 | 1.47 | 5.86 | 1.81 | 4.34 |
| OIII1660.81 | 1.58 | 6.49 | 1.80 | 3.98 |
| OIII1666.15 | 1.58 | 5.96 | 2.02 | 4.64 |
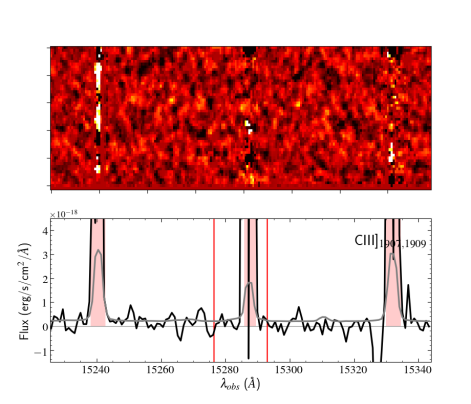
| CIII1906.68 | 1.35 | 1.96 | 1.81 | 1.85 |
| CIII1908.73 | 1.45 | 2.40 | 1.87 | 2.16 |
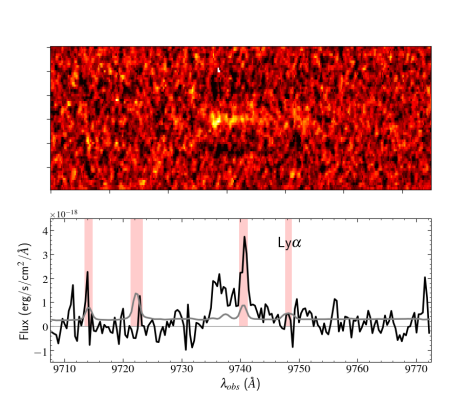
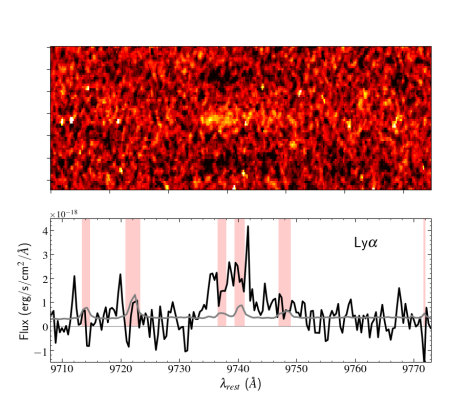
We detect Ly line emission for both objects: the flux-weighted mean wavelength of the line corresponds to z=7.0121 and z=7.0124 for BDF521 and BDF2195, respectively. These redshifts are slightly higher than previously estimated from the peak of the Ly emission in FORS2 spectra (z=7.008) but do confirm that the objects are approximately at the same redshift and, given the close separation on the sky (91.3kpc, C18), likely physically connected. We will use these new estimates in the present analysis. The total Ly fluxes are and erg/s/cm2 for BDF521 and BDF2195, respectively. The widths in velocity space and the equivalent widths of the lines are consistent with previous analysis. We find EW(Ly)=605Å, FWHM(Ly)=2635 km/s for BDF521, and EW(Ly)=623Å, FWHM(Ly)=2503 km/s for BDF2195. The continuum flux is estimated on the basis of the available photometry (C16). The FWHM is measured with a Gaussian fit and corrected for the effect of instrumental resolution. Uncertainties are computed following Lenz & Ayres (1992).
The VIS arm covers also the expected range of the NV 1240 doublet but in a noisy, low efficiency, region of the spectrum that does not allow us to improve upon the limits previously obtained with FORS2 (C18).
3.2 Limits on UV metal lines
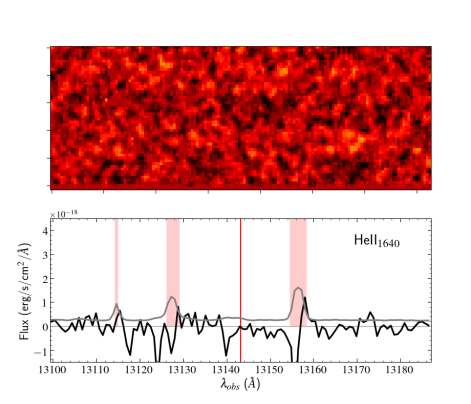
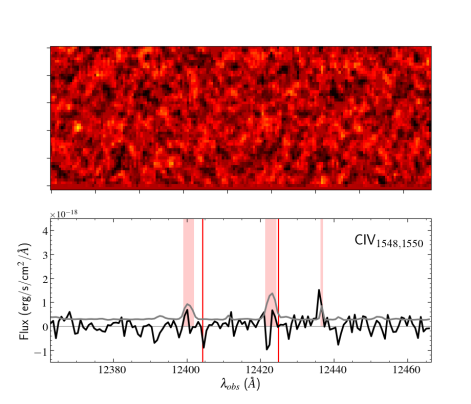
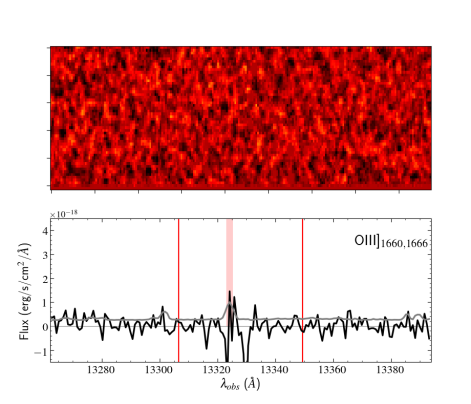
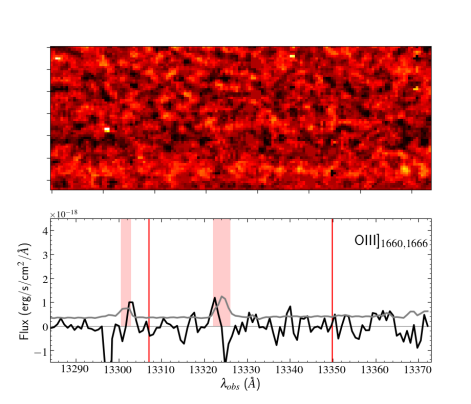
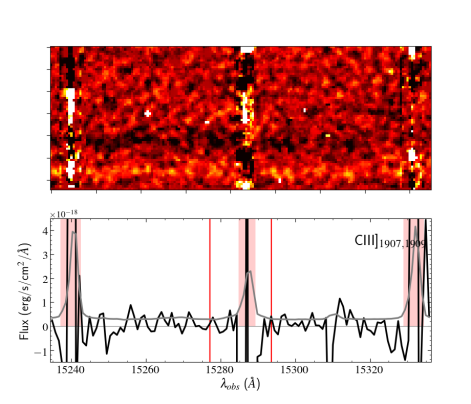
We inspected both 2D and 1D spectra to assess the presence of metal UV emission lines. We detect no continuum emission and find no significant features within 500 km/s from the position expected on the basis of the Ly redshift. In general, no evident line emission is elsewhere found at the objects’ positions in the NIR arm spectra. Considering the Ly velocity offset range expected for bright 7 galaxies (e.g. Maiolino et al., 2015; Mason et al., 2018) we estimate upper limits for the flux of all lines from the average flux uncertainty in a moving window of 100 km/s rest-frame across the range between -500 km/s and 0 km/s from the Ly redshift, while masking sky line residuals. We derive corresponding EW limits after estimating the continuum flux at each position on the basis of the observed photometry (C16). Namely, we follow the standard assumption of approximating the UV continuum as a power law whose slope can be measured from a regression across the observed bands (e.g. Castellano et al., 2012). The measured slopes are -2.250.25 and -1.660.16 for BDF521 and BDF2195, respectively. We find rest-frame EW limits 2-7 Å at 3 (Table 1). The limit on HeII emission for BDF521 is consistent with the estimate obtained by Cai et al. (2015) from narrow-band HST photometry. The spectra at the expected positions of the relevant lines are shown in Figs. 5 and 6.
3.3 Comparison with other high-redshift sources
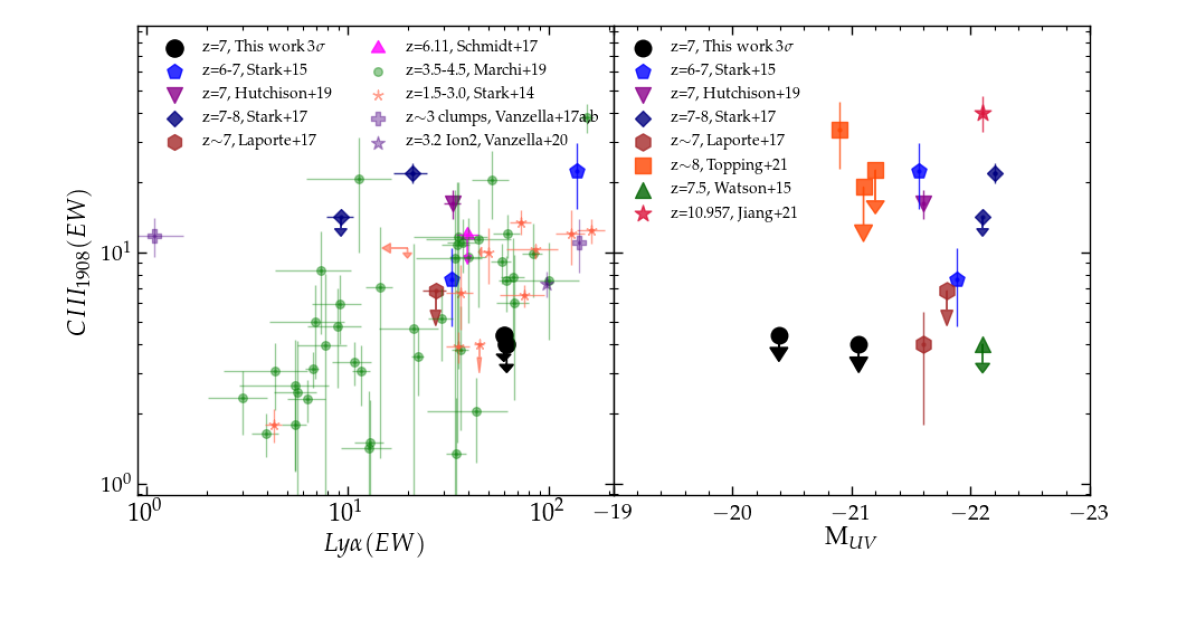
In the last few years, several groups actively searched for UV emission lines in the most distant galaxies, as valuable diagnostics of the underlying radiation field (e.g., Mainali et al., 2018; Stark et al., 2017; Laporte et al., 2017; Endsley et al., 2021a) and in some case as redshift indicators, in the absence of Ly (Jiang et al., 2021b). The most common line, besides Ly, is the CIII] doublet which has been detected in several of the most distant galaxies including the most distant spectroscopically confirmed galaxy GN-z11 at z=10.957 (Oesch et al., 2016; Jiang et al., 2021b). At 3-4, a strong correlation between the Ly and CIII] strength has been found by several authors (Stark et al., 2014; Marchi et al., 2019), although in other cases a large scatter between the quantities was also observed (Le Fèvre et al., 2019; Rigby et al., 2015; Llerena et al., 2021; Schmidt et al., 2021). Confirmed (Vanzella et al., 2020) or suspected 3 Lyman-continuum leakers (Vanzella et al., 2017a, b) either fall on the expected relation, or rather show significant CIII] emission and suppressed Ly emission.
It is unclear whether the relation holds at z6 where only a few detections are available. The reported detections we show in the left panel of Fig. 1 seem to agree with the lower redshift behavior, while our two BDF emitters do not follow the expected trend. Indeed, the galaxies have rather large Ly EW and we would expect solid detections of the CIII] doublet at from the average of lower redshift relations, albeit the BDF objects are consistent with the lower envelope of the measured distributions. As shown in the right panel of Fig. 1, all high-redshift objects with a secure CIII] detection are bright, LBGs (i.e., -20.5, e.g. Harikane et al., 2021), in most cases significantly brighter than the BDF emitters.
Llerena et al. (2021) found that strong CIII] emitters at 3 have strong radiation fields, low stellar metallicity but their gas is already partially enriched with C/O abundances in the range 35%-150% solar. In this respect, the lack of strong CIII] emission can be explained either by an extremely low C abundance in the gas phase, and/or by the objects being in a less active star-formation phase (Berg et al., 2019). In the case of the BDF galaxies a low metallicity is likely the main factor affecting the low CIII] emission given the high Ly EW suggesting active star-formation. A low metallicity is also consistent with the lack of CII158 detection in BDF521 (Maiolino et al., 2015). A strong starburst phase that photodissociates the molecular clouds could also lower CII158 emission (Pallottini et al., 2019), but UV CIII] emission should be enhanced in such a situation if C is abundant in the ionized gas.
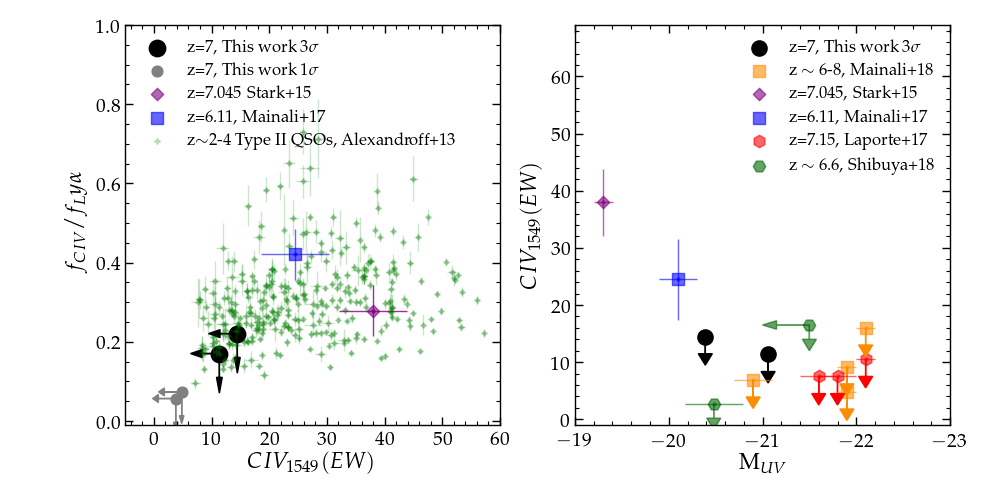
In Fig. 2 we compare the limits we have obtained for the CIV emission on the two BDF galaxies to previous studies. In the EoR there are only two galaxies where a convincing CIV emission has been detected, the gravitationally lensed low-mass galaxies RXC J2248.7-4431-ID3 (z=6.11, Mainali et al., 2017), and A1703-zd6 (z=7.045, Stark et al., 2015b). Several attempts to secure this line in small samples of galaxies at z=6-10 have failed to report detections (Laporte et al., 2017; Mainali et al., 2018; Shibuya et al., 2018), with typical EW limits around 3-10 Å comparable to the BDF galaxies. Although an AGN contribution to the Ly flux cannot be completely ruled out, the CIV equivalent widths and ratios for the two BDF galaxies are low compared to most known Type II AGN at intermediate redshift (Alexandroff et al., 2013), and much lower than those for the two 6 LBGs with CIV detections (left panel of Fig. 2). These results are consistent with the analysis of the Ly/NV ratio from FORS2 spectroscopy (C18). The two BDF galaxies have Ly/NV8-10 which is higher than the values measured in suspected AGN at z7 (e.g., Tilvi et al., 2016; Laporte et al., 2017; Mainali et al., 2018), albeit still consistent with values observed in AGN at lower redshifts (Humphrey et al., 2008; Hainline et al., 2011).
4 Limits on the contribution from AGN emission
The analysis of the limits on CIV emission presented in Fig. 2, and the existing constraints on the Ly/NV ratio (C18), already suggest that it is unlikely that the BDF emitters are dominated by AGN emission.
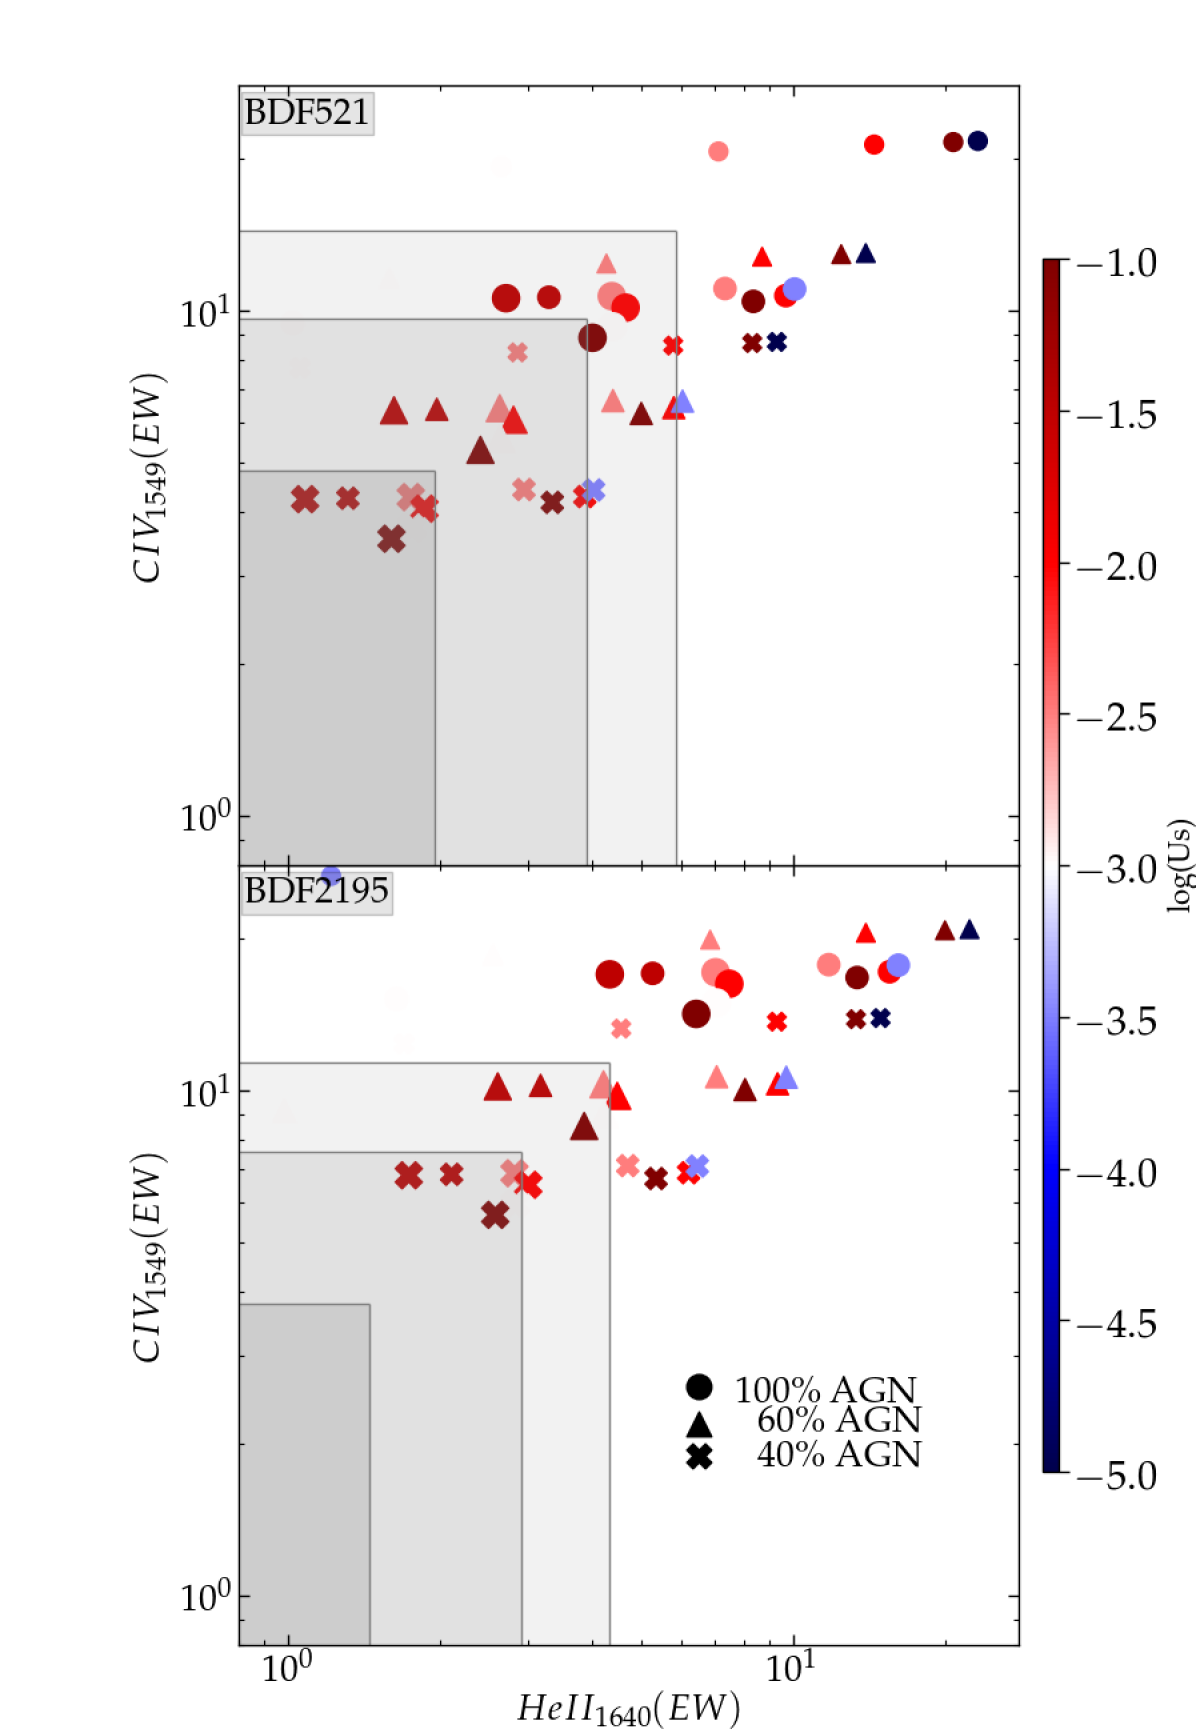
We perform here a more quantitative analysis by comparing the limits on CIV and HeII emission against narrow line AGN models by Feltre et al. (2016). We consider models with -5.0 log() -1.0 and interstellar gas metallicity , dust-to-metal mass ratio , and hydrogen gas density =100 cm-3. We restrict our analysis to models generated with incident spectra having UV spectral index , but we verified that results do not significantly change when adopting spectra with index . We first re-normalize the incident spectra to a chosen fraction of the observed flux of each object in the F125W filter (C16), i.e., the observable non-ionizing UV flux at Å, and then compute the EW of the CIV and HeII lines on the basis of the predicted line flux for each model and of the observed flux at the relevant wavelength. We note that using the models in this way allows us to constrain scenarios in which the AGN is contributing to the UV continuum emission, which is the most important test to constrain the ionizing output of our targets. While the models do not include the broad line region emission, this is not a concern in our case given the narrow FWHM of the Ly lines observed in the BDF galaxies. We show in Fig. 3 the position on the CIV(EW) versus HeII(EW) plane of AGN models with a 40%, 60% and 100% contribution to the observed UV emission highlighting the regions allowed at 1, 2 and 3 by the XSHOOTER observations. Models with pure AGN (100%) are always excluded at regardless of log() and metallicity. The more stringent constraints on BDF2195 allow us also to exclude a 60% AGN contribution at 3. Models with 40% contribution are more compatible with the observations, particularly for BDF521, for high log() and intermediate/high metallicities.
The narrow line models of Feltre et al. (2016) can be further used to investigate the case of an obscured AGN providing no contribution to the UV continuum emission. In such a case, we must consider the fractional contribution of the AGN to the observed Ly emission. Since the radiative transfer effects of Ly are severe, we therefore investigate what fraction of Ly can escape for given fractional contribution of AGN without invalidating the measured line limits. For a similar parameter space of the models investigated above, we find that we can only rule out 100% narrow-line region contribution to Ly if only 20% (15%) escapes for BDF2195 (BDF521). For lower escape fraction of Ly, the line contribution can have 100% contribution from a Type-II AGN without the other rest-frame UV lines being detected.
5 The ionizing emission budget of the BDF emitters
From the above analysis it appears that the BDF pair lacks high-ionization features found in some other sources at a similar redshift, and instead resembles standard star-forming galaxies at lower redshifts with low or absent contribution from AGN. We thus constrain the physical parameters of the two galaxies, including the ionizing budget, by means of a spectro-photometric fit performed with the BEAGLE v0.24.5 tool (Chevallard & Charlot, 2016) using the most recent version of the Bruzual & Charlot (2003) stellar population synthesis models (see Vidal-García et al., 2017, for details). Nebular emission is modeled self-consistently as described in Gutkin et al. (2016) by processing stellar emission with the photoionization code CLOUDY (c13.03, Ferland et al., 2013). The fit is performed by fitting the upper limits on the integrated lines plus continuum fluxes measured as described in Sect. 3, together with the broad-band photometric measurements redward of the Lyman break in the F105W, F125W, F160W and HAWK-I Ks bands (C16, see also Castellano et al., 2010; Cai et al., 2015). Given that the Ly is very difficult to model in this framework, we subtract its flux from the affected bands and do not include it in the nebular emission modeled by BEAGLE. We fix the redshift at the value determined from Ly. Although there is usually a shift between Ly and systemic redshift, this in practice has no effect on the constraints derived here. The BEAGLE SED-fitting runs are performed with a configuration similar to the one discussed by Stark et al. (2017). The templates are based on a Chabrier (2003) initial mass function and have metallicity in the range . The star formation histories (SFH) are parametrized as an exponentially delayed function (SFR(t) texp(-t/)), which is the most flexible parametric SFH allowed by the code, plus an ongoing constant burst of 10 Myr duration. We adopt uniform priors on the SFH exponential timescale (7.0 /log(yr) 10.5), stellar mass (7.0 log() 12), and maximum stellar age (7.0 log() age of the universe). Attenuation by dust is treated following the Charlot & Fall (2000) model combined with the Chevallard et al. (2013) prescriptions for geometry and inclination effects, assuming an effective V-band optical depth in the range -3.0 log() 0.7 with a fixed fraction arising from dust in the diffuse ISM. Interstellar metallicity is assumed to be identical to the stellar one, the dust-to-metal mass ratio and ionization parameter are left free in the ranges and -4.0 log() -1.0, respectively.
We exploit the observed Ly flux to impose a prior on the ongoing SFR. Following Kennicutt (1998), the total line fluxes correspond to SFR(Ly)=6.70.5/yr and SFR(Ly)=11.40.6/yr for BDF521 and BDF2195, respectively. As we expect the SFR inferred from the detected Ly to be a lower limit to the intrinsic SFR of BDF521 and BDF2195 depending on their Ly escape fraction and attenuation by the IGM, we use the corresponding 5 lower limits on SFR(Ly), i.e. /yr and /yr, as conservative lower bounds for the uniform prior ranges on their current SFRs.
The best-fit parameters and relevant 68% confidence level uncertainties are shown in Table. 2. The objects are found to be relatively young (mass-weighted age 20-30 Myrs) and metal-poor () galaxies with stellar masses of a few . Both objects are actively star-forming (SFR15), but had experienced a higher star-formation activity in the past. We find a small degeneracy among the mass, extinction and age parameters, with older models being more massive and less extincted by dust. The results do not change significantly when adopting different parametrizations of the SFH, nor with updated treatment of dust within HII regions implemented in BEAGLE v0.27.1 described in Curtis-Lake et al. (2021).
The most important parameter to explore thanks to the combined spectroscopic and photometric information is the production rate of hydrogen ionizing photons per intrinsic (i.e. unattenuated) UV luminosity, . We find best-fit values for log(/Hz erg-1) of 25.26 and 25.02 for BDF521 and BDF2195, respectively. These values are consistent with the typical ionizing production efficiency of 4 populations (Bouwens et al., 2015a, 2016; Lam et al., 2019), and significantly lower than the log(/Hz erg-1)25.6-25.7 found in 7 galaxies with CIII] detection and/or photometric evidence of strong optical emission lines (Stark et al., 2015b, 2017). The ionizing emission from the BDF emitters is lower, albeit consistent at , with the average value in 5 LAEs (Harikane et al., 2018), and with the log(/Hz erg-1)=25.43 estimated for the BDF galaxies by Rodríguez Espinosa et al. (2021) on the basis of the Ly luminosity following Sobral & Matthee (2019). Most importantly, these results show that the two emitters are rather ”standard” high-redshift star-forming galaxies, with no significant excess production of ionizing photons contributing to the local reionization history.
| BDF521 | BDF2195 | |
| Redshift | 7.0121 | 7.0124 |
| -20.4 | -21.1 | |
| UV slope | -2.250.25 | -1.660.16 |
| SFR (/yr) | ||
| Ageb (Myr) | ||
| Stellar | ||
| (mag) | ||
| (log(erg/Hz)) |
a Physical properties (mean values and 68% c.l. uncertainties) are from the BEAGLE spectro-photometric fit.
b Mass-weighted values.
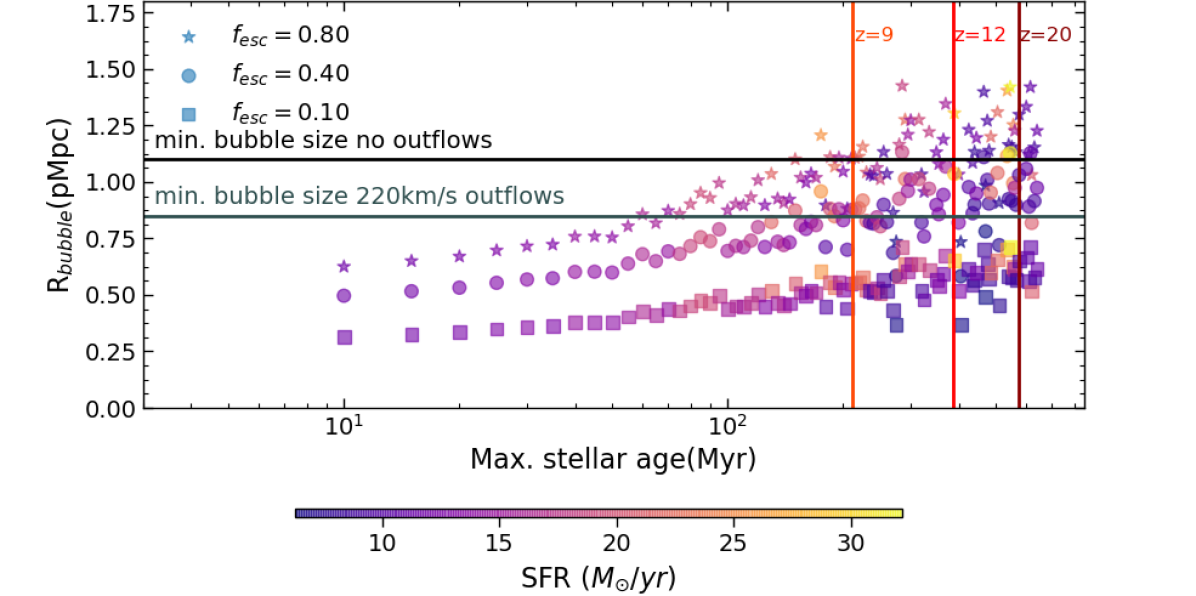
With the improved constraints coming from the new spectro-photometric fit described in the previous section, we can quantitatively explore whether the BDF pair is capable of re-ionizing its surroundings or not. The SFR and the age of a galaxy can be used to measure the size () of the resulting ionized region following, e.g., Shapiro & Giroux (1987) and Madau et al. (1999) by assuming an escape fraction of ionizing photons , the hydrogen clumping factor C, and an average neutral hydrogen fraction at the onset of star-formation. As discussed in V11 and C18, the size must then be compared to the minimum size =1.1 Mpc enabling Ly to be redshifted enough to reach the observers (Wyithe & Loeb, 2005). The aforementioned is found under the assumption that the Ly escapes from the galaxies at the systemic redshift. The size threshold decreases in presence of strong outflows, for example a 220km/s shift, which is the median value found by Mason et al. (2018) (see also Endsley et al., 2022) for galaxies in massive halos, results in Mpc.
In practice, we compute the average SFR of the pair from all models within 95% c.l. from the best-fit as a function of time in bins of 5 Myr. We then convert this into by assuming C=2 and and let the escape fraction vary from 10% to 80%. The assumption of a 50% neutral fraction is conservative as a higher would further decrease the size of the reionized region created by the sources. The results are shown in Fig. 4 as a function of the relevant maximum stellar age of the models (i.e., the onset of the star-formation episode): we find that in the absence of significant outflows only models with an extremely high =80% and age larger than 200 Myr (formation redshift 9) can create a large enough bubble.
When assuming a Ly shift imprinted by 220km/s outflows, the two objects could grow a large enough bubble with an escape fraction =40% on the same time frame. However, even in the presence of outflows, there are no spectro-photometric fitting solutions allowing the BDF pair to reionize the surrounding region with an escape fraction of =10%. This is particularly relevant when considering that the physical properties of the BDF galaxies, i.e. moderate , and low EW of the UV metal lines, are typical for galaxies with low (Naidu et al., 2022). Note that these results are considerably more stringent than those discussed in C18 based on the SED-fitting of the available photometry only. The C18 results were consistent with a combination of high SFRs and old ages which in turn allowed the formation of a large enough reionized bubble. Our current spectro-photometric analysis suggests that the two emitters are not solely responsible of the growth of the ionized bubble. In turn, this finding is consistent with the analysis of the BDF region presented by Rodríguez Espinosa et al. (2021) indicating that a dominant contribution is provided by the clustered, faint galaxies.
6 Summary and future prospects
We have presented the analysis of deep VLT-XSHOOTER observations of BDF521 and BDF2195, a pair of , bright Ly emitting galaxies at 90 kpc separation shining within the BDF bubble, a 7 overdensity of both LBGs and LAEs showing all expected properties of a ”reionized bubble” embedded in a half-neutral universe (V11, C16, C18, Rodríguez Espinosa et al., 2021). Our main findings can be summarised as follows:
-
•
The Ly lines are detected at high significance in the VIS arm spectra at z=7.0121 and z-7.0124 for BDF521 and BDF2195, respectively. The Ly properties (EW60Å and FWHM250-260km/s) are consistent with previous analysis based on lower resolution FORS2 spectra.
-
•
No significant emission is detected in the NIR arm spectra at the expected position of the CIV doublet, HeII, OIII] doublet, and CIII] doublet. We can place stringent 3 upper limits on the EW of each line or doublet component in the range 2-7Å (Table 1).
-
•
A comparison with other high-redshift sources from the literature shows that our two BDF emitters have lower CIII] emission than expected on the basis of the average correlation between the Ly and CIII] EWs measured at lower redshifts, albeit they are consistent with being at the lower envelope of the measured distributions (Fig. 1).
-
•
Although an AGN contribution cannot be completely ruled out, the constraints on the CIV(EW) and the flux ratio (Fig. 2) show that the objects are only marginally consistent with them being AGN when compared to known Type II QSOs at lower redshifts. Consistently, when comparing limits on HeII(EW) and CIV(EW) to narrow line AGN models by Feltre et al. (2016) we can exclude pure AGN (100%) templates at . Instead, models with a 40% AGN contribution could be compatible with the observations (Fig. 3).
-
•
A spectro-photometric fit on the available data indicate that the two objects are relatively young (20-30 Myrs) and metal-poor () with stellar masses of a few (Table 2). Most importantly, we find a production rate of hydrogen ionizing photons per intrinsic UV luminosity of log(/Hz erg-1)=25.02-25.26 (under the assumption of a purely stellar origin), which is consistent with the value typically found in high-redshift populations, but significantly lower than the extreme values (25.6-25.7) measured in 7 galaxies with CIII] detection (Stark et al., 2015b) or with evidence of strong optical emission lines from their mid-IR photometry (Stark et al., 2017).
-
•
The range of physical parameters allowed by the spectro-photometric fit does not allow the BDF pair to reionize their surroundings by themselves with a low or even a moderate escape fraction of ionizing photons, as they would require extremely high =40% and age larger than 200 Myr (formation redshift 9) (Fig. 4).
The results summarised above indicate that the two emitters are typical high-redshift sources with no peculiar ionizing capabilities, either due to their stellar populations or to a significant contribution from AGN emission. The low metal line emission and the moderate are likely explained by a combination of low metallicity and the galaxies being caught in a quiet phase of star-formation activity. In addition, the lack of a significant AGN contribution is not surprising in the light of theoretical predictions showing a dominant contribution from star-formation to the UV emission of bright high-redshift galaxies (Piana et al., 2022). Most importantly for our purposes, it is unlikely that they are solely responsible of the growth of the ionized bubble. Instead, a dominant contribution to the local reionization history can be provided by the overdensity of faint galaxies.
These findings allow us to draw a plan for future observations capable of fully constraining the properties of this remarkable region. As of today, the most important missing ingredient to confirm that the faint galaxies in the overdensity reionized the BDF region is their spectroscopic confirmation. Given the absence of strong Ly this is beyond the capabilities of ground-based telescopes, while attempting detection of submillimeter lines with ALMA in redshift scan mode would be exceedingly time consuming. However, spectroscopic confirmation is well within reach of the James Webb Space Telescope. Indeed, JWST-NIRSpec in 1.5 hours of integration time could detect [OIII] from all currently known candidates down to , while also fully constraining ionization state and metallicity of the LAEs through the detection of [OII] and H. In addition, JWST can extend the photometric mapping of the BDF in terms of area, depth and wavelength coverage to confirm the presence of an overdensity of LBGs down to fainter magnitudes. For example, 1-2 hours of NIRCam integration per filter can extended the constraints on the local UV LF down to , while covering the optical rest-frame wavelength range which is crucial to reject low redshift interlopers and constrain the spectral energy distributions.
Finally, a significant contribution to our understanding of the formation of reionized regions will be provided by objects beyond the limit that can be reached on blank fields such as the BDF, e.g. objects analogous to the 6 clustered ultra-faint dwarfs observed by Vanzella et al. (2019) (see also Vanzella et al., 2021b). In this respect, JWST surveys on lensed fields (Treu et al., 2017; Willott et al., 2017; Vanzella et al., 2021a) will provide crucial information, such as an accurate characterization of the faintest end of the UV LF and of its possible turn-over (e.g., Castellano et al., 2016b; Yue et al., 2018), and of the physical properties of high-redshift ultra-faint dwarfs (e.g., Vanzella et al., 2017a, b).
With the sample of candidate reionized regions steadily growing, the advent of JWST will enable a systematic investigation of the connection between the physical properties of high-redshift galaxies and the ionization state of the surrounding IGM, eventually providing an answer on which are the sources of reionization.
Acknowledgements.
Based on observations collected at the European Southern Observatory for Astronomical research in the Southern Hemisphere under ESO programme 0103.A-0710. We thank A. Feltre for the useful discussions and support on the use of the narrow-line AGN models. ECL acknowledges support of an STFC Webb Fellowship (ST/W001438/1). EV acknowledges funding from the INAF for “interventi aggiuntivi a sostegno della ricerca di main-stream” and PRIM-MIUR 2017WSCC32 “Zooming into dark matter and proto-galaxies with massive lensing clusters”. RA acknowledges support from ANID FONDECYT Regular Grant 1202007. PD and AH acknowledge support from the European Research Council’s starting grant ERC StG-717001 (“DELPHI”). PD acknowledges support from the NWO grant 016.VIDI.189.162 (“ODIN”) and the European Commission’s and University of Groningen’s CO-FUND Rosalind Franklin program. A. Ferrara and S. Carniani acknowledge support from the ERC Advanced Grant INTERSTELLAR H2020/740120. Partial support from the Carl Friedrich von Siemens-Forschungspreis der Alexander von Humboldt-Stiftung Research Award is kindly acknowledged. This research made use of the Matplotlib package111https://matplotlib.org/ (Hunter, 2007), of Astropy222http://www.astropy.org, a community-developed core Python package for Astronomy (Astropy Collaboration et al., 2013, 2018), and of the Specutils package333https://specutils.readthedocs.io/en/stable/.References
- Alexandroff et al. (2013) Alexandroff, R., Strauss, M. A., Greene, J. E., et al. 2013, MNRAS, 435, 3306
- Amorín et al. (2017) Amorín, R., Fontana, A., Pérez-Montero, E., et al. 2017, Nature Astronomy, 1, 0052
- Astropy Collaboration et al. (2018) Astropy Collaboration, Price-Whelan, A. M., Sipőcz, B. M., et al. 2018, AJ, 156, 123
- Astropy Collaboration et al. (2013) Astropy Collaboration, Robitaille, T. P., Tollerud, E. J., et al. 2013, A&A, 558, A33
- Bañados et al. (2018) Bañados, E., Venemans, B. P., Mazzucchelli, C., et al. 2018, Nature, 553, 473
- Berg et al. (2019) Berg, D. A., Erb, D. K., Henry, R. B. C., Skillman, E. D., & McQuinn, K. B. W. 2019, ApJ, 874, 93
- Boutsia et al. (2011) Boutsia, K., Grazian, A., Giallongo, E., et al. 2011, ApJ, 736, 41
- Bouwens et al. (2015a) Bouwens, R. J., Illingworth, G. D., Oesch, P. A., et al. 2015a, ApJ, 811, 140
- Bouwens et al. (2015b) Bouwens, R. J., Illingworth, G. D., Oesch, P. A., et al. 2015b, ApJ, 803, 34
- Bouwens et al. (2016) Bouwens, R. J., Smit, R., Labbé, I., et al. 2016, ApJ, 831, 176
- Bruzual & Charlot (2003) Bruzual, G. & Charlot, S. 2003, MNRAS, 344, 1000
- Cai et al. (2015) Cai, Z., Fan, X., Jiang, L., et al. 2015, ApJ, 799, L19
- Calabrò et al. (2017) Calabrò, A., Amorín, R., Fontana, A., et al. 2017, A&A, 601, A95
- Castellano et al. (2016a) Castellano, M., Dayal, P., Pentericci, L., et al. 2016a, ApJ, 818, L3
- Castellano et al. (2012) Castellano, M., Fontana, A., Grazian, A., et al. 2012, A&A, 540, A39
- Castellano et al. (2010) Castellano, M., Fontana, A., Paris, D., et al. 2010, A&A, 524, A28
- Castellano et al. (2018) Castellano, M., Pentericci, L., Vanzella, E., et al. 2018, ApJ, 863, L3
- Castellano et al. (2016b) Castellano, M., Yue, B., Ferrara, A., et al. 2016b, ApJ, 823, L40
- Chabrier (2003) Chabrier, G. 2003, PASP, 115, 763
- Charlot & Fall (2000) Charlot, S. & Fall, S. M. 2000, ApJ, 539, 718
- Chevallard & Charlot (2016) Chevallard, J. & Charlot, S. 2016, MNRAS, 462, 1415
- Chevallard et al. (2018) Chevallard, J., Charlot, S., Senchyna, P., et al. 2018, MNRAS, 479, 3264
- Chevallard et al. (2013) Chevallard, J., Charlot, S., Wandelt, B., & Wild, V. 2013, MNRAS, 432, 2061
- Choudhury et al. (2009) Choudhury, T. R., Haehnelt, M. G., & Regan, J. 2009, MNRAS, 394, 960
- Cupani et al. (2020) Cupani, G., D’Odorico, V., Cristiani, S., et al. 2020, in Society of Photo-Optical Instrumentation Engineers (SPIE) Conference Series, Vol. 11452, Society of Photo-Optical Instrumentation Engineers (SPIE) Conference Series, 114521U
- Curtis-Lake et al. (2021) Curtis-Lake, E., Chevallard, J., Charlot, S., & Sandles, L. 2021, MNRAS, 503, 4855
- Dayal & Ferrara (2018) Dayal, P. & Ferrara, A. 2018, Phys. Rep, 780, 1
- Dayal et al. (2009) Dayal, P., Ferrara, A., Saro, A., et al. 2009, MNRAS, 400, 2000
- Dayal et al. (2011) Dayal, P., Maselli, A., & Ferrara, A. 2011, MNRAS, 410, 830
- Dayal et al. (2020) Dayal, P., Volonteri, M., Choudhury, T. R., et al. 2020, MNRAS, 495, 3065
- de Barros et al. (2016) de Barros, S., Vanzella, E., Amorín, R., et al. 2016, A&A, 585, A51
- Dijkstra (2019) Dijkstra, M. 2019, Saas-Fee Advanced Course, 46, 1
- Duncan & Conselice (2015) Duncan, K. & Conselice, C. J. 2015, MNRAS, 451, 2030
- Endsley & Stark (2021) Endsley, R. & Stark, D. P. 2021, arXiv e-prints, arXiv:2112.14779
- Endsley et al. (2022) Endsley, R., Stark, D. P., Bouwens, R. J., et al. 2022, arXiv e-prints, arXiv:2202.01219
- Endsley et al. (2021a) Endsley, R., Stark, D. P., Charlot, S., et al. 2021a, MNRAS, 502, 6044
- Endsley et al. (2021b) Endsley, R., Stark, D. P., Chevallard, J., & Charlot, S. 2021b, MNRAS, 500, 5229
- Fan et al. (2002) Fan, X., Narayanan, V. K., Strauss, M. A., et al. 2002, AJ, 123, 1247
- Feltre et al. (2016) Feltre, A., Charlot, S., & Gutkin, J. 2016, MNRAS, 456, 3354
- Ferland et al. (2013) Ferland, G. J., Porter, R. L., van Hoof, P. A. M., et al. 2013, Revista Mexicana de Astronomía y Astrofísica, 49, 137
- Finkelstein et al. (2019) Finkelstein, S. L., D’Aloisio, A., Paardekooper, J.-P., et al. 2019, ApJ, 879, 36
- Flury et al. (2022) Flury, S. R., Jaskot, A. E., Ferguson, H. C., et al. 2022, arXiv e-prints, arXiv:2201.11716
- Fontana et al. (2010) Fontana, A., Vanzella, E., Pentericci, L., et al. 2010, ApJ, 725, L205
- Giallongo et al. (2015) Giallongo, E., Grazian, A., Fiore, F., et al. 2015, A&A, 578, A83
- Grazian et al. (2017) Grazian, A., Giallongo, E., Paris, D., et al. 2017, A&A, 602, A18
- Greig & Mesinger (2017) Greig, B. & Mesinger, A. 2017, MNRAS, 465, 4838
- Gutkin et al. (2016) Gutkin, J., Charlot, S., & Bruzual, G. 2016, MNRAS, 462, 1757
- Hainline et al. (2011) Hainline, K. N., Shapley, A. E., Greene, J. E., & Steidel, C. C. 2011, ApJ, 733, 31
- Harikane et al. (2021) Harikane, Y., Ono, Y., Ouchi, M., et al. 2021, arXiv e-prints, arXiv:2108.01090
- Harikane et al. (2018) Harikane, Y., Ouchi, M., Shibuya, T., et al. 2018, ApJ, 859, 84
- Higuchi et al. (2019) Higuchi, R., Ouchi, M., Ono, Y., et al. 2019, ApJ, 879, 28
- Humphrey et al. (2008) Humphrey, A., Villar-Martín, M., Vernet, J., et al. 2008, MNRAS, 383, 11
- Hunter (2007) Hunter, J. D. 2007, Computing in Science and Engineering, 9, 90
- Hutchison et al. (2019) Hutchison, T. A., Papovich, C., Finkelstein, S. L., et al. 2019, ApJ, 879, 70
- Hutter et al. (2015) Hutter, A., Dayal, P., & Müller, V. 2015, MNRAS, 450, 4025
- Hutter et al. (2021) Hutter, A., Dayal, P., Yepes, G., et al. 2021, MNRAS, 503, 3698
- Ishigaki et al. (2018) Ishigaki, M., Kawamata, R., Ouchi, M., et al. 2018, ApJ, 854, 73
- Izotov et al. (2018a) Izotov, Y. I., Schaerer, D., Worseck, G., et al. 2018a, MNRAS, 474, 4514
- Izotov et al. (2018b) Izotov, Y. I., Worseck, G., Schaerer, D., et al. 2018b, MNRAS, 478, 4851
- Jiang et al. (2021a) Jiang, L., Kashikawa, N., Wang, S., et al. 2021a, Nature Astronomy, 5, 256
- Jiang et al. (2021b) Jiang, L., Kashikawa, N., Wang, S., et al. 2021b, Nature Astronomy, 5, 256
- Jung et al. (2021) Jung, I., Papovich, C., Finkelstein, S. L., et al. 2021, arXiv e-prints, arXiv:2111.14863
- Kennicutt (1998) Kennicutt, Jr., R. C. 1998, ARA&A, 36, 189
- Lam et al. (2019) Lam, D., Bouwens, R. J., Labbé, I., et al. 2019, A&A, 627, A164
- Laporte et al. (2017) Laporte, N., Nakajima, K., Ellis, R. S., et al. 2017, ApJ, 851, 40
- Le Fèvre et al. (2019) Le Fèvre, O., Lemaux, B. C., Nakajima, K., et al. 2019, A&A, 625, A51
- Lehnert & Bremer (2003) Lehnert, M. D. & Bremer, M. 2003, ApJ, 593, 630
- Lemaux et al. (2009) Lemaux, B. C., Lubin, L. M., Sawicki, M., et al. 2009, ApJ, 700, 20
- Lenz & Ayres (1992) Lenz, D. D. & Ayres, T. R. 1992, PASP, 104, 1104
- Leonova et al. (2021) Leonova, E., Oesch, P. A., Qin, Y., et al. 2021, arXiv e-prints, arXiv:2112.07675
- Livermore et al. (2017) Livermore, R. C., Finkelstein, S. L., & Lotz, J. M. 2017, ApJ, 835, 113
- Llerena et al. (2021) Llerena, M., Amorín, R., Cullen, F., et al. 2021, arXiv e-prints, arXiv:2107.00660
- Madau et al. (1999) Madau, P., Haardt, F., & Rees, M. J. 1999, ApJ, 514, 648
- Mainali et al. (2017) Mainali, R., Kollmeier, J. A., Stark, D. P., et al. 2017, ApJ, 836, L14
- Mainali et al. (2018) Mainali, R., Zitrin, A., Stark, D. P., et al. 2018, MNRAS, 479, 1180
- Maiolino et al. (2015) Maiolino, R., Carniani, S., Fontana, A., et al. 2015, MNRAS, 452, 54
- Malhotra & Rhoads (2006) Malhotra, S. & Rhoads, J. E. 2006, ApJ, 647, L95
- Marchi et al. (2017) Marchi, F., Pentericci, L., Guaita, L., et al. 2017, A&A, 601, A73
- Marchi et al. (2019) Marchi, F., Pentericci, L., Guaita, L., et al. 2019, A&A, 631, A19
- Mason et al. (2019) Mason, C. A., Fontana, A., Treu, T., et al. 2019, MNRAS, 485, 3947
- Mason et al. (2018) Mason, C. A., Treu, T., de Barros, S., et al. 2018, ApJ, 857, L11
- Mitra et al. (2015) Mitra, S., Choudhury, T. R., & Ferrara, A. 2015, MNRAS, 454, L76
- Mitra et al. (2018) Mitra, S., Choudhury, T. R., & Ferrara, A. 2018, MNRAS, 473, 1416
- Modigliani et al. (2010) Modigliani, A., Goldoni, P., Royer, F., et al. 2010, in Society of Photo-Optical Instrumentation Engineers (SPIE) Conference Series, Vol. 7737, Observatory Operations: Strategies, Processes, and Systems III, ed. D. R. Silva, A. B. Peck, & B. T. Soifer, 773728
- Naidu et al. (2022) Naidu, R. P., Matthee, J., Oesch, P. A., et al. 2022, MNRAS, 510, 4582
- Naidu et al. (2017) Naidu, R. P., Oesch, P. A., Reddy, N., et al. 2017, ApJ, 847, 12
- Nakajima et al. (2016) Nakajima, K., Ellis, R. S., Iwata, I., et al. 2016, ApJ, 831, L9
- Nakajima et al. (2018a) Nakajima, K., Fletcher, T., Ellis, R. S., Robertson, B. E., & Iwata, I. 2018a, MNRAS, 477, 2098
- Nakajima et al. (2018b) Nakajima, K., Schaerer, D., Le Fèvre, O., et al. 2018b, A&A, 612, A94
- Oesch et al. (2018) Oesch, P. A., Bouwens, R. J., Illingworth, G. D., Labbé, I., & Stefanon, M. 2018, ApJ, 855, 105
- Oesch et al. (2016) Oesch, P. A., Brammer, G., van Dokkum, P. G., et al. 2016, ApJ, 819, 129
- Oke & Gunn (1983) Oke, J. B. & Gunn, J. E. 1983, ApJ, 266, 713
- Ono et al. (2012) Ono, Y., Ouchi, M., Mobasher, B., et al. 2012, ApJ, 744, 83
- Pahl et al. (2021) Pahl, A. J., Shapley, A., Steidel, C. C., Chen, Y., & Reddy, N. A. 2021, MNRAS, 505, 2447
- Pallottini et al. (2019) Pallottini, A., Ferrara, A., Decataldo, D., et al. 2019, MNRAS, 487, 1689
- Pentericci et al. (2011) Pentericci, L., Fontana, A., Vanzella, E., et al. 2011, ApJ, 743, 132
- Pentericci et al. (2018) Pentericci, L., McLure, R. J., Garilli, B., et al. 2018, A&A, 616, A174
- Pentericci et al. (2014) Pentericci, L., Vanzella, E., Fontana, A., et al. 2014, ApJ, 793, 113
- Piana et al. (2022) Piana, O., Dayal, P., & Choudhury, T. R. 2022, MNRAS, 510, 5661
- Planck Collaboration et al. (2020) Planck Collaboration, Aghanim, N., Akrami, Y., et al. 2020, A&A, 641, A6
- Rigby et al. (2015) Rigby, J. R., Bayliss, M. B., Gladders, M. D., et al. 2015, ApJ, 814, L6
- Robertson et al. (2015) Robertson, B. E., Ellis, R. S., Furlanetto, S. R., & Dunlop, J. S. 2015, ApJ, 802, L19
- Rodríguez Espinosa et al. (2021) Rodríguez Espinosa, J. M., Mas-Hesse, J. M., & Calvi, R. 2021, MNRAS, 503, 4242
- Romanello et al. (2021) Romanello, M., Menci, N., & Castellano, M. 2021, Universe, 7, 365
- Schenker et al. (2012) Schenker, M. A., Stark, D. P., Ellis, R. S., et al. 2012, ApJ, 744, 179
- Schmidt et al. (2017) Schmidt, K. B., Huang, K. H., Treu, T., et al. 2017, ApJ, 839, 17
- Schmidt et al. (2021) Schmidt, K. B., Kerutt, J., Wisotzki, L., et al. 2021, A&A, 654, A80
- Shapiro & Giroux (1987) Shapiro, P. R. & Giroux, M. L. 1987, ApJ, 321, L107
- Shibuya et al. (2018) Shibuya, T., Ouchi, M., Harikane, Y., et al. 2018, PASJ, 70, S15
- Shivaei et al. (2018) Shivaei, I., Reddy, N. A., Siana, B., et al. 2018, ApJ, 855, 42
- Sobacchi & Mesinger (2015) Sobacchi, E. & Mesinger, A. 2015, MNRAS, 453, 1843
- Sobral & Matthee (2019) Sobral, D. & Matthee, J. 2019, A&A, 623, A157
- Stark et al. (2017) Stark, D. P., Ellis, R. S., Charlot, S., et al. 2017, MNRAS, 464, 469
- Stark et al. (2010) Stark, D. P., Ellis, R. S., Chiu, K., Ouchi, M., & Bunker, A. 2010, MNRAS, 408, 1628
- Stark et al. (2015a) Stark, D. P., Richard, J., Charlot, S., et al. 2015a, MNRAS, 450, 1846
- Stark et al. (2014) Stark, D. P., Richard, J., Siana, B., et al. 2014, MNRAS, 445, 3200
- Stark et al. (2015b) Stark, D. P., Walth, G., Charlot, S., et al. 2015b, MNRAS, 454, 1393
- Steidel et al. (2018) Steidel, C. C., Bogosavljević, M., Shapley, A. E., et al. 2018, ApJ, 869, 123
- Tang et al. (2019) Tang, M., Stark, D. P., Chevallard, J., & Charlot, S. 2019, MNRAS, 489, 2572
- Tilvi et al. (2020) Tilvi, V., Malhotra, S., Rhoads, J. E., et al. 2020, ApJ, 891, L10
- Tilvi et al. (2016) Tilvi, V., Pirzkal, N., Malhotra, S., et al. 2016, ApJ, 827, L14
- Topping et al. (2021) Topping, M. W., Shapley, A. E., Stark, D. P., et al. 2021, ApJ, 917, L36
- Trebitsch et al. (2021) Trebitsch, M., Dubois, Y., Volonteri, M., et al. 2021, A&A, 653, A154
- Treu et al. (2012) Treu, T., Trenti, M., Stiavelli, M., Auger, M. W., & Bradley, L. D. 2012, ApJ, 747, 27
- Treu et al. (2017) Treu, T. L., Abramson, L. E., Bradac, M., et al. 2017, Through the Looking GLASS: A JWST Exploration of Galaxy Formation and Evolution from Cosmic Dawn to Present Day, JWST Proposal ID 1324. Cycle 0 Early Release Science
- Vanzella et al. (2021a) Vanzella, E., Adamo, A., Annibali, F., et al. 2021a, Constraining the nature of the first stellar complexes: globular cluster precursors and Population III stellar clusters at z 6-7, JWST Proposal. Cycle 1
- Vanzella et al. (2019) Vanzella, E., Calura, F., Meneghetti, M., et al. 2019, MNRAS, 483, 3618
- Vanzella et al. (2017a) Vanzella, E., Calura, F., Meneghetti, M., et al. 2017a, MNRAS, 467, 4304
- Vanzella et al. (2020) Vanzella, E., Caminha, G. B., Calura, F., et al. 2020, MNRAS, 491, 1093
- Vanzella et al. (2021b) Vanzella, E., Caminha, G. B., Rosati, P., et al. 2021b, A&A, 646, A57
- Vanzella et al. (2017b) Vanzella, E., Castellano, M., Meneghetti, M., et al. 2017b, ApJ, 842, 47
- Vanzella et al. (2016) Vanzella, E., de Barros, S., Vasei, K., et al. 2016, ApJ, 825, 41
- Vanzella et al. (2018) Vanzella, E., Nonino, M., Cupani, G., et al. 2018, MNRAS, 476, L15
- Vanzella et al. (2011) Vanzella, E., Pentericci, L., Fontana, A., et al. 2011, ApJ, 730, L35+
- Vidal-García et al. (2017) Vidal-García, A., Charlot, S., Bruzual, G., & Hubeny, I. 2017, MNRAS, 470, 3532
- Watson et al. (2015) Watson, D., Christensen, L., Knudsen, K. K., et al. 2015, Nature, 519, 327
- Willott et al. (2017) Willott, C. J., Abraham, R. G., Albert, L., et al. 2017, CANUCS: The CAnadian NIRISS Unbiased Cluster Survey, JWST Proposal. Cycle 1
- Wyithe & Loeb (2005) Wyithe, J. S. B. & Loeb, A. 2005, ApJ, 625, 1
- Yue et al. (2018) Yue, B., Castellano, M., Ferrara, A., et al. 2018, ApJ, 868, 115
Appendix A Observed spectra