High-density disc reflection spectroscopy of low-mass active galactic nuclei
Abstract
The standard alpha-disc model predicts an anti-correlation between the density of the inner accretion disc and the black hole mass times square of the accretion rate, as seen in higher mass () active galactic nuclei (AGNs). In this work, we test the predictions of the alpha-disc model and study the properties of the inner accretion flow for the low-mass end () of AGNs. We utilize a new high-density disc reflection model where the density parameter varies from to cm-3 and apply it to the broadband X-ray (0.310 keV) spectra of the low-mass AGN sample. The sources span a wide range of Eddington fractions and are consistent with being sub-Eddington or near-Eddington. The X-ray spectra reveal a soft X-ray excess below which is well modeled by high-density reflection from an ionized accretion disc of density cm-3 on average. The results suggest a radiation pressure-dominated disc with an average of 70 per cent fraction of the disc power transferred to the corona, consistent with that observed in higher mass AGNs. We show that the disc density higher than cm-3 can result from the radiation pressure compression when the disc surface does not hold a strong magnetic pressure gradient. We find tentative evidence for a drop in black hole spin at low-mass regimes.
keywords:
black hole physics – relativistic processes – accretion, accretion discs – galaxies: active – galaxies: nuclei – X-rays: galaxies.1 Introduction
Active galactic nuclei (AGNs) are luminous nuclear sources powered by the accretion of matter from the host galaxy (see e.g. Storchi-Bergmann & Schnorr-Múller 2019) onto a supermassive black hole (SMBH; Lynden-Bell 1969; Rees 1984) of mass (see Reines et al. 2013; Baldassare et al. 2015; The Event Horizon Telescope Collaboration et al. 2019). They are characterized by complex spatial and time-variable emission observed over the entire electromagnetic spectrum, from very high energy gamma-rays to radio wavebands. The X-ray energy band provides a unique window as the X-ray photons come from the immediate vicinity of the central SMBH and help us probe the extreme gravity just outside the event horizon of the black hole (e.g. Fabian et al. 1989, 2002; Wilkins et al. 2021). We can characterize black holes fundamentally by two parameters: mass and spin, which play a crucial role in understanding the physical nature of the AGN central engine and the cosmological evolution of galaxies which is directly associated with the energy output from the SMBHs (e.g. Fabian 2012; Kormendy & Ho 2013). However, most of our knowledge on the physical processes occurring in the AGN central engine is confined to active galaxies hosting SMBHs of mass greater than . The low-mass end () of AGNs is a less explored, yet intriguing domain that serves as the missing link to probe whether the accretion process is the same at all mass scales. The least massive AGNs can play a significant role in probing the nature of primordial SMBHs, which are crucial to constrain the cosmological black hole growth models.
X-ray spectroscopy is a powerful tool to probe strong-field accretion in the innermost regions of the AGN central engine. It allows us to determine the physical conditions of the plasma surrounding the central X-ray source. The properties of the inner accretion discs of AGNs are measured through X-ray reflection spectra, which show a soft X-ray excess below keV, a broad emission profile due to Fe K lines at keV, and Compton hump above 10 keV (e.g. Marinucci et al. 2014; Matt et al. 2014; Zoghbi et al. 2015; García et al. 2019; Xu et al. 2021). The physical modeling of these features provides direct probes for the inner disc atmosphere and black hole spin (e.g. Brenneman & Reynolds 2006; Walton et al. 2013; García et al. 2014; Reynolds 2019, 2021; Bambi et al. 2021), the measurement of which is essential to study the cosmic evolution of spin and the long-term growth of black holes (e.g. Volonteri et al. 2013).
Traditional reflection models assume that the density of the disc atmosphere is constant and fixed at cm-3 (e.g. Ross & Fabian 1993, 2005; García et al. 2013, 2014). These constant density disc reflection models work well for high-mass () black holes and higher accretion rates. However, the standard Shakura & Sunyaev (1973) (hereafter SS73) disc model predicts that the density of the inner accretion disc is likely to be higher than cm-3 for lower-mass () SMBHs and stellar-mass BH X-ray binaries (BHXRBs). The theoretical calculations of Svensson & Zdziarski (1994) (hereafter SZ94) reveal that the inner disc density is even higher than that predicted from the SS73 disc model if we consider the fraction of the transferred power from the accretion disc into the corona. García et al. (2016) investigated the effects of the gas density on the X-ray reflection spectra and provided a model (relxillD) where the density is a free parameter varying from to cm-3. High-density disc reflection models successfully explain the soft X-ray excess, broad Fe K emission line, and Compton hump in low-mass () AGNs (e.g. Mallick et al. 2018; Jiang et al. 2018). Some studies challenge the constant density ( cm-3) disc reflection origin of the soft excess and prefer an additional warm Comptonization component (e.g. Mallick et al. 2017; Porquet et al. 2018; Petrucci et al. 2018). Application of the variable density reflection model to the X-ray spectra of several AGNs (e.g. Jiang et al. 2019; García et al. 2019; Xu et al. 2021) and XRBs (e.g. Tomsick et al. 2018; Jiang et al. 2020) has lately become more prevalent.
In this paper, we apply our recently developed variable density (/cm-3]) reflection model to the broad-band (0.3–10 keV) X-ray spectra of a sample of low-mass () AGNs, study their spectral properties and compare them with higher mass AGNs from the literature. Miniutti et al. (2009) and Ludlam et al. (2015) studied some of these sources and detected a soft X-ray excess which was modeled by a blackbody component. The detection of soft X-ray reverberation time lags in some of these low-mass AGNs (Mallick et al., 2021) is the strongest supporting evidence for the reflection origin of the soft X-ray excess.
We organize the paper as follows. In Section 2, we describe the details of the sample and data reduction techniques. In Section 3, we perform the spectral analysis of the low-mass AGN sample using the variable density reflection model. We interpret the results of the spectral modeling and compare the measured accretion properties of the sample with their higher mass counterparts in Section 4. We conclude the results in Section 5. Finally, we outline the future work in Section 6.
2 Sample selection and data reduction
To study the accretion properties of the low-mass AGN end, we obtained a sample of the least massive AGNs from the Greene & Ho (2007) (hereafter GH07) catalog and one AGN, POX 52, from Barth et al. (2004), with central BH masses of . We searched the XMM-Newton (Jansen et al., 2001) archive and found that a total of 29 AGNs from the sample are present in the field of view of the European Photon Imaging Camera (EPIC).
We reduced all the available observations in the Scientific Analysis System (SAS v.18.0.0) with the most recent (as of 2021 February) calibration files. We generated raw event files by processing the EPIC pn and MOS data with the SAS tasks EPPROC and EMPROC, respectively. To filter the raw EPIC pn and MOS events, we employed PATTERN4 and PATTERN12, respectively, and removed bad pixel events with FLAG0. We produced flare-filtered clean event files by excluding the proton flare intervals using the method described in Mallick et al. (2021). We confirmed the absence of any pile-up effects using the task EPATPLOT. We extracted the source and background spectra from a circular region centered on the source and nearby source-free zone of radius 20 arcsec and 40 arcsec, respectively. The RMF (Redistribution Matrix File) and ARF (Ancillary Response File) for each observation were generated with the SAS tasks RMFGEN and ARFGEN, respectively. We then grouped the spectral data to have a minimum of 10 counts per bin and to oversample by at most a factor of 3 using the SPECGROUP task. We excluded sources that do not have EPIC-pn counts above 4 keV after background subtraction. To obtain a clear view of the central engine, we selected only Seyfert 1 class AGNs. These criteria resulted in a final sample of 13 AGNs. The observation log and source properties are presented in Table 1 and Table 2, respectively.
| Source Name [Short] | RA | DEC | Obs. ID | Start date | Net total | Net source count |
|---|---|---|---|---|---|---|
| (Deg) | (Deg) | (yyyy-mm-dd) | exp. (ks) | rate (ct/s) | ||
| (1) | (2) | (3) | (4) | (5) | (6) | (7) |
| SDSS J010712.03140844.9 [J0107] | 16.800 | 14.146 | 0305920101 | 2005-07-22 | 68.8 | 0.33 |
| SDSS J022849.51090153.7 [J0228] | 37.206 | 9.032 | 0674810101 | 2012-01-17 | 28.5 | 0.24 |
| SDSS J094057.19032401.2 [J0940] | 145.238 | 3.400 | 0306050201 | 2005-10-30 | 72.8 | 0.27 |
| SDSS J102348.44040553.7 [J1023] | 155.952 | 4.098 | 0108670101 | 2000-12-05 | 148.3 | 0.08 |
| 0605540201 | 2009-12-13 | 306.6 | 0.11 | |||
| 0605540301 | 2009-05-08 | 129.1 | 0.08 | |||
| SDSS J114008.71030711.4 [J1140] | 175.036 | 3.120 | 0305920201 | 2005-12-03 | 111.9 | 0.72 |
| 0724840101 | 2013-12-18 | 110.6 | 0.33 | |||
| 0724840301 | 2014-01-01 | 146.3 | 0.64 | |||
| SDSS J134738.23474301.9 [J1347] | 206.909 | 47.717 | 0744220701 | 2014-11-22 | 72.1 | 0.59 |
| SDSS J135724.52652505.8 [J1357] | 209.352 | 65.418 | 0305920601 | 2005-06-23 | 40.3 | 0.48 |
| SDSS J143450.62033842.5 [J1434] | 218.711 | 3.645 | 0305920401 | 2005-08-18 | 61.5 | 0.13 |
| 0674810501 | 2011-08-16 | 35.4 | 0.13 | |||
| SDSS J154150.85310037.2 [J1541] | 235.462 | 31.010 | 0744220401 | 2015-01-31 | 30.3 | 0.33 |
| SDSS J155909.62350147.4 [J1559] | 239.790 | 35.030 | 0744290101 | 2015-03-02 | 204.5 | 2.7 |
| 0744290201 | 2015-02-24 | 236.3 | 2.5 | |||
| SDSS J162636.40350242.0 [J1626] | 246.652 | 35.045 | 0674811001 | 2012-01-17 | 30.1 | 0.11 |
| SDSS J163159.59243740.2 [J1631] | 247.998 | 24.628 | 0674810601 | 2011-08-28 | 39.1 | 0.07 |
| POX52 | 180.737 | 20.934 | 0302420101 | 2005-07-08 | 245.4 | 0.07 |
| Source | Optical | () | () | |||||
|---|---|---|---|---|---|---|---|---|
| () | Type | (1020 cm-2) | (eV) | (eV) | (eV) | |||
| (1) | (2) | (3) | (4) | (5) | (6) | (7) | (8) | (9) |
| J0107 | 0.0767 | 16.0 | 0.40 | NLSy1 | 3.94 | 29.5 | 58.6 | 186 |
| J0228 | 0.0722 | 3.2 | 0.25 | BLSy1 | 3.88 | 39.3 | 78.1 | 151 |
| J0940 | 0.0606 | 16.0 | 0.40 | NLSy1 | 3.73 | 29.5 | 58.6 | 150 |
| J1023 | 0.0989 | 5.0 | 0.50 | NLSy1 | 2.9 | 41.7 | 82.7 | 156 |
| J1140 | 0.081 | 12.6 | 0.63 | NLSy1 | 2.06 | 35.0 | 69.6 | 170 |
| J1347 | 0.0643 | 10.0 | 0.50 | NLSy1 | 1.9 | 35.0 | 69.6 | 166 |
| J1357 | 0.106 | 16.0 | 0.50 | NLSy1 | 1.45 | 31.2 | 62.0 | 150 |
| J1434 | 0.0283 | 6.3 | 0.10 | Sy1 | 2.76 | 26.3 | 52.2 | 173 |
| J1541 | 0.0684 | 16.0 | 0.25 | BLSy1 | 2.67 | 26.3 | 52.2 | 114 |
| J1559 | 0.031 | 16.0 | 0.63 | NLSy1 | 2.28 | 33.1 | 65.7 | 144 |
| J1626 | 0.0341 | 5.0 | 0.32 | Sy 1.5 | 1.52 | 37.1 | 73.7 | 103 |
| J1631 | 0.0433 | 6.3 | 0.32 | BLSy1 | 4.08 | 35.0 | 69.6 | 128 |
| POX52 | 0.021 | 3.2 | 0.35 | Sy 1.8 | 4.41 | 42.6 | 84.6 | 243 |
3 Variable density disc reflection Modeling
We explore our physically motivated variable density disc reflection model relxillDCp to study the broad-band (0.310 keV) X-ray spectra of the sample. The model allows a higher density for the accretion disc varying from to cm-3 and includes a Comptonization continuum (nthComp) with a variable coronal temperature as the incident spectrum instead of a simple power-law. The high-energy cutoff of the relxillDCp model is parameterized by the electron temperature () of the hot corona and spans within the range of 1–400 keV. This new version of the model will soon be included in the next official release of RELXILL v.1.5.0.
The spectral fitting was performed in the XSPEC (v.12.11.1) software (Arnaud, 1996). We employed C-stat (Cash, 1979) to find the best-fit values of the model parameters and -statistics to test the goodness-of-fit. All the reported errors are estimated through Markov Chain Monte Carlo (MCMC) simulations and correspond to the 90 per cent confidence intervals unless otherwise specified.
First, we fit the hard band (210 keV) continuum spectra with the phenomenological power-law (zpowerlw) model modified by the absorption due to the Galactic interstellar medium (ISM). We used the Tuebingen-Boulder ISM absorption model (Tbabs) to account for the Galactic absorption. The model considers the solar ISM abundances of Wilms et al. (2000) and the photoionization cross-section table of Verner et al. (1996). We employed the Galactic absorption column density () calculated by Willingale et al. (2013), which accounts for the column density of both the atomic () and molecular () hydrogen. The Galactic hydrogen column density () for each source, as listed in Table 2, was kept fixed throughout the spectral modeling. The absorbed power-law model describes the hard X-ray emission well for all AGNs except J1559 which showed a narrow Fe Kα emission line at 6.4 keV. The presence of a narrow Fe Kα line cannot be tested in most of the sources due to the low statistics. We modeled the Fe Kα emission profile of J1559 by a narrow Gaussian (zgauss) line with the width fixed at 10 eV. The addition of the narrow Gaussian line improved the test statistics by for 2 degrees of freedom. The significance of the emission line is per cent, estimated by the maximum likelihood ratio (MLR) test. We find that the hard X-ray spectrum of J1559 is well explained by an absorbed power-law model along with a narrow Fe Kα emission line. It is likely that any of these spectra do not have sufficient counts in the 2–10 keV band to significantly detect the broad Fe Kα emission line. A study by de la Calle Pérez et al (2010) demonstrated that at least hard X-ray (210 keV) counts are needed for a significant detection of the relativistic Fe Kα line in Type 1 AGNs.
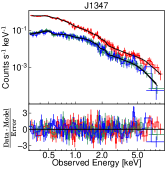
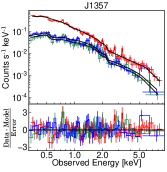
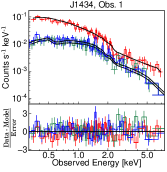
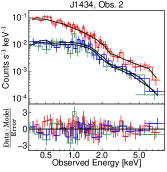
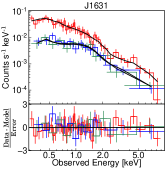
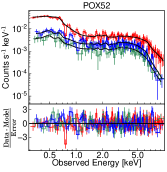
The extrapolation of the hard X-ray absorbed power-law model to the soft X-ray (0.32 keV) band revealed an excess emission component below keV for all the sources in the sample. However, we see an absorption curvature at around keV for POX 52, which could be a signature of partial covering absorption. The broad-band (0.310 keV) X-ray spectra, hard band (210 keV) best-fit extrapolated models (Tbabs[zgausszpowerlw] for J1559 and Tbabszpowerlw for all other sources), and residual plots for each observation are shown in Fig. A1. To fit the observed soft X-ray excess, we first use a simple disc blackbody (diskbb) model. We find that the temperature of the soft excess emission for the sample is in the range of keV, which is consistent with Type 1 class AGNs having a wide range of black hole mass (see Ludlam et al. 2015 for low-mass AGNs and Gierliński & Done 2004 for high-mass quasars). To verify whether the soft X-ray excess can be the direct thermal emission from the accretion disc in low-mass AGNs, we calculate the maximum temperature of the SS73 disc for both Schwarzschild () and maximally spinning () Kerr black holes. The effective temperature of thermal radiation from the disc atmosphere at radius is given by (see e.g. Reynolds 2021):
| (1) |
where is the central BH mass in units of , and is the Eddington ratio of the system, which are presented in Table 2, is the innermost stable circular orbit in units of , radiative efficiency is solely a function of spin and ranges from for to for . The disc temperature attains the maximum value at .
| (2) |
The temperature of the soft X-ray excess emission and the maximum temperature expected from the accretion disc for Schwarzschild () and maximally spinning () Kerr black holes are reported in Table 2. The temperature () of the thermal disc emission varies from 25 eV to 85 eV, with a median value of around 50 eV for the low-mass sample. On the other hand, the soft excess temperature () is found to be constant within the range of keV, which agrees with higher mass AGNs. Moreover, there is no correlation observed between the soft excess and disc peak temperature. We also verified that the high-energy tail of the standard disc emission does not contribute to the soft X-ray (0.3–2 keV) band for any of these AGNs. Therefore, the soft X-ray excess cannot be assigned to the direct thermal emission from the accretion disc for the sample.
| Source | |||||||
|---|---|---|---|---|---|---|---|
| ( erg s-1) | () | ||||||
| (1) | (2) | (3) | (4) | (5) | (6) | (7) | (8) |
| J0107 | 20 | 0.28 | |||||
| J0228 | 18 | 0.75 | |||||
| J0940 | 21 | 0.36 | |||||
| J1023 | 16 | 0.29 | |||||
| J1140 | 21 | 0.45 | |||||
| J1347 | 20 | 0.47 | |||||
| J1357 | 26 | 1.0 | |||||
| J1434 | 13 | 0.04 | |||||
| J1541 | 21 | 0.35 | |||||
| J1559 | 21 | 0.38 | |||||
| J1626 | 14 | 0.08 | |||||
| J1631 | 13 | 0.05 | |||||
| POX52 | 14 | 0.15 |
We then model the observed soft X-ray excess using the new variable density relativistic reflection model (relxillDCp), which assumes a sandwich configuration for corona that encircles the surrounding disc. The heating of the inner disc by coronal X-rays leads to quasi-thermal emission in the soft X-rays, which is fully represented by the high-density effects in the model (see García et al. 2016). As the density parameter is increased, the effective temperature of the reprocessed emission at soft energies increases, leading to a quasi-thermal emission component that appears in the soft band. The model adjusts the temperature of the reflector so that flux in equals flux out, and hence it does not require further thermalisation of the disc.
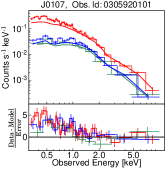
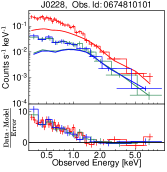
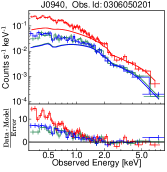
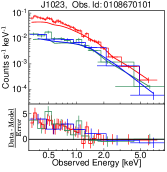
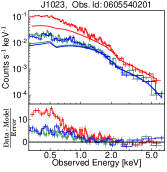
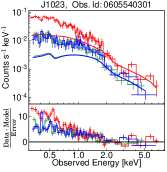
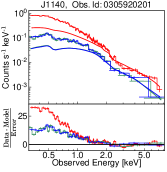
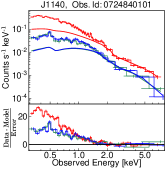
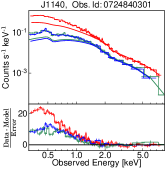
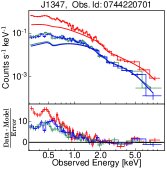
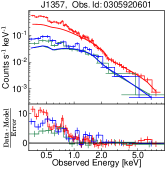
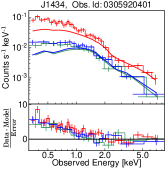
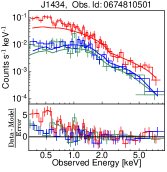
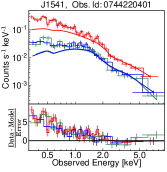
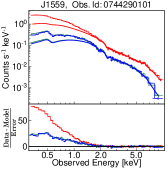
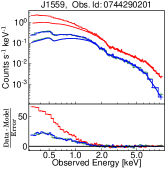
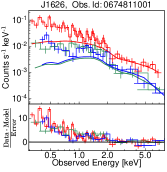
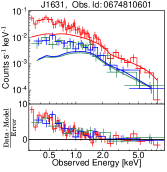
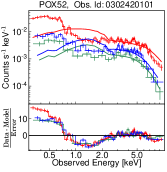
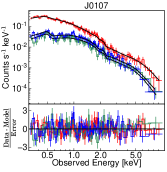
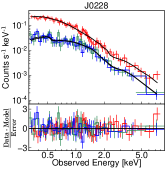
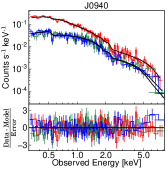
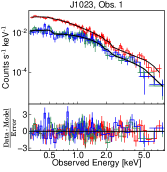
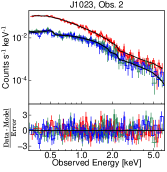
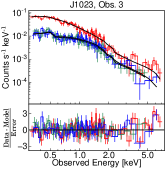
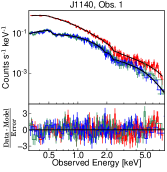
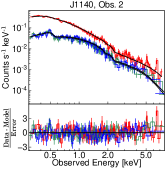
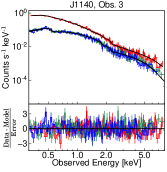
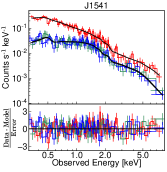
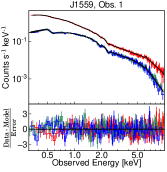
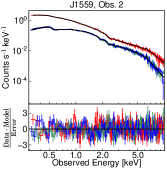
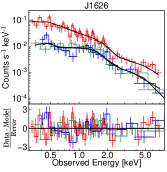
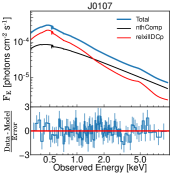
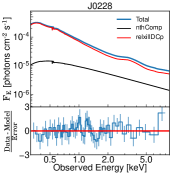
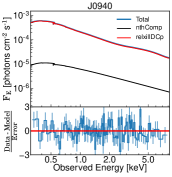
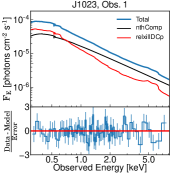
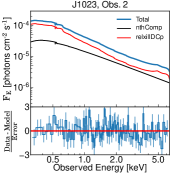
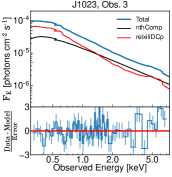
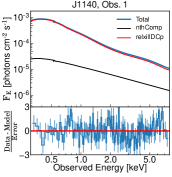
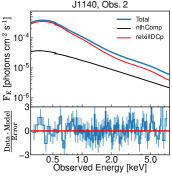
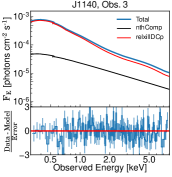
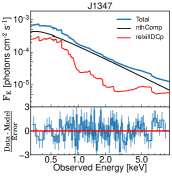
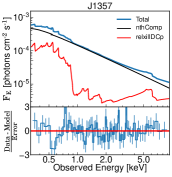
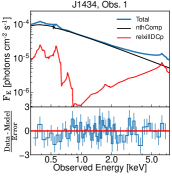
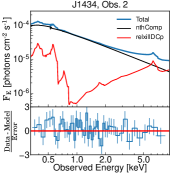
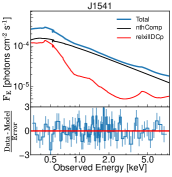
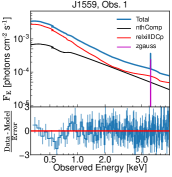
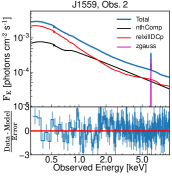
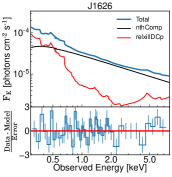
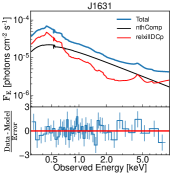
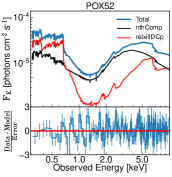
The relxillDCp model combines the ionized disc reflection code xillverDCp (García et al., 2013, 2016) with the convolution model relconv (Dauser et al, 2013). The relconv model determines the relativistic effects in the reflection spectrum and assumes a broken power-law emissivity profile for the illumination of the disc by an X-ray corona. The emissivity profile has the following form: for , and for , where and represent inner and outer emissivity indices, respectively, is the break radius, and are the inner and outer disc radii, respectively. The other parameters that characterize the disc reflection model are: black hole spin (), the inclination angle () of the disc to the observer, reflection fraction (reflfrac), iron abundance (), ionization state (), and number density () of electrons in the disc atmosphere. The disc irradiation profile is considered Newtonian over the outer regions of the disc, and hence we fixed the outer emissivity index at 3. We fixed the break radius at 6, which is a typical AGN coronal radius (e.g. Mallick et al. 2021; Wilkins & Fabian 2011). We assume the solar abundance of iron and fixed the inner and outer radii of the accretion disc at the innermost stable circular orbit () and 1000 (), respectively. We set reflfrac in the relxillDCp model to solely describe the disc reflection. Since relxillDCp considers the thermal Comptonization model nthComp (Zdziarski et al., 1996; Źycki et al., 1999) as the irradiating (primary) continuum, we replaced the zpowerlw continuum with nthComp. The slope of the nthComp and relxillDCp components are tied. The seed photon temperature in the nthComp model was set at the maximum possible disc temperature (see column (8) of Table 2) for each source. We fixed the electron temperature of the hot coronal plasma at a typical value of 100 keV. The relative strength of reflection was measured as a ratio of the disc reflected flux to the irradiating primary source flux in the 0.3–10 keV band. We find that the broad-band best-fit spectral model is Tbabs(relxillDCpnthComp) for all the sources in the sample, except for J1559 and POX 52. The source, J1559, showed an absorption feature at keV, which was modeled by a Gaussian absorption line gabs. The gabs component improves the fit statistic by for 3 free parameters. The expression for the broad-band best-fit model of J1559 is Tbabsgabs(zgaussrelxillDCpnthComp). To model the absorption curvature present in the keV band of POX 52, we included an ionized partial covering absorption component (zxipcf; Reeves et al. 2008). The zxipcf model has three free parameters: column density (), ionization state () of the absorbing medium and covering fraction (). The inclusion of the ionized absorption component provided an improvement of for 3 additional free parameters. The maximum likelihood ratio (MLR) test suggests that the zxipcf model component is per cent significant. The best-fit model for POX 52 has the following expression: Tbabszxipcf(relxillDCpnthComp). We find that the relativistic reflection from an ionized, higher density accretion disc can self-consistently explain the soft X-ray excess emission for the low-mass AGN sample. The best-fit unfolded spectral models, model components, and data-to-model ratio plots are shown in Fig. 1. We show the broad-band photon count spectra, best-fit models, and residuals plots in Fig. A2.
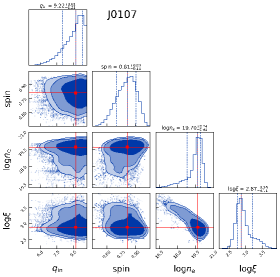
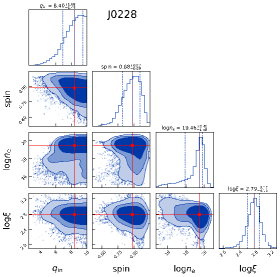
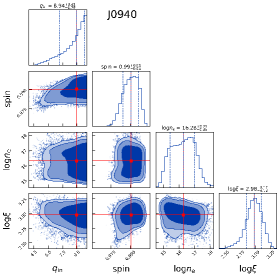
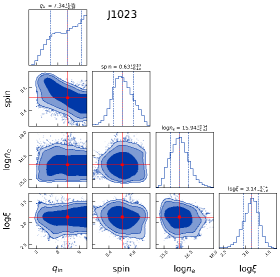
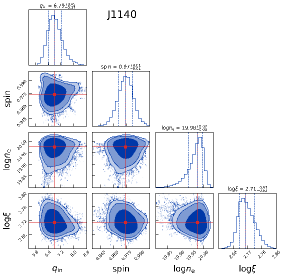
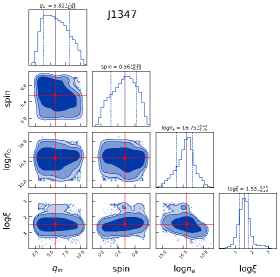
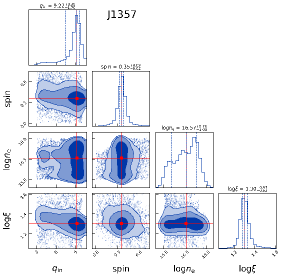
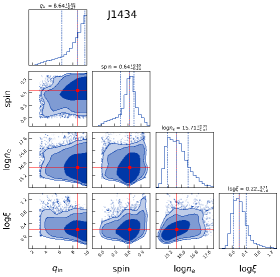
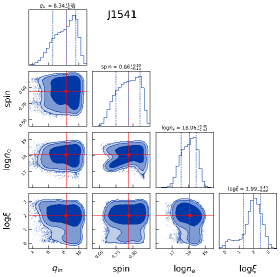
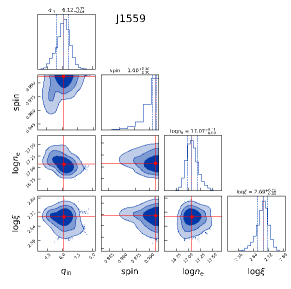
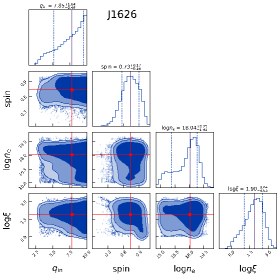
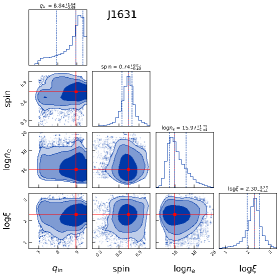
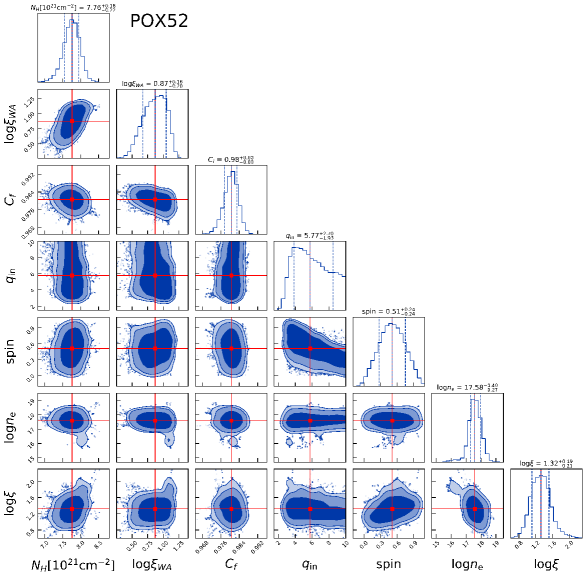
To check the robustness of the parameter measurements and determine the constraints on each free parameter, we conducted a Markov Chain Monte Carlo (MCMC) analysis utilizing the Goodman-Weare algorithm in XSPEC. We run the Markov Chain for 150000 iterations with 100 walkers. We burned the initial 50000 events to obtain a steady chain and used 100000 steady-state samples to determine the parameter distributions and their 90 per cent confidence intervals. We performed Gelman-Rubin’s MCMC convergence test and ensured that the chains have converged with the potential scale reduction factor below 1.2 for each parameter. The contour plots of various parameters infer that the parameter space is not degenerate (see Fig. A3. A4, A5). The best-fit spectral model parameters, their 90 per cent confidence intervals and fit statistics for the sample are presented in Table A1 and A2.
4 Results and Discussion
4.1 Eddington ratio and limit
We measured the Eddington ratio () of the sample through the bolometric correction factor, . The hard X-ray (210 keV) absorption corrected luminosity of the sample is found to be in the range of erg s-1. The average bolometric correction factor and associated uncertainties for each source were obtained from the bolometric correction factor vs. 2–10 keV luminosity curve (Hopkins et al., 2007; Vasudevan & Fabian, 2007). The measured Eddington ratio is in the range of , considering the uncertainties of the BH mass estimates. We then estimated the dimensionless mass accretion rate using the formula , where the radiative efficiency . The innermost stable circular orbit was computed using the equation (2) of Reynolds (2021). The mass accretion rate is below the Eddington accretion limit of for the sample except for J1357 which has (see Table 3). Therefore, we conclude that the discs of these low-mass AGNs are accumulating matter at sub-Eddington or near-Eddington accretion rates. The measurements are in agreement with the Eddington ratio estimated from the luminosity of the line for POX 52 (Thornton et al., 2008) and line for the GH07 sample. The hard band absorption-corrected source luminosity, bolometric correction factor, Eddington ratio, innermost stable circular orbit, radiative efficiency, accretion rate and Eddington limit for each AGN are presented in Table 3.
| Source | C.I.-MLR ( per cent) | C.I.-FTEST ( per cent) | |
|---|---|---|---|
| J0107 | 8.8 | 99.7 | 99.9 |
| J0228 | 3.0 | 91.8 | 96.1 |
| J0940 | 4.5 | 96.6 | 95.4 |
| J1023 | |||
| J1140 | 14.0 | 99.98 | 99.98 |
| J1347 | 16.5 | 99.99 | 99.99 |
| J1357 | |||
| J1434 | |||
| J1541 | 6.2 | 98.7 | 99.2 |
| J1559 | 23.5 | 99.99 | 99.99 |
| J1626 | |||
| J1631 | |||
| POX52 | 8.0 | 99.5 | 99.0 |
4.2 Disc gas density
We first verified the significance of higher disc densities by fitting all the spectra with a constant disc of density /cm, which resulted in a steeper photon index, higher disc ionization state, and worsened the statistics. The changes in the -statistics are quoted in Table 4. We excised five sources for which we only obtain an upper limit on the disc density. We then estimated the confidence levels by performing the maximum likelihood ratio (MLR) test and F-test. These tests suggest that a higher density disc is preferred for eight out of thirteen AGNs with per cent confidence.
According to SZ94, the density profile of electrons at the illuminated atmosphere of a radiation pressure-dominated disc in the SS73 model follows
| (3) |
The disc viscosity parameter is assumed to be 0.1 in the SS73 model; cm2 is the Thomson scattering cross section; is the disc radius in units of , where is the Schwarzschild radius; the inner disc radius is fixed at , the average of which is estimated to be for our sample; is the dimensionless mass accretion rate; is the fraction of the total power transported from the disc to the corona and ranges from 0 to 1.
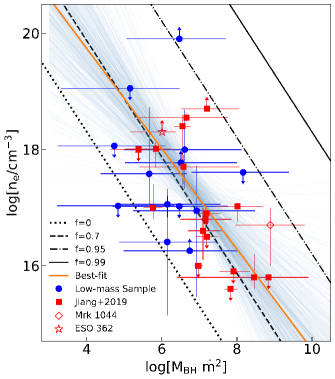
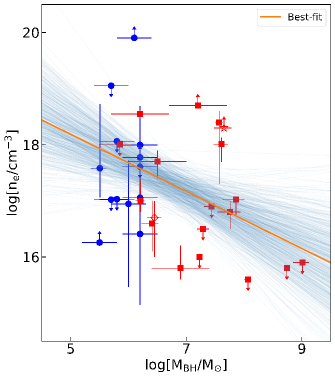
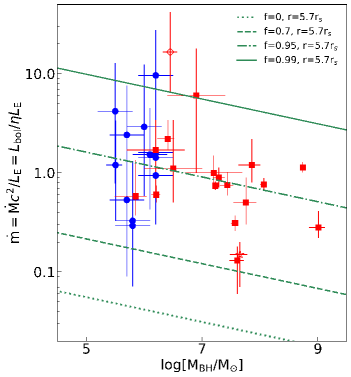
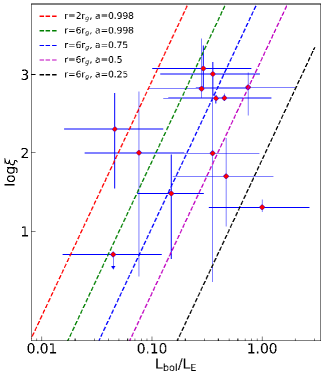
We assessed the SS73 disc model by exploring the possible correlation between the disc density and BH mass times the accretion rate squared (), as observed in higher mass AGNs (Jiang et al., 2019). We show the variation of with for the combined sample consisting of 13 AGNs from this work, 17 AGNs from Jiang et al. (2019), the Sy 1 galaxy Mrk 1044 from Mallick et al. (2018), and Sy 1.5 galaxy ESO 362G18 from Xu et al. (2021) in Figure 2 (top left). At the disc radius of , the solutions of the radiation pressure-dominated disc for , 0.7, 0.95, 0.99 are represented by the dotted, dashed, dash-dotted, and solid black lines, respectively. We observed a relatively strong anti-correlation between and for the combined sample with a Spearman correlation coefficient of and a p-value of . We then performed a linear regression analysis using a Bayesian method which accounts for errors both in the independent and dependent variables (Kelly, 2007). The best-fit vs. relation and associated 1 confidence interval for the combined sample is:
| (4) |
The solid orange line represents the best-fit regression model and is found to be consistent with the SZ94 density solution for and :
| (5) |
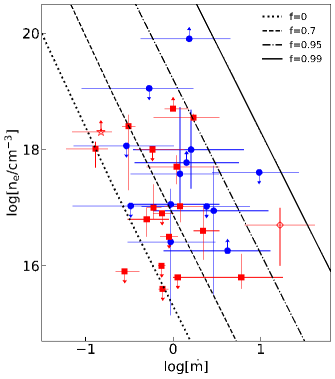
We also showed the variation of disc density with the accretion rate for the combined sample in Fig. 2 (top right). We did not find any correlation between the disc density and accretion rate and hence did not fit a linear model to the vs. plane. The SZ94 solutions for various values of are shown by black lines in the top right panel of Fig. 2.
The bottom left panel of Fig. 2 plots vs. for the combined sample. The disc density falls off with increasing BH mass which is in agreement with the SS73 model. We obtain a relatively weak anti-correlation (, p=0.04) between the disc density and BH mass. The best-fit relation obtained from our Bayesian linear regression analysis is:
| (6) |
The orange solid line and skyblue shaded area, respectively, show the best-fit regression model and associated uncertainties for the combined sample.
We then explored the possibility of a gas pressure-dominated disc. The radius at which gas thermal pressure balances the radiation pressure in the accretion disc (Svensson & Zdziarski, 1994) is:
| (7) |
The L.H.S of the equation (7) has a minimum at and the gas thermal pressure dominates the radiation pressure for certain combinations of , and . The bottom right panel of Fig. 2 depicts vs. . The SZ94 disc solutions for , 0.7, 0.95, 0.99 are shown by the dotted, dashed, dash-dotted, and solid green lines, respectively, below which the accretion disc is dominated by the gas thermal pressure. We find that the accretion rates of the low-mass sample are well above the thresholds for , and the thermal pressure begins to dominate the radiation pressure below .
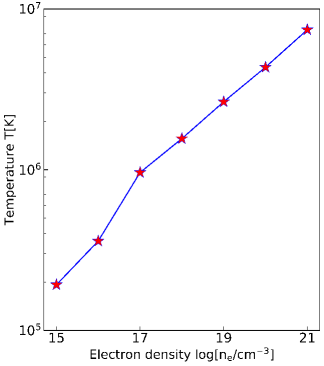
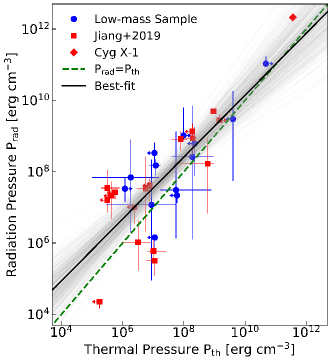
At the surface of the disc where reflection is taking place the incident downward radiation pressure is balanced by the upward gas thermal pressure, together with any magnetic gradient acting on the gas. This may result in compression of the gas which is known as Radiation Pressure Compression (RPC; see e.g. Dopita et al. 2002; Bianchi et al. 2019). Ignoring the magnetic field and any upward intrinsic radiation from the disc since is high, the radiation pressure balances the gas thermal pressure , where is the temperature at the illuminated atmosphere. This means that should be close to unity, as found for values typical of our sample of a few 100 erg cm s-1 for and a few million for . Exploring this further, we followed the prescription of García et al. (2016) and derived the temperature profile in the vertical direction of the illuminated zone for various densities, at the Thomson depth of . The temperature solutions were obtained from reflection calculations using input parameters appropriate for the sample on average, i.e., , erg cm s-1, , and keV. The left panel of Fig. 3 shows the derived vs. profile. We then estimated the ionizing radiation pressure and gas thermal pressure for our sample along with 17 Sy 1 AGNs from Jiang et al. (2019) and Cyg X-1 from Tomsick et al. (2018), and show the results in the right hand panel of Fig. 3. The dashed green line depicts the solution for pressure equality, i.e., . The small offset of the best-fit line (solid black) from the relation suggests that a magnetic pressure gradient may exist across the disc surface so that the incident radiation pressure is balanced by a combination of thermal pressure and excess magnetic pressure. Therefore, the energy density associated with this excess is essentially the difference between the incident radiation pressure and thermal pressure:
| (8) |
where is the magnetic pressure gradient across the surface and measured in units of erg cm-3, is the magnetic flux density in units of Gauss. The average excess magnetic flux density across the disc surface for the high-mass AGNs of Jiang et al. (2019) and our low-mass AGN sample is estimated to be Gauss and Gauss, respectively. The measured magnetic flux density of Cyg X-1 is even higher, Gauss. Presumably the absolute value of magnetic field either side of the surface is much higher than this. RPC may have the effect of increasing the surface density above that prescribed by the equations of SZ94 and contribute to some of the spread seen in the plots.
4.3 Disc ionization state
We measured the ionization state of the irradiated inner accretion disc from the reflection model and found that the inner accretion discs of this low-mass sample are moderate to highly ionized (). We first checked whether the ionization parameter inferred from the fitting is consistent with that expected from the inferred disc density, irradiating flux, and inner disc radius. We can calculate the disc ionization parameter at the inner radius using the following formula:
| (9) |
where is the source flux irradiating at the inner disc and calculated using the equation (4) of Zdziarski & De Marco (2020):
| (10) |
where is the BH mass in units of , is the inner disc radius in units of and fixed at 111See column (5) of Table 3 for ., and is the observed irradiating source flux in the 0.01100 keV band. Our calculations suggest that the average ionization parameter of the disc at the ISCO is and consistent with the model fitted average ionization parameter of at the 2 confidence level 222We used the Monte-Carlo bootstrapping method to determine the mean and corresponding 2 confidence limits..
The photoionization of the disc surface is characterized by two main parameters: irradiating X-ray continuum flux and disc density. Thus the measurement of the disc ionization parameter can address various aspects of the disc/corona interplay. According to Ballantyne et al. (2011), the ionization parameter of a radiation pressure supported disc illuminated by a geometrically thick corona in the SS73 model can be approximated as:
| (11) |
where radiative efficiency (Davis & Laor, 2011); viscosity parameter (Shakura & Sunyaev, 1973); coronal dissipation fraction (Vasudevan & Fabian, 2007); is the disc radius in units of ; is a general relativistic correction factor and is solely dependent on the dimensionless black hole spin (e.g. Novikov & Thorne 1973; Krolik 1999). Therefore, the dependence of disc ionization on the Eddington ratio (/) is predominantly determined by two parameters: and :
| (12) |
Fig. 4 shows the dependence of the disc ionization parameter on the Eddington ratio for the low-mass sample. We show the SS73 model predicted / relationships for five different combinations of BH spin and inner disc radius: (), (), (), (), and (). We noticed that the inferred ionization states of low-mass AGN discs are consistent with the SS73 model predicted solutions. The derived / plane suggests that if the relativistic reflection originated from within of the inner accretion disc, then the measured ionization parameters of the low-mass sample require spins to be in the range of with a median value of .
4.4 Black hole spin
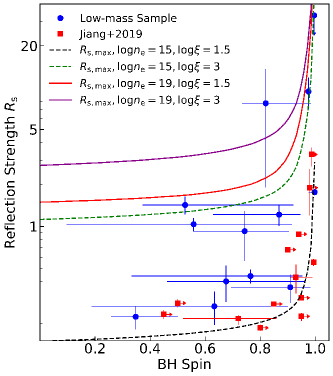
We measured the black hole spin of the low-mass AGN sample from the modeling of the relativistic reflection continuum. Walton et al. (2013) employed a similar approach to estimate the BH spin of bare AGNs. We find that the black holes at the center of these low-mass AGNs are spinning with an average value of . The BH spin determines the location of the ISCO and hence the inner edge of the accretion disc. Therefore, the spin has a direct impact on the area of the reflector, which affects the reflection strength. Dauser et al. (2014) had shown that it is possible to check for any unphysical solutions of BH spin using the measured strength of reflection in the keV band. However, we determine the reflection strength as the ratio between the disc reflected flux and irradiating source flux in the observed keV band to be consistent with Jiang et al. (2019). In Fig. 5, we show the dependence of the reflection strength on the BH spin for our sample together with the AGN sample from Jiang et al. (2019), where both the black hole spin and reflection strength were calculated using the high-density disc reflection model. We then overplotted the Dauser et al. (2014) model predicted maximum possible reflection strength vs. spin curves for four different combinations of disc density and ionization parameters: (), (), () and (), where the units of and are and , respectively. We assume a lamppost configuration for corona to compute the maximum strength of reflection. We find that the low-mass AGN sample rules out the combination and prefers higher density or higher ionization for the accretion disc. Additionally, all four theoretical curves disfavor unrealistic solutions of low spin and large for both samples and support the reflection origin of their broad-band spectra.
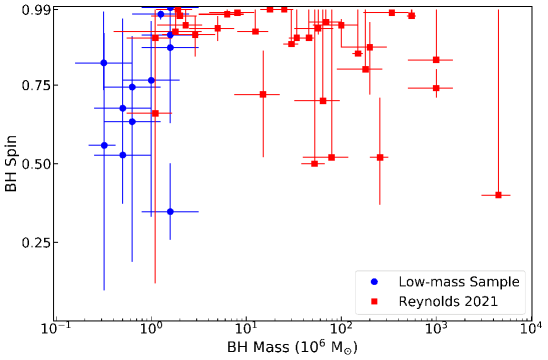
To study the evolution of BH spin as a function of mass, we constructed the BH spin vs. mass plane for our low-mass sample along with 32 AGNs from Reynolds (2021), which is shown in Fig. 6. For the low-mass AGNs, the spin parameter ranges from to , suggesting the presence of slow to rapidly spinning black holes at the center of these AGNs. We noticed a population of more slowly spinning black holes below and above . To test the significance of the differences between the low (), medium (), and high-mass () black hole spin populations, we performed a Kolmogorov-Smirnov (KS) test between the low-mass and medium-mass bins, and between the medium-mass and high-mass bins. The KS tests suggest that samples were drawn from distinct populations with 99 per cent significance. Therefore, we conclude that the variation of black hole spin as a function of mass is intrinsic and not driven by the randomness of samples. One possible explanation for the low spin is that the black holes at the center of the low-mass AGNs could result from the collision or merger of intermediate-mass black holes with mass or lower. The detection of gravitational waves from intermediate-mass black holes with the laser interferometer space antenna (LISA) can confirm the collision/merger as one of the possible formation mechanisms for the low-mass end of supermassive black holes. The objects with high spin have higher radiative efficiency for the same mass accretion rate and can be approximately five times more luminous than those with zero spins and hence tend to dominate flux-limited samples (Vasudevan et al., 2016).
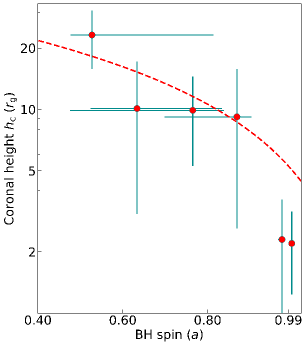
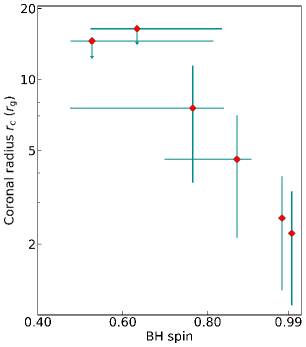
In Mallick et al. (2021), we estimated the height and radius of the X-ray emitting corona through time lag analysis for six low-mass AGNs, namely J0107, J1023, J1140, J1347, J1434, and J1559, in which we detected reverberation lags with confidence. The coronal height was measured as the light-crossing distance between the corona and accretion disc, and it depends on the amplitude of the soft reverberation lag and black hole mass. On the other hand, the coronal radius was determined by the hard viscous propagation time delay, coronal height, and black hole mass. Both the observed soft and hard X-ray lags were dilution-corrected. Additionally, the reverberation lags were corrected for the ‘Shapiro’ delays. Here we investigate the dependence of coronal extents on the black hole spin. Fig. 7 depicts the variation of coronal height and radius with the spin of the central black hole for these six AGNs. The right-hand panel of Fig. 7 has a strikingly similar shape to the half-light radius of a Novikov-Thorne (NT) disc (see Fig. 1 of Agol & Krolik 2000). This is the radius within which half of the radiation flux is emitted by the disc. Our results suggest , which is relevant for radio-quiet AGNs. Hence, the coronal height can be approximated as (Fabian et al., 2014). The dashed red line shows model as a function of spin for the NT disc. The variation of coronal size with black hole spin indicates that the most compact corona can be found only around the most rapidly spinning black holes for which the ISCO is at a smaller radius. If the corona is formed from magnetic field lines anchored at the disc, we can expect a higher density of field lines at a smaller radius. The results also point out that spin cannot be well measured unless the innermost parts of the disc are well illuminated, which means the coronal extent has to be for rapidly spinning black holes and for moderately rotating black holes. Presumably, an observational selection effect is at play. However, precise measurements of coronal height or radius require detailed physical modeling of X-ray time lag spectra. Therefore, the observed spin dependence of coronal extents needs to be tested through simultaneous time lag and flux-energy spectral modeling.
5 Conclusions
In this paper, we study the broad-band (0.3–10 keV) XMM-Newton spectra of a sample of 13 low-mass () AGNs using the new high-density disc reflection model and determine the detailed accretion properties of the low-mass end of SMBHs in the X-ray energy band. We conclude the main results of this work below:
-
•
The X-ray spectra of the sample reveal excess emission below keV. Additionally, we detect a narrow Fe Kα emission line in the NLS1 galaxy J1559 and an ionized, partial covering absorption in the Sy 1.5 galaxy POX 52. The soft X-ray excess emission is well described by the relativistic reflection from an ionized, higher density disc. The modeling of the reflection continuum prefers a density considerably higher than cm-3 for eight out of thirteen sources in our sample with significance per cent. The average value of the disc density as inferred from the reflection modeling is cm-3.
-
•
The accretion discs of the low-mass active galaxies are found to be accreting matter at sub-Eddington or near-Eddington rates, and the surface density of the disc atmosphere depends both on the accretion rate and BH mass. We noticed an anti-correlation between and the BH mass times accretion rate squared, , which is expected for a radiation pressure supported disc. The fraction of the total power released from the disc into the corona is estimated to be per cent in the inner regions of the radiation pressure-dominated disc. When the disc power transferred to the corona is below 70 per cent, the gas pressure starts dominating the disc.
-
•
The variation of the ionizing radiation pressure with thermal pressure suggests a magnetic pressure gradient across the surface of the disc, and the incident radiation pressure is balanced by both thermal and excess magnetic pressure. When the magnetic pressure gradient across the disc surface is weak, the radiation pressure compression (RPC) mechanism compresses the X-ray illuminated disc atmosphere in the vertical direction and consequently increases the disc density.
-
•
The illuminated gas in the inner accretion disc is found to be moderate to highly ionized and agrees with the ionization parameter calculated from the disc density and irradiating source flux at the ISCO within 2 confidence limits. The dependence of the disc ionization state on the Eddington ratio is consistent with the predictions of the radiation pressure-dominated SS73 disc model for a geometrically thick corona. The / relation prescribes that if the relativistic reflection originated from within 6 gravitational radii of the disc, the black hole spin should be in the range of .
-
•
The nuclei of the low-mass active galaxies harbor mild to fast-spinning black holes, where the measured spin parameter is , and the most compact corona is likely to be located around the most rapidly spinning black holes. The relatively low spin provides a hint that the merger of IMBH pairs is perhaps responsible for the formation of the low-mass end of SMBHs, which can be confirmed with the future gravitational wave detector LISA.
6 Future work
Our current high-density relativistic reflection model relxillDCp allows the density parameter to vary within the range /cm-3] and can provide the physical understanding of the broad-band (0.3–10 keV) AGN spectra. The observations of these low-mass AGNs with NuSTAR in the 3–78 keV band are required to test the validity of the high-density reflection model for the description of the Compton hump, which is usually observed at around keV.
We find that the density is pegged at the upper bound of the model for a few sources in our sample, which argues for the existence of an even higher density disc. We, therefore, plan to extend the density parameter of the relxillDCp model up to /cm-3] in the future version.
Acknowledgments
LM is supported by NASA ADAP grant 80NSSC21K1567. JAG acknowledges support from NASA grant 80NSSC21K1567 and from the Alexander von Humboldt Foundation. JAT acknowledges partial support from NASA ADAP grant 80NSSC19K0586. BDM acknowledges support via Ramón y Cajal Fellowship RYC2018-025950-I. AGM acknowledges partial support from Polish National Science Center (NCN) grant numbers 2016/23/B/ST9/03123 and 2018/31/G/ST9/03224. We thank the anonymous reviewer for a constructive report. We dedicate this paper to doctors and nurses fighting the COVID-19 global pandemic. This research has made use of the NASA/IPAC Extragalactic Database (NED), which is operated by the Jet Propulsion Laboratory, California Institute of Technology, under contract with the NASA. This research has made use of data, software and/or web tools obtained from the High Energy Astrophysics Science Archive Research Center (HEASARC), a service of the Astrophysics Science Division at NASA/GSFC and of the Smithsonian Astrophysical Observatory’s High Energy Astrophysics Division.
Data availability
All the data used in this article are publicly available from ESA XMM-Newton Science Archive (XSA; http://nxsa.esac.esa.int/) and NASA High Energy Astrophysics Science Archive Research Center (HEASARC; https://heasarc.gsfc.nasa.gov/).
References
- Arnaud (1996) Arnaud K. A., 1996, ASPC, 101, 17
- Agol & Krolik (2000) Agol E. & Krolik J. H., 2000, ApJ, 528, 161
- Barth et al. (2004) Barth A. J., Ho L. C., Rutledge R. E., Sargent W. L. W., 2004, ApJ, 607, 90
- Brenneman & Reynolds (2006) Brenneman L. W. & Reynolds C. S., 2006, ApJ, 652, 1028
- Ballantyne et al. (2011) Ballantyne D. R., McDuffie J. R., Rusi J. S., 2011, ApJ, 734, 2
- Baldassare et al. (2015) Baldassare V. F., Reines A. E., Gallo E., Greene J. E., 2015, ApJL, 809, L14
- Bianchi et al. (2019) Bianchi S., Guainazzi M., Laor A., Stern J., Behar E., 2019, MNRAS, 485, 416
- Bambi et al. (2021) Bambi C. et al., 2021, Space Science Reviews, 217, 65
- Cash (1979) Cash W., 1979, ApJ, 228, 939
- Davis & Laor (2011) Davis S. W., Laor A. 2011, ApJ, 728, 98
- Dopita et al. (2002) Dopita M. A., Groves B. A., Sutherland R. S., Binette L., Cecil G., 2002, ApJ, 572, 753
- de la Calle Pérez et al (2010) de la Calle Pérez I. et al., 2010, A&A, 524, A50
- Dauser et al (2013) Dauser T. et al., 2013, MNRAS, 430, 1694
- Dauser et al. (2014) Dauser T. et al., 2014, MNRASL, 444, L100
- The Event Horizon Telescope Collaboration et al. (2019) The Event Horizon Telescope Collaboration et al., 2019, ApJL, 875, L6
- Fabian et al. (1989) Fabian A. C., Rees M. J., Stella L., White N. E., 1989, MNRAS, 238, 729
- Fabian et al. (2002) Fabian A. C., Iwasawa K., Reynolds C. S., Young A. J., 2002, PASP, 112, 1145
- Fabian (2012) Fabian A. C., 2012, ARA&A, 50, 455
- Fabian et al. (2014) Fabian A. C. et al., 2014, MNRAS, 439, 2307
- Gierliński & Done (2004) Gierliński M., Done C., 2004, MNRAS, 349, 7
- Greene & Ho (2007) Greene J. E., Ho L. C., 2007, ApJ, 670, 92 (GH07)
- García et al. (2013) García J. et al., 2013, ApJ, 768, 146
- García et al. (2014) García J. et al., 2014, ApJ, 782, 76
- García et al. (2016) García J. et al., 2016, MNRAS, 462, 751
- García et al. (2019) García J. et al., 2019, ApJ, 871, 88
- Hopkins et al. (2007) Hopkins P. F., Richards G. T., Hernquist L., 2007, ApJ, 654, 731
- Jansen et al. (2001) Jansen F. et al., 2001, A&A, 365, L1
- Jiang et al. (2018) Jiang J. et al. 2018, MNRAS, 477, 3711
- Jiang et al. (2019) Jiang J. et al. 2019, MNRAS, 489, 3436
- Jiang et al. (2020) Jiang J., Fúrst F., Walton D. J., Parker M. L., Fabian A. C., 2020, MNRAS, 492, 1947
- Krolik (1999) Krolik J. H. 1999, Active Galactic Nuclei: From the Central Black Hole to the Galactic Environment (Princeton, NJ: Princeton Univ. Press)
- Kelly (2007) Kelly B. C., 2007, ApJ, 665, 1489
- Kormendy & Ho (2013) Kormendy J., Ho L. C., 2013, ARA&A, 51, 511
- Lynden-Bell (1969) Lynden-Bell D., 1969, Nature, 223, 690 4
- Ludlam et al. (2015) Ludlam et al. 2015, MNRAS, 447, 2112
- Miniutti et al. (2009) Miniutti G. et al., 2009, MNRAS, 394, 443
- Marinucci et al. (2014) Marinucci A. et al., 2014, ApJ, 787, 83
- Matt et al. (2014) Matt G. et al. 2014, MNRAS, 439, 3016
- Mallick et al. (2017) Mallick L. et al., 2017, MNRAS, 472, 174
- Mallick et al. (2018) Mallick L. et al., 2018, MNRAS, 479, 615
- Mallick et al. (2021) Mallick L. et al., 2021, MNRAS, 503, 3775
- Novikov & Thorne (1973) Novikov I. D. & Thorne K. S. 1973, in Black Holes (Les Astres Occlus), ed. C. Dewitt & B. S. Dewitt, 343-450
- Porquet et al. (2018) Porquet D. et al., 2018, A&A, 609, 42
- Petrucci et al. (2018) Petrucci P. -O. et al., 2018, A&A, 611, 59
- Rees (1984) Rees M. J. 1984, ARA&A, 22, 471 4
- Ross & Fabian (1993) Ross R. R., Fabian A. C., 1993, MNRAS, 261, 74
- Ross & Fabian (2005) Ross R. R., Fabian A. C., 2005, MNRAS, 358, 211
- Reeves et al. (2008) Reeves J. et al., 2008, MNRAS, 385L, 108
- Reines et al. (2013) Reines A. E., Greene J. E., Geha M., 2013, ApJ, 775, 116
- Reynolds (2019) Reynolds C. S., 2019, Nature Astronomy, 3, 41
- Reynolds (2021) Reynolds C. S., 2021, ARA&A, 59, 117
- Shakura & Sunyaev (1973) Shakura N. I., Sunyaev R. A., 1973, A&A, 24, 337
- Svensson & Zdziarski (1994) Svensson R., Zdziarski A. A., 1994, ApJ, 436, 599
- Storchi-Bergmann & Schnorr-Múller (2019) Storchi-Bergmann T., Schnorr-Múller A., 2019, Nature Astron., 3, 48
- Thornton et al. (2008) Thornton C. E. et al., 2008, ApJ, 686, 892
- Tomsick et al. (2018) Tomsick J. A. et al., 2018, ApJ, 855, 3
- Verner et al. (1996) Verner D. A., Ferland G. J., Korista K. T., Yakovlev D. G., 1996, ApJ, 465, 487
- Vasudevan & Fabian (2007) Vasudevan R. V., Fabian A. C. 2007, MNRAS, 381, 1235
- Vasudevan et al. (2016) Vasudevan R. V. et al., 2016, MNRAS, 458, 2012
- Volonteri et al. (2013) Volonteri M. et al. 2013, ApJ, 775, 94
- Wilms et al. (2000) Wilms J., Allen A., McCray R., 2000, ApJ 542, 914
- Walton et al. (2013) Walton D. J., Nardini E., Fabian A. C., Gallo L. C., Reis R. C., 2013, MNRAS, 428, 2901
- Wilkins & Fabian (2011) Wilkins D. R., Fabian A. C., 2011, MNRAS, 414, 1269
- Wilkins et al. (2021) Wilkins D. R., Gallo L. C., Costantini E., Brandt W. N., Blandford R. D., 2021, Nature, 595, 657
- Willingale et al. (2013) Willingale R., Starling R. L. C., Beardmore A. P., Tanvir N. R., OBrien P. T., 2013, MNRAS, 431, 394
- Xu et al. (2021) Xu Y., García J. A., Walton D., J., et al. 2021, ApJ, 913, 13
- Źycki et al. (1999) Źycki P. T., Done C., Smith D. A., 1999, MNRAS, 309, 561
- Zdziarski et al. (1996) Zdziarski A. A., Johnson W. N., Magdziarz P., 1996, MNRAS, 283, 193
- Zoghbi et al. (2015) Zoghbi A. et al., 2015, ApJ, 799, L24
- Zdziarski & De Marco (2020) Zdziarski A. A., De Marco B., 2020, ApJL, 896, L36
Appendix A Additional tables and plots
| Source | Obs. ID | nthComp | relxillDCp | |||||||||
|---|---|---|---|---|---|---|---|---|---|---|---|---|
| [] | [] | |||||||||||
| (1) | (2) | (3) | (4) | (5) | (6) | (7) | (8) | (9) | (10) | (11) | (12) | |
| J0107 | 0305920101 | |||||||||||
| J0228 | 0674810101 | |||||||||||
| J0940 | 0306050201 | |||||||||||
| J1023 | 0108670101 | |||||||||||
| 0605540201 | – | |||||||||||
| 0605540301 | – | |||||||||||
| J1140 | 0305920201 | |||||||||||
| 0724840101 | – | – | ||||||||||
| 0724840301 | – | – | ||||||||||
| J1347 | 0744220701 | |||||||||||
| J1357 | 0305920601 | |||||||||||
| J1434 | 0305920401 | |||||||||||
| 0674810501 | – | |||||||||||
| J1541 | 0744220401 | |||||||||||
| J1626 | 0674811001 | |||||||||||
| J1631 | 0674810601 |
| Model | Source | J1559 | J1559 | POX52 | Description |
|---|---|---|---|---|---|
| Component | Obs. ID | 0744290101 | 0744290201 | 0302420101 | |
| zxipcf | [1021 cm-2] | Column density of the absorber | |||
| [erg cm s-1] | Ionization parameter | ||||
| [per cent] | Covering fraction | ||||
| gabs | [keV] | Line energy [observed frame] | |||
| [eV] | Line width | ||||
| [10-2] | Line depth | ||||
| zgauss | [keV] | Rest-frame line centroid energy | |||
| [10-6] | Line normalization | ||||
| nthComp | Photon index | ||||
| [] | Primary continuum normalization | ||||
| relxillDCp | Inner emissivity index | ||||
| BH spin | |||||
| Disc inclination angle | |||||
| Disc ionization parameter | |||||
| /cm-3] | Disc density | ||||
| [] | Reflection normalization | ||||
| Reflection strength | |||||
| – | Fit statistic |