[orcid=0000-0001-5848-5520] [suffix=Jr.]
Synthesis of Eu(HCOO)3 and Eu(HCOO)(HCONH2)2 crystals and observation of their 5D0 7F0 transition for quantum information systems
Abstract
Two stoichiometric metal-organic frameworks containing Eu3+ cations are probed as candidates for photon-based quantum information storage. Synthesis procedures for growing 0.2 mm, rod-shaped Eu(HCOO)3 and 1-3 mm, rhombohedral Eu(HCOO)(HCONH2)2 single crystals are presented with visible precipitation as soon as 1 h into heating for Eu(HCOO)3 and 24 h for Eu(HCOO)(HCONH2)2. Room temperature and 1.4 K photoluminescence measurements of the 5D0 7FJ transitions of Eu3+ are analyzed for both compounds. Comparisons of peak width and intensity are discussed along with the notable first report for both of the 5D0 7F0 transition, the hyperfine structure of which has potential use in quantum memory applications. The air instability of Eu(HCOO)(HCONH2)2 and the transformation of its photoluminescence properties are discussed.
keywords:
\sepCrystal growth \sepQuantum memory \sepMetal-organic frameworks \sepPhase stability1 Introduction
Stoichiometric compounds with lanthanide cations in crystallographic sites can increase optical density for photon-based quantum information systems (QIS) while also reducing the optical transitions’ inhomogeneous linewidths by avoiding local strain and disorder due to doping. Such a reduction is required to optically resolve the extremely long-lived hyperfine structure in these ions, such as the 5DF0 transition in Eu3+ [1, 2, 3]. Achieving this limit of inhomogeneous linewidth smaller than the splitting between hyperfine levels is necessary to optically prepare the system in a particular state, which would enable long-lived and efficient quantum memory [2], quantum information processing [4, 5], quantum transduction [6], etc. [7] Currently, only EuCl6H2O has been shown to achieve this inhomogeneous linewidth limit. Without isotopic purification, the 5D0 7F0 transition of Eu3+ with its advantageous hyperfine levels has an inhomogeneous linewidth of 100 MHz in EuCl6H2O [1]. Because of the proposed linear dependence of isotopic broadening on isotopes’ relative mass difference, atomic concentration, and natural abundance [8], isotopic purification of EuCl6H2O was performed for the Cl- ion. The resulting 99.67% 35Cl purification reduced the linewidth to 25 MHz, smaller than the material’s nearest-neighbor Eu3+ interactions (40 MHz) [9] and small enough to resolve the hyperfine structure [8]. But EuCl6H2O crystals are highly hygroscopic and unstable under vacuum [1]. Therefore, selecting additional materials with low inhomogeneous linewidths and improved environmental stability is critical for advancing the study of stoichiometric rare-earth crystals for QIS. We identify and synthesize two candidate stoichiometric europium-containing crystals and investigate their structural and optical properties at room and cryogenic temperatures. We find that both candidates can be grown from moderately heated aqueous solutions in air, and exhibit the desired 7F0 5D0 transition with typical optical lifetime values.
Europium formate Eu(HCOO)3 [“EF"] and europium formate formamide Eu(HCOO)(HCONH2)2 [“EFFA"] are two promising candidates for QIS applications. Both compounds can be obtained by solution precipitation [10, 11] and have published crystal structures, shown in Figures 1 and 2 (EF: CSD Entry ZZZVME01 [12], EFFA: ICSD Entry 251671 [13]). A procedure for reliably producing mm-scale crystals that are environmentally stable is necessary for practical use in a quantum memory device and for the possibility of future photonic integration.
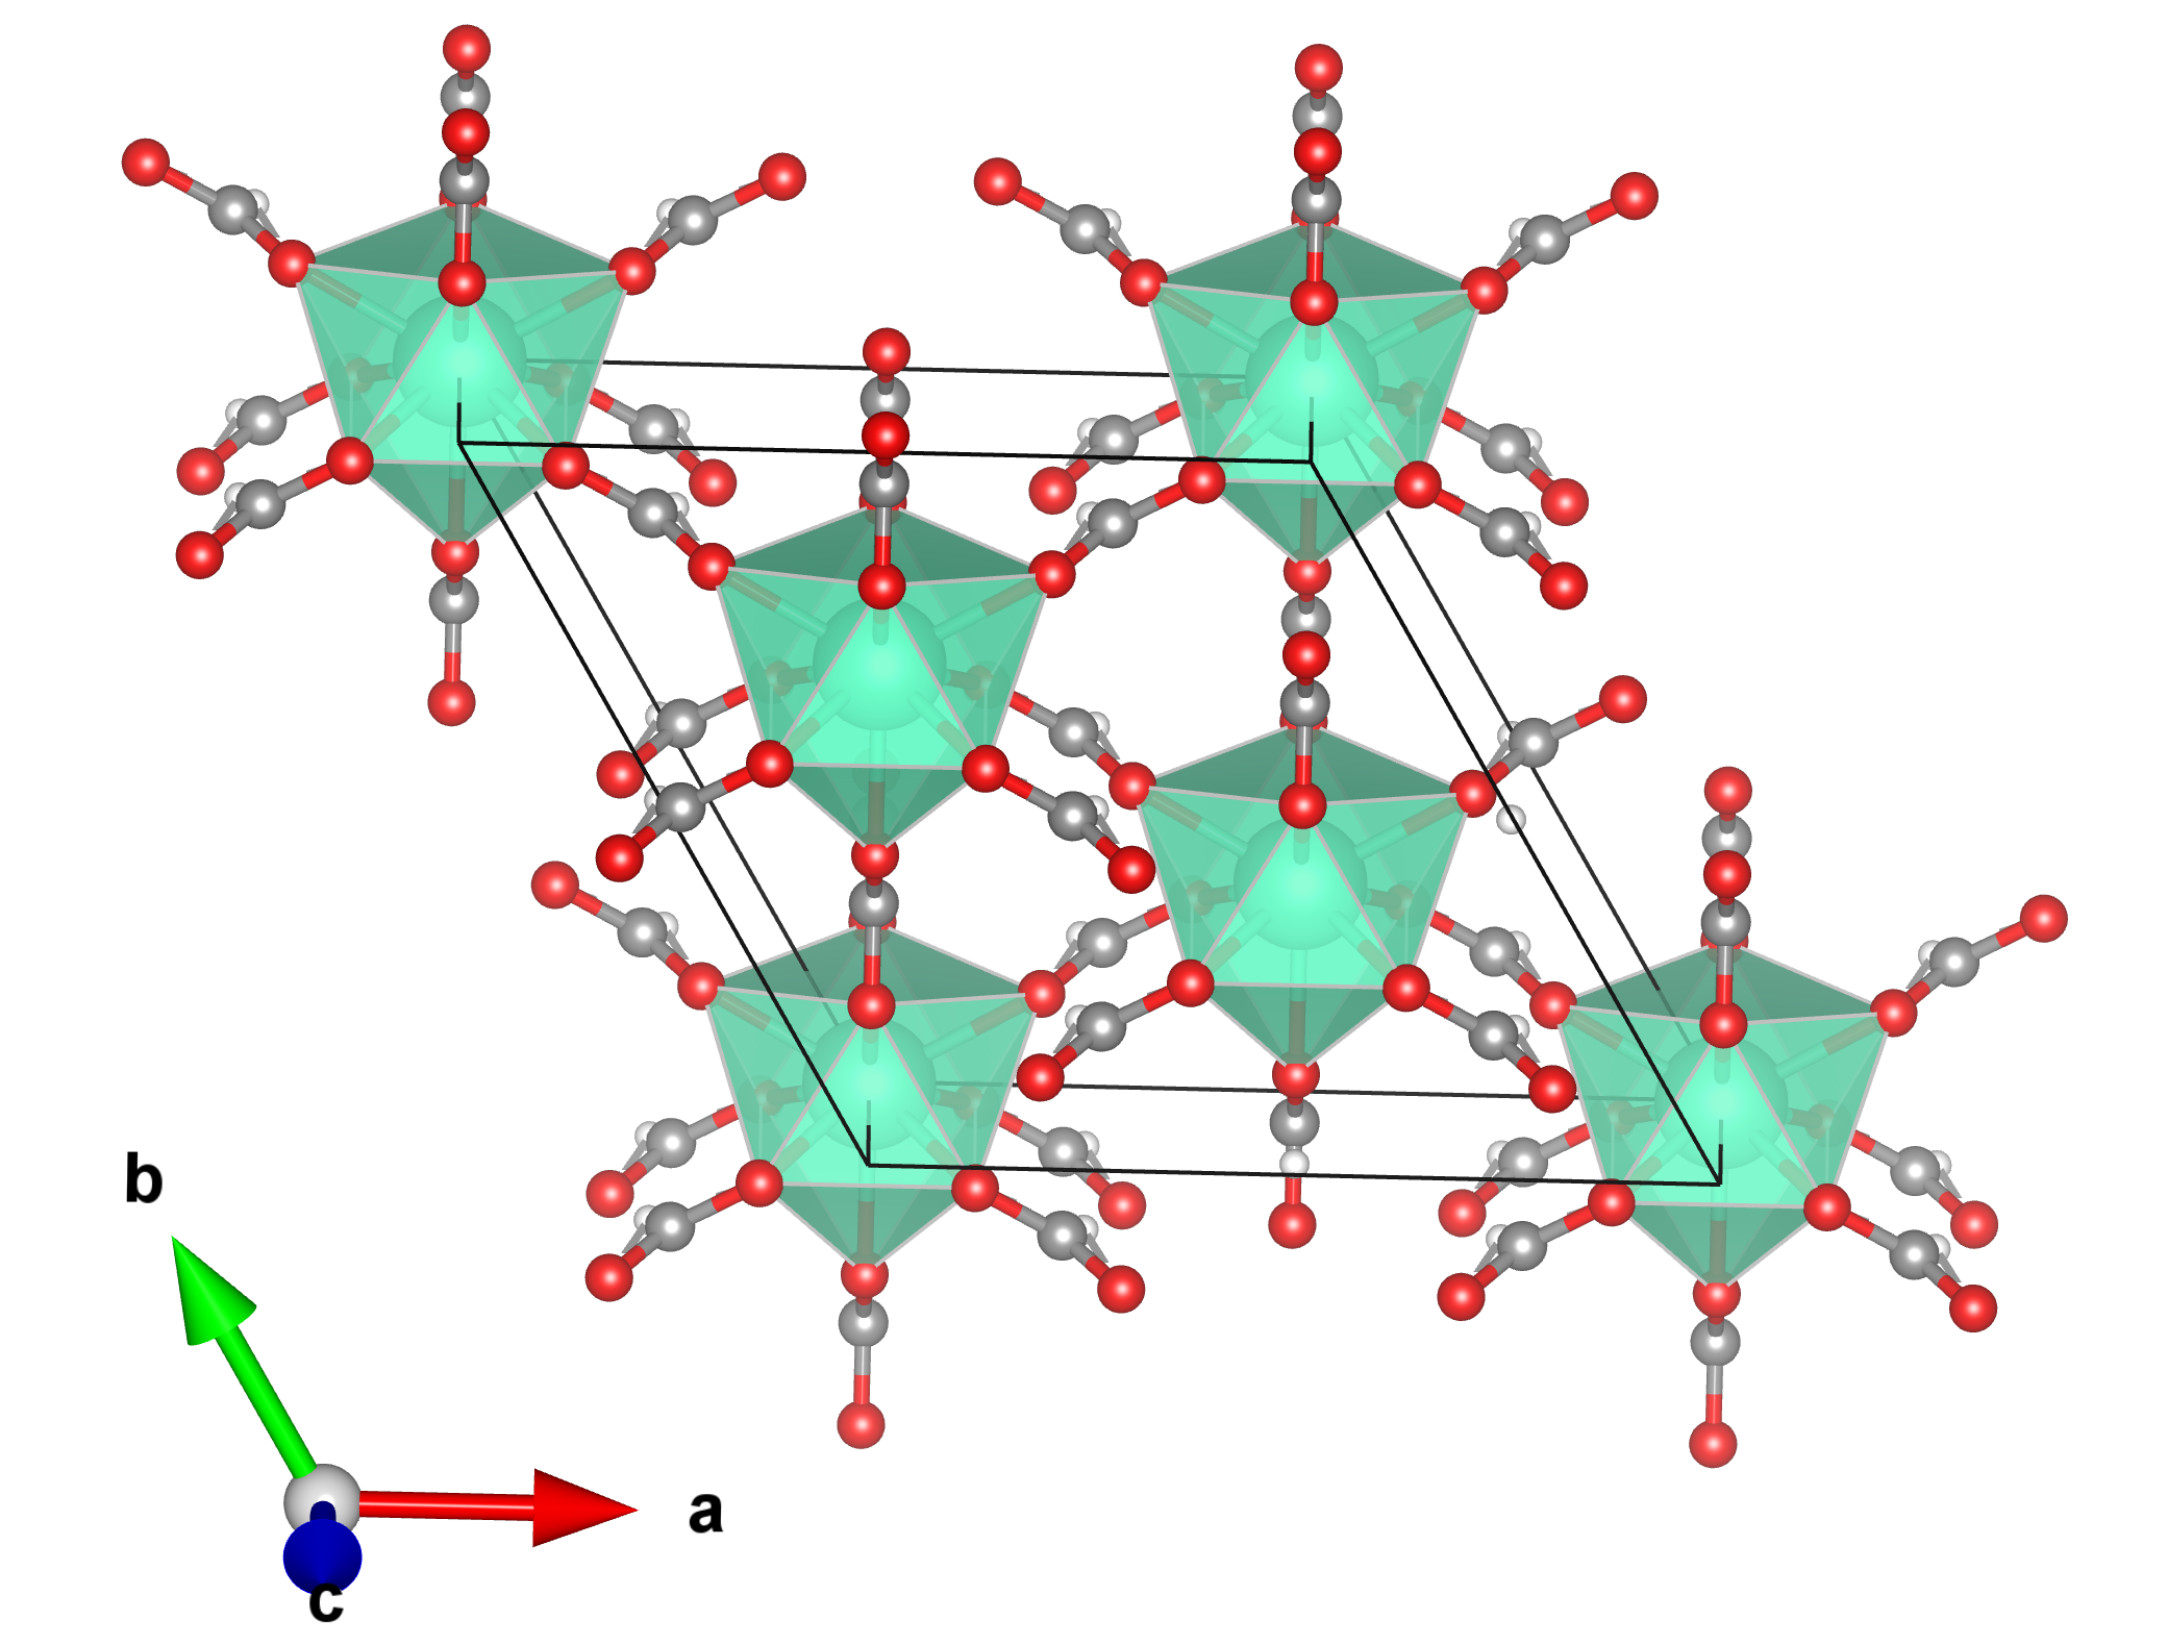
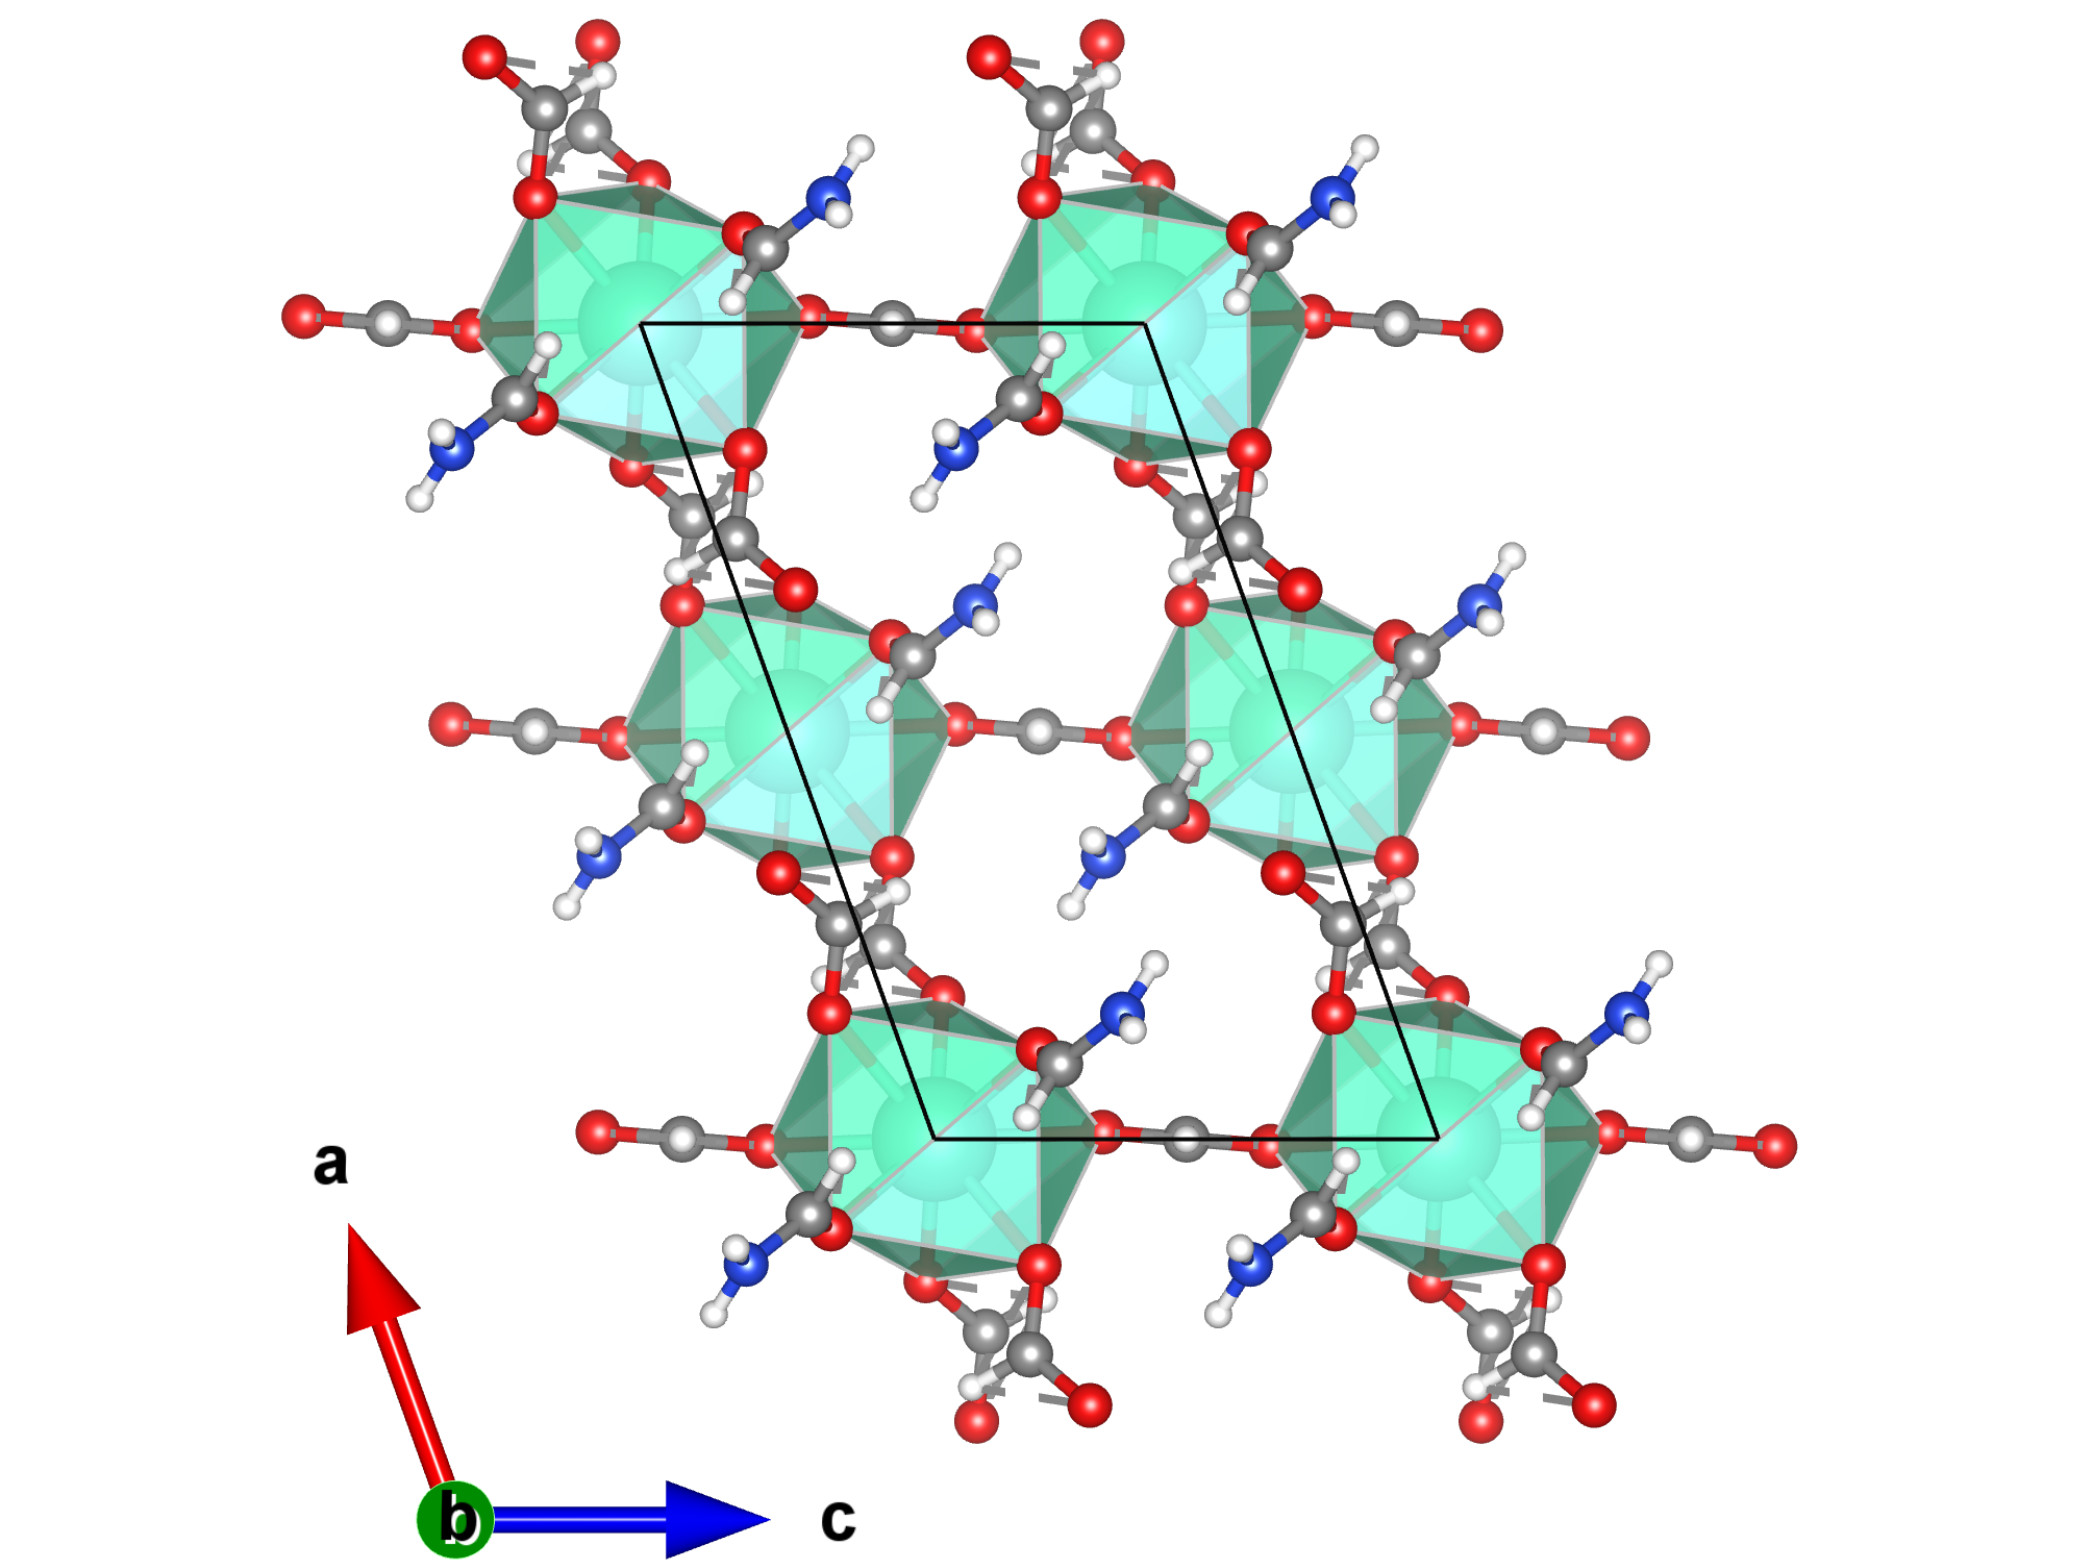
EF consists of Eu3+ cations nine-fold coordinated to formate groups that bridge them. EFFA on the other hand has eight-fold coordinated Eu3+ cations with six Eu3+-bridging formate groups and two terminal formamide groups. The compounds’ non-europium elements have a dominant naturally abundant isotope (1H: 99.99%, 12C: 98.89%, 16O: 99.76%, 14N: 99.64%), reducing the need for isotopic purification to promote a narrow optical linewidth. Still, deuteration of the compounds would be expected to improve quantum efficiency and transition coherence time [14]. Both have relatively large Eu3+ separation within the material (4.001 Å in EF and 6.640 Å in EFFA), which is desirable to prevent interactions between the Eu3+ optical centers.
2 Experimental Procedures
2.1 Synthesis
Numerous clear, faceted EF and EFFA crystals were produced from a solution of formamide and de-ionized water. For both, Eu(NO3)5H2O (Sigma-Aldrich, 99.9% REO) was added to a 7 mL glass vial along with a 3.5 mL solution of 98% formamide HCONH2 (Alfa Aesar, 99%) and 2% de-ionized H2O, by volume. The Eu(NO3)5H2O concentration was 0.05 M for EF and 0.075 M for EFFA. The solutions were gently swirled and inverted until the powder was dissolved. The uncovered vials were heated for 48 h on a hot plate with the solution temperature at 125∘C for EF and 65∘C for EFFA. A camera periodically captured images of the crystal precipitation (Supplementary Material). Gravity filtration was used to separate the crystals from the reaction solution, followed by rinsing with ethanol and drying at 80∘C for 20 min.
2.2 Characterization
Scanning electron microscopy images were collected with a JEOL 6060LV SEM. A Bruker D8 diffractometer equipped with a capillary mount was used for powder X-ray diffraction. Confocal room temperature photoluminescence measurements on individual crystals were obtained with 532 nm excitation on a Nanophoton Raman 11 microscope. A 405 nm laser and a SpectraPro 300i spectrograph were used to collect 1.4 K and 298 K photoluminescence spectra. Samples were mounted vertically with Cu tape on a Cu plate in a Janis 10DT liquid He bath cryostat. Data were collected for a single EFFA crystal and for a cluster of EF ones. For lifetime measurements, the fluorescent emission was collected with a single-photon avalanche diode and accumulated into a histogram of 1500 time bins with a bin width of 10 s. The cryogenic EFFA data was collected using 66.3 W of excitation power with a 300 s pulse duration and was integrated for 6 min. The cryogenic EF data was collected using 6.58 W excitation power with a 100 s pulse duration and was integrated for 2.5 min. Inductively coupled plasma mass spectrometry (ICP-MS) was performed with a PerkinElmer NexION 350D using standards with concentrations as low as 0.5 ppm.
3 Results and Discussion
3.1 Crystal Growth
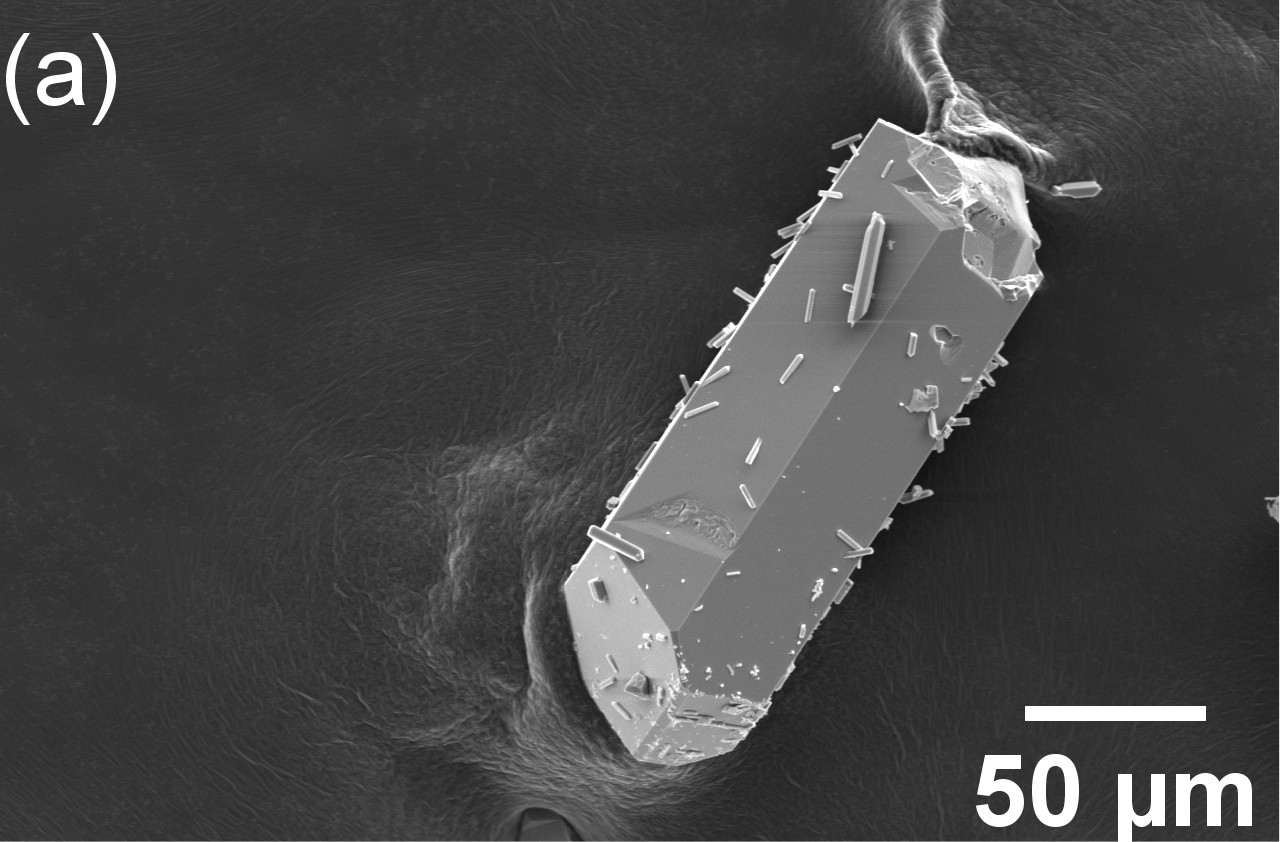
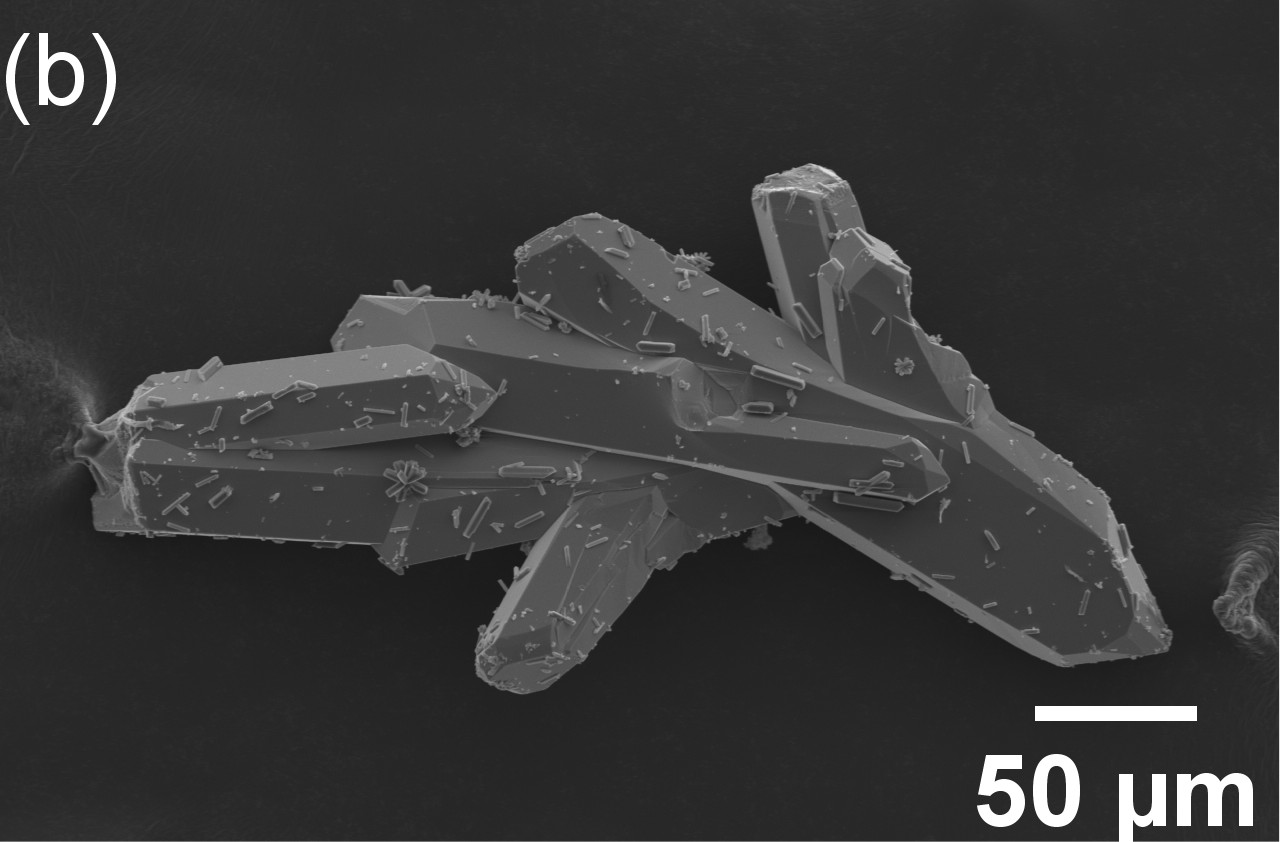
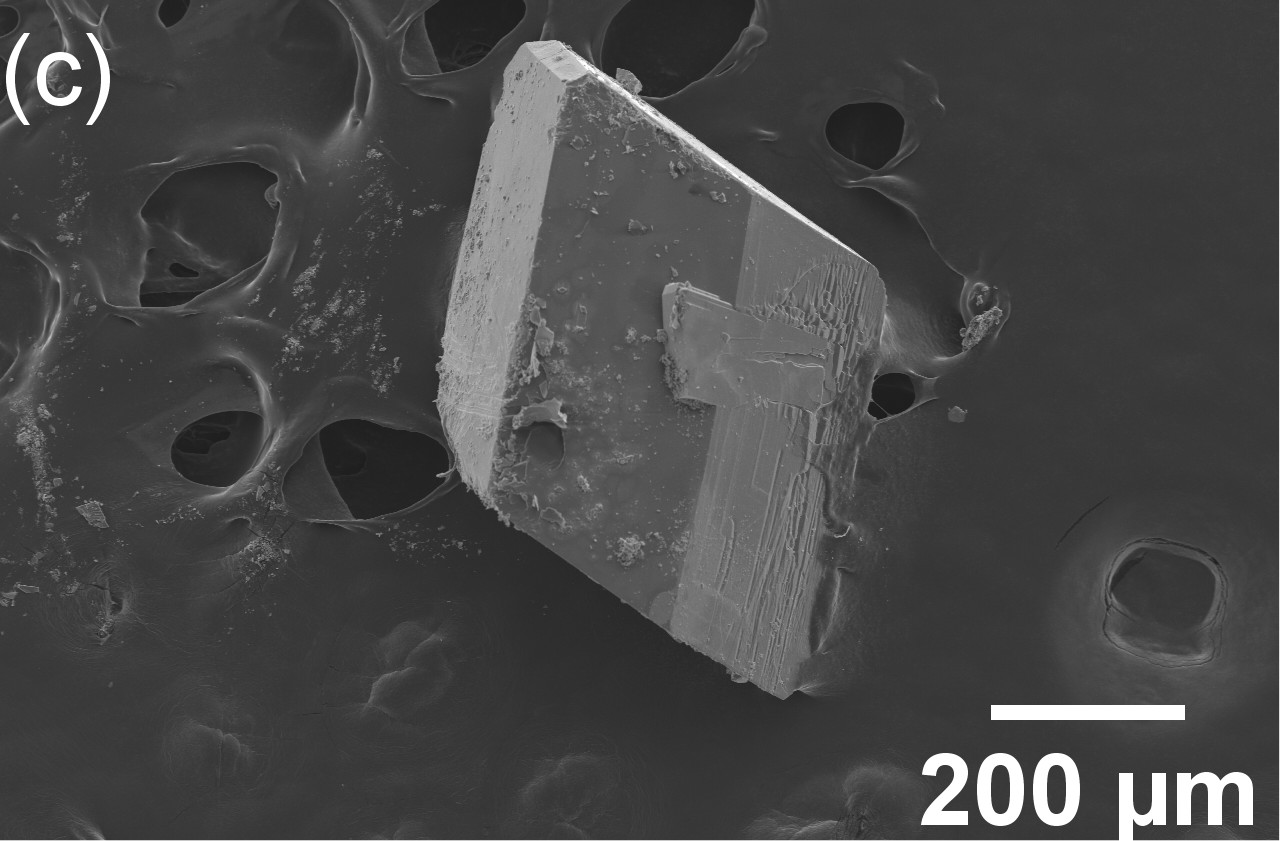
Many clusters of EF crystals formed with a Eu content yield of 71.1% after 48 h. Time lapse video showed visible precipitation from the solution beginning after only 1 h of heating without the presence of a seed crystal. For EFFA, rhombohedral crystals formed with a Eu content yield of 53.0% after 48 h. Visible precipitation began around 24 h without a seed crystal. EF and EFFA crystals appeared to form throughout the solution, with some dropping to the bottom of the vial and some being stuck on the side of the vial at the liquid-air interface. SEM images showed that the EF crystals had nice facets but were frequently fused together and had smaller crystals sitting on their surface; imaging of EFFA crystals consistently revealed surface defects (Figure 3). The lengthier growth process of the EFFA crystals at a lower temperature promoted the formation of larger crystals with sides around 1 mm long (Figure 7). Moreover, introducing a seed crystal to the same initial solution led to the formation of a EFFA crystal with 3 mm sides along with additional 1 mm scale crystals. Seeding did not lead to any obvious differences for EF.

The faster growth of smaller EF crystals can be explained kinetically. The hydrolysis of formamide produces ammonia and formic acid, thus providing the formate ions incorporated in the two structures [10]. Three pathways for the hydrolysis of formamide have been proposed, acid catalyzed, base catalyzed, and neutral water catalyzed. The neutral catalyzed pathway, although advocated for by experimental fitting [15] and a computational study [16], has been rejected by some on the basis of its high calculated activation energy [17]. Still, Miyakawa et al. studied the hydrolysis kinetics and provided an experimental fit to the first-order rate constant for formamide hydrolysis based on H+ and OH- concentration [18]. pH paper measurements at the beginning and end of the crystal growths indicate that the reaction solutions remain approximately neutral during the growth, and the water content of the two solutions, based on added DI H2O and Eu(NO3)5H2O concentration, are similar (4.8 mmol H2O for EF and 5.2 mmol for EFFA). Utilizing the Miyakawa equations, at pH 7, the rate of hydrolysis in the 125∘C EF solution (2.410-7 s-1) should be 38 times larger than in the 65∘C EFFA solution (6.310-9 s-1). This indicates that formate ions should form much more quickly in the EF solution, leading to the observed faster growth.
3.2 Room Temperature Photoluminescence
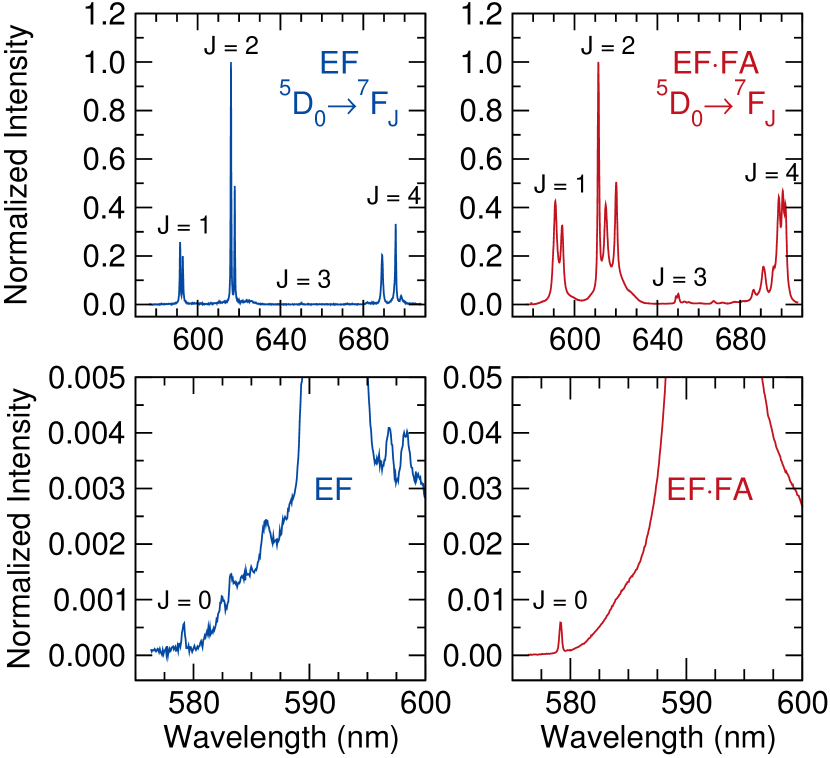
The room temperature emission spectra of EF and EFFA are shown in Figure 4. Both show peaks for the 5D0 7FJ set of transitions. Comparing the spectra with literature values [10, 11, 19, 20], the EF transitions centered at 579, 592, 616, 650, and 696 nm are assigned to = 0, 1, 2, 3, 4, respectively, and for EFFA, the same transitions are centered at 579, 591, 612, 650, and 701 nm. This is the first observation of the 5D0 7F0 transition for either material.
The noticeably sharper transitions for EF indicate phonon broadening effects associated with the differing ligands. Although many other Eu3+-containing systems have demonstrated large broadening effects due to a higher degree of crystallinity or a lower number of defects within the sample [21, 22, 23, 24, 25], those explanations do not hold here as even the EFFA crystals that decompose into EF experience drastic transition sharpening (Supplementary Material). Accompanying this sharpening is the appearance of additional peaks around the 5D0 7F1 transition of EF. These peaks, presumably, arise from rare-earth impurities in the precursor. Although Nd3+ has absorption spectrum 4I9/2 4G5/2 + 2G7/2 peaks that overlap with the 5D0 7F1 transition of Eu3+ [26, 27, 28] and Gd3+ has emission peaks for 6GJ 6PJ transitions in the same region [29], neither cation was detected using ICP-MS. The extra peaks also appear in samples decomposing from EFFA to EF, but in that case, they are lower in intensity than the = 0 peak (Supplementary Material).
The 5D0 7F1 and 5D0 7F2 transitions are frequently used to compare local coordination environments of Eu3+. The intensity of the induced electric dipole transition 5D0 7F2 is strongly dependent on the environment of Eu3+ while the magnetic dipole transition 5D0 7F1 is mostly independent of it [19]. As a result, an increase in the ratio of integrated intensities, I(5D0 7F2)/I(5D0 7F1), can indicate distortions from centrosymmetric geometry for Eu3+ [30]. Both experimental EF and EFFA structures contain Eu3+ ions in non-centrosymmetric sites ( symmetry in EF and in EFFA), so large values (2-4 [31, 32, 33]) of the parameter are expected. These values are shown in the = 2 column of Table 1. The site in EF, with its higher symmetry, shows a larger ratio than that of the ion in EFFA. The EFFA value of 2.0 exceeds that reported previously of 1.75 [10]. Although these values were obtained at different excitation wavelengths, they can be compared since the ratio’s excitation wavelength dependence is associated with site selective excitation arising from multiple Eu3+ sites in the material [34, 35, 36], and EFFA only has one Eu3+ crystallographic site.
| Compound | |||||
| EF | 0.0011 | 1.0 | 3.2 | 0.019 | 2.0 |
| (0.00026) | (-) | (0.14) | (0.0012) | (0.19) | |
| EFFA | 0.0010 | 1.0 | 2.0 | 0.066 | 1.6 |
| (0.00018) | (-) | (0.17) | (0.028) | (0.48) |
The appearance of the 5D0 7F3 transition for the two compounds is also notable. This transition is forbidden by the Judd-Ofelt rules for magnetic and electric dipole transitions, but crystal field induced J-mixing can lead to the transition’s presence in the spectrum [19, 37, 38]. For several compounds, the 7F3 state has been shown to mix with the 7F2 and 7F4 states [23, 38].
The hypersensitive 5D0 7F0 transition, although also forbidden, is allowed for Eu3+ ions with non-cubic, non-centrosymmetric site symmetries [30, 39]. Therefore, it can, by point symmetry, appear for EF and EFFA, but it has not been reported previously for either. In the spectra normalized to the maximum 5D0 7F2 peak height (Figure 4), the EFFA 5D0 7F0 peak appears approximately an order of magnitude larger than the one in EF. However, when more appropriately compared through a normalization to the integrated intensity of the environment independent 5D0 7F1 transition, the intensities of the 5D0 7F0 transitions in the two compounds are remarkably similar (Table 1).
3.3 Cryogenic Photoluminescence
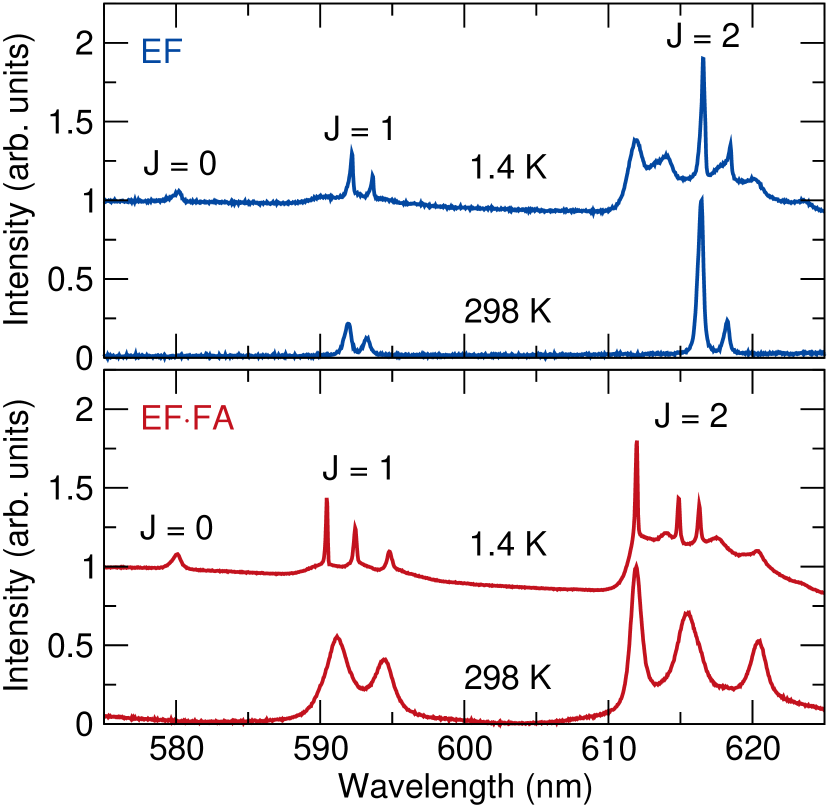
Photoluminescence emission spectra for both compounds were collected at 1.4 K in order to increase the intensity of the 5D0 7FJ transitions and to eliminate phonon broadening. Figure 5 shows these spectra along with room temperature spectra collected with the same mounting setup for comparison. Even at low laser power, the = 0 transition is clearly seen for both compounds. The integrated intensity of the transition’s peak relative to those of = 1 is now 0.11 for EF and EFFA, 100x larger than in the room temperature data in Table 1.
The EFFA peaks are noticeably less broad than at room temperature and have comparable widths to those of EF. This further confirms that EFFA’s broad room temperature spectrum is a product of phonon effects, which are mitigated at 1.4 K. Moreover, the improved resolution allows for the observation of additional splittings in the EFFA = 1 and = 2 peaks. The splitting of the = 1 peak is indicative of the site symmetry of the Eu3+ ion. The transition in EF has two components, as could be seen at room temperature, and the expected three components of the transition for EFFA [40] are now resolved at 1.4 K.
Both compounds experience peak shifts to longer wavelengths at 1.4 K. In other Eu3+ systems, as temperatures lower, 5D0 7FJ transition red-shifts are typically noted [41, 42, 43]. Here, for the most prominent = 2 peak for each compound in the 405 nm data (Figure 5), the shifts are +0.09 nm for EF and +0.04 nm for EFFA, quite small for both. To compare the = 0 peak positions, observed in the 532 nm room temperature and the 405 nm 1.4 K spectra, it must be noted that the 405 nm room temperature spectrum has a peak shift of +0.30 nm compared to the 532 nm room temperature data. This is likely due to a difference in the calibration techniques for the two instrument setups and needs to be accounted for when comparing the = 0 peak positions. Since the maxima of the = 0 peaks in the 532 nm room temperature data are at 579.19 nm for EF and 579.13 nm for EFFA and are at 580.20 nm (+1.01 nm) for EF and 580.11 nm (+0.98 nm) for EFFA in the 405 nm 1.4 K data, the corrected shifts are roughly +0.71 nm for EF and +0.68 nm for EFFA. The peak shifts, therefore, vary between the Eu3+ transitions but are fairly consistent between the two compounds.
3.4 Photoluminescence Lifetime
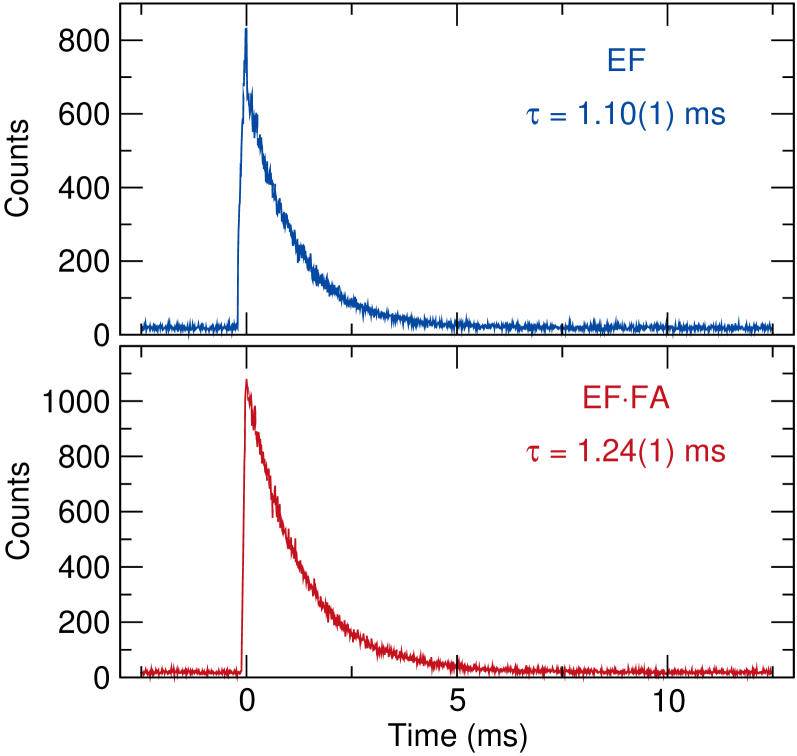
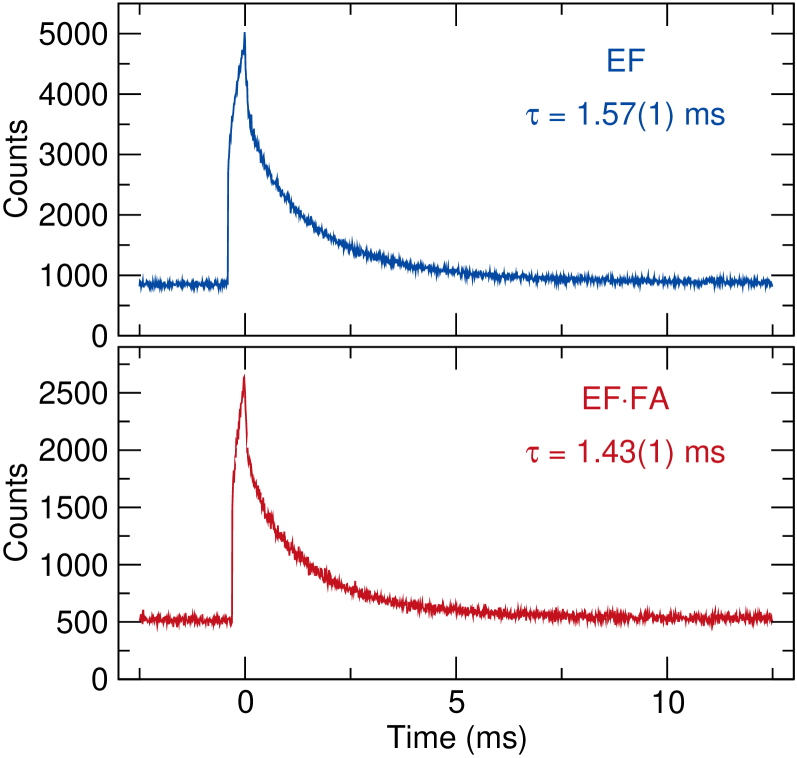
While a room temperature photoluminescence lifetime for EF’s 5D0 level has previously been reported as 1.06 ms [11], the cryogenic value has not been reported, and no lifetime measurements have been reported for EFFA. The room temperature lifetime of EuCl6H2O, the other stoichoimetric rare-earth crystal studied for QIS, is 0.130 ms [44]. Lifetime plots are shown in Figure 6.
Photoluminescence decay was observed using 405 nm excitation pulses where the pulse duration, , is short compared to the observed lifetime, . The excitation pulses were transmitted to the samples through a short-pass dichroic mirror. Photoluminescence emission from the materials was then collected from the dichroic mirror reflection, passed through a pair of 550 nm long-pass filters, and sent to a single-photon avalanche diode (SPAD) via coupling into a multi-mode fiber. The collected emission was then averaged over many cycles. Further details can be found in the Supplementary Material. The decay for both materials was fitted to a single-exponential with a vertical offset to account for background and dark counts.
The room temperature lifetime of EF, 1.100.01 ms, is similar to that reported previously, and the room temperature lifetime of EFFA is 1.240.01 ms. The cryogenic lifetimes for EF (1.570.01 ms) and for EFFA (1.430.01 ms) exceed by an order of magnitude the lifetime observed for EuCl6H2O below 4 K (0.1160.001 ms) but are shorter than its deuterium analog (2.6 ms) [14]. Both compounds show an increase in lifetime with decreasing temperature. An increase is common in Eu3+ compounds [45, 46, 47, 48, 49, 50, 51], but this trend is occasionally not consistent [52, 53], notably in the case of EuCl6H2O [14, 44].
3.5 Phase Stability
Both synthesis procedures produce phase pure crystals as confirmed by powder X-ray diffraction. Over time, however, with exposure to air, EFFA crystals form a film of EF on their surface, giving them a cloudy appearance before eventually appearing opaque (Figure 7). This transformation is also confirmed by single crystal X-ray diffraction, showing diffraction spots corresponding to EFFA and powder rings corresponding to EF (Supplementary Material).
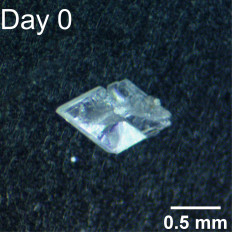
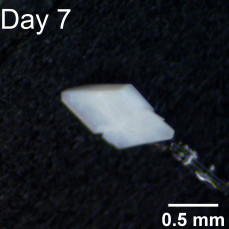
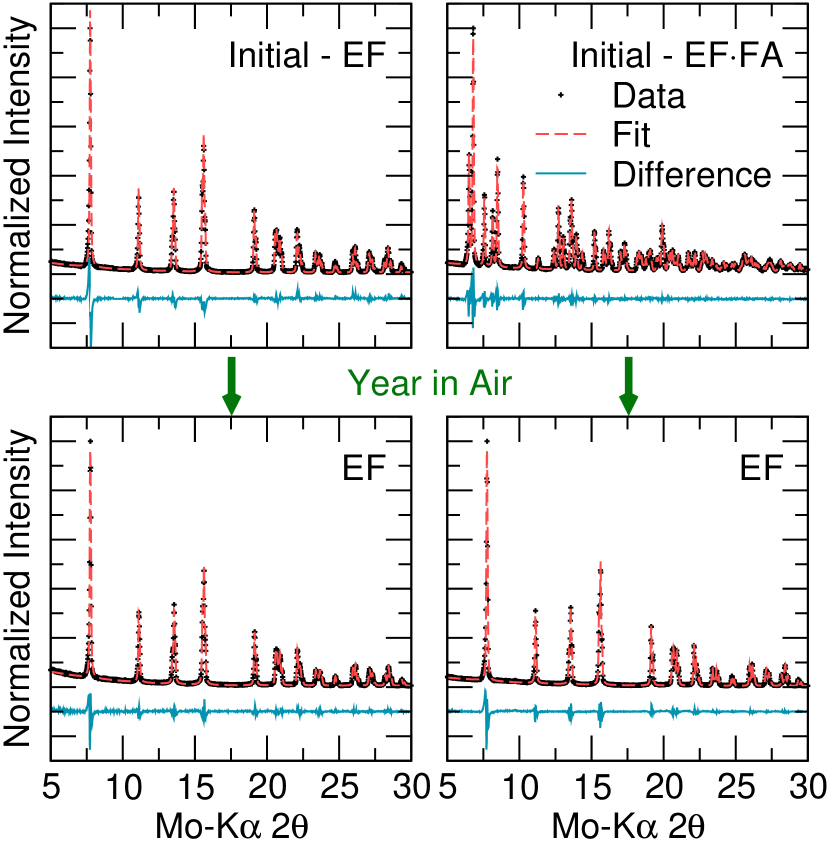
The complete structural transformation to EF is not immediate, but high humidity will cause significant changes in the material’s optical properties after only a day as the room temperature photoluminescence pattern shifts quickly from that of EFFA to that of EF. The decomposition of five crystals was monitored during storage in air at 50-55% relative humidity. In particular, the distinguishing I(5D0 7F2)/I(5D0 7F1) ratio, noted before for its sensitivity to crystal symmetry, was tracked as a measure of spectrum transformation. Full transformation of the emission spectrum occurred in a week. Plots and images detailing this transformation are provided in the Supplementary Material. Powder X-ray diffraction of crushed EFFA crystals stored in air showed a full phase transformation into EF after a year (Figure 8). The storage of EFFA in a desiccator or inert atmosphere prevents this decomposition into EF. On the other hand, EF remains stable over the same period of time.
4 Conclusions
Quick synthesis procedures were developed for forming faceted 0.2 mm crystals of EF and 1-3 mm crystals of EFFA. The first reported recording of the 5D0 7F0 transition was shown for EF and EFFA. Emission spectra at 1.4 K revealed a one hundred fold increase in the relative intensity of the transition and a reduction in phonon broadening effects for EFFA. The 5D0 7F0 peak for both materials shifted by roughly +0.7 nm upon cooling. The materials exhibit lifetimes of 1.57 ms and 1.43 ms at 1.4 K for EF and EFFA, respectively. The decomposition of the EFFA crystals into EF due to air exposure was shown and eliminated by storage in a desiccator or inert atmosphere. EF remains stable in air over time. Photoluminescence excitation and Raman heterodyne spectroscopy will be necessary to probe the materials’ 5D0 7F0 inhomogeneous width and hyperfine structures at cryogenic temperatures.
5 Acknowledgements
Research for this work was carried out in part in the Materials Research Laboratory Central Research Facilities, University of Illinois. This work is supported by the U.S. Department of Energy, Office of Science, National Quantum Information Science Research Centers. Z.W.R. was supported by a DIGI-MAT fellowship from the NSF DGE program, Award No. 1922758.
References
- [1] R. Ahlefeldt, A. Smith, M. Sellars, Ligand isotope structure of the optical 7f0 5d0 transition in eucl6h2o, Physical Review B 80 (20) (2009) 205106.
- [2] R. Ahlefeldt, M. Pearce, M. Hush, M. Sellars, Quantum processing with ensembles of rare-earth ions in a stoichiometric crystal, Physical Review A 101 (1) (2020) 012309.
- [3] M. Zhong, M. P. Hedges, R. L. Ahlefeldt, J. G. Bartholomew, S. E. Beavan, S. M. Wittig, J. J. Longdell, M. J. Sellars, Optically addressable nuclear spins in a solid with a six-hour coherence time, Nature 517 (7533) (2015) 177–180.
- [4] J. H. Wesenberg, K. Mølmer, L. Rippe, S. Kröll, Scalable designs for quantum computing with rare-earth-ion-doped crystals, Physical Review A 75 (1) (2007) 012304.
- [5] A. Kinos, D. Hunger, R. Kolesov, K. Mølmer, H. de Riedmatten, P. Goldner, A. Tallaire, L. Morvan, P. Berger, S. Welinski, et al., Roadmap for rare-earth quantum computing, arXiv preprint arXiv:2103.15743 (2021).
- [6] J. R. Everts, M. C. Berrington, R. L. Ahlefeldt, J. J. Longdell, Microwave to optical photon conversion via fully concentrated rare-earth-ion crystals, Physical Review A 99 (6) (2019) 063830.
- [7] C. Braggio, G. Carugno, F. Chiossi, A. D. Lieto, M. Guarise, P. Maddaloni, A. Ortolan, G. Ruoso, L. Santamaria, J. Tasseva, et al., Axion dark matter detection by laser induced fluorescence in rare-earth doped materials, Scientific Reports 7 (1) (2017) 1–9.
- [8] R. Ahlefeldt, M. R. Hush, M. Sellars, Ultranarrow optical inhomogeneous linewidth in a stoichiometric rare-earth crystal, Physical review letters 117 (25) (2016) 250504.
- [9] R. Ahlefeldt, D. McAuslan, J. Longdell, N. Manson, M. Sellars, Precision measurement of electronic ion-ion interactions between neighboring eu3+ optical centers, Physical review letters 111 (24) (2013) 240501.
- [10] P. Samarasekere, X. Wang, W. Kaveevivitchai, A. J. Jacobson, Reactions of rare earth hydrated nitrates and oxides with formamide: relevant to recycling rare earth metals, Crystal Growth & Design 15 (3) (2015) 1119–1128.
- [11] M. Zhao, Q. Fu, P. Du, Y. Hou, L. Luo, W. Li, Facile fabrication of thermal stable eu(hcoo)3 red-emitting crystals with high color purity for near-ultraviolet chip triggered white light-emitting diodes, Journal of Luminescence 213 (2019) 409–414.
- [12] C. R. Groom, I. J. Bruno, M. P. Lightfoot, S. C. Ward, The cambridge structural database, Acta Crystallographica Section B: Structural Science, Crystal Engineering and Materials 72 (2) (2016) 171–179.
- [13] A. Belsky, M. Hellenbrandt, V. L. Karen, P. Luksch, New developments in the inorganic crystal structure database (icsd): accessibility in support of materials research and design, Acta Crystallographica Section B 58 (3) (2002) 364–369.
- [14] R. Ahlefeldt, N. Manson, M. Sellars, Optical lifetime and linewidth studies of the 7f0 5d0 transition in eucl6h2o: A potential material for quantum memory applications, Journal of luminescence 133 (2013) 152–156.
- [15] H. Slebocka-Tilk, F. Sauriol, M. Monette, R. Brown, Aspects of the hydrolysis of formamide: revisitation of the water reaction and determination of the solvent deuterium kinetic isotope effect in base, Canadian journal of chemistry 80 (10) (2002) 1343–1350.
- [16] L. Gorb, A. Asensio, I. Tuñón, M. F. Ruiz-López, The mechanism of formamide hydrolysis in water from ab initio calculations and simulations, Chemistry–A European Journal 11 (22) (2005) 6743–6753.
- [17] G. I. Almerindo, J. R. Pliego Jr, Ab initio investigation of the kinetics and mechanism of the neutral hydrolysis of formamide in aqueous solution, Journal of the Brazilian Chemical Society 18 (4) (2007) 469–702.
- [18] S. Miyakawa, H. J. Cleaves, S. L. Miller, The cold origin of life: A. implications based on the hydrolytic stabilities of hydrogen cyanide and formamide, Origins of Life and Evolution of the Biosphere 32 (3) (2002) 195–208.
- [19] K. Binnemans, Interpretation of europium (iii) spectra, Coordination Chemistry Reviews 295 (2015) 1–45.
- [20] Y. Sohn, Photoluminescence imaging of eubo3, tbbo3, eu (iii)-box, and tb (iii)-box nanostructures, Ceramics International 40 (1) (2014) 2467–2475.
- [21] A. E. D’Achille, R. M. Wallace, J. L. Coffer, Morphology-dependent fluorescence of europium-doped cerium oxide nanomaterials, Nanoscale Advances (2021).
- [22] K. Driesen, V. Tikhomirov, C. Görller-Walrand, Eu3+ as a probe for rare-earth dopant site structure in nano-glass-ceramics, Journal of Applied Physics 102 (2) (2007) 024312.
- [23] P. Mohanty, S. Ram, Light emission associated with the 5d0 7f3 forbidden transition in eu3+ cations dispersed in an eu3+:al2o3 mesoporous structure, Philosophical magazine letters 86 (6) (2006) 375–384.
- [24] J. E. Muñoz-Santiuste, U. R. Rodríguez-Mendoza, J. González-Platas, V. Lavín, Structural study of the eu3+ environments in fluorozirconate glasses: Role of the temperature-induced and the pressure-induced phase transition processes in the development of a rare earth’s local structure model, The Journal of chemical physics 130 (15) (2009) 154501.
- [25] J. Wu, X. Lü, L. Zhang, Y. Xia, F. Huang, F. Xu, Crystallinity control on photocatalysis and photoluminescence of tio2-based nanoparticles, Journal of alloys and compounds 496 (1-2) (2010) 234–240.
- [26] A. Harmer, A. Linz, D. Gabbe, Fluorescence of nd3+ in lithium yttrium fluoride, Journal of Physics and Chemistry of solids 30 (6) (1969) 1483–1491.
- [27] A. Jose, T. Krishnapriya, T. A. Jose, C. Joseph, N. Unnikrishnan, P. Biju, Effective sensitization of eu3+ ions on eu3+/nd3+ co-doped multicomponent borosilicate glasses for visible and nir luminescence applications, Ceramics International 47 (5) (2021) 6790–6799.
- [28] P. Manasa, F. Ran, C. Basavapoornima, S. R. Depuru, C. Jayasankar, Optical characteristics of (eu3+, nd3+) co-doped leadfluorosilicate glasses for enhanced photonic device applications, Journal of Luminescence 223 (2020) 117210.
- [29] J. Zhong, H. Liang, Q. Su, J. Zhou, Y. Huang, Z. Gao, Y. Tao, J. Wang, Luminescence properties of nagd (po 3) 4: Eu 3+ and energy transfer from gd 3+ to eu 3+, Applied Physics B 98 (1) (2010) 139–147.
- [30] P. A. Tanner, Some misconceptions concerning the electronic spectra of tri-positive europium and cerium, Chemical Society Reviews 42 (12) (2013) 5090–5101.
- [31] G. Gao, N. Da, S. Reibstein, L. Wondraczek, Enhanced photoluminescence from mixed-valence eu-doped nanocrystalline silicate glass ceramics, Optics express 18 (104) (2010) A575–A583.
- [32] A. Prasad, A. Parchur, R. Juluri, N. Jadhav, B. Pandey, R. Ningthoujam, R. Vatsa, Bi-functional properties of fe3o4@ypo4:eu hybrid nanoparticles: hyperthermia application, Dalton transactions 42 (14) (2013) 4885–4896.
- [33] D. P. Volanti, I. L. Rosa, E. C. Paris, C. A. Paskocimas, P. S. Pizani, J. A. Varela, E. Longo, The role of the eu3+ ions in structure and photoluminescence properties of srbi2nb2o9 powders, Optical Materials 31 (6) (2009) 995–999.
- [34] I. E. Kolesnikov, A. V. Povolotskiy, D. V. Mamonova, E. Y. Kolesnikov, A. V. Kurochkin, E. Lähderanta, M. D. Mikhailov, Asymmetry ratio as a parameter of eu3+ local environment in phosphors, Journal of Rare Earths 36 (5) (2018) 474–481.
- [35] U. Rambabu, S.-D. Han, Luminescence optimization with superior asymmetric ratio (red/orange) and color purity of mbo3:eu3+@sio2 (m= y, gd and al) nano down-conversion phosphors, RSC Advances 3 (5) (2013) 1368–1379.
- [36] A. Szczeszak, S. Lis, V. Nagirnyi, Spectroscopic properties of eu3+ doped ybo3 nanophosphors synthesized by modified co-precipitation method, Journal of Rare Earths 29 (12) (2011) 1142–1146.
- [37] X. Chen, G. Liu, The standard and anomalous crystal-field spectra of eu3+, Journal of Solid State Chemistry 178 (2) (2005) 419–428.
- [38] J. Lowther, Spectroscopic transition probabilities of rare earth ions, Journal of Physics C: Solid State Physics 7 (23) (1974) 4393.
- [39] K. Binnemans, C. Görller-Walrand, Application of the eu3+ ion for site symmetry determination, Journal of rare earths 14 (3) (1996) 173–180.
-
[40]
J.-C. G. Bünzli, S. V. Eliseeva,
Basics of lanthanide
photophysics, in: P. Hänninen, H. Härmä (Eds.), Lanthanide
Luminescence: Photophysical, Analytical and Biological Aspects, Springer,
Berlin, Heidelberg, 2011, Ch. 6.1, p. 39.
doi:10.1007/4243_2010_3.
URL https://doi.org/10.1007/4243_2010_3 - [41] H. Arashi, M. Ishigame, Diamond anvil pressure cell and pressure sensor for high-temperature use, Japanese Journal of Applied Physics 21 (11R) (1982) 1647.
- [42] K.-H. Hellwege, H. Kahle, Spektrum und struktur kristalliner europiumsalze, Zeitschrift für Physik 129 (1) (1951) 62–84.
- [43] H. Kusama, O. J. Sovers, T. Yoshioka, Line shift method for phosphor temperature measurements, Japanese Journal of Applied Physics 15 (12) (1976) 2349.
- [44] J. Freeman, G. Crosby, K. Lawson, The effect of deuterium on the luminescence decay times of solvated rare earth chlorides, Journal of Molecular Spectroscopy 13 (1-4) (1964) 399–406.
- [45] M. T. Berry, P. S. May, H. Xu, Temperature dependence of the eu3+ 5d0 lifetime in europium tris(2,2,6,6-tetramethyl-3,5-heptanedionato), The Journal of Physical Chemistry 100 (22) (1996) 9216–9222.
- [46] N. Katumo, G. Gao, F. Laufer, B. S. Richards, I. A. Howard, Smartphone-based luminescent thermometry via temperature-sensitive delayed fluorescence from gd2o2s:eu3+, Advanced Optical Materials 8 (19) (2020) 2000507.
- [47] Y. Kitagawa, J. Ueda, K. Fujii, M. Yashima, S. Funahashi, T. Nakanishi, T. Takeda, N. Hirosaki, K. Hongo, R. Maezono, et al., Site-selective eu3+ luminescence in the monoclinic phase of ysio2n, Chemistry of Materials 33 (22) (2021) 8873–8885.
- [48] S. Murakami, M. Herren, D. Rau, M. Morita, Photoluminescence and decay profiles of undoped and fe3+, eu3+-doped plzt ceramics at low temperatures down to 10 k, Inorganica Chimica Acta 300 (2000) 1014–1021.
-
[49]
M. G. Nikolić, D. J. Jovanović, M. D. Dramićanin,
Temperature
dependence of emission and lifetime in eu3+- and dy3+-doped
gdvo4, Appl. Opt. 52 (8) (2013) 1716–1724.
doi:10.1364/AO.52.001716.
URL http://opg.optica.org/ao/abstract.cfm?URI=ao-52-8-1716 - [50] D. Sevic, M. Rabasovic, J. Krizan, S. Savic-Sevic, M. Nikolic, B. Marinkovic, M. Rabasovic, Yvo4:eu3+ nanopowders: multi-mode temperature sensing technique, Journal of Physics D: Applied Physics 53 (1) (2019) 015106.
- [51] G. A. West, N. S. Clements, A comparison of the eu3+ temperature dependent emission lifetimes in sc2o3, y2o3 and gd2o3 host crystals, Journal of luminescence 54 (4) (1992) 245–248.
- [52] B. Deng, S. Liu, C.-s. Zhou, H. Liu, J. Chen, R. Yu, Eu3+-activated gd8v2o: energy transfer, luminescence, and temperature-dependence characteristics, Chemistry–A European Journal 24 (45) (2018) 11627–11636.
- [53] J. Grigorjevaite, A. Katelnikovas, Luminescence and luminescence quenching of k2bi(po4)(moo4):eu3+ phosphors with efficiencies close to unity, ACS applied materials & interfaces 8 (46) (2016) 31772–31782.