The Extended Tidal Tails of NGC 7089 (M2)
Abstract
Using photometry and proper motions from Gaia Early Data Release 3, we detect a -long trailing stellar debris stream associated with the old, metal-poor globular cluster NGC 7089. With a width on the order of 100 pc, the extended stream appears to be as dynamically cold as the coldest known streams found to date. There is some evidence for an extended leading tail extending between and from the cluster, though the greater distance of this tail, combined with proper motions that are virtually indistinguishable from those of foreground stars, make the detection much less certain. The proper motion profile and the path on the sky of the trailing tail are not well matched using a simple Galactic potential comprised purely of a disk, bulge, and spherical halo. However, the addition of a moving, massive (M ) Large Magellanic Cloud brings the model predictions into much better agreement with the observables. We provide tables of the most highly ranked candidate stream stars for follow-up by ongoing and future spectroscopic surveys.
Subject headings:
Galaxy: Structure — Galaxy: Halo — Globular Clusters: general — Globular Clusters: individual (NGC 7089)1. Introduction
The inner Galactic halo is now known to be populated with dozens of stellar debris streams (Grillmair & Carlin, 2016; Shipp et al., 2018; Malhan et al., 2018; Ibata et al., 2019; Palau & Miralda-Escude, 2019; Ibata et al., 2021). Many of these streams are relatively narrow, with physical widths on the order of 100 pc, and they are consequently assumed to have been produced by globular clusters.
With episodic stripping and consequent variations in stream density, tidal tails extending from extant globular clusters may be somewhat problematic for detecting signatures of dark matter subhalos (Küpper et al., 2012). On the other hand, by providing well-characterized progenitors, such tidal tails will be useful for understanding the detailed physics of tidal stripping (Balbinot & Gieles, 2018), the accretion sequence of the halo, and the shape of the Galactic potential (Bovy et al., 2016; Price-Whelan et al., 2014; Malhan & Ibata, 2019; Garavito-Camargo et al., 2021). Longer streams and streams on more eccentric orbits are particularly sensitive to the shape of the halo potential (Bonaca, 2018). To extract as much information as possible, it would therefore be desirable to trace known streams for as far along their trajectories as possible.
With the third data release (EDR3) of the Gaia catalog (Gaia Collaboration et al., 2021) we now have considerably more information for sorting stars into substructures. Malhan & Ibata (2018), Malhan et al. (2018), Ibata et al. (2019), and Ibata et al. (2021) have applied their STREAMFINDER orbital integration technique to dozens of halo streams that would have been impossible to detect with the purely photometric techniques of a few years ago. Here we use an alternative, more directed method to increase the known extent of the tidal tails of the globular cluster NGC 7089. The extended envelope and incipient tidal tails of NGC 7089 were first detected by Grillmair et al. (1995) and were among the strongest detections in their sample. Kuzma et al. (2016) subsequently extended these results to nearly two degrees, several times the nominal tidal radius of the cluster. Most recently, tidal tails extending between and were detected by Ibata et al. (2021) using Gaia EDR3 and STREAMFINDER.
Section 2 describes our method, which largely mirrors that used by Grillmair (2019) to detect the extended trailing tail of M5. We discuss the apparent trajectories of the tails in Section 3, where we also provide tables of our highest ranked stream star candidates. We make concluding remarks in Section 4.
2. Analysis
Our analysis closely follows that of Grillmair (2019) as applied to the globular cluster M5, combining color-magnitude and proper motion filtering with orbit integrations and predictions based on modeling the stripping of stars from NGC 7089. Here we made use of Gaia EDR3 (Gaia Collaboration et al., 2021), whose proper motion uncertainties are reduced by a factor of compared with Gaia Data Release 2. We computed the expected proper motions and trajectories on the sky using the Galactic model of Allen & Santillan (1991), coded in the IDL language and updated using the parameters of Irrgang et al. (2013). While this model is fairly simple, assuming a Miyamoto-Nagai disk (Miyamoto & Nagai, 1975), a spherical bulge, and a spherical halo, our experience using it with other clusters (e.g. Grillmair (2019)) suggests that it provides reasonable approximations for actual cluster orbits in the inner halo. With the updated parameters the model predicts M(R kpc) , which is slightly more than the M(R kpc) predicted by the Wilkinson & Evans (1999) model, though considerably less than the M(R kpc) predicted by the Navarro et al. (1997) model.
Recent investigations (Kallivayalil et al., 2013; Erkal et al., 2019; Shipp et al., 2021) suggest that the Large Magellanic Cloud (LMC) is considerably more massive than previously supposed and may be a significant perturber of satellite orbits. As an experiment we consequently augmented our Galactic potential with a moving LMC, modeled as a point mass with (Shipp et al., 2021), arriving at its present location on a first pass. The LMC trajectory was modeled as a fall from kpc, slowed by dynamical friction (Chandrasekhar, 1943) according to the local density of stars and dark matter along its orbit. While the stellar/dark matter wake of the LMC is believed to be quite substantial (Conroy et al., 2021; Garavito-Camargo et al., 2021), we have not attempted to model it as an additional perturber on the orbit of NGC 7089.
For modeling the orbit of NGC 7089 and the motions of associated stream stars, we used a cluster distance of 11.693 kpc (Baumgardt & Vasiliev, 2021), cluster proper motions of mas/yr and mas/yr (Vasiliev & Baumgardt, 2021), and a radial (line-of-sight) velocity of -3.72 km sec-1 (Vasiliev, 2019). We computed the predicted trajectories of the tidal tails by modeling the release of stars from the cluster over time (Küpper et al., 2015; Bowden et al., 2015; Dai et al., 2018). Specifically, the model tails were generated by releasing stars from the cluster at a rate proportional to , where is the Galactocentric radius of the cluster at any point in time. Escaping stars were simply placed at the current pc tidal radius of the cluster (Harris, 1996), both at the L1 and L2 points, and then integrated independently along their individual orbits. Orbit integrations were typically run for the equivalent of 4 Gyrs to provide tidal tails long enough to cover our field of interest. Running such integrations for 10 Gyrs produced essentially identical trajectories but generated many overlapping streams and scattered stars that only served to complicate our analysis.
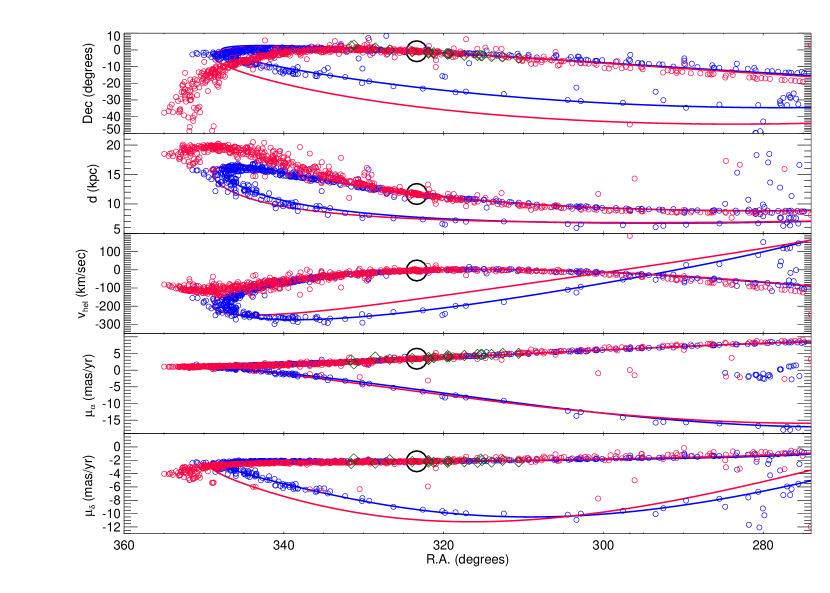
The results of our modeling are shown in Figure 1. Of particular note are the effects on cluster orbits and stream models of a massive LMC. It is also interesting that, without a perturbing LMC, the tidal tails closely follow the orbit of the cluster itself. On the other hand, including a massive LMC produces significant departures between the tails and the similarly integrated orbit of the cluster. Additional models were run without a massive LMC and varying the cluster proper motions, radial velocity, and distance over their respective uncertainty ranges. However, the results departed only very slightly from the unperturbed models shown in Figure 1. The differences between the perturbed and unperturbed models dwarf the variations that could be attributed to the reported uncertainties in the observables.
Also shown in Figure 1 are the stream stars detected by Ibata et al. (2021) with STREAMFINDER. These stars match the predictions of our modeling quite well but, due to their limited extent from the cluster, do not appear to favor one model over the other. This underscores the value of streams that trace an appreciable fraction of their orbits, and extending NGC 7089’s tidal tails considerably in both directions should provide us with another powerful and sensitive probe of the Galactic potential.
To reduce contamination by foreground stars, we limited our analysis to stars with , which for NGC 7089 encompasses the upper main sequence, the turn-off region, and the subgiant branch. While the quality of the photometry improves significantly up the red giant branch (RGB), the RGB colors overlap those of the much larger population of foreground stars. Experiments that included the RGB in our filtering yielded significantly noisier results. For stars fainter than , the Gaia photometry and proper motion uncertainties become large enough that we again saw noticeably noisier results.
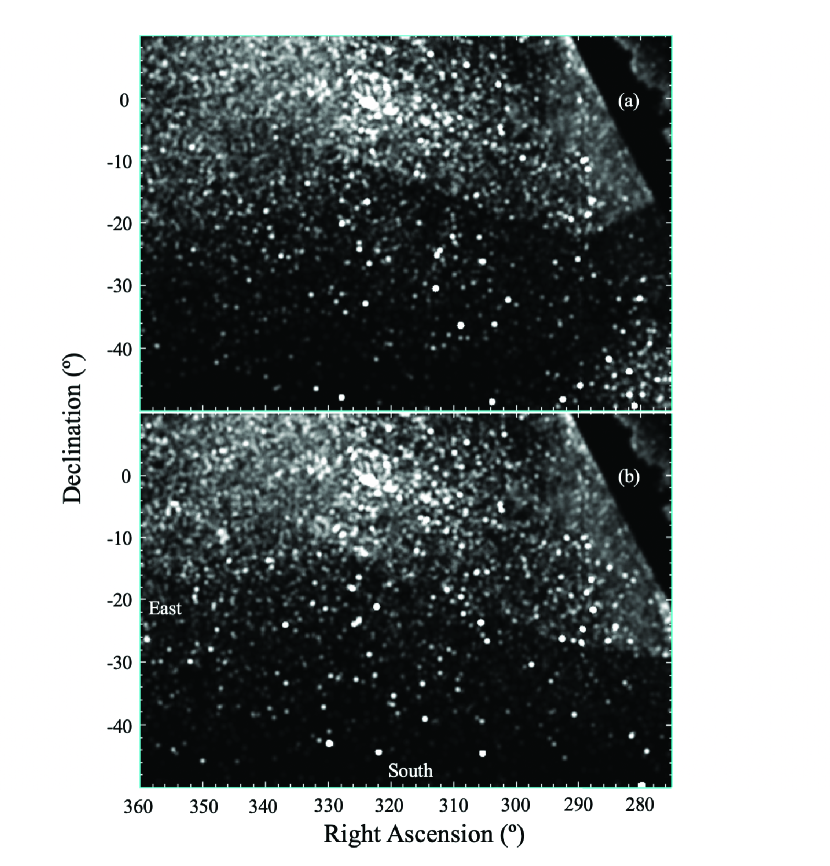
We used a modified form of the matched filter described by Rockosi et al. (2002) and Grillmair (2009). Specifically, we weighted stars both by their position in the extinction-corrected color-magnitude diagram of NGC 7089 and by their departures from the predicted proper motion profiles shown in Figure 1. The Gaia photometry was corrected for extinction using the reddening maps of Schlegel et al. (1998), themselves corrected using the prescription of Schlafly & Finkbeiner (2011), and using the Gaia DR2 coefficients derived by Gaia Collaboration et al. (2018). Since the proper motions at any given R.A. are not unique, we additionally imposed the predicted trajectories of the leading and trailing arms on the sky so that the proper motion filtering applied to any particular star would depend on which arm it is closest to. We then summed the resulting filter signals by sky position to produce the weighted surface density maps shown in Figure 2.
3. Discussion
Figure 2 shows a fairly convincing “string of pearls” extending to the southwest of NGC 7089 to [R.A., Dec] = []. Using proper motion profiles based purely on the Allen & Santillan (1991) model, this trailing stream is visible, but somewhat muted compared with the results we obtain when we include a moving, massive, LMC. Using a range of LMC masses, from to did not noticeably improve the resulting signal strength or length of the stream. As our goal is not to try to constrain the mass of the LMC but simply to identify stars in the extended tidal tails of NGC 7089, we adopted determined by Shipp et al. (2021) for all subsequent analyses.
The various portions of the trailing tail are visible only over a limited range of assumed distance moduli, strengthening and subsiding with increasing distance in the manner we would expect from the photometric uncertainties. The narrowness of the trailing tail (FWHM pc) indicates a dynamically cold structure comparable with the Pal 5 and GD-1 streams (Odenkirchen et al., 2001, 2009; Grillmair & Dionatos, 2006; Malhan & Ibata, 2019; Gialluca et al., 2021). Though we attempted to trace the trailing tail across the Galactic plane to the northern Galactic hemisphere, we were unable to find an unambiguous continuation of the stream.
The western end of the trailing tail sits about south of the predicted trajectory with no perturbing LMC. However, the addition of a first-pass, massive LMC brings the trailing stream model into excellent agreement with the observed tail. While the extended potential of the Galaxy is now thought to be quite complicated and far from axisymmetric (Garavito-Camargo et al., 2021), the relatively simple Galactic model of Allen & Santillan (1991), combined with a massive, moving LMC, is evidently sufficiently accurate for predictive work in the inner regions of the Galaxy.
To the northeast of NGC 7089, the leading tail is considerably less obvious. This is presumably because () the expected distance of this portion of the stream ( kpc) is significantly greater than that of NGC 7089, thereby substantially reducing the number of stream stars brighter than our limit, and () the predicted proper motions of stream stars become nearly zero and thus very similar to those of the much larger population of field stars.
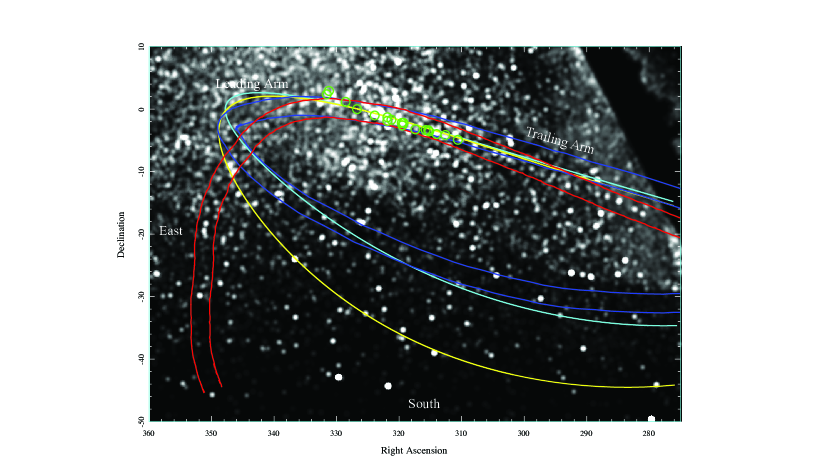
There is a tenuous cloud of signals at [R.A., dec] [] that corresponds roughly with the expected apogalactic bend in NGC 7089’s orbit computed either with or without a massive LMC, as well as the stream model computed without a massive LMC. However, there is also a very tenuous feature within the bounds of the model stream trajectory computed with a moving, massive LMC. This is more easily seen in Figure 3, where we show the filtered image in Figure 2 overlaid with the trajectories shown in Figure 1. While our sampling of stream stars is limited by our magnitude cut-off, we should still be benefitting from the expected orbital convergence of stars at apogalacticon. Our stream models indicate that the surface density of stars should be more than five times higher near apogalacticon than it is over the observed length of the trailing tail. Taking a typical globular cluster luminosity function, this overdensity should effectively overcome the loss of the faintest magnitudes of our sample. However, the much increased contamination by field stars with similar proper motions appears to have effectively nullified this enhancement.
There is an interesting, relatively strong, triple-lobed signal at [R.A., Dec]=[], lying along both the cluster orbit and the model stream computed using a high-mass LMC, that could conceivably be part of the leading tail. If we regard this feature as a legitimate stream signal then the arc length of the leading tail as measured from the cluster would be along the orbit of NGC 7089, and along the stream model.
We see no signs of a leading stream extending significantly past apogalacticon, along the infalling portion of the orbit. Though these stars are expected to be at distances of between 6 and 10 kpc and therefore well within our reach, it may be that their surface density is simply too low to be apparent in Figure 2. These stars would be accelerating towards perigalacticon, reducing their surface density by a substantial factor. The stream models in Figure 1 show that in each case, this infalling portion of the orbit is significantly depleted, with virtually no stars evident for the LMC-perturbed stream model. While certain individual peaks in Figure 2 may indeed belong to the NGC 7089’s leading tail, their surface density is very low and not noticeably different from that of the surrounding field.
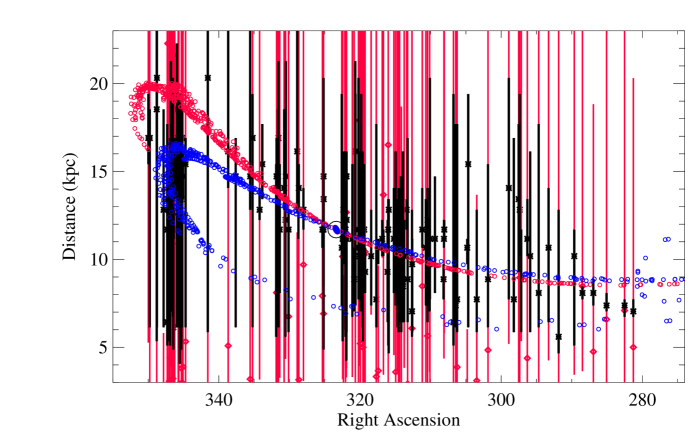
Our matched-filtering ensures that the stars with the strongest signals have colors, magnitudes, and proper motions close our expectations. The agreement between the trajectory of the trailing tail and the massive-LMC stream model is reassuring, and supports the hypothesis that the LMC is both massive and consequential for the motions of stars in the inner halo. However, Figures 2 and 3 by themselves do not readily convey the uncertainties remaining. Figure 4 compares the distances of our candidate stars, estimated both photometrically and using Gaia EDR3 parallaxes, with the distances predicted by our stream models. The photometric distances were estimated by shifting NGC 7089’s locus brightwards and faintwards until the colors and magnitudes of individual stream candidates matched that of the locus at some point along its length. This would often occur at two points along the locus, depending on whether the star was on the main sequence or the subgiant branch. In these cases we would look to the EDR3 parallax measurements to resolve the ambiguity. Since we want to compare distances for individual stars, we estimated distance using . In many cases the uncertainties in the parallax measurements were too large to be informative, and in those cases we simply chose the distance that best matched the predictions of our model.
Our estimated distances generally agree to within with both model predictions. On the other hand the five western-most stars appear to depart systematically from both the unperturbed and LMC-perturbed models, lying between 1 and 2 kpc (0.3 to 0.5 mag) closer to us than the models would suggest. This may be due to inadequacies in our assumed potential near the Galactic center (the lack of a Galactic bar, for example), or it may be that these stars are in a chance alignment and are not in fact part of the stream. Radial velocity measurements will be required to resolve this ambiguity.
A positional match of our highest-weighted stars with the Sloan Digital Sky Survey Data Release 15 (Aguado et al., 2018) as well as the LAMOST Data Release 6 (Zhao et al., 2012) did not yield any radial velocity measurements outside the immediate environs of NGC 7089. To aid in radial velocity follow-up, Tables 1 and 2 list the stars with the highest matched-filter signals in each of the trailing and leading tails, respectively. We applied a signal strength threshold to keep the tables to a manageable size while still capturing the entire extent of the trailing tail in Figure 2. The leading tail candidates include both stars in the putative apogalactic cloud and in the more southerly arm predicted using the LMC-perturbed stream model. Identifying bona fide stream stars at or near apogalacticon is especially important as they are particularly sensitive to the size and shape of the halo potential (Bonaca, 2018). The positions and proper motions of all stars in Tables 1 and 2 are plotted in Figure 5. We note that of the 18 stars designated potential stream stars by Ibata et al. (2021), only four are contained in Tables 1 and 2. Four of their stars fall below our 18.3 magnitude cutoff and one falls outside our region of interest (i.e. within of the cluster itself). The remaining nine stars are in our larger sample, but their relative signal strengths fall below our chosen threshold. This is presumably due to differences in the model potentials employed here and in Ibata et al. (2021) to integrate orbits.
If we consider only the 60 stars in Table 1 with R.A. , scaling the proper motions using the distances predicted by our model, and removing a linear fit to the resulting velocity profile, we find an error-weighted, two-dimensional velocity dispersion of km sec-1. If we limit the sample to only the 20 stars with the highest filter signal strengths, we find km sec-1. These values are somewhat larger than the km sec-1 3-d velocity dispersions typical of other cold streams and suggest that our sample as a whole suffers from at least some contamination by field stars. Radial velocity measurements will be needed to remove these contaminants.
4. Conclusions
Using Gaia EDR3 photometry and proper motion measurements we have detected a -long stream of metal-poor stars that we believe to be the trailing tidal tail of the globular cluster NGC 7089. The detection was made possible by the fact that the proper motions expected based on NGC 7089’s orbit are significantly different from those of most foreground stars in the vicinity. The trajectory of the trailing tail departs significantly from the integrated orbit of the cluster, but is in good agreement with a model stream that has been perturbed by the arrival of a massive LMC.
We cannot conclude from this that the departure of the trailing tail from its predicted path in an unperturbed potential must be entirely due to the arrival of the LMC. As the perigalacticon of the orbit lies less than 2 kpc from the center of the Galaxy, the path of the stream could conceivably have been modified by the bar (Price-Whelan et al., 2016; Sesar et al., 2016) or by interactions with Giant Molecular Clouds (Amorisco et al., 2016). The stream’s current trajectory could also be a consequence of tidal evolution of the cluster (Malhan et al., 2021) while still orbiting its Gaia-Enceladus parent galaxy (Massari et al., 2019) prior to its accretion by the Galaxy. Finally, we cannot rule out interactions with other halo globular clusters, though such interactions would tend to produce gaps or spurs rather than wholesale shifts in the trajectory.
The signal from the leading tidal tail is much less convincing, owing to both its greater distance and to proper motions that are predicted to be virtually identical to those of field stars. By reducing the proper motion and parallax uncertainties at fainter magnitudes, Gaia DR3 and DR4 should be able to significantly reduce this degeneracy.
Verification of stream membership will require follow-up radial velocity measurements. If even a few of the most outlying candidates can be confirmed as having once belonged to NGC 7089, our modeling suggests that this stream will become a particularly sensitive probe of the shape of the halo potential in this Galactic quadrant, and a significant contributor to our understanding of the influence of the LMC and other components of the Galaxy.
References
- Aguado et al. (2018) Aguado et al. 2018, ApJS, 240, 23
- Allen & Santillan (1991) Allen, C., & Santillan, A. 1991, Rev. Mex. Astron. Astrofis., 22, 255
- Amorisco et al. (2016) Amorisco, N. C. et al. 2016, MNRAS, 463, 17
- Balbinot & Gieles (2018) Balbinot, E. & Gieles, M. 2018, MNRAS, 474, 2479
- Baumgardt & Vasiliev (2021) Baumgardt, H. & Vasiliev, E. 2021, MNRAS, 505, 5957
- Bonaca (2018) Bonaca, A., & Hogg, D. W. 2018, ApJ, 867, 101
- Bovy et al. (2016) Bovy, J., Bahmanyar, A., Fritz, T. K., & Kallivayalil, N. 2016, ApJ, 833, 31
- Bowden et al. (2015) Bowden, A., Belokurov, V., & Evans, N. W. 2015, /mnras, 449, 1391
- Chandrasekhar (1943) Chandrasekhar, S. 1943, ApJ, 98, 54
- Conroy et al. (2021) Conroy, C. et al. 2021, Nature, 592, 534
- Dai et al. (2018) Dai, B., Robertson, B. E., & Madau, P. 2018, ApJ, 858, 73
- Erkal et al. (2019) Erkal, D., Belokurov, C., Laport, C. F. P. et al. 2019, MNRAS, 487, 2685
- Gaia Collaboration et al. (2021) Gaia Collaboration, Brown, A. et al. 2021, A&A, 649, 1
- Gaia Collaboration et al. (2018) Gaia Collaboration, Babusiaux, C., van Leeuwen, F. et al. 2018, A&A, 616, A10
- Garavito-Camargo et al. (2021) Garavito-Camargo, N. et al. 2021, ApJ, 919, 109
- Gialluca et al. (2021) Gialluca, M. T., Naidu, R. P., & Bonaca, A. 2021, ApJ, 911, 32
- Grillmair & Dionatos (2006) Grillmair, C. J. & Dionatos, O. 2006, ApJ, 639, 17
- Grillmair (2009) Grillmair, C. J. 2009, ApJ, 694, 1118
- Grillmair (2019) Grillmair, C. J. 2019, ApJ, 884, 174
- Grillmair et al. (1995) Grillmair, C. J., Freeman, K. C., Irwin, M., & Quinn, P. J. 1995, AJ, 109, 2553
- Grillmair & Carlin (2016) Grillmair, C. J., & Carlin, J. L. 2016, in Tidal Streams in the Local Group and Beyond, H. J. Newberg & J. L. Carlin eds., Springer
- Harris (1996) Harris, W. E., 1996, AJ, 112, 1487
- Ibata et al. (2019) Ibata, R. A., Malhan, K., & Martin, N. F. 2019, ApJ, 872, 152
- Ibata et al. (2021) Ibata, R. A. et al. 2021, ApJ, 914, 1231
- Irrgang et al. (2013) Irrgang, A., Wilcox, B., Tucker, E., & Schiefelbein, L. 2013, å, 549, 137
- Kallivayalil et al. (2013) Kallivayalil, N. et al. 2013, ApJ, 764, 161
- Küpper et al. (2012) Küpper, A. H. W., Lane, R. R., & Heggie, D. C. 2012, MNRAS, 420, 2700
- Küpper et al. (2015) Küpper, A. H. W., et al. 2015, ApJ, 803, 80
- Kuzma et al. (2016) Kuzma, P. B., Da Costa, G. S., Mackey, A. D., & Roderick, T. A. 2016, MNRAS, 461, 3639
- Malhan & Ibata (2018) Malhan, K. & Ibata, R. A. 2018, MNRAS, 477, 4063
- Malhan et al. (2018) Malhan, K., Ibata, R. A., & Martin, N. F. 2018, MNRAS, 481, 3442
- Malhan & Ibata (2019) Malhan, K. & Ibata, R. A., 2019, MNRAS, 486, 2995
- Malhan et al. (2019) Malhan, K., et al. 2019, ApJ, 881, 106
- Malhan et al. (2021) Malhan, K., Valluri, M., & Freese, K. 2021, MNRAS, 501, 179
- Massari et al. (2019) Massari, D., Koppelman, H. H., & Helmi, A. 2019, A&A, 630, 4
- Miyamoto & Nagai (1975) Miyamoto, M. & Nagai, R., 1975, Pub.Astr.Soc.Japan, 27, 533
- Navarro et al. (1997) Navarro, J. F., Frenk, C. S., & White, S. D. M., 1997, ApJ, 490, 493
- Odenkirchen et al. (2001) Odenkirchen, M. et al. 2001, ApJ, 548, 165
- Odenkirchen et al. (2009) Odenkirchen, M. et al. 2009, AJ, 137, 3378
- Palau & Miralda-Escude (2019) Palau, C. G. & Miralda-Escude, J. 2019, arXiv: 1905.01193
- Price-Whelan et al. (2014) Price-Whelan, A. M. et al. 2014, ApJ, 794, 4
- Price-Whelan et al. (2016) Price-Whelan, A. M. et al. 2016, ApJ, 824, 104
- Rockosi et al. (2002) Rockosi, C. M., Odenkirchen, M., Grebel, E. K. et al. 2002, AJ, 124, 349
- Schlafly & Finkbeiner (2011) Schlafly, E. F., & Finkbeiner, D. P. 2011, ApJ, 737, 103
- Schlegel et al. (1998) Schlegel, D. J., Finkbeiner, D. P., & Davis, M. 1998, ApJ, 500, 525
- Sesar et al. (2016) Sesar, B. et al. 2016, ApJ, 816, 4
- Shipp et al. (2018) Shipp, N., Drlica-Wagner, A., Balbinot, E. et al. 2018, ApJ862, 114
- Shipp et al. (2021) Shipp, N. Erkal, D., Drlica-Wagner, A. et al. 2021, ApJ, 923, 149
- Vasiliev (2019) Vasiliev, E. 2019, MNRAS, 484, 2832
- Vasiliev & Baumgardt (2021) Vasiliev, E., & Baumgardt. H., 2021, MNRAS, 505, 5978
- Wilkinson & Evans (1999) Wilkinson, M. I., & Evans, N. W., 1999, MNRAS, 310, 645
- Zhao et al. (2012) Zhao, G. et al. 2012, arXiv:1206.3569

| No. | R.A. (J2016) | dec (J2016) | (mas yr-1) | (mas yr-1) | Relative Weight | ||
|---|---|---|---|---|---|---|---|
| 1 | 281.2847 | -16.8027 | 17.912 | 1.149 | 8.431 0.141 | -1.340 0.116 | 0.62 |
| 2 | 282.5242 | -16.0834 | 18.799 | 1.269 | 8.141 0.265 | -1.405 0.245 | 0.33 |
| 3 | 285.0792 | -14.8886 | 18.075 | 1.126 | 7.701 0.149 | -1.257 0.124 | 0.85 |
| 4 | 286.9467 | -14.0203 | 18.071 | 1.110 | 7.754 0.166 | -1.411 0.142 | 0.55 |
| 5 | 288.4917 | -13.6707 | 18.251 | 0.943 | 7.103 0.185 | -1.531 0.165 | 0.26 |
| 6 | 289.6521 | -12.8711 | 19.106 | 0.832 | 7.588 0.258 | -1.678 0.224 | 0.22 |
| 7 | 291.8608 | -12.6001 | 19.334 | 0.923 | 6.946 0.394 | -1.563 0.336 | 0.26 |
| 8 | 293.2917 | -12.1231 | 19.608 | 0.835 | 7.197 0.448 | -1.941 0.370 | 0.16 |
| 9 | 294.6858 | -11.3475 | 19.894 | 0.875 | 6.630 0.613 | -1.702 0.564 | 0.14 |
| 10 | 295.8914 | -11.2883 | 19.781 | 0.858 | 6.773 0.509 | -1.641 0.410 | 0.15 |
| 11 | 296.3004 | -11.5659 | 18.683 | 1.004 | 6.769 0.270 | -1.965 0.197 | 0.27 |
| 12 | 297.1597 | -10.7432 | 19.245 | 0.830 | 7.046 0.340 | -1.716 0.180 | 0.08 |
| 13 | 297.3797 | -10.6547 | 18.688 | 1.106 | 6.096 0.265 | -1.607 0.155 | 0.22 |
| 14 | 297.5283 | -10.4981 | 20.264 | 0.835 | 6.851 0.712 | -1.708 0.481 | 0.07 |
| 15 | 298.2094 | -10.3495 | 19.810 | 0.892 | 6.209 0.516 | -1.662 0.308 | 0.19 |
| 16 | 298.9180 | -9.5097 | 20.168 | 0.791 | 6.405 0.696 | -1.522 0.436 | 0.11 |
| 17 | 301.8697 | -8.5042 | 19.593 | 0.774 | 5.993 0.436 | -1.667 0.364 | 0.26 |
| 18 | 303.4628 | -7.4861 | 19.156 | 0.710 | 5.585 0.284 | -1.913 0.195 | 0.70 |
| 19 | 304.6718 | -6.9360 | 19.739 | 0.694 | 5.397 0.408 | -2.189 0.328 | 0.08 |
| 20 | 304.8095 | -7.1719 | 18.757 | 0.732 | 5.399 0.233 | -1.948 0.187 | 0.63 |
| 21 | 306.2461 | -5.9585 | 19.610 | 0.745 | 5.401 0.517 | -1.573 0.370 | 0.11 |
| 22 | 306.4382 | -6.2603 | 19.612 | 0.748 | 5.659 0.419 | -2.278 0.341 | 0.09 |
| 23 | 306.7650 | -6.0792 | 19.593 | 0.784 | 4.906 0.409 | -2.046 0.345 | 0.07 |
| 24 | 308.0669 | -5.5551 | 18.824 | 0.775 | 4.953 0.229 | -1.932 0.180 | 0.35 |
| 25 | 308.1076 | -6.2084 | 18.615 | 0.823 | 5.202 0.201 | -1.782 0.157 | 0.59 |
| 26 | 308.1644 | -5.5455 | 18.881 | 0.634 | 5.391 0.266 | -1.904 0.225 | 0.10 |
| 27 | 309.3865 | -4.6300 | 19.494 | 0.665 | 5.176 0.356 | -1.869 0.309 | 0.38 |
| 28 | 310.0923 | -4.9250 | 19.977 | 0.705 | 5.254 0.642 | -1.336 0.484 | 0.07 |
| 29 | 310.1293 | -5.0035 | 19.134 | 0.663 | 4.757 0.344 | -2.024 0.283 | 0.36 |
| 30 | 310.4335 | -5.1539 | 19.277 | 0.697 | 4.829 0.355 | -2.175 0.257 | 0.43 |
| 31 | 310.6783 | -5.1780 | 19.346 | 0.676 | 4.281 1.153 | -2.371 0.864 | 0.12 |
| 32 | 311.1795 | -4.0251 | 18.419 | 0.886 | 4.679 0.223 | -1.977 0.151 | 1.00 |
| 33 | 312.6071 | -4.1474 | 18.892 | 0.708 | 5.068 0.236 | -2.013 0.204 | 0.14 |
| 34 | 312.6337 | -4.6105 | 19.180 | 0.757 | 4.585 0.314 | -2.120 0.230 | 0.54 |
| 35 | 313.2539 | -4.1308 | 19.649 | 0.741 | 3.980 0.673 | -1.912 0.367 | 0.11 |
| 36 | 313.3965 | -4.6425 | 19.129 | 0.809 | 4.497 0.269 | -1.989 0.203 | 0.20 |
| 37 | 313.7426 | -3.8802 | 19.080 | 0.707 | 4.285 0.226 | -1.961 0.174 | 0.37 |
| 38 | 313.9071 | -3.5868 | 19.548 | 0.737 | 4.594 0.367 | -1.835 0.254 | 0.28 |
| 39 | 314.1409 | -3.6345 | 19.335 | 0.753 | 4.948 0.340 | -1.858 0.228 | 0.10 |
| 40 | 314.2102 | -4.0325 | 19.376 | 0.726 | 4.765 0.309 | -2.005 0.246 | 0.40 |
| 41 | 314.3891 | -4.0681 | 19.225 | 0.692 | 4.652 0.272 | -2.148 0.229 | 0.61 |
| 42 | 314.5338 | -3.3642 | 19.290 | 0.731 | 4.489 0.377 | -1.957 0.241 | 0.40 |
| 43 | 314.6923 | -3.4327 | 19.205 | 0.723 | 4.172 0.469 | -2.296 0.283 | 0.29 |
| 44 | 314.9455 | -2.8081 | 19.606 | 0.699 | 4.155 0.429 | -2.138 0.300 | 0.27 |
| 45 | 315.1995 | -2.9921 | 19.527 | 0.681 | 4.111 0.421 | -2.149 0.301 | 0.21 |
| 46 | 315.9309 | -4.3343 | 19.090 | 0.762 | 4.697 0.395 | -1.876 0.273 | 0.15 |
| 47 | 316.0043 | -3.0211 | 19.178 | 0.732 | 4.057 0.309 | -1.940 0.235 | 0.21 |
| 48 | 316.0946 | -4.1570 | 19.108 | 0.686 | 4.413 0.292 | -2.241 0.271 | 0.34 |
| 49 | 316.6855 | -2.5764 | 18.721 | 0.789 | 4.052 0.241 | -1.888 0.183 | 0.37 |
| 50 | 316.8570 | -2.6468 | 18.836 | 0.775 | 4.162 0.320 | -2.390 0.270 | 0.25 |
| 51 | 317.4079 | -3.2508 | 18.484 | 0.835 | 4.377 0.177 | -2.216 0.151 | 0.25 |
| 52 | 317.6899 | -2.8665 | 19.596 | 0.733 | 3.750 0.564 | -1.972 0.420 | 0.14 |
| 53 | 318.4211 | -2.6732 | 19.248 | 0.669 | 3.903 0.374 | -1.980 0.273 | 0.45 |
| 54 | 319.2730 | -2.2189 | 19.041 | 0.650 | 3.801 0.385 | -2.202 0.397 | 0.18 |
| 55 | 319.4027 | -2.2788 | 19.561 | 0.619 | 3.637 0.458 | -1.813 0.331 | 0.09 |
| 56 | 319.5807 | -2.2141 | 18.679 | 0.731 | 3.993 0.227 | -2.141 0.183 | 0.26 |
| 57 | 319.6214 | -1.7309 | 19.019 | 0.707 | 3.827 0.330 | -2.265 0.261 | 0.36 |
| 58 | 319.6348 | -2.4786 | 19.512 | 0.726 | 3.840 0.480 | -2.487 0.307 | 0.12 |
| 59 | 319.8227 | -2.1205 | 20.002 | 0.632 | 3.583 0.598 | -2.015 0.459 | 0.09 |
| 60 | 319.9501 | -2.1123 | 19.579 | 0.677 | 3.853 0.513 | -2.590 0.387 | 0.12 |
| 61 | 320.0846 | -2.2095 | 18.668 | 0.735 | 3.635 0.265 | -2.266 0.197 | 0.15 |
| 62 | 320.2185 | -1.2443 | 19.993 | 0.697 | 3.029 0.929 | -2.282 0.493 | 0.09 |
| 63 | 320.6388 | -2.0746 | 19.899 | 0.695 | 3.587 0.480 | -2.550 0.399 | 0.11 |
| 64 | 320.6637 | -1.7388 | 20.046 | 0.717 | 2.934 1.159 | -2.032 0.510 | 0.08 |
| 65 | 320.8262 | -1.9968 | 18.914 | 0.661 | 3.790 0.268 | -1.921 0.180 | 0.18 |
| 66 | 321.0859 | -2.0591 | 19.428 | 0.678 | 4.126 0.390 | -2.008 0.269 | 0.22 |
| 67 | 321.8929 | -1.8965 | 18.653 | 0.886 | 3.805 0.276 | -2.044 0.177 | 0.19 |
| 68 | 321.9056 | -2.9722 | 19.478 | 0.745 | 3.428 0.343 | -2.493 0.290 | 0.09 |
| 69 | 321.9276 | -2.8502 | 18.777 | 0.758 | 3.674 0.238 | -2.070 0.169 | 0.74 |
| 70 | 322.0541 | -1.8172 | 19.554 | 0.674 | 3.169 0.405 | -2.321 0.294 | 0.09 |
| 71 | 322.0563 | -2.6697 | 19.437 | 0.744 | 3.921 0.376 | -2.490 0.291 | 0.10 |
| 72 | 322.1595 | -2.8156 | 18.994 | 0.774 | 3.761 0.270 | -2.261 0.231 | 0.21 |
| 73 | 322.2721 | -0.9314 | 19.851 | 0.583 | 3.556 0.449 | -2.163 0.348 | 0.11 |
| 74 | 322.3511 | -1.1634 | 19.781 | 0.632 | 3.700 0.424 | -2.406 0.354 | 0.13 |
| 75 | 322.4616 | -1.0223 | 19.018 | 0.706 | 3.526 0.233 | -2.044 0.193 | 0.75 |
| 76 | 322.5867 | -1.0529 | 19.899 | 0.705 | 3.627 0.479 | -2.374 0.413 | 0.19 |
| No. | R.A. (J2016) | dec (J2016) | (mas yr-1) | (mas yr-1) | Relative Weight | ||
|---|---|---|---|---|---|---|---|
| 77 | 325.1483 | 0.5728 | 19.222 | 0.778 | 3.193 0.361 | -2.014 0.205 | 0.21 |
| 78 | 325.1571 | 0.5836 | 20.055 | 0.685 | 2.507 0.921 | -2.059 0.467 | 0.07 |
| 79 | 325.1670 | 0.1508 | 18.549 | 0.882 | 3.006 0.191 | -2.241 0.185 | 0.20 |
| 80 | 325.3284 | 0.2358 | 18.827 | 0.773 | 3.420 0.265 | -2.187 0.244 | 0.64 |
| 81 | 328.0100 | 2.4013 | 18.878 | 0.854 | 3.064 0.227 | -2.151 0.234 | 0.40 |
| 82 | 328.6698 | 1.5576 | 19.161 | 0.808 | 3.262 0.404 | -1.892 0.495 | 0.19 |
| 83 | 328.7255 | 1.6134 | 19.071 | 0.784 | 2.936 0.367 | -2.144 0.451 | 0.18 |
| 84 | 328.8938 | 1.3983 | 18.886 | 0.911 | 2.976 0.306 | -2.210 0.345 | 0.38 |
| 85 | 330.1190 | 0.7344 | 19.107 | 0.704 | 2.682 0.329 | -1.934 0.311 | 0.43 |
| 86 | 330.5000 | 2.6337 | 19.183 | 0.843 | 2.244 0.374 | -2.095 0.392 | 0.09 |
| 87 | 330.5507 | 2.0030 | 19.141 | 0.705 | 3.105 0.306 | -2.381 0.296 | 0.21 |
| 88 | 330.7462 | 2.5520 | 19.002 | 0.853 | 2.795 0.322 | -1.845 0.300 | 0.22 |
| 89 | 331.3680 | -0.2976 | 19.662 | 0.671 | 3.172 0.651 | -2.341 0.616 | 0.08 |
| 90 | 331.5506 | -0.2414 | 19.984 | 0.789 | 2.668 0.733 | -2.250 0.759 | 0.07 |
| 91 | 331.6195 | 2.5053 | 19.252 | 0.824 | 2.885 0.516 | -2.181 0.764 | 0.14 |
| 92 | 331.8195 | 2.4248 | 19.223 | 0.821 | 2.344 0.307 | -2.205 0.324 | 0.26 |
| 93 | 331.8793 | 2.8398 | 19.334 | 0.706 | 2.909 0.403 | -2.306 0.485 | 0.14 |
| 94 | 333.8377 | 2.8016 | 19.324 | 0.820 | 2.706 0.373 | -2.346 0.522 | 0.12 |
| 95 | 334.2209 | 2.9675 | 19.049 | 0.814 | 2.423 0.349 | -2.677 0.423 | 0.09 |
| 96 | 335.2148 | 2.2480 | 19.816 | 0.755 | 2.428 0.459 | -2.714 0.526 | 0.09 |
| 97 | 335.5576 | 0.7801 | 19.042 | 0.908 | 2.272 0.335 | -1.979 0.363 | 0.26 |
| 98 | 337.6078 | 0.6448 | 19.612 | 0.724 | 2.294 0.464 | -1.863 0.555 | 0.12 |
| 99 | 338.6724 | 2.0934 | 19.404 | 0.874 | 2.102 0.464 | -1.975 0.350 | 0.17 |
| 100 | 341.5561 | -2.5554 | 20.008 | 0.776 | 1.812 0.553 | -2.218 0.534 | 0.08 |
| 101 | 344.7044 | -6.0849 | 19.533 | 0.733 | 0.412 0.395 | -4.482 0.335 | 0.22 |
| 102 | 345.0743 | 2.9189 | 19.265 | 0.815 | 1.204 0.316 | -2.238 0.300 | 0.18 |
| 103 | 345.2132 | 2.8187 | 19.728 | 0.737 | 1.573 0.419 | -1.726 0.421 | 0.08 |
| 104 | 345.3032 | 1.4221 | 19.359 | 0.713 | 1.258 0.350 | -2.377 0.350 | 0.08 |
| 105 | 345.5452 | 1.3684 | 19.188 | 0.812 | 1.569 0.343 | -2.336 0.394 | 0.14 |
| 106 | 345.6678 | 1.1773 | 19.850 | 0.685 | 1.320 0.493 | -2.380 0.496 | 0.13 |
| 107 | 345.7548 | 2.1181 | 19.748 | 0.756 | 1.859 0.486 | -2.345 0.498 | 0.11 |
| 108 | 345.9409 | 1.9106 | 19.944 | 0.751 | 1.614 0.623 | -1.978 0.450 | 0.08 |
| 109 | 346.2401 | 2.0400 | 19.441 | 0.786 | 0.995 0.392 | -2.456 0.382 | 0.10 |
| 110 | 346.3858 | -7.6764 | 18.854 | 0.779 | 0.415 0.254 | -4.253 0.239 | 0.26 |
| 111 | 346.4380 | -7.5666 | 19.149 | 0.741 | 0.624 0.369 | -4.400 0.269 | 0.32 |
| 112 | 346.4946 | 1.0766 | 19.903 | 0.743 | 1.261 0.498 | -1.864 0.446 | 0.08 |
| 113 | 346.6741 | -9.8808 | 19.894 | 0.653 | 0.340 0.506 | -4.534 0.453 | 0.09 |
| 114 | 346.7813 | -10.2359 | 19.066 | 0.860 | 0.530 0.260 | -4.757 0.288 | 0.26 |
| 115 | 346.8299 | -10.0795 | 19.216 | 0.800 | 0.160 0.334 | -4.817 0.337 | 0.30 |
| 116 | 346.9086 | 1.2022 | 19.415 | 0.762 | 1.734 0.458 | -2.424 0.352 | 0.12 |
| 117 | 347.0098 | -10.6225 | 19.197 | 0.669 | 0.476 0.346 | -4.916 0.275 | 0.09 |
| 118 | 347.2283 | -9.1633 | 19.249 | 0.710 | 0.293 0.356 | -4.412 0.397 | 0.22 |
| 119 | 347.2848 | -9.1872 | 19.562 | 0.634 | 0.528 0.407 | -4.568 0.407 | 0.15 |
| 120 | 347.3029 | -9.4175 | 19.481 | 0.763 | 0.232 0.316 | -4.241 0.317 | 0.10 |
| 121 | 347.8227 | -0.7089 | 19.680 | 0.657 | 1.236 0.430 | -2.556 0.373 | 0.09 |
| 122 | 348.7701 | 1.5012 | 20.005 | 0.751 | 1.573 0.576 | -2.310 0.472 | 0.07 |
| 123 | 348.7943 | 1.4163 | 19.738 | 0.792 | 1.669 0.566 | -2.339 0.376 | 0.07 |
| 124 | 349.7764 | 0.2186 | 19.669 | 0.760 | 1.255 0.350 | -2.795 0.305 | 0.19 |
| 125 | 349.9826 | 0.4109 | 19.531 | 0.812 | 1.475 0.436 | -2.625 0.296 | 0.15 |