Survival Prediction of Brain Cancer with Incomplete Radiology, Pathology, Genomic, and Demographic Data
Abstract
Integrating cross-department multi-modal data (e.g., radiology, pathology, genomic, and demographic data) is ubiquitous in brain cancer diagnosis and survival prediction. To date, such an integration is typically conducted by human physicians (and panels of experts), which can be subjective and semi-quantitative. Recent advances in multi-modal deep learning, however, have opened a door to leverage such a process in a more objective and quantitative manner. Unfortunately, the prior arts of using four modalities on brain cancer survival prediction are limited by a ”complete modalities” setting (i.e., with all modalities available). Thus, there are still open questions on how to effectively predict brain cancer survival from incomplete radiology, pathology, genomic, and demographic data (e.g., one or more modalities might not be collected for a patient). For instance, should we use both complete and incomplete data, and more importantly, how do we use such data? To answer the preceding questions, we generalize the multi-modal learning on cross-department multi-modal data to a missing data setting. Our contribution is three-fold: 1) We introduce a multi-modal learning with missing data (MMD) pipeline with competitive performance and less hardware consumption; 2) We extend multi-modal learning on radiology, pathology, genomic, and demographic data into missing data scenarios; 3) A large-scale public dataset (with 962 patients) is collected to systematically evaluate glioma tumor survival prediction using four modalities. The proposed method improved the C-index of survival prediction from 0.7624 to 0.8053.
Keywords:
Multi-modal learning Survival Prediction Missing Modalities.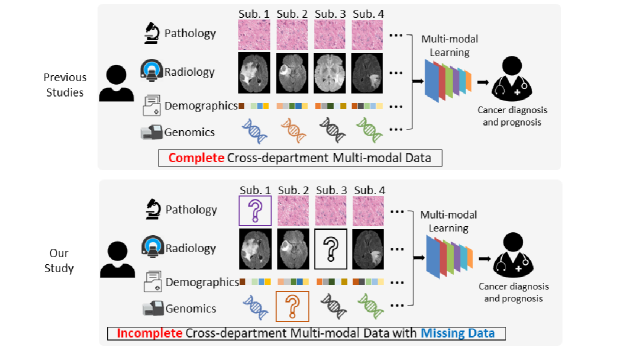
1 Introduction
Multi-modal learning tends to improve model performance by extracting and aggregating the information of the same subject from different modalities, as compared to learning with a single modality [7]. Medical domains are rich with multiple modalities, including image data such as pathology images, radiology images, and non-image data such as genomic data and demographic information, etc. An increasing number of works have shown that multi-modal learning helps to improve the performance of computer-aided diagnosis and prognosis in many medical applications [24, 15].
Gliomas are the most common primary malignant brain tumors. Diagnosis and prognosis of patients with this kind of tumor are beneficial for treatment decisions and patient management [23]. Some prior studies have already shown the prognostic advances of utilizing pathology images [19], MRI images [4], genomic [8] and clinical features [9] for the survival time prediction of glioma tumors. More recent studies have shown the promising results of integrating multi-modal data for glioma tumor prognosis [21, 27, 12, 10]. Mobadersany et al [21]. concatenated genomic biomarkers and learned pathology image features. Chen et al [12]. proposed to aggregate features from genomic data, pathology images and cell graphs with tensor fusion [27]. More recently, Braman et al [10]. extended tensor fusion with orthogonal regularization to four modalities for more precise survival prediction.
However, the above studies only utilized the comprehensive radiology, pathology, genomic, and demographic data as a ”complete data” setting (all modalities are available for every patient). However, complete data are not always guaranteed in routine practice patients (Fig. 1). Discarding patient data with missing modalities (1) extremely aggravates the data scarcity problem of medical applications and increases the risk of overfitting [3], and (2) limits the usage of the model trained by complete modalities in the inference phase because the prediction for data with complete modalities cannot be guaranteed. Cheerla et al [11]. used modality dropout to improve pan-cancer classification when the dataset had missing modalities. Ghosal et al [14]. reconstructed uni-modal features from the multi-modal representation to force the fusion model to keep all the information of uni-modalities. However, these methods did not leverage the available modalities for the modality missing problem, and they did not thoroughly compare the model performance between the training and testing data with and without modality missing, respectively.
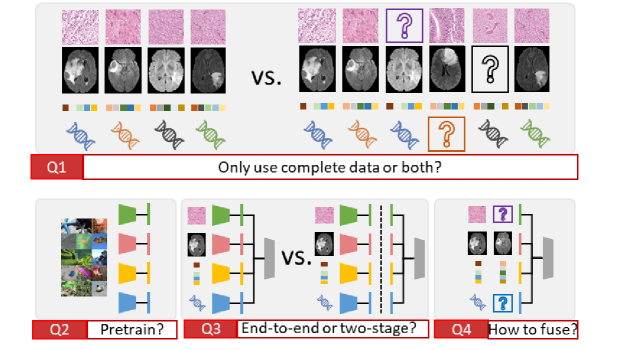
Therefore, there are still open questions on how to effectively learn from incomplete radiology, pathology, genomic, and demographic data (e.g., one or more modalities might not be collected for a patient) (Fig. 2). Specifically, 1) Would more training data with incomplete modalities enhance the accuracy of prognosis prediction? 2) How can we effectively utilize the pre-trained feature extractors? 3) Which training strategy should we use, end-to-end or two-stage? 4) How should we fuse the multi-modal information under the missing data scenarios?
In this paper, we propose an effective multi-modal learning with missing data (MMD) pipeline while addressing the above four key questions with comprehensive experimental analyses. The contribution of this paper is three-fold:
The proposed MMD method is designed for using any combinations of available data as a two-stage plug-and-play method with computational efficiency.
This study generalizes multi-modal learning on radiology, pathology, genomic, and demographic data into more clinically applicable missing data scenarios.
The methodological development and data analyses are performed on a large-scale dataset by combining the glioma tumor data in TCGA [2, 1], TCIA [13], and BraTs dataset [6, 5, 20].
2 Methods
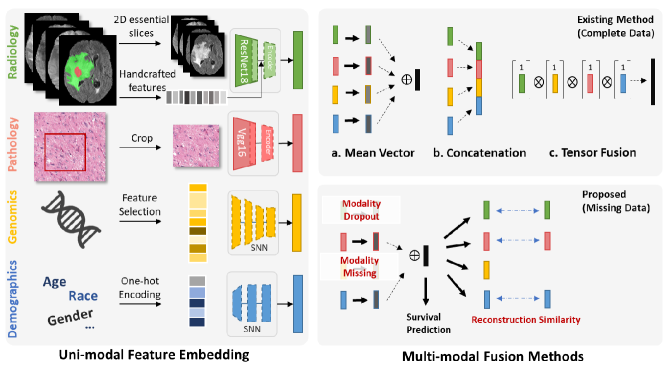
The multi-modal fusion learning approach of the proposed MMD method, as well as the methods in prior arts, are presented in Fig. 3. The MMD pipeline is a two-stage framework that is designed for missing data scenarios, including the (1) uni-modal feature embedding, and (2) multi-modal information fusion.
2.1 Uni-modal feature embedding
Low-dimensional features are obtained for each modality by training independent deep survival models using different neural networks.
Radiology Modal. For registered 3D radiology MRI scans, the tumor and edema regions are automatically obtained by a trained nnUNet [16] segmentation model. The 2D essential slices (resized to 120 x 120) with the largest tumor and edema region from the four modalities are stacked as a four-channel input. To bridge the inconsistency between a pre-trained model and the new input dimensionality, the weights of the channel of a pre-trained ResNet-18 are copied to the channel as the weight initialization. In addition, 318 2D and 3D handcrafted features are extracted by PyRadiomics from tumor volumes to provide extra shape, location, and texture information. The handcrafted features are concatenated to the image features learned by the ResNet-18. Based on our experiments, adding handcrafted features improve the model performance as compared to using CNN features along.
Pathology Modal. Following the prior work [12], ImageNet pre-trained Vgg-16 is used to extract features from pathology images. Same as the radiology modality, only the last layers of the pre-trained network (ResNet and Vgg) is finetuned, as opposed to retraining the entire network. Each pathology image with the size of 1024 x 1024 is extracted from a tumor region [21, 12]. An image patch with the size of 512 x 512 is extracted from each image in each training iteration for learning. In the testing phase, a sliding window with the size of 512 x 512 and a stride of 256 is used to crop each image into 9 patches. The average aggregation of the prediction of these 9 patches is the prediction for each pathology image sample.
Genomics and Demographics Modals. The genomic modality consists of 80 DNA features including 79 of the most expressive features from copy number variations (CNV) and one feature from mutation status (binary indication of mutation status for IDH1 gene, 0/1), same as the previous work [10]. For the demographic modality, we use four features including age, gender, race and ethnicity. They are extended to 9 features through applying one-hot encoding on categorical features. Following the prior work [12], self-normalized networks [17] are employed for both genomic data and demographic data to mitigate overfitting.
2.2 Multi-modal fusion with complete data
In prior arts, three canonical fusion strategies have been broadly used on the complete datasets, including (1) feature concatenation [26, 21], (2) mean vector (i.e. element-wise average) [14, 11], and (3) Kronecker product based tensor fusion [12, 25]. In our study, such fusion methods are used to fuse the features, followed by a three-layer multi-layer perceptron (MLP) with ReLU activations and dropout layers for survival prediction. For the concatenation method, the 132 feature embeddings of each modality are concatenated directly to generate a multi-modal representation with a length of 128. For the mean vector fusion, the uni-modal embeddings are firstly extended to 128 dimensional vectors with a modal-specific two-layer perceptron, and a reverse network structure is used to reconstruct the uni-modal embeddings from the mean vector. For the pathomic fusion method, we directly extend the tensor fusion with gated attention method proposed by Chen et al [12]. from three to four uni-modal 1 32 embeddings.
2.3 Multi-modal fusion for missing data
In the missing data setting, we extend multi-modal fusion with the MMD method, which fuses the feature embeddings from all available modalities. Among the above three canonical fusion strategies, we employ the mean vector (element-wise average of available embeddings) as the backbone fusion method since its ”order-less” nature leads to larger flexibility in using missing data. To further boost fusion capability on missing data, we introduce modality dropout [22] by randomly discarding modalities for training. Only the rest of uni-modal embeddings are calculated for the mean vector.
To encourage the model to learn cross-modality information, modality reconstruction is used in the MMD method to fit a complete multi-modal representation from all available modalities. Moreover, different from previous work [14], for the modalities that are intentionally dropped out, we ask the MMD model to reconstruct such modalities as well, since the original modalities are actually known.
The loss function to supervise the proposed method consists of two terms. The first term is a cox loss that is defined as:
| (1) |
where the values , , are survival time, censor status and multi-modal representations of sample . If the death is observed, censor status . denotes the networks which predict the survival hazard (risk of death) from . The second term is the reconstruction loss:
| (2) |
where is the embedding of modality of sample . is the reconstructed embedding of modality and indicates the original availability of the modality of subject . when this modality is missing and represents the number of available modalities for sample . is used to calculate the difference between the reconstructed uni-modal embeddings and the corresponding real uni-modal embeddings. The overall loss becomes:
| (3) |
where a weight is empirically selected to balance two losses.
3 Data and Experimental Setting
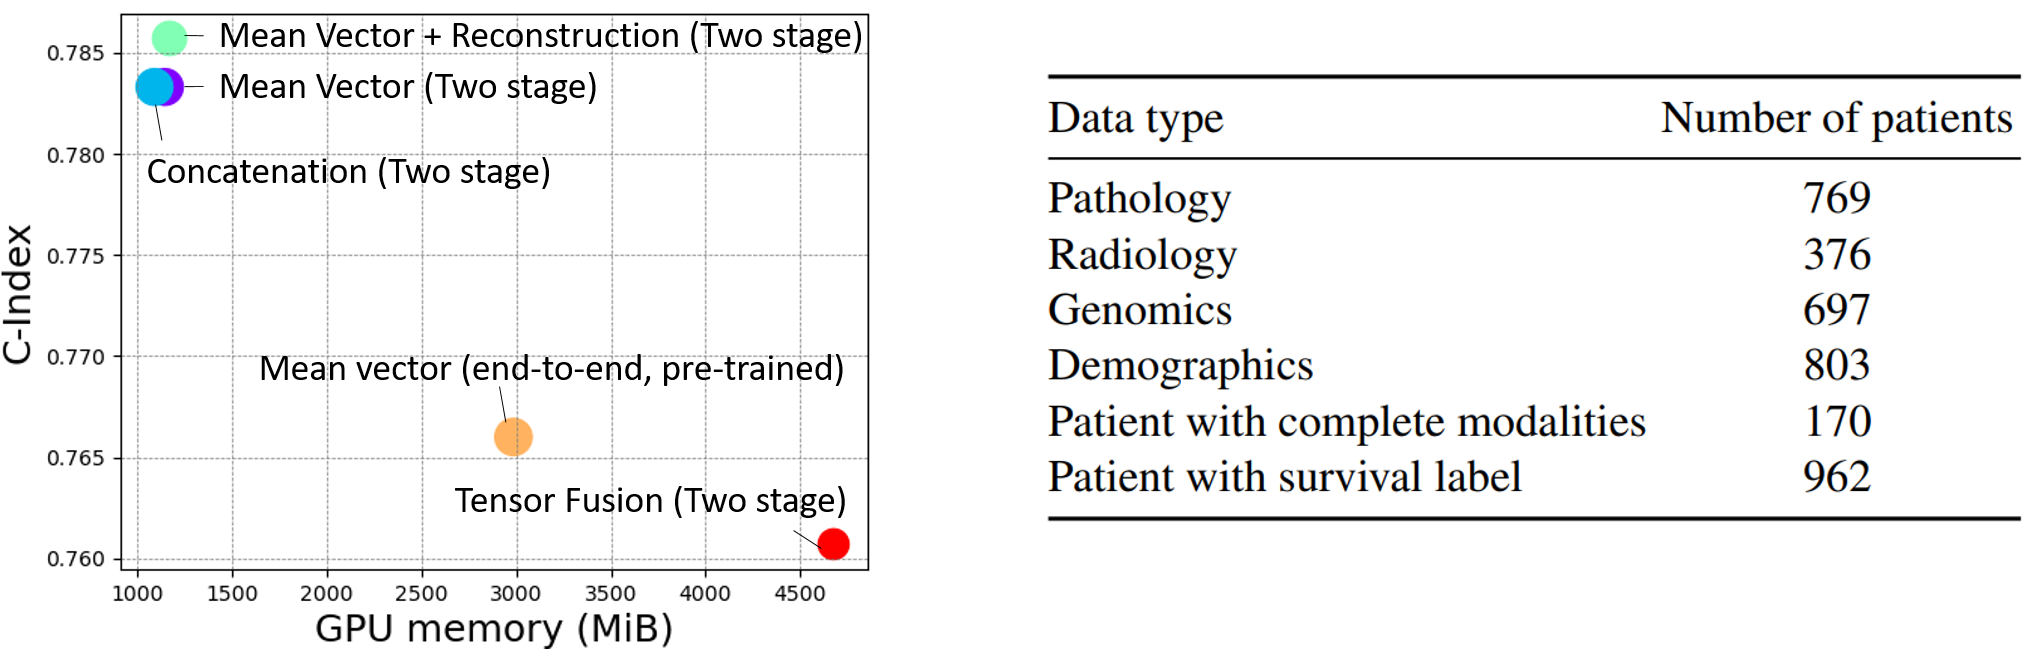
We collected a large-scale dataset with both complete and incomplete glioma tumor data (1698 samples from 962 patients) by combining TCGA [2, 1], TCIA [13], and the BraTs dataset [6, 5, 20]. Each patient had at least one modality available. All patients had survival time and censor status. The detailed data information are presented in Fig. 4. Following the train-test splits of previous works [12, 21], we enlarged the training set with more patients from the BraTs dataset and used the subset of original testing sets with four modalities available. Also, 10% of patients in training set were randomly selected for validation set. In the routine clinical situation, the acquisition of pathology and genomic modalities was more invasive to achieve than the non-invasive radiology and demographic data. Thus, we also evaluated scenarios in which pathology and genomic data were missing (Table 3). Each modality was randomly dropped out (set to zero) by an empirically selected rate 0.5 until only one modality was left for a sample. For the end-to-end fusion strategy, the network weights pre-trained by ImageNet or the uni-modal data were loaded. Then, the uni-modal models and the fusion network were trained together. As for the two-stage strategy, 32-dimensional uni-modal embeddings prepared by trained uni-modal models were used as inputs to train the fusion network only. Specifically, a 512 x 512 patch was randomly cropped from each pathology image for an embedding in training. To evaluate the survival prediction, the concordance index (c-index) value was used. The average aggregation of multiple patches from multiple samples of each patient is calculated as the final prediction. Intensity normalized images were augmented by rotation, flipping, and color jitter methods in training. The batch size was 32 for non-image uni-modal training and 8 for image training, with a learning rate of 0.002. The batch size of the fusion was set to 8 with a learning rate of 0.0002. All the experiments were run on a 16GB NVIDIA GPU. The code is available at: https://github.com/cuicathy/MMD_SurvivalPrediction.git
4 Results
Table LABEL:table:performance compared our proposed pipeline with prior benchmarks [12, 10]. Our proposed MMD method achieved superior performance compared with benchmarks. The performance on joint testing sets of pathomic fusion [12] and our work are used for a fair comparison of different methods. The best performance of their released model (the ”pathgraphomic” network with attention gates trained by mRNA, DNA and pathology images) was compared with our best model (all data + modality dropout + reconstruction + mean vector) on this subset. We rebuilt the Deep orthogonal fusion following the papers [10, 18] (e.g., uni-modal embeddings were compressed to 8 dimension by a linear layer for tensor fusion), but the four uni-modal structures and features mentioned above trained by all available uni-modal data were used for a fair comparison.
| Modality | Training Strategy | Training Data | C-index |
| Uni-modal (Radiology) | finetune entire network | C+M | 0.6957 ± 0.043 |
| Uni-modal (Pathology) | finetune entire network | C+M | 0.6803 ± 0.008 |
| Uni-modal (Radiology) | finetune last layers | C+M | 0.7062 ± 0.039 |
| Uni-modal (Pathology) | finetune last layers | C+M | 0.7319 ± 0.026 |
| Multi-modal (Mean vector) | end-to-end (from scratch*) | C | 0.7263 ± 0.027 |
| Multi-modal (Mean vector) | end-to-end (from scratch*) | C+M | 0.7609 ± 0.016 |
| Multi-modal (Mean vector) | end-to-end (finetune**) | C | 0.7580 ± 0.030 |
| Multi-modal (Mean vector) | end-to-end (finetune**) | C+M | 0.7607 ± 0.021 |
| Multi-modal (Mean vector) | two-stage | C | 0.7571 ± 0.034 |
| Multi-modal (Mean vector) | two-stage | C+M | 0.7717 ± 0.034 |
Results of different training strategies for uni-modal learning and multi-modal fusion are in Table LABEL:table:performance2. For uni-modal training, only finetuning the last layer of the ImageNet pre-trained network achieved better uni-modal survival prediction than finetuning the whole pre-trained network. When using multi-modal data, two-stage training with fixed uni-modal embeddings is competitive compared with the end-to-end training. Table 3 shows the results of three different multi-modal fusion methods trained by complete data (“C” in the table) or all data (”C+M” in the table), with or without modality dropout. For the mean vector method, the modality dropout, reconstruction, and training with all data consistently improved the performance on testing sets.
| Training | Testing | |||||||||||||||||||||||
|---|---|---|---|---|---|---|---|---|---|---|---|---|---|---|---|---|---|---|---|---|---|---|---|---|
|
|
|
|
Recon |
|
|
|
|||||||||||||||||
| C+M | C | 0.7659 ± 0.032 | 0.7563 ± 0.035 | 0.7169 ± 0.035 | ||||||||||||||||||||
| C+M | C+M | 0.7743 ± 0.034 | 0.7647 ± 0.030 | 0.7278 ± 0.037 | ||||||||||||||||||||
| C+M | C | ✓ | 0.7833 ± 0.030 | 0.7725 ± 0.031 | 0.7275 ± 0.037 | |||||||||||||||||||
| Concat- enation | C+M | C+M | ✓ | 0.7817 ± 0.029 | 0.7668 ± 0.032 | 0.7352 ± 0.034 | ||||||||||||||||||
| C+M | C | 0.7503 ± 0.032 | 0.7274 ± 0.030 | 0.6926 ± 0.045 | ||||||||||||||||||||
| C+M | C+M | 0.7483 ± 0.026 | 0.7328 ± 0.036 | 0.6926 ± 0.044 | ||||||||||||||||||||
| C+M | C | ✓ | 0.7513 ± 0.035 | 0.7386 ± 0.035 | 0.7187 ± 0.040 | |||||||||||||||||||
| Tensor Fusion | C+M | C+M | ✓ | 0.7660 ± 0.031 | 0.7314 ± 0.034 | 0.7117 ± 0.035 | ||||||||||||||||||
| C | C | 0.7597 ± 0.029 | 0.7464 ± 0.032 | 0.7013 ± 0.038 | ||||||||||||||||||||
| C+M | C | 0.7571 ± 0.034 | 0.7495 ± 0.036 | 0.7118 ± 0.037 | ||||||||||||||||||||
| C+M | C+M | 0.7717 ± 0.034 | 0.7622 ± 0.034 | 0.7321 ± 0.036 | ||||||||||||||||||||
| C | C | ✓ | 0.7740 ± 0.026 | 0.7644 ± 0.029 | 0.7081 ± 0.032 | |||||||||||||||||||
| C+M | C | ✓ | 0.7821 ± 0.029 | 0.7683 ± 0.032 | 0.7223 ± 0.037 | |||||||||||||||||||
| C+M | C+M | ✓ | 0.7833 ± 0.030 | 0.7702 ± 0.032 | 0.7373 ± 0.033 | |||||||||||||||||||
| C+M | C | ✓ | 0.7660 ± 0.029 | 0.7576 ± 0.032 | 0.7131 ± 0.034 | |||||||||||||||||||
| C+M | C+M | ✓ | 0.7779 ± 0.032 | 0.7708 ± 0.033 | 0.7255 ± 0.037 | |||||||||||||||||||
| C+M | C | ✓ | ✓ | 0.7812 ± 0.027 | 0.7609 ± 0.030 | 0.7164 ± 0.033 | ||||||||||||||||||
| Mean Vector | C+M | C+M | ✓ | ✓ | 0.7857 ± 0.026 | 0.7808 ± 0.032 | 0.7451 ± 0.034 | |||||||||||||||||
* “C” means training using complete data while “M” means missing data. The best performances among all settings are highlighted in bold, while the best performances of a certain fusion method (without reconstruction loss) are highlighted by underline.
5 Ablation Studies for Answering Four Questions
To answer the four questions in Fig. 2, we conducted comprehensive studies as shown in Table. LABEL:table:performance2 and 3.
Q1: Would more training data with incomplete modalities enhance the accuracy of prognosis prediction? Table LABEL:table:performance2 and 3 results indicated that using both complete and incomplete modalities can improve the c-index for survival prediction.
Q2: How do we effectively utilize the pre-trained feature extractors? Fig. 4 and Table LABEL:table:performance2 indicated that only finetuning the last layer yields better performance compared with finetuning the entire network in our task.
Q3: Which training strategy should we use, end-to-end or two-stage? Table LABEL:table:performance2 indicated that the two-stage learning strategy yielded a competitive performance compared with the end-to-end counterparts, and it is memory efficient for more flexibility.
Q4: How should we fuse multi-modal information under the missing data scenarios? The comprehensive ablation studies of different fusion strategies have been provided in Table 3. The proposed MMD approach achieved superior performance among different strategies.
6 Conclusion
In this paper, we generalize the cross-department multi-modal data (radiology, pathology, genomic, and demographic data) deep survival learning from a complete data setting to the more clinically applicable missing data scenarios. First, we presented the MMD method, a multi-modal prognosis pipeline with an effective and efficient design of using both modality complete and incomplete data. Second, with a relatively large-scale cohort, we investigated four key questions of utilizing modality missing data for the brain cancer survival analysis. Future work might include applying this method on external datasets and exploring other uni-modal embedding methods. We hope this study could also be used as a reference for future studies in predicting brain cancer prognosis.
7 Acknowledgements
This work is supported by the Leona M. and Harry B. Helmsley Charitable Trust grant G-1903-03793, NSF CAREER 1452485. This work is in part based upon data generated by the TCGA Research Network: https://www-cancer-gov.proxy.library.vanderbilt.edu/tcga.
References
- [1] et al, L.S.: Radiology data from the cancer genome atlas glioblas- toma multiforme [tcga-gbm] collection (2016)
- [2] et al, N.P.: Radiology data from the cancer genome atlas low grade glioma [tcga-lgg] collection (2016)
- [3] Bach, F.: Breaking the curse of dimensionality with convex neural networks. The Journal of Machine Learning Research 18(1), 629–681 (2017)
- [4] Bae, S., Choi, Y.S., Ahn, S.S., Chang, J.H., Kang, S.G., Kim, E.H., Kim, S.H., Lee, S.K.: Radiomic mri phenotyping of glioblastoma: improving survival prediction. Radiology 289(3), 797–806 (2018)
- [5] Bakas, S., Akbari, H., Sotiras, A., Bilello, M., Rozycki, M., Kirby, J.S., Freymann, J.B., Farahani, K., Davatzikos, C.: Advancing the cancer genome atlas glioma mri collections with expert segmentation labels and radiomic features. Scientific data 4(1), 1–13 (2017)
- [6] Bakas, S., Reyes, M., Jakab, A., Bauer, S., Rempfler, M., Crimi, A., Shinohara, R.T., Berger, C., Ha, S.M., Rozycki, M., et al.: Identifying the best machine learning algorithms for brain tumor segmentation, progression assessment, and overall survival prediction in the brats challenge. arXiv preprint arXiv:1811.02629 (2018)
- [7] Baltrušaitis, T., Ahuja, C., Morency, L.P.: Multimodal machine learning: A survey and taxonomy. IEEE transactions on pattern analysis and machine intelligence 41(2), 423–443 (2018)
- [8] Beig, N., Bera, K., Prasanna, P., Antunes, J., Correa, R., Singh, S., Bamashmos, A.S., Ismail, M., Braman, N., Verma, R., et al.: Radiogenomic-based survival risk stratification of tumor habitat on gd-t1w mri is associated with biological processes in glioblastoma. Clinical Cancer Research 26(8), 1866–1876 (2020)
- [9] Beig, N., Singh, S., Bera, K., Prasanna, P., Singh, G., Chen, J., Saeed Bamashmos, A., Barnett, A., Hunter, K., Statsevych, V., et al.: Sexually dimorphic radiogenomic models identify distinct imaging and biological pathways that are prognostic of overall survival in glioblastoma. Neuro-oncology 23(2), 251–263 (2021)
- [10] Braman, N., Gordon, J.W., Goossens, E.T., Willis, C., Stumpe, M.C., Venkataraman, J.: Deep orthogonal fusion: Multimodal prognostic biomarker discovery integrating radiology, pathology, genomic, and clinical data. In: International Conference on Medical Image Computing and Computer-Assisted Intervention. pp. 667–677. Springer (2021)
- [11] Cheerla, A., Gevaert, O.: Deep learning with multimodal representation for pancancer prognosis prediction. Bioinformatics 35(14), i446–i454 (2019)
- [12] Chen, R.J., Lu, M.Y., Wang, J., Williamson, D.F., Rodig, S.J., Lindeman, N.I., Mahmood, F.: Pathomic fusion: an integrated framework for fusing histopathology and genomic features for cancer diagnosis and prognosis. IEEE Transactions on Medical Imaging (2020)
- [13] Clark, K., Vendt, B., Smith, K., Freymann, J., Kirby, J., Koppel, P., Moore, S., Phillips, S., Maffitt, D., Pringle, M., et al.: The cancer imaging archive (tcia): maintaining and operating a public information repository. Journal of digital imaging 26(6), 1045–1057 (2013)
- [14] Ghosal, S., Chen, Q., Pergola, G., Goldman, A.L., Ulrich, W., Berman, K.F., Blasi, G., Fazio, L., Rampino, A., Bertolino, A., et al.: G-mind: an end-to-end multimodal imaging-genetics framework for biomarker identification and disease classification. In: Medical Imaging 2021: Image Processing. vol. 11596, p. 115960C. International Society for Optics and Photonics (2021)
- [15] Huang, S.C., Pareek, A., Seyyedi, S., Banerjee, I., Lungren, M.P.: Fusion of medical imaging and electronic health records using deep learning: a systematic review and implementation guidelines. NPJ digital medicine 3(1), 1–9 (2020)
- [16] Isensee, F., Petersen, J., Kohl, S.A., Jäger, P.F., Maier-Hein, K.H.: nnu-net: Breaking the spell on successful medical image segmentation. arXiv preprint arXiv:1904.08128 1, 1–8 (2019)
- [17] Klambauer, G., Unterthiner, T., Mayr, A., Hochreiter, S.: Self-normalizing neural networks. Advances in neural information processing systems 30 (2017)
- [18] Lezama, J., Qiu, Q., Musé, P., Sapiro, G.: Ole: Orthogonal low-rank embedding-a plug and play geometric loss for deep learning. In: Proceedings of the IEEE Conference on Computer Vision and Pattern Recognition. pp. 8109–8118 (2018)
- [19] Louis, D.N., Perry, A., Reifenberger, G., Von Deimling, A., Figarella-Branger, D., Cavenee, W.K., Ohgaki, H., Wiestler, O.D., Kleihues, P., Ellison, D.W.: The 2016 world health organization classification of tumors of the central nervous system: a summary. Acta neuropathologica 131(6), 803–820 (2016)
- [20] Menze, B.H., Jakab, A., Bauer, S., Kalpathy-Cramer, J., Farahani, K., Kirby, J., Burren, Y., Porz, N., Slotboom, J., Wiest, R., et al.: The multimodal brain tumor image segmentation benchmark (brats). IEEE transactions on medical imaging 34(10), 1993–2024 (2014)
- [21] Mobadersany, P., Yousefi, S., Amgad, M., Gutman, D.A., Barnholtz-Sloan, J.S., Vega, J.E.V., Brat, D.J., Cooper, L.A.: Predicting cancer outcomes from histology and genomics using convolutional networks. Proceedings of the National Academy of Sciences 115(13), E2970–E2979 (2018)
- [22] Neverova, N., Wolf, C., Taylor, G., Nebout, F.: Moddrop: adaptive multi-modal gesture recognition. IEEE Transactions on Pattern Analysis and Machine Intelligence 38(8), 1692–1706 (2015)
- [23] Pereira, S., Pinto, A., Alves, V., Silva, C.A.: Brain tumor segmentation using convolutional neural networks in mri images. IEEE transactions on medical imaging 35(5), 1240–1251 (2016)
- [24] Schneider, L., Laiouar-Pedari, S., Kuntz, S., Krieghoff-Henning, E., Hekler, A., Kather, J.N., Gaiser, T., Fröhling, S., Brinker, T.J.: Integration of deep learning-based image analysis and genomic data in cancer pathology: A systematic review. European Journal of Cancer 160, 80–91 (2022)
- [25] Wang, Z., Li, R., Wang, M., Li, A.: Gpdbn: deep bilinear network integrating both genomic data and pathological images for breast cancer prognosis prediction. Bioinformatics 37(18), 2963–2970 (2021)
- [26] Yap, J., Yolland, W., Tschandl, P.: Multimodal skin lesion classification using deep learning. Experimental dermatology 27(11), 1261–1267 (2018)
- [27] Zadeh, A., Chen, M., Poria, S., Cambria, E., Morency, L.P.: Tensor fusion network for multimodal sentiment analysis. arXiv preprint arXiv:1707.07250 (2017)