Multi-Center Magnon Excitations Open the Entire Brillouin Zone to Terahertz Magnetometry of Quantum Magnets
Abstract
Due to the small photon momentum, optical spectroscopy commonly probes magnetic excitations only at the center of the Brillouin zone; however, there are ways to override this restriction. In the case of the distorted kagome quantum magnet Y-kapellasite, Y3Cu9(OH)19Cl8, under scrutiny here, the magnon density of states can be accessed over the entire Brillouin zone through three-center magnon excitations. This mechanism is aided by the three different magnetic sublattices and strong short-range correlations in the distorted kagome lattice. The results of THz time-domain experiments agree remarkably well with linear spin-wave theory. Relaxing the conventional zone-center constraint of photons gives a new aspect to probe magnetism in matter.
keywords:
multi-center magnon, spin density, kagome lattice, terahertz photon, terahertz magnetometryTobias Biesner†, Seulki Roh†, Aleksandar Razpopov, Jannis Willwater, Stefan Süllow, Ying Li, Katharina M. Zoch, Marisa Medarde, Jürgen Nuss, Denis Gorbunov, Yurii Skourski, Andrej Pustogow, Stuart E. Brown, Cornelius Krellner, Roser Valentí∗, Pascal Puphal∗, Martin Dressel∗
†These authors contributed equally. ∗Corresponding author
T. Biesner, Dr. S. Roh, Ass. Prof. A. Pustogow, Prof. M. Dressel
1. Physikalisches Institut, Universität Stuttgart, Stuttgart, Germany
Email Address: dressel@pi1.physik.uni-stuttgart.de (M.D.)
A. Razpopov, Dr. Y. Li, Prof. R. Valentí
Institut für Theoretische Physik, Goethe-Universität Frankfurt, Frankfurt am Main, Germany
Email Address: valenti@itp.uni-frankfurt.de (R.V.)
J. Willwater, apl. Prof. S. Süllow
Institut für Physik der Kondensierten Materie, Technische Universität Braunschweig, Braunschweig, Germany
Dr. Y. Li
Department of Applied Physics and MOE Key Laboratory for Nonequilibrium Synthesis and Modulation of Condensed Matter, School of Physics, Xi’an Jiaotong University, Xi’an, China
K. M. Zoch, Prof. C. Krellner, Dr. P. Puphal
Physikalisches Institut, Goethe-Universität Frankfurt, Frankfurt am Main, Germany
Dr. M. Medarde, Dr. P. Puphal
Laboratory for Multiscale Materials Experiments, Paul Scherrer Institute, 5232 Villigen PSI, Switzerland
Dr. J. Nuss, Dr. P. Puphal
Max Planck Institute for Solid State Research, Stuttgart, Germany
Email Address: p.puphal@fkf.mpg.de (P.P.)
Dr. D. Gorbunov, Dr. Y. Skourski
Hochfeld-Magnetlabor Dresden (HLD-EMFL), Helmholtz-Zentrum Dresden-Rossendorf, 01328 Dresden, Germany
Ass. Prof. A. Pustogow, Prof. S. E. Brown
Department of Physics and Astronomy, UCLA, Los Angeles, USA
Ass. Prof. A. Pustogow
Institute of Solid State Physics, TU Wien, 1040 Vienna, Austria
1 Introduction
Conservations of momentum and energy are fundamental principles in physics that have to be obeyed also by optical excitations in solids. In an isolated system, for example, direct electronic transitions induced by light follow both and , where and are the energy and momentum differences between the initial and the excited states, respectively, while and are energy and momentum of the photon.[1, 2] By the same token, these two principles dictate magnetic excitations as well. Here, a magnon with momentum is created / annihilated by absorbing / emitting a photon. Within the energy conservation limit, the small photon momentum confines possible excitations close to the center of the Brillouin zone (BZ), i.e. , due to its sharp energy-momentum dispersion (, : angular frequency, : speed of light in vacuum, : refractive index of medium). Thus, optical accesses, for instance in Raman and THz spectroscopy, to the magnetic transitions are focused on the zone-center magnons.[3, 4, 5, 6, 7, 8] On the other hand, neutron scattering covers a broad range in the Brillouin zone due to large momenta of neutrons, promoting this technique as ideal spectroscopic tool to map spin dispersion. In reality, however, the picture is tainted by the low energy and wavevector resolution of neutron scattering experiments and restriction to large-scale facilities. Further constraints arise from the required large sample mass and the preference to avoid hydrogen and other isotopes with strong neutron absorption. In turn, optical techniques could provide easy access to the magnetism albeit the constraint. Attempts to overcome this constraint are subject of current research and first promising results have been reported.[9, 10, 11]
In THz spectroscopy, with the aid of ultrafast lasers and advanced detection schemes, dynamical processes in the (sub-) picosecond range become accessible.[12, 13] This progress allows not only performing time-resolved studies but enables a control of magnetization dynamics.[14, 15, 16] Magnetic properties can be probed, for instance, through the magneto-optical Faraday or Kerr effects.[17, 18] Other examples include the coherent generation of magnons.[11] Control over THz-driven spin precession [19, 20, 21, 22] opens the field of THz magnetometry, i.e. the fully optical extraction of magnetic properties.[23]
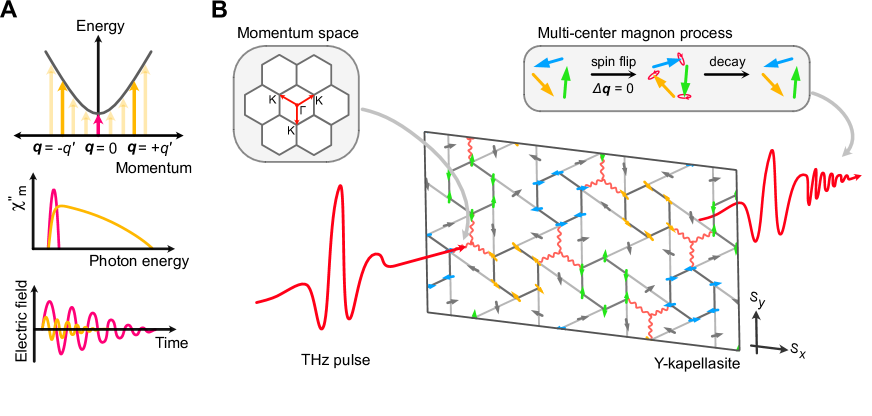
Here, we demonstrate the potential of THz time-domain spectroscopy (THz-TDS) [24] in easing its zone-center restriction: the spin (magnon) density of states (SDOS) can be probed over the entire Brillouin zone via multi-center magnon absorption in materials with several magnetic sublattices. In this picture, magnon excitations take place simultaneously in different magnetic sublattices and positions in momentum space, .[25, 26, 27] Yet, the summed momenta of the participating magnons are zero, , achieving momentum conservation. Figure 1a compares the conventional excitation picture, i.e. one-magnon process (), with the multi-center magnon process (). The distinction between both is prominent in the THz susceptibility and in the time-dependent electric field of the probing light. Here, the mode (one-magnon) causes a homogeneous precession of spins,[28, 14] resulting in sharp spectral features in and relatively long oscillations of the electric field (20-40 ps) [29, 30] through a free induction decay mechanism.[19, 20, 21, 22] The multi-center magnon absorption yields a broad feature [25, 31, 32] implying a reduced lifetime (cf. red and yellow contributions in Figure 1a). It can be observed even above the magnetic long-range ordering temperature as a semblance of paramagnons (paramagnons are observed by various methods, see References [33, 34, 35]).
We have chosen the quantum magnet [36, 37, 38, 39, 40] Y-kapellasite (Y3Cu9(OH)19Cl8) [41] as our material platform. Y-kapellasite forms a distorted kagome lattice and has attracted attention recently due to its intriguing magnetic ground state ( K), suggested in Figure 1b [42]. Here, the magnetic supercell is comprised of three hexagons rotated by 120∘. Due to the three possible arrangements, we define each hexagon as a magnetic sublattice and give it one of the colors: green, blue, or yellow. Strong short-range magnetic correlations and persistent spin dynamics below the ordering temperature (down to mK) were reported previously.[41, 43] The THz transmission of Y-kapellasite was measured over a wide temperature and magnetic field range. At low temperatures ( K), we find magnetically active, continuum-like excitations decaying through oscillations of the transient electric field during an extended time period of around 5 ps. By comparison to the linear spin-wave theory, we conclude that the THz encodes the SDOS through a multi-center magnon absorption, three-center magnon, augmented by the distinct magnetic ground state of Y-kapellasite, as described in Figure 1b. We propose THz magnetometry via multi-center magnon absorption as a method to overcome the conventional zone-center restriction providing access to magnetism over the entire Brillouin zone.
2 Results
2.1 Magnetic properties of Y-kapellasite
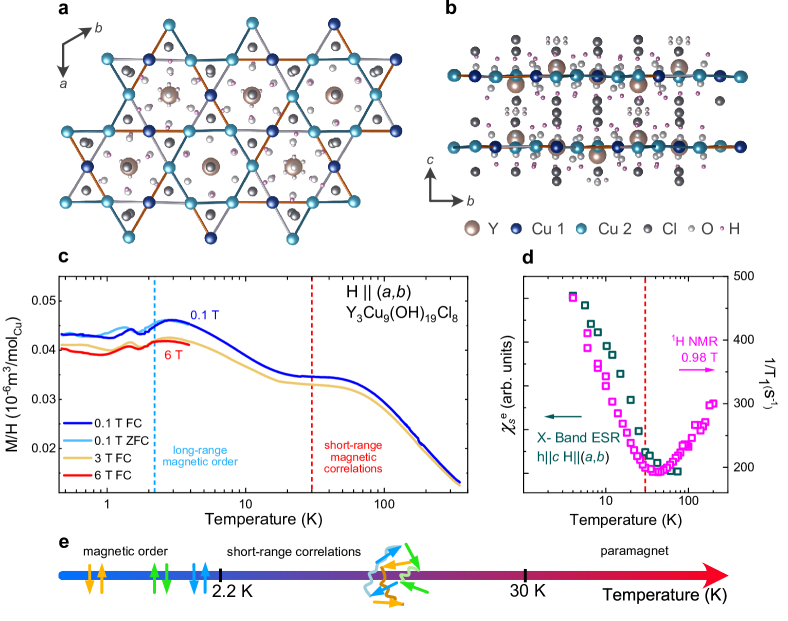
In Y-kapellasite, a distorted kagome lattice is formed by two distinct Cu sites, as depicted in Figure 2a. Here, the magnetic superexchange is governed along three different Cu-O-Cu paths.[41, 42] The distorted kagome planes stack along the -direction (Figure 2b). See supplement for further material information (Figure S1 and S2). Let us first consider the static response of the spin system. The in-plane magnetic susceptibility () down to temperatures as low as mK is presented in Figure 2c. Focusing on the T measurements, upon cooling, the magnetization first saturates in a plateau at intermediate temperatures ( K) and continues to rise below K. At around K a maximum develops, followed by a smaller peak at lower temperature ( K). While the maximum at K is consistent with the previously reported K,[41] also observed in heat-capacity measurements, the additional smaller peak suggests a successive freezing of the magnetic texture at lower temperatures. This is in accordance with the recent SR study on polycrystalline samples,[43] reporting persistent spin dynamics down to the mK range. Furthermore, a weak hysteresis between field cooled (FC) and zero field cooled (ZFC) measurements is observed below K, whereas the cooling protocol does not affect the susceptibility noticeably at higher temperatures, indicating the contribution of uncompensated spins at low temperatures. Increasing the external magnetic field, the magnetization is slightly suppressed and the 3 K-peak shifts to lower temperatures, implying dominant antiferromagnetic interactions. This result suggests two different characteristic temperatures in Y-kapellasite, around K and K.
For additional information, the magnetic properties of Y-kapellasite are further investigated using nuclear magnetic resonance (NMR) and electron spin resonance (ESR). Starting with the 1H-NMR characterization (Figure 2d), the in-plane spin-lattice relaxation rate first decreases upon cooling and increases again near K. This crossover indicates the onset of short-range magnetic correlations. A similar temperature scale is found by ESR measurements as shown in Figure 2d, left axis (Figure S3 for extended ESR spectra). Simultaneously with the onset of magnetic correlations at around K, the electron spin susceptibility starts to rise, advocating the close relation between the ESR absorption and the short-range magnetic interactions. Additional measurements, high-field magnetization and ac susceptibility, reveal similar temperature scales and are presented in the supplement (cf. Figure S4 and S5). The range between K (short-range magnetic correlations) and K offers experimental access for investigating the emergence of magnetism on the kagome lattice above , as sketched in Figure 2e. The desired multi-center magnon absorption could survive for higher temperatures through these short-range magnetic correlations.
2.2 THz time-domain spectra as a probe of spin dynamics
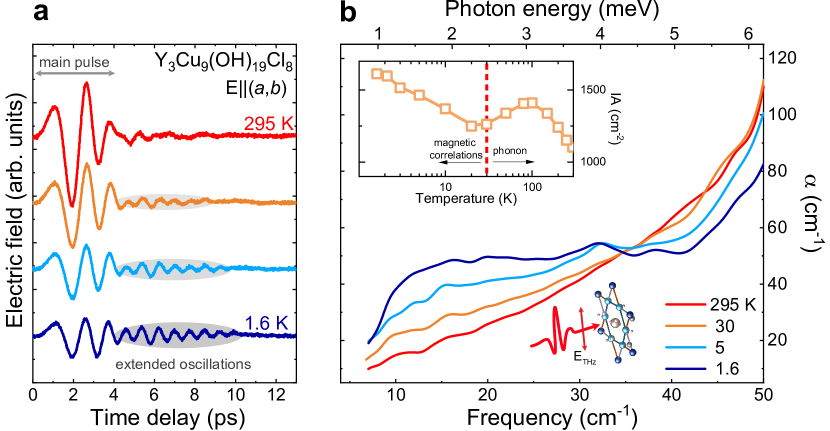
In Figure 3 we plot the raw data of the THz-TDS recorded in the -plane. At high temperatures, the in-plane time-domain signal of the transient electric field (Figure 3a) consists of only the main pulse ranging from 0 to 4 ps (see Methods). With cooling, the intensity of this pulse decreases, but in addition a pronounced oscillating electric field develops over an extended time ranging from 4 to 10 ps. Note, for conventional one-magnon excitations, a similar time-domain signal was reported but on a significantly longer time scale (several tens of ps).[30, 29, 20, 21, 22] To gain more insight into the underlying physical processes, we perform a Fourier transformation and calculate the frequency-dependent absorption coefficient , plotted in Figure 3b. At room temperature, only the tail of the lowest in-plane phonon mode contributes notably to the THz absorption. Upon cooling, the phonon contribution first increases slightly and then becomes weaker together with a suppression of the main pulse in the time-domain signal (see supplement, Figure S6 for the results of infrared spectroscopy and DFT calculations of the phonons). As the temperature drops below K, we see the low-frequency absorption rising, resulting in a broad continuum-like contribution much stronger than the phonon (in this frequency range). This corresponds to the enhancement of the electric field oscillations at extended times as illustrated in Figure 3a. The feature increases strongly with further cooling and finally dominates the entire THz response down to the lowest temperature measured. Furthermore, for K, we observe two weaker, but noticeable, peak-like contributions between cm-1. Despite the increase of intensity, no qualitative difference can be found in measurements below . From the comparison with our calculations, we can exclude a phononic origin of the low-energy features. Also electronic contributions are unlikely for the highly insulating Y-kapellasite (bandgap of 3.6 eV).[41, 44]
These trends become even more obvious when looking at the integrated absorption IA (similar to the spectral weight, see method section), displayed in the inset of Figure 3b. The crossover range in matches well with the onset of short-range magnetic correlations at around K as observed in the NMR spin-lattice relaxation rate and ESR susceptibility. This good agreement between the temperature scales strongly suggests that the THz continuum-like absorption is caused by short-range magnetic correlations even above (see supplemental Figure S7 for corresponding spectra covering the entire temperature range; Figure S8 for additional data in the frequency domain).
2.3 Magneto-THz spectroscopy
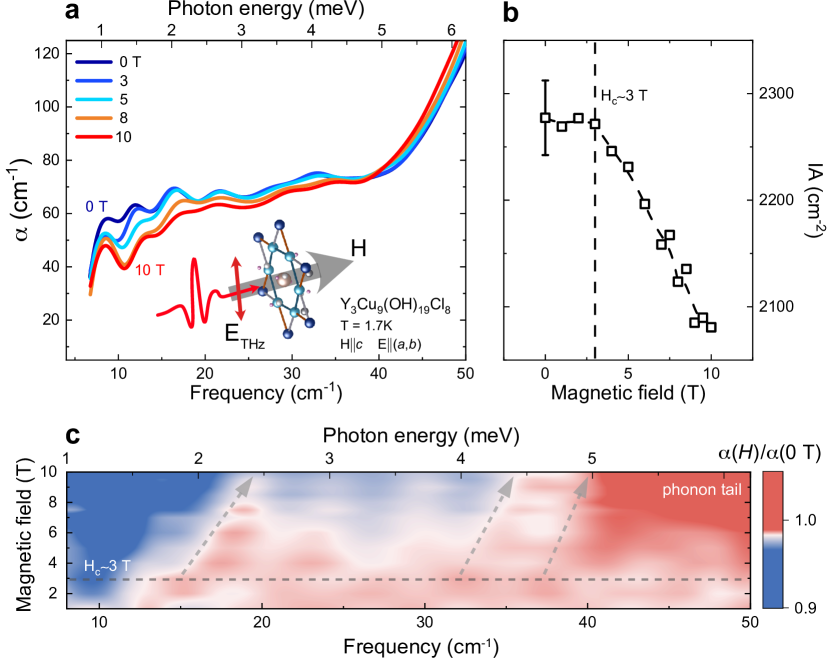
To clarify the magnetic origin of this continuum-like absorption, we carried out magneto-THz measurements at K while applying a static magnetic field up to T in Faraday geometry. With ramping up the magnetic field, the continuum-like feature loses its intensity beginning at the low-frequency end, as displayed in Figure 4a (Figure S9 for extended data). This can be nicely seen in Figure 4b where the IA is plotted as a function of . Exceeding a critical field of T, decreases considerably; at a field strength of T the intensity is reduced by almost 10 . This quantitative change seems reasonable since the magnetic energy corresponds to roughly 10 of the exchange energy: , where K is the Curie-Weiss temperature and meV is the dominating exchange energy ( is Bohr magneton, is Boltzmann constant).[41, 42] The phonon tail above 40 cm-1 is affected as well: it weakly shifts towards lower energies. In addition to these obvious changes in the spectrum, we can identify some more subtle variations inside the continuum-like absorption. Slight shifts of the cm-1 peaks become clearer in the contour plot of the normalized absorption coefficient , presented in Figure 4c. Interestingly, the onset of the continuum-like absorption shows a stronger change under magnetic field, compared to the cm-1 peaks, c.f. grey arrows in Figure 4c. Note the reduced signal-to-noise ratio of a magneto-optical measurement leads to somewhat noisy features below 20 cm-1; nevertheless, our magneto-optical THz results strongly support the magnetic origin of the continuum-like feature.
2.4 Multi-center magnon excitations
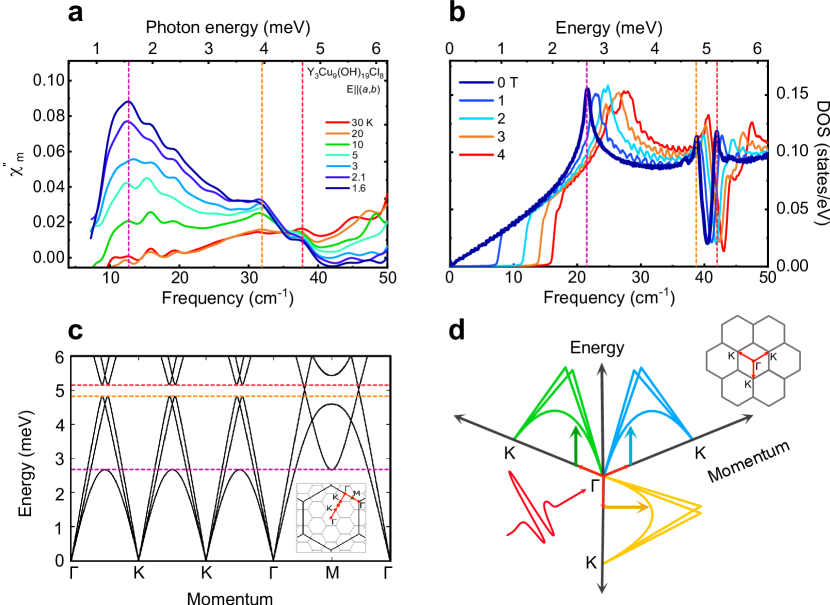
In a next step we have to separate the magnetic contributions from the dielectric ones in the THz absorption in order to reveal their natural spectral form. With the fair assumption that the dielectric properties do not change drastically at low temperatures, the magnetic susceptibility can be obtained from the THz spectra (Figure 3) by referencing to the 80 K-spectrum (see method section for further information). The results are shown in Figure 5a. The extraction of unveils an asymmetric shape of the magnetic continuum-like feature with a maximum at around 12 cm-1 and a width of about 30 cm-1 followed by two peaks at 32 and 37 cm-1 at the lowest temperature, K.
To learn more about the origin of the magnetic THz response and the magnetic ground state, we calculated the spin-wave dispersion for Y-kapellasite with linear spin-wave theory by assuming a coplanar non-collinear magnetically ordered ground state as suggested by recent ab-initio DFT calculations.[42] This ordered state comprises three different magnetic sublattices of hexagons (shown as green, blue, and yellow in Figure 1b). Within each hexagon, the spins are antiferromagnetically coupled and neighboring hexagons are coupled to each other via spins (shown in grey) whose directions are fully determined by the neighboring hexagons (slave spins).[42]
Figure 5b and c contain the calculated spin density of states (SDOS) and the corresponding spin-wave dispersion in the relevant energy range, below meV (1 meV corresponds to 8.065 cm-1). Several energies with a density of states, corresponding to characteristic energy scales of the THz , are marked by dashed lines. The spin-wave dispersion of Y-kapellasite is gapless and degenerated at the -point (Goldstone mode); possible one-magnon excitations are outside our THz spectral range (Figure S10). As introduced above, a one-magnon process only measures the response at the zone center; in stark contrast to multi-center magnon excitations that can expand over the entire Brillouin zone. For the latter case, due to momentum conservation, the total wavevector of the participating magnons must be zero, , which is accomplished by the simultaneous magnon excitations in three distinct magnetic sublattices. Within this picture, the steady development of the continuum-like absorption without any additional features across can be explained by multi-center magnon absorptions. The one-magnon excitations are outside our accessible spectral range and only the multi-center magnons are observed. As illustrated in Figure 5d, the spin-wave dispersion beyond the -point gets accessible via such excitations. Indeed, towards the K-direction the degeneracy is lifted and the lowest band exhibits a parabolic shape (Figure 5c). Around meV the band flattens and reaches a maximum. This shape of the dispersion yields a large number of available states in the low-energy range and generates the maximum in the SDOS at meV which is related to the peak at meV (12 cm-1) in . At higher energies, around meV, the density of states increases again with the next two higher-lying bands reaching their maxima. At meV the number of available states drops significantly before it peaks again at around meV (parabola minima of the next higher bands). Indeed, these states are related to the peak-like contributions between and cm-1 ( and meV) in (Figure 5a). There is a small offset of about meV between experimental results and calculations, probably due to a small mismatch in parameters between experiment and theory.
Overall, including the multi-center magnon picture, the SDOS from the linear spin-wave calculations show a remarkable agreement with the experimental result, . Furthermore, based on the SDOS, we calculated the expected , validating the observed spectral shape (cf. Figure S11). The agreement with theory even extends to the magnetic field dependence. Figure 5b displays the change of the SDOS with magnetic field. Under external magnetic field, the spin dispersion becomes gapped and the weight of the SDOS shifts up in energy (Figure S12 and S13). In addition, the meV maximum reveals a strong shift under magnetic field, it is slightly different than the one obtained for the meV and meV peaks. We note that the calculations overestimate the magnetic field scale compared to that of the experiment, perhaps due to demagnetization effects. Still, these trends under external magnetic field are corroborating the result of our magneto-THz spectroscopy, displayed in Figure 4.
3 Discussion
Our THz study allows to directly probe the spin density of states via optical spectroscopy; by utilizing multi-center magnon absorption we gain access to the SDOS over the entire Brillouin zone, i.e. we actually perform THz magnetometry. In Y-kapellasite, strong short-range magnetic correlations lead to spin fluctuations over a wide temperature range. The paramagnonic behavior is aided by these fluctuations explaining the development of the THz continuum-like absorption together with the onset of short-range magnetic correlations. The lattice distortion, on the other hand, lowers the spatial symmetry and generates three magnetic sublattices. This distortion is decisive for multi-center magnon excitations to occur. In particular, the magnetic superstructure favors simultaneous magnon excitations where each of the participating magnon excitations occurs, respectively, at one of the three magnetic sublattices, i.e. three-center magnon, while in total the net momentum is conserved (), as illustrated in Figure 1b (see supplement for further discussion, Figure S14). We suggest that the role of distortion could be further verified in other kagome lattices. [42, 45, 46, 47] But for the case of Y-kapellasite, the distortion seems to be crucial for the multi-center magnon absorption given that Herbertsmithite, which is considered as a perfect kagome structure,[39] does not reveal any signature of multi-center magnons (Figure S15).[48, 49]
Such a symmetry breaking can also be phonon-assisted.[50, 51] We note that similar suggestions were made for the parent compound of cuprates with an underlying square lattice. In those cases, the observed features were associated with the coupling between magnons and phonons leading to enhanced excitation frequencies in the mid-infrared range.[52, 53] The magneto-elastic coupling may be represented in the temperature dependence of the phonon modes. In the present case, we observe unusual redshifts and anomalies of the infrared-active phonons accompanied by the development of short-range magnetic correlations (Figure S6).
Overall, the comparison of our experimental results with linear spin-wave calculations suggests that for a proper description a multi-center magnon picture is required: we have to go beyond a simple magnetic mode in order to explain the THz excitations. In fact, the multi-center magnon absorption in Y-kapellasite resembles the conventional two-center magnon absorption observed in classical antiferromagnets: FeF2, MnF2, CoF2, and NiF2.[54, 55, 56, 27, 57, 25, 31] Utilizing Dexter’s theory of cooperative optical absorption,[58] earlier reports proposed several mechanisms,[54, 55, 59] where the removal of centrosymmetric points is supposed to be particularly necessary for the non-vanishing electric dipole moment.[27]
The former studies confined the two-center magnon absorption as electric dipole active phenomena; but there is no reason for this limitation. Recently, a direct coupling between the magnetic state and light was proposed; the detection takes place over the free induction decay.[19, 20, 21, 22] As well, accounting for the two magnetic sublattices in conventional antiferromagnets, traditionally only a two-center absorption was considered. Moreover, the optical selection rule for the three-center magnon excitation might differ from the conventional one-magnon picture (, the spin difference between initial and excited state). For example, the two-center magnon excitation was discussed before with an altered optical selection rule.[60, 61] All these now turn into limiting factors when a more detailed and generalized microscopic picture has to be established for the multi-center magnon absorption. Together with a refined understanding, our approach might be applicable in a large pool of materials.
We further discuss the relation of the THz multi-center magnon absorption to similar multimagnon processes observed in other quantum magnets of low symmetry. For quantum magnets, often a virtual process via the magnon decay [62] is discussed, which has been observed in Raman/ neutron scattering.[63, 64, 65, 66] Note that multimagnon scattering (photon/ neutron scatters by creating multiple magnons) and THz multi-center magnon absorption (multi-center magnon: one photon gets absorbed, simultaneously creating multiple magnons in different magnetic sublattices) need to be discerned with distinct optical selection rules.[27] Moreover, the higher-order magnon contributions beyond linear spin-wave theory are as well discussed in THz absorption. [67] However, these are different from the multi-center magnon absorption, subject of our study. Regarding higher-order magnons, mixing of one-magnon branches with multimagnon states can occur as a result of the low symmetry of the spin interactions as in -RuCl3. [68, 69] A further example can be found in the case of Yb2Ti2O7, showing a field-induced decay of the one-magnon branch into a two-magnon continuum.[63]. In Y-kapellasite, however, neither geometrical frustration nor anisotropic spin interactions seem to be present in the system [42] excluding the magnon decay processes from the present case. Nevertheless, we note that a multi-center magnon based extraction of the SDOS with THz spectroscopy, as presented in this work, might be possible even in the presence of a decay mechanism.
There are several issues concerning the magnetic properties of Y-kapellasite which should be addressed in future investigations. One particularly interesting issue remaining is the persistent spin dynamics in the magnetically ordered state below K [43] which might be related to the successive spin freezing observed in the susceptibility, Figure 2c. For optical measurements, such a low temperature (mK range) is still challenging. Hence, complementary experimental techniques are required to scrutinize this exotic behavior. In addition, an investigation of the microscopic origin of the short-range magnetic correlations much above could be a focus of further studies.
4 Conclusion
In conclusion, in our proof-of-principle experiment, we establish THz time-domain spectroscopy as a method to directly probe the spin density of states expanding its capability from to excitations over the entire Brillouin zone: THz magnetometry. The three-center magnon absorption in the exotic magnetic superstructure of Y-kapellasite is the key mechanism behind this observation. Driven by short-range magnetic interactions, the absorption persists well above the magnetic ordering temperature, i.e. we do observe paramagnons. The multi-center magnon absorption allows easy access to the spin density of states for suitable magnets, in particular in systems with low symmetry.
5 Experimental Section
Crystal growth and characterization Crystals were grown via a horizontal external gradient growth method. This optimized synthesis leads to nearly perfect defect-free single crystals with large facets (kagome-planes between 2 and 3 mm and thickness of around 0.5-1 mm), see supplement, Figure S1. The results of X-ray diffraction is presented in Figure S2. The ac and dc magnetic susceptibilities were measured as explained in the supplement.
THz-TDS measurements THz time-domain spectroscopy (THz-TDS) measures the time-dependent electric field.[24] Through a Fast Fourier Transformation (FFT), intensity and phase can be obtained. This allows us to directly calculate the optical response functions.[2, 1] A typical time-trace of the transient electric field shows an oscillating behavior with a strong pulse at early times (main pulse). Due to their short lifetime, electronic transitions or phononic resonances are, in general, contained in the main pulse. However, phenomena with a longer lifetime, such as magnetic resonances, can extend to longer times (over several tens of ps), exceeding the main pulse.[30, 29, 20, 21, 22]
THz-TDS measurements were carried out in transmission geometry on oriented single crystals ( ) at several temperatures between and K with a helium bath cryostat. Magneto-optical THz measurements were performed in Faraday geometry ( , ) with static magnetic field strengths up to T and temperatures down to K. The absorption coefficient was calculated from the transmittance Tr by , where is the sample thickness. The integrated absorption coefficient resembles the optical spectral weight and provides a quantitative access to the spectral features (see supplement for further information). The frequency-dependent magnetic susceptibility was calculated by referencing to the high-temperature dielectric response,[70, 8, 5, 7] i.e. the K spectrum, see supplement for further information. This quantity encodes the SDOS, as previously shown for the case.[5]
ESR measurements Temperature-dependent electron spin resonance (ESR) measurements in the X-band frequency were carried out. The in-plane response was determined with a microwave field and external magnetic field . More details are discussed in the supplement.
NMR characterizationNuclear magnetic resonance (1H-NMR) experiments were performed on a sized Y-kapellasite single crystal with magnetic field ( T) aligned parallel to the kagome layers (). The spin-lattice relaxation rate was measured by non-selective excitation of the full line. was determined through saturation-recovery using single-exponential fits. Temperature control in the range from 4 to 200 K was achieved using a 4He cryostat with a variable-temperature insert.
High-field magnetization The high-field magnetization was determined between and K in pulsed magnetic fields up to T for in-plane and out-of-plane orientations. Further information can be found in the supplement. Measurements were performed at the high field laboratory in Dresden, Germany (HLD-EMFL).
DFT and LSWT calculations The phonon frequencies were calculated using a combination of the PHONOPY package [71, 72] and Density Functional Theory (DFT) as implemented in the Vienna Ab-Initio Simulation Package (VASP) code.[73, 74, 75] The details of the calculations are in the supplemental material. The magnon dispersion was determined by using linear spin-wave theory (LSWT) as implemented in SpinW 3.0.[76] The details are explained in the supplement.
Supporting Information
Supporting Information is available from the Wiley Online Library or from the author.
Acknowledgements
We thank Artem Pronin, Guratinder Kaur, and Reinhard K. Kremer for fruitful discussion, Björn Miksch and Lena N. Majer for help with the ESR measurements and Gabriele Untereiner for continuous technical support. The project was supported by the HLD-HZDR, member of the European Magnetic Field Laboratory (EMFL), and the Deutsche Forschungsgemeinschaft (DFG). A.R. and R.V. thank the DFG through TRR 288-422213477 (project A05). Y.L. acknowledges support by China Postdoctoral Science Foundation (Grant No. 2019M660249) and National Natural Science Foundation of China (Grant No. 12004296). M.M. acknowledges the Swiss National Science Foundation (Grant No. 206021_139082). A.P. acknowledges support by the Alexander von Humboldt Foundation through the Feodor Lynen Fellowship. The work at University of California, Los Angeles, was supported by NSF Grant 2004553.
Author contributions
These authors contributed equally: T.B. and S.R.
T.B., S.R. performed the spectroscopic measurements and analyzed the data. P.P., K.M.Z, C.K. grew the crystals. P.P., J.W., S.S., D.G., Y.S., M.M. performed the magnetic characterization. J.N. performed the structural characterization. A.P., S.E.B did the NMR measurements. A.R. performed the LSDW analysis. Y.L. calculated the phonon dispersion. A.P. contributed to the infrared measurements. T.B., S.R., P.P. wrote the manuscript with input from all authors. P.P., T.B., S.R. initiated the project. M.D. and R.V. supervised the project.
Competing Interests
The authors declare that they have no competing financial interests.
Correspondence
Correspondence and requests for materials should be addressed to
M.D. (dressel@pi1.physik.uni-stuttgart.de),
P.P. (p.puphal@fkf.mpg.de) or R.V. (valenti@itp.uni-frankfurt.de).
References
- [1] M. Dressel, G. Grüner, Electrodynamics of Solids: Optical Properties of Electrons in Matter, Cambridge University Press, Cambridge, 2002.
- [2] D. B. Tanner, Optical Effects in Solids, Cambridge University Press, Cambridge, 2019.
- [3] R. S. Fishman, J. A. Fernandez-Baca, T. Rõõm, Spin-Wave Theory and its Applications to Neutron Scattering and THz Spectroscopy, Morgan & Claypool Publishers, San Rafael, 2018.
- [4] D. Wulferding, Y. Choi, W. Lee, K.-Y. Choi, J. Condens. Matter Phys. 2019, 32, 4 043001.
- [5] X. Zhang, F. Mahmood, M. Daum, Z. Dun, J. A. M. Paddison, N. J. Laurita, T. Hong, H. Zhou, N. P. Armitage, M. Mourigal, Phys. Rev. X 2018, 8 031001.
- [6] A. Little, L. Wu, P. Lampen-Kelley, A. Banerjee, S. Patankar, D. Rees, C. A. Bridges, J.-Q. Yan, D. Mandrus, S. E. Nagler, J. Orenstein, Phys. Rev. Lett. 2017, 119 227201.
- [7] P. Chauhan, F. Mahmood, H. J. Changlani, S. M. Koohpayeh, N. P. Armitage, Phys. Rev. Lett. 2020, 124, 037203.
- [8] N. J. Laurita, J. Deisenhofer, L. Pan, C. M. Morris, M. Schmidt, M. Johnsson, V. Tsurkan, A. Loidl, N. P. Armitage, Phys. Rev. Lett. 2015, 114 207201.
- [9] T. M. H. Nguyen, L. J. Sandilands, C. H. Sohn, C. H. Kim, A. L. Wysocki, I.-S. Yang, S. J. Moon, J.-H. Ko, J. Yamaura, Z. Hiroi, T. W. Noh, Nat. Commun. 2017, 8, 1 251.
- [10] L. Wu, A. Little, E. E. Aldape, D. Rees, E. Thewalt, P. Lampen-Kelley, A. Banerjee, C. A. Bridges, J.-Q. Yan, D. Boone, S. Patankar, D. Goldhaber-Gordon, D. Mandrus, S. E. Nagler, E. Altman, J. Orenstein, Phys. Rev. B 2018, 98 094425.
- [11] J. R. Hortensius, D. Afanasiev, M. Matthiesen, R. Leenders, R. Citro, A. V. Kimel, R. V. Mikhaylovskiy, B. A. Ivanov, A. D. Caviglia, Nat. Phys. 2021, 17, 9 1001.
- [12] J. Walowski, M. Münzenberg, J. Appl. Phys. 2016, 120, 14 140901.
- [13] A. Eschenlohr, U. Bovensiepen, J. Condens. Matter Phys. 2017, 30, 3 030301.
- [14] P. Němec, M. Fiebig, T. Kampfrath, A. V. Kimel, Nat. Phys. 2018, 14, 3 229.
- [15] T. Kampfrath, K. Tanaka, K. A. Nelson, Nat. Photonics 2013, 7, 9 680.
- [16] A. V. Kimel, A. Kirilyuk, P. A. Usachev, R. V. Pisarev, A. M. Balbashov, Th. Rasing, Nature 2005, 435, 7042 655.
- [17] T. Kampfrath, A. Sell, G. Klatt, A. Pashkin, S. Mährlein, T. Dekorsy, M. Wolf, M. Fiebig, A. Leitenstorfer, R. Huber, Nat. Photonics 2011, 5, 1 31.
- [18] C. Vicario, C. Ruchert, F. Ardana-Lamas, P. M. Derlet, B. Tudu, J. Luning, C. P. Hauri, Nat. Photonics 2013, 7, 9 720.
- [19] F. Hansteen, A. Kimel, A. Kirilyuk, T. Rasing, Phys. Rev. Lett. 2005, 95 047402.
- [20] M. Nakajima, A. Namai, S. Ohkoshi, T. Suemoto, Opt. Express 2010, 18, 17 18260.
- [21] K. Yamaguchi, M. Nakajima, T. Suemoto, Phys. Rev. Lett. 2010, 105 237201.
- [22] K. Yamaguchi, T. Kurihara, Y. Minami, M. Nakajima, T. Suemoto, Phys. Rev. Lett. 2013, 110 137204.
- [23] W. Zhang, P. Maldonado, Z. Jin, T. S. Seifert, J. Arabski, G. Schmerber, E. Beaurepaire, M. Bonn, T. Kampfrath, P. M. Oppeneer, D. Turchinovich, Nat. Commun. 2020, 11, 1 4247.
- [24] J. Neu, C. A. Schmuttenmaer, J. Appl. Phys. 2018, 124, 23 231101.
- [25] G. B. Wright, editor, Light Scattering Spectra of Solids, Springer Berlin Heidelberg, Berlin, Heidelberg, 1969.
- [26] P. A. Fleury, R. Loudon, Phys. Rev. 1968, 166 514.
- [27] R. Loudon, Adv. Phys. 1968, 17, 66 243.
- [28] S. M. Rezende, A. Azevedo, R. L. Rodríguez-Suárez, J. Appl. Phys. 2019, 126, 15 151101.
- [29] K. Grishunin, T. Huisman, G. Li, E. Mishina, T. Rasing, A. V. Kimel, K. Zhang, Z. Jin, S. Cao, W. Ren, G.-H. Ma, R. V. Mikhaylovskiy, ACS Photonics 2018, 5, 4 1375.
- [30] J. Lu, X. Li, H. Y. Hwang, B. K. Ofori-Okai, T. Kurihara, T. Suemoto, K. A. Nelson, Phys. Rev. Lett. 2017, 118 207204.
- [31] M. F. Thorpe, J. Appl. Phys. 1970, 41, 3 892.
- [32] S. Azuma, M. Sato, Y. Fujimaki, S. Uchida, Y. Tanabe, E. Hanamura, Phys. Rev. B 2005, 71 014429.
- [33] M. Le Tacon, G. Ghiringhelli, J. Chaloupka, M. Moretti Sala, V. Hinkov, M. W. Haverkort, M. Minola, M. Bakr, K. J. Zhou, S. Blanco-Canosa, C. Monney, Y. T. Song, G. L. Sun, C. T. Lin, G. M. De Luca, M. Salluzzo, G. Khaliullin, T. Schmitt, L. Braicovich, B. Keimer, Nat. Phys. 2011, 7, 9 725.
- [34] H. J. Qin, Kh. Zakeri, A. Ernst, J. Kirschner, Phys. Rev. Lett. 2017, 118 127203.
- [35] C. Kadlec, V. Goian, K. Z. Rushchanskii, P. Kužel, M. Ležaić, K. Kohn, R. V. Pisarev, S. Kamba, Phys. Rev. B 2011, 84 174120.
- [36] L. Balents, Nature 2010, 464, 7286 199.
- [37] P. Mendels, F. Bert, C. R. Phys. 2016, 17, 3 455.
- [38] Y. Kohama, H. Ishikawa, A. Matsuo, K. Kindo, N. Shannon, Z. Hiroi, Proc. Natl. Acad. Sci. U.S.A. 2019, 116, 22 10686.
- [39] M. R. Norman, Rev. Mod. Phys. 2016, 88 041002.
- [40] J. Knolle, R. Moessner, Annu. Rev. Condens. Matter Phys. 2019, 10, 1 451.
- [41] P. Puphal, M. Bolte, D. Sheptyakov, A. Pustogow, K. Kliemt, M. Dressel, M. Baenitz, C. Krellner, J. Mater. Chem. C 2017, 5 2629.
- [42] M. Hering, F. Ferrari, A. Razpopov, I. I. Mazin, R. Valentí, H. O. Jeschke, J. Reuther, Npj Comput. Mater. 2022, 8, 1 10.
- [43] Q. Barthélemy, P. Puphal, K. M. Zoch, C. Krellner, H. Luetkens, C. Baines, D. Sheptyakov, E. Kermarrec, P. Mendels, F. Bert, Phys. Rev. Mater. 2019, 3 074401.
- [44] A. Pustogow, Y. Li, I. Voloshenko, P. Puphal, C. Krellner, I. I. Mazin, M. Dressel, R. Valentí, Phys. Rev. B 2017, 96 241114.
- [45] D. Watanabe, K. Sugii, M. Shimozawa, Y. Suzuki, T. Yajima, H. Ishikawa, Z. Hiroi, T. Shibauchi, Y. Matsuda, M. Yamashita, Proc. Natl. Acad. Sci. U.S.A. 2016, 113, 31 8653.
- [46] H. Ishikawa, D. Nishio-Hamane, A. Miyake, M. Tokunaga, A. Matsuo, K. Kindo, Z. Hiroi, Phys. Rev. Mater. 2019, 3 064414.
- [47] D. Boldrin, B. Fåk, E. Canévet, J. Ollivier, H. C. Walker, P. Manuel, D. D. Khalyavin, A. S. Wills, Phys. Rev. Lett. 2018, 121 107203.
- [48] D. V. Pilon, C. H. Lui, T.-H. Han, D. Shrekenhamer, A. J. Frenzel, W. J. Padilla, Y. S. Lee, N. Gedik, Phys. Rev. Lett. 2013, 111 127401.
- [49] A. C. Potter, T. Senthil, P. A. Lee, Phys. Rev. B 2013, 87 245106.
- [50] M. Windt, M. Grüninger, T. Nunner, C. Knetter, K. P. Schmidt, G. S. Uhrig, T. Kopp, A. Freimuth, U. Ammerahl, B. Büchner, A. Revcolevschi, Phys. Rev. Lett. 2001, 87 127002.
- [51] M. Grüninger, D. van der Marel, A. Damascelli, A. Erb, T. Nunner, T. Kopp, Phys. Rev. B 2000, 62 12422.
- [52] J. Lorenzana, G. A. Sawatzky, Phys. Rev. Lett. 1995, 74 1867.
- [53] J. D. Perkins, J. M. Graybeal, M. A. Kastner, R. J. Birgeneau, J. P. Falck, M. Greven, Phys. Rev. Lett. 1993, 71 1621.
- [54] J. W. Halley, I. Silvera, Phys. Rev. Lett. 1965, 15 654.
- [55] Y. Tanabe, T. Moriya, S. Sugano, Phys. Rev. Lett. 1965, 15 1023.
- [56] S. J. Allen, R. Loudon, P. L. Richards, Phys. Rev. Lett. 1966, 16 463.
- [57] M. F. Thorpe, R. J. Elliott, In G. B. Wright, editor, Light Scattering Spectra of Solids, chapter C-2, 199–206. Springer Berlin Heidelberg, Berlin, Heidelberg, 1969.
- [58] D. L. Dexter, Phys. Rev. 1962, 126 1962.
- [59] J. W. Halley, Phys. Rev. 1967, 154 458.
- [60] L. L. Lohr, Coord. Chem. Rev. 1972, 8, 3 241.
- [61] Y. Tanabe, E. Hanamura, J. Phys. Soc. Japan 2005, 74, 2 670.
- [62] M. E. Zhitomirsky, A. L. Chernyshev, Rev. Mod. Phys. 2013, 85 219.
- [63] J. D. Thompson, P. A. McClarty, D. Prabhakaran, I. Cabrera, T. Guidi, R. Coldea, Phys. Rev. Lett. 2017, 119 057203.
- [64] T. Hong, Y. Qiu, M. Matsumoto, D. A. Tennant, K. Coester, K. P. Schmidt, F. F. Awwadi, M. M. Turnbull, H. Agrawal, A. L. Chernyshev, Nat. Commun. 2017, 8, 1 15148.
- [65] D. Wulferding, Y. Choi, S.-H. Do, C. H. Lee, P. Lemmens, C. Faugeras, Y. Gallais, K.-Y. Choi, Nat. Commun. 2020, 11, 1 1603.
- [66] A. Sahasrabudhe, D. A. S. Kaib, S. Reschke, R. German, T. C. Koethe, J. Buhot, D. Kamenskyi, C. Hickey, P. Becker, V. Tsurkan, A. Loidl, S. H. Do, K. Y. Choi, M. Grüninger, S. M. Winter, Z. Wang, R. Valentí, P. H. M. van Loosdrecht, Phys. Rev. B 2020, 101 140410.
- [67] L. Pan, S. K. Kim, A. Ghosh, C. M. Morris, K. A. Ross, E. Kermarrec, B. D. Gaulin, S. M. Koohpayeh, O. Tchernyshyov, N. P. Armitage, Nat. Commun. 2014, 5, 1 4970.
- [68] S. M. Winter, K. Riedl, P. A. Maksimov, A. L. Chernyshev, A. Honecker, R. Valentí, Nat. Commun. 2017, 8, 1 1152.
- [69] Z. Wang, S. Reschke, D. Hüvonen, S.-H. Do, K.-Y. Choi, M. Gensch, U. Nagel, T. Rõõm, A. Loidl, Phys. Rev. Lett. 2017, 119 227202.
- [70] K. Kozuki, T. Nagashima, M. Hangyo, Opt. Express 2011, 19, 25 24950.
- [71] A. Togo, F. Oba, I. Tanaka, Phys. Rev. B 2008, 78 134106.
- [72] A. Togo, I. Tanaka, Scr. Mater. 2015, 108 1.
- [73] G. Kresse, J. Hafner, Phys. Rev. B 1993, 47 558.
- [74] G. Kresse, J. Furthmüller, Phys. Rev. B 1996, 54 11169.
- [75] G. Kresse, J. Furthmüller, Comput. Mater. Sci. 1996, 6, 1 15.
- [76] S. Toth, B. Lake, J. Condens. Matter Phys. 2015, 27, 16 166002.
See pages - of supplement.pdf