Constraining Axion-Like Particles with HAWC Observations of TeV Blazars
Abstract
Axion-like particles (ALPs) are a broad class of pseudo-scalar bosons that generically arise from broken symmetries in extensions of the standard model. In many scenarios, ALPs can mix with photons in regions with high magnetic fields. Photons from distant sources can mix with ALPs, which then travel unattenuated through the Universe, before they mix back to photons in the Milky Way galactic magnetic field. Thus, photons can traverse regions where their signals would normally be blocked or attenuated. In this paper, we study TeV -ray observations from distant blazars, utilizing the significant -ray attenuation expected from such signals to look for excess photon fluxes that may be due to ALP-photon mixing. We find no such excesses among a stacked population of seven blazars and constrain the ALP-photon coupling constant to fall below 310-11 GeV-1 for ALP masses below 300 neV. These results are competitive with, or better than, leading terrestrial and astrophysical constraints in this mass range.
I Introduction
Axions and Axion-like particles (ALPs) are a broad group of spin-0 particles that appear in several extensions of the Standard Model of Particle Physics (SM). The QCD axion was originally motivated as a particle that arises in the Peccei-Quinn solution to the strong CP problem of QCD Peccei and Quinn (1977); Weinberg (1978); Wilczek (1978); Kim (1987). A broader class of ALPs has been found to generically appear in Kaluza-Klein and superstring theories Witten (1984); Svrcek and Witten (2006); Conlon (2006a, b); for a review see Ringwald (2014). These particles are typically light, yet nonrelativistic, and only weakly coupled to standard model particles, making them suitable dark matter (DM) candidates.
Many ALP searches make use of its coupling to photons, described by the following Lagrangian:
| (1) |
where is the axion photon coupling constant, denotes the ALP field strength, is the electric field of the photon, and in the strength of an external magnetic field. Through this coupling, ALPs and photons can convert into each other in the presence of an external field. This mixing can be used to search for axions and ALPs in laboratory experiments Sikivie (1983); van Bibber et al. (1989) and could produce observable effects in astrophysical systems, motivating searches in the Sun, supernovae and gamma-ray bursts Raffelt (1990); Berezhiani and Drago (2000); Csaki et al. (2002); Deffayet et al. (2002); Raffelt (2008); Simet et al. (2008).
Of particular interest for this study, the flux of high-energy -rays produced in distant sources and measured on Earth may be significantly modified by photon/axion conversion in the presence of local magnetic fields. While primary -rays from the sources would be absorbed due to interactions with extragalactic background photons, the ALPs can survive the long journey and then re-convert to secondary -rays in the field of the Milky Way. While such a process is rare because two ALP-photon conversions are necessary, it can produce a detectable excess because very high-energy (VHE, 1 TeV) -rays are severely attenuated by the radiation fields of the intergalactic medium (IGM).
Thus, if a significant VHE -ray flux is detected, ALPs provide a leading explanation.
Models of photon-photon interactions over intergalactic distances indicate that the extragalactic background light (EBL) Hauser and Dwek (2001); Dominguez et al. (2011a), which consists of the total radiation from star formation processes and active galactic nuclei (AGN), should be opaque to VHE photons Jelley (1966); Gould and Schréder (1967). The attenuation of photons traveling through the EBL is dominated by pair production: above a threshold given by:
| (2) |
where is the photon energy and is the angle between the photons. Once this threshold is exceeded, the Universe becomes essentially opaque to VHE photons. This phenomenon suggests that the EBL can be used as a “screen” to test for axion-photon conversion via an intergalactic “light through a wall” experiment Van Bibber et al. (1987).
In this paper, we focus on blazars, which are a class of distant AGN that produce a considerable VHE -ray flux within the accretion disk surrounding the supermassive black hole at their center. AGNs produce two jets perpendicular to the accretion disk, which consist of plasma moving at relativistic speeds. If this jet is oriented towards us, the -ray luminosity is maximized and the AGN is classified as a blazar. Blazars are well-suited for studying the effects of ALPs due to their high -ray flux and strong magnetic fields, which promote axion-photon conversion Blake (1970); Blandford and Znajek (1977); Maraschi et al. (1992).
Studies of axion-photon conversion at VHE are, in a sense, simpler than at GeV energies, where searches typically look for an axion-induced “excess” on top of the primary -ray signal from the blazar itself. Such searches for spectral irregularities have been performed by the Fermi collaboration, which find no evidence for axion-like particles Ajello et al. (2016). The flux at VHEs can be significantly altered by ALP-photon oscillations in magnetic fields (De Angelis et al. (2007)), a process that can be detected by current and future telescopes such as HAWC and the Cherenkov Telescope Array (CTA). Studies of the sensitivity of future telescopes to this process have been completed by e.g. Mirizzi et al. (2007); Sanchez-Conde et al. (2009); Meyer and Conrad (2014); Meyer et al. (2014). In particular, Meyer and Conrad Meyer and Conrad (2014) (hereafter, MC14) produced models of the TeV flux from known blazars to predict the portions of parameter space in which upcoming Cherenkov Telescope Array (CTA) observations could constrain the axion parameter space. They included four blazars in their paper and found that for all of these blazars, there were previously untested regions in ALP parameter space where CTA is sensitive to exclude the no ALP hypothesis Reesman and Walker (2014); Meyer et al. (2017).
In this paper, we focus on observations from the High-Altitude Water Cherenkov Telescope (HAWC). HAWC serves as an optimal instrument for detecting ALP-photon conversion due to its large effective area, sensitivity to a range of photons exceeding 1-100 TeV, and large field of view Abeysekara et al. (2013). Recently, the HAWC collaboration published their third catalogue of TeV -ray sources (3HWC) Albert et al. (2020). With observations spanning over 4 years and covering of the sky, reaching a peak sensitivity at declinations of 20∘. Importantly, the 3HWC catalog includes an interactive tool, from which the source significance and flux upper limits can be computed for any sky position within the HAWC field of view 111https://data.hawc-observatory.org/datasets/3hwc-survey/coordinate.php. Because the 3HWC catalog computes source significances at a standardized energy of 7 TeV, we complement the HAWC data with additional lower-energy data by an ”array” of Atmospheric Cherenkov Telescopes (ACTs) including VERITAS, H.E.S.S. and MAGIC Holder et al. (2006); Hinton (2004); Lorenz (2004).
In this paper, we calculate the expected -ray flux from 9 blazars in models that either include or do not include an ALP component. The sources have been selected from the Fermi-LAT high energy source catalogue Abdollahi et al. (2020), which provides an unbiased selection of sources due to the completeness of the Fermi-LAT exposure. We produce a joint-likelihood analysis across all sources, finding no evidence for an ALP component, and set strong upper limits on the ALP-photon mixing parameters, which due to the high-energy sensitivity of HAWC, extend to higher ALP masses than previous -ray studies Buehler et al. (2020); Meyer and Petrushevska (2020).
The outline for the paper is as follows. In Section II we give a brief review of theory behind ALP-photon oscillations in external magnetic fields. In Section III we describe the magnetic field models we have used in our calculations of the ALP-photon mixing from the blazar to the Milky Way. In Section IV we calculate the -ray spectrum from blazars in models with, or without, an ALP component. In Section V we discuss the properties of the individual blazar sources that have been used in our analysis and what selection criteria have been used. In Section VI we present the statistical tests that have been used to determine whether the ALP hypothesis gives a good fit to the observed fluxes from ACTs and HAWC. In Section VII we present our results and finally in Section VIII we present our conclusions.
II ALP-photon Oscillations
In this section, we give a brief review (following Raffelt and Stodolsky (1988); De Angelis et al. (2011)) of the theory behind ALP-photon oscillations in the presence of external magnetic fields due to the Lagrangian in Eq. (1).
We study a monochromatic, polarized ALP-photon beam travelling through a cold medium with energy and wave vector k; for concreteness we take the direction of motion of the beam to be in the direction. The beam has the following equation of motion:
| (3) |
where . Here, are the photon amplitudes polarized along the - and -axis, is the ALP field, and is the mixing matrix. The propagation of a generic wave function can be written as: , where is the transfer matrix that solves Eq. (3) with initial condition .
Since the photons are propagating through a cold plasma, charge screening produces an effective photon mass which results in a plasma frequency:
| (4) |
Neglecting Faraday rotation, and setting the magnetic field to be pointed along the x-axis, the mixing matrix becomes,
| (5) |
where and . Axion-photon conversion becomes maximal and independent of energy (the strong mixing regime) for where
| (6) | ||||
Here G is the critical magnetic field. At energies above , ALP-photon oscillations are damped due to QED vacuum polarization.
Photon polarization cannot be measured in the VHE band, thus we focus our analysis on the total photon intensity from summing all polarization states. The beam can be described by a generalized polarization density matrix, , which obeys the following commutator relation:
| (7) |
The commutation relation can then be solved as . The photon survival probability (defined as the fraction of photons after mixing in consecutive domains) for a photon beam, , which is initially unpolarized, is given by:
| (8) |
where and denotes the polarization along the and axes. Given that the initial polarization of astrophysical blazars in the -ray band is not currently known, we set the initial photon state to be a linear combination of these two polarization states. The magnetic field is not homogeneous in most astrophysical environments. For such fields, the transfer matrix can be split up into N domains, where the magnetic field is treated as constant in each domain. The transfer matrix is then:
| (9) |
where is the angle between the transverse magnetic field in domain and the polarization state along . Since the mixing matrix also includes photon absorption, also includes absorption in the EBL and reduces to when there is no mixing between photons and ALPs ().
III Magnetic field models
Since the mixing between photons and ALPs only occurs in the presence of an external magnetic field, the magnetic field environment between the photon source and the detector are critical for predicting the expected -ray spectrum at Earth. This includes both magnetic fields from the blazar jet itself, as well as the surrounding intra-Cluster magnetic field for sources which exist near the center of large galaxy clusters. For the blazars we consider in our analysis that are members of a galaxy cluster, the intra-cluster magnetic field is usually dominant. In this section, we give a brief overview of the magnetic field models used in our calculation. We include the blazar jet magnetic field, the intra-cluster magnetic field and the Milky Way magnetic field in our analysis. Note that the two former magnetic fields are the most important for our analysis, since these are blazar-dependent.
III.1 Blazar Jet Magnetic Fields
Blazars are AGN whose relativistic jets are pointed directly at the Earth. The simplest jet model was described by Blandford Königl Blandford and Konigl (1979) and has a conical geometry: , where is the radius of the jet, is the opening angle and is the distance from the base of the jet. Since the jet is pointing towards the Earth, the radiation is blue-shifted. Thus, the photon energy in the comoving frame of of the jet, , is related to the energy in the lab frame, , by a Doppler factor :
| (10) |
where is the relativistic Lorentz factor, is the beta factor and is the angle between the jet axis and the line-of-sight.
The jet magnetic field in the vicinity of the VHE emission zone, as a function of the distance to the central black hole, can be modelled by its toroidal component,
| (11) |
where is the distance from the BH to where the VHE emission occurs. For the blazars we consider in our analysis, ranges from 0.02 – 1 G and ranges from 0.003 – 0.141 pc. The specific values of these parameters for each source in our analysis is given in Table 1.
III.2 Intra-cluster magnetic field
In addition to magnetic fields within the blazar jet, blazars that exist within galaxy clusters can include additional fields that facilitate ALP-photon mixing. The magnetic field in galaxy clusters can be modelled as a homogeneous field with Gaussian turbulence – defined as a field with a (directional) mean of zero and variance . The turbulence follows a power-law between the minimum and maximum scales of turbulence, and . The magnetic field follows the radial dependence of the electron density:
| (12) |
where is the distance to the cluster center, is the central density and Ajello et al. (2016). The electron density is parametrized as a -profile Cavaliere and Fusco-Femiano (1976); Govoni and Feretti (2004):
| (13) |
with as the core radius. The magnetic field strength and electron density are typically of the order of and , respectively. In our calculations, we follow Ref. Meyer and Conrad (2014) and set the core radius to kpc for the blazars 1ES0229, PG1553 and PKS1424, which are the sources that lie within large clusters and thus include an additional cluster component to the total -ALP mixing. Because of the random nature of the Gaussian turbulence, it is necessary to simulate a large number of realizations of the magnetic field and investigate the ALP-photon mixing for each of the realizations. In our calculations we have used a total of 300 realizations of the magnetic field, and use the mean value of from these to find the expected flux spectra.
III.3 Intergalactic Magnetic Fields
The strength of the intergalactic magnetic field (IGMF) is unknown, but current limits indicate that it is G Ackermann et al. (2018), but 10-12 G Sigl et al. (2004); Dolag et al. (2005). Notably, the energy density of this magnetic field is much smaller than the Cosmic Microwave Background (CMB) energy density, implying that the IGMF has a negligible effect on particle cooling and attenuation Dominguez et al. (2011b) since losses from ICS of the CMB are more important than synchrotron losses from the magnetic field. Moreover, the pair-conversion probability for particle transport over Gpc distances still falls far below what one would expect in the magnetic fields in the vicinity of the blazar and in the Milky Way. We do not consider the effect of the IGMF in what follows.
III.4 Milky Way galactic field
ALPs can efficiently convert back to photons in the magnetic field of the Milky Way (GMF) Simet et al. (2008). In our calculations, we use the same strategy as MC14 and adopt the coherent component of the model described by Jansson and Farrar Jansson and Farrar (2012). Note that it has been shown in work by e.g. the Planck collaboration Adam et al. (2016), that the random component of the magnetic field is too large in this model. Thus, we are using the modified version of the Jansson Farrar model which takes into account the Planck data, and is included in the GammaALPs package Meyer et al. (2021). We note that unlike searches for diffuse axion fluxes from extragalactic sources Vogel et al. (2019), the fact that we focus on -ray emission from individually known blazars, makes the contribution from the galactic -ray background negligible.
IV Blazar Spectral Models
We closely follow the method outlined in Ref. Meyer et al. (2014) to calculate the expected flux spectra from each source at Earth with and without ALP effects. The calculation can be divided into four main steps: First, we pre-fit the blazar spectrum observed by ACTs with a simple-power law:
| (14) |
where we do not include a spectral cutoff because observations indicate that most blazars do not have an intrinsic spectral cutoff at energies 1 TeV Massaro et al. (2006); Mazin and Raue (2007); Dzhatdoev et al. (2021), though recent observations have indicated that some well-studied blazars such as Mkn 421 and 1ES 1011+496 may show evidence for a spectral cutoff de León et al. (2021); Romoli et al. (2018); Sinha et al. (2017).
Second, the observed spectral data need to be corrected for EBL absorption and possible ALP effects. This is done by dividing the flux data by the averaged photon survival probability, , in each energy bin. The average photon survival probability, , can be calculated as the energy-integrated average:
| (15) |
We calculate the photon survival probability with and without ALPs by using the GammaALPs package Meyer et al. (2021).
Third, to find the intrinsic -ray spectrum of each source, we fit a power law of the same type as Eq.(14) to the absorption corrected data points. For this portion of the fit, we conservatively only include data points in the optically-thin regime () in order to make our result independent of the exact shape of . However, in order to make a reasonable fit to the absorption corrected points we must include at least four points, even if a few of these might fall slightly outside of the optically-thin regime. This produces an improved fit to the intrinsic blazar spectrum that takes into account corrections from EBL absorption.
Finally, we compute the expected -ray spectrum on Earth, , as:
| (16) |
where the intrinsic spectrum, , is now based on our fit to the optically thin data. The expected spectrum on Earth, , is similar to the spectrum observed by ACTs in the low-energy regime, but is extrapolated to large energies (1 TeV) where ALP effects are significant. In order to find the total flux in each energy bin as observed by each telescope, we must take into account the energy dispersion between the true, , and reconstructed energy . The total flux in each bin is then,
| (17) |
where is the energy dispersion which we approximate as a Gaussian with variance .
V Blazar Selection
We select a population of luminous blazars for our analysis as follows. Each source must fulfill four characteristics:
-
1.
The blazar must be included in the Fermi-LAT catalog Abdollahi et al. (2020).
-
2.
The blazar must be observed in an energy range (typically between 100 GeV – 1 TeV), where -ray attenuation is negligible and the primary component is dominant. Such observations have been made by both space-based instruments such as the Fermi-LAT, as well as ground-based Atmospheric Cherenkov Telescopes (ACTs) such as VERITAS, MAGIC and H.E.S.S.. However, we require that the source must have been observed by both Fermi-LAT and a separate ACT. Fermi-LAT typically covers energies in the GeV range, while the ACTs cover energies up to TeV.
-
3.
The blazar must be observed in an optically thick regime (in this study 7 TeV to align with HAWC observations) where the primary -ray flux is suppressed and only the secondary component survives. Following the framework of MC14, we set the minimum optical depth at 7 TeV to be . Notably, given the higher energy range of HAWC observations (compared to previous studies using VERITAS and MAGIC) - a larger number of candidate blazars exist in this study than in Ref. Meyer and Conrad (2014).
-
4.
Finally, we require that the source is not extremely variable – in order that HAWC observations (taken continuously over the last 5 years) have observed similar intrinsic fluxes as lower-energy ACT observations (taken sporadically over the last 10 years). This final requirement must be considered carefully – as the vast majority of blazars are (to some extent) variable. Furthermore, it is possible that ACT observations were scheduled because the blazar was flaring in low-energy observations, which would systematically bias our results.
In addition to these constraints, we require that the source is located at a declination between and , since the sensitivity of HAWC becomes a factor of two worse outside this region. We also require that the photon flux in the 10 – 500 GeV energy range is larger than and that the -ray spectral index , which indicates that these sources should be detectable in both the GeV and TeV regimes.
Noting that these constraints imply that each blazar is easily observed in the Fermi-LAT energy range, we select sources from the Fermi-LAT high-energy source catalog Abdollahi et al. (2020): we find nine sources that meet all criteria: 1ES 0229+200, PKS 1424+240, PG 1553+113, VER J0521+211, 1ES 1218+304, 3C 66A, 1ES 1011+496, MAGIC J2001+435 and PKS 1222+216. We assume that these sources are not associated with a galaxy cluster, unless this has already been established by MC14 or other references found in the source’s TeVCAT page.
Many of the sources have been observed by several ACTs. We base our analysis on the ACT observations that extend to the highest energies. If two observations are similar, we choose the one which has been observed for the longest period of time, since this spectrum will most likely be more similar to what has been observed by HAWC. Because this represents only a handful of sources – the peculiarities of each may significantly affect our calculated limit. Thus, we discuss both the physical parameters and multiwavelength observations of each source below.
V.1 1ES 0229+200
The source 1ES 0229+200 was first discovered by H.E.S.S. Aharonian et al. (2007) in 2006. It has been observed by both VERITAS Cerruti (2013) and H.E.S.S with observation times of 46 and 41.8 hours, respectively. The source has a redshift of Woo et al. (2005), leading us to determine that observations by H.E.S.S extend to an optical depth of while the observations by VERITAS extend to . The HAWC observation at 7 TeV is at an optical depth of 3.15. Since the observations by both H.E.S.S. and VERITAS extend to energies beyond the HAWC observation and have similar exposure times, there is no obvious choice of which spectrum we should use. However, since the H.E.S.S. spectrum has slightly smaller uncertainties and provide an extra data point for our goodness-of-fit analysis, we choose these observations to model the flux spectra at low energies. Note that the spectra observed by VERITAS are comparable with those seen by H.E.S.S.
The source has also been detected by the Fermi-LAT Vovk et al. (2012) reaching a significance of 12.5 in the 4FGL catalog Abdollahi et al. (2020). Fermi-LAT observations also indicate that the variability index of this source is only , significantly less than the critical value of 18.5 used by the 4FGL catalog to assign a source as “variable”. At the time of the H.E.S.S. observations, the source experienced a slight dip in the flux. The flux was of the mean flux, as observed by the Fermi-LAT.
According to MC14, the blazar is located in the vicinity of the galaxy cluster WHL 22793 at a redshift offset of only Hao et al. (2010); Wen et al. (2012). The magnetic field strength throughout this cluster is unknown, and therefore we utilize the same strategy as MC14 and employ a modified version of the magnetic field found around the FR I radio galaxy 3C 449, which is also located in a similar galaxy group. The magnetic field parameters used in our simulations are presented in Table 1.
| Source | 1ES 0229 | PG 1553 | PKS1424 | VER J0521 | 3C 66A | J2001 |
|---|---|---|---|---|---|---|
| R.A.(J2000) | 15h55m44.7s | 14h27m00s | 05h21m45s | 02h22m41.6s | 20h01m15.6s | |
| Dec.(J2000) | +20d16m21s | +11d11m41s | 23d47m40s | +21d12m51.4s | 43d02m35.5s | +43d52m44.4s |
| z | 0.14 | 0.34 | 0.18 | |||
| Var. index Ajello et al. (2020) | 6.799 | 107.2 | 250.7 | 809.0 | 1169 | 1267 |
| Data | H.E.S.S Aharonian et al. (2007) | VERITAS | VERITAS Archambault et al. (2014) | VERITAS Archambault et al. (2013a) | MAGIC Aleksic et al. (2011a) | MAGIC Aleksić et al. (2014a) |
| B-field scenario | ICMF+GMF | Jet+ICMF+GMF | Jet+ICMF+GMF | Jet+GMF | Jet+ICMF+GMF | Jet+GMF |
| 0.5 | 0.0033 | 0.1 | ||||
| 2 | 2 | 2 | 2 | 2 | ||
| 35 | 30 | 12 | 40 | 27 | ||
| 0.063 | 0.057 | 0.026 | 0.011 | 0.095 | ||
| 1 | 1 | 1 | 1 | 1 | ||
| 1 | 1 | 1 | ||||
| 100 | 100 | 100 | 100 | |||
| 19.33 | 19.33 | 19.33 | 19.33 | |||
| 0.42 | 0.42 | 0.42 | 0.42 | |||
| 1 | 1 | 1 | 1 | |||
| 0.015 | 0.015 | 0.015 | 0.015 | |||
| 5 | 5 | 5 | 5 | |||
| q | -2.53 | -2.53 | -2.53 | -2.53 | ||
| Source | 1ES 1218 | 1ES 1011 | PKS 1222 | |||
| R.A.(J2000) | 12h21m26.3s | 10h15m04.1s | 12h24m54.4s | |||
| Dec.(J2000) | +30d11m29s | +49d26m01s | +21d22m46s | |||
| z | 0.18 | 0.21 | 0.43 | |||
| Var. index Ajello et al. (2020) | 60.06 | 267.0 | ||||
| Data | VERITAS Fortin (2009) | MAGIC Ahnen et al. (2016) | MAGIC Aleksic et al. (2011b) | |||
| B-field scenario | Jet+GMF | Jet+GMF | Jet+GMF | |||
| 2 | 2 | 2 | ||||
| 26 | 26 | 15 | ||||
| 0.0031 | 0.065 | 0.097 | ||||
| 1 | 1 | 1 |
V.2 PKS 1424+240
The blazar PKS 1424+240 has been observed by both VERITAS Acciari et al. (2010a); Archambault et al. (2014) and MAGIC Aleksić et al. (2014b). The redshift of the source is uncertain, but current limits constrain Rovero et al. (2016); Yang and Wang (2010). Note that some sources set the lower limit of the redshift as low as 0.24 Prandini et al. (2011); Zahoor et al. (2021). In this paper, we set the blazar redshift to 0.6, which gives us a more conservative limit because it minimizes the value of yielding a smaller difference between the expected fluxes with and without ALP effects.
The most recent observation by VERITAS Archambault et al. (2014) (2013) extends to GeV, which corresponds to an optical depth of for . Using the same redshift, the observation by HAWC at 7 TeV is at an optical depth of 19.8. Observations by MAGIC extend only to GeV. Thus, we will use the flux spectra provided by VERITAS in our analysis.
The source has also been observed by the Fermi-LAT at an extremely high significance of 156. The source has a variability index of 251, which implies that the source does not emit in steady state. However, we stress that the variability index is also strongly proportional to the detection significance – more luminous sources are more likely to be detected as “statistically” variable. In this case, the maximum yearly flux (observed in late 2011) only exceeds the mean source flux by a factor of 1.46, justifying our assertion that this source is, at most, moderately variable Abdollahi et al. (2020). The VERITAS observations from 2013 were performed when the source experienced s slight dip in flux. At this time, the flux was about of the mean flux of the source, as observed by the Fermi-LAT. Note that from 2013 to 2019, the source continued to be in a state where the observed flux was below the mean flux.
Studies of the -ray spectrum conducted by Aleksic et al. Aleksić et al. (2014c) found that the emission from PKS1424 was best fit by a two-zone synchrotron self-Compton model with the following best-fit parameters: a magnetic field strength G, Doppler factor and a radius of cm of the VHE plasma emitting blob. Assuming an angle between the jet and the line of sight of , this gives a bulk Lorentz factor of . An analysis by Ref. Rovero et al. (2016) has found that there is a chance that the blazar is hosted by a group of galaxies located at a redshift of . Since the magnetic field in this environment is unknown, we assume that it can be described by the same parameters as the intracluster magnetic field surrounding 1ES 0229. We will include ALP/photon mixing in both the jet of the AGN and in the intracluster magnetic field in our calculations.
V.3 PG 1553+113
The blazar PG 1553 has been observed by VERITAS Aliu et al. (2015), MAGIC Aleksic et al. (2012) and H.E.S.S Aharonian et al. (2006, 2008). It has also been detected by the Fermi-LAT Abdo et al. (2010), with a significance of 175 in the 4FGL catalog. It was observed by H.E.S.S. for 7.6 hours in 2005 and 17.2 hours in 2006. The source has also been observed by VERITAS for 95 hours and by MAGIC for 28.7 hours. The observations by VERITAS and MAGIC extend to energies up to 0.5 TeV, corresponding to an optical depth of assuming a redshift of 0.43. With the same redshift, the HAWC observation at 7 TeV is at an optical depth of . The 2006 observations by H.E.S.S. extend to energies up to 1 TeV, but are subject to large uncertainties on the flux above 0.45 TeV. Since the H.E.S.S. datapoints with smaller uncertainties are at similar energies to the VERITAS and MAGIC data, we choose to use the data from VERITAS since this is the most recent and has the longest exposure. Since HAWC operates continuously over a 5-year period, the spectrum should be more similar to what has been observed at HAWC with a longer exposure time. At the time of the VERITAS observations, the source experienced slight dip in the flux with of the mean flux, as observed by the Fermi-LAT.
According to the Fermi variability analysis Ackermann et al. (2013), it has a variability index of , which (similar to PKS 1424+240) corresponds to a source that is somewhat variable. In the case of PG 1553+113, the variation between the maximum yearly flux (obtained in late 2017/early 2018) and the mean -ray flux is only 1.23) indicating that flux variability likely has a relatively modest effect on our results.
The distance to this object is uncertain. Danforth et al. Danforth et al. (2010) found in 2010 that a lower limit can be set at , and recent determinations performed by Refs. Abramowski et al. (2015); Nicastro (2018); Jones et al. (2021) seem to prefer a redshift in the range . Thus, we adopt the best-fit value from Refs. Nicastro (2018); Jones et al. (2021) and set the redshift to be .
Ref. Aleksic et al. (2012) models the SED using a one-zone synchrotron model, and find the following best-fits for the parameters that describe the VHE emitting region: G, cm and . By performing a cross-correlation of the galaxy cluster catalogs GMBCG and WHL Hao et al. (2010); Wen et al. (2012), MC14 found that PG 1553 is in the vicinity of a galaxy cluster consisting of 8 member galaxies. Following MC14, we use the same magnetic field parameters for this environment as 1ES0229 and conservatively fix the field strength to .
V.4 VER J0521+211
The intermediate-peaked BL Lac object VER J0521 was first discovered in 2009 and has now has been observed by VERITAS Archambault et al. (2013b) for 14.5 hours. The redshift of this source is still unknown, but a lower limit can be set at Archambault et al. (2013b); Paiano et al. (2017). The VERITAS observations extend to TeV, corresponding to an optical depth of using the lower limit of the redshift. The HAWC observation at 7 TeV is at an optical depth of . Observations in the 4FGL catalog detect this source at a significance of 120 and with a variability index of 809, which makes this source somewhat more variable than PKS 1424+240 and PG 1553+113. The maximum flux was observed in mid-2013 and had a flux that was 1.9 times higher than the average source flux within the 4FGL catalog. At the time of the VERITAS observatios, the source experienced a slight dip in the flux with a flux of of the mean flux, as observed by the Fermi-LAT. Note that there was a similar dip in the flux at the time of the HAWC observations of the source.
A two-zone SSC model of the SED was performed by the MAGIC collaboration in 2020 Acciari et al. (2020). The zone responsible for the VHE emission has the following best-fit parameters: , and radius cm. Given a viewing angle of and a simple, conical jet geometry, the distance between the VHE emitting region and the jet is pc.
The source has not been explicitly associated with a galaxy cluster and thus we will omit any contribution to the ALP-photon mixing from an intra-cluster magnetic field.
V.5 1ES 1218+304
The BL Lac object 1ES 1218 has been observed by VERITAS Acciari et al. (2010b) and MAGIC Albert et al. (2006) for 27.2 and 8.2 hrs, respectively. Note that observations by MAGIC were also performed in 2010 and 2011 during an observation campaign for 1ES 1215+303, where the source always stayed in the field-of-view. However, no energy spectrum is publicly available from this observation campaign Lombardi et al. (2011). Observations by VERITAS extend to TeV while the observations from MAGIC extend to TeV. This corresponds to an optical depth of and respectively, with a redshift of . The HAWC observation at 7 TeV is at an optical depth of . Since the observations from VERITAS extend to higher energies and are taken over a longer period of time, we will use these in our calculations. Note that a flare was detected during the observations performed by VERITAS that lasted over two days, making up of the total live-time. However, changes to the VHE photon index during the flare are statistically insignificant. At the time of the VERITAS observations, the source experienced an increased flux, about of the mean flux as observed by the Fermi-LAT. Note that at the time of the HAWC observations, a similar increase in the flux was observed measuring up to of the mean flux.
The source has been observed in the GeV range by the Fermi-LAT, with 4FGL observations reaching a significance of 69 and a variability index of 60. The maximum annual flux from the source (reached in mid-2018) is roughly 1.4 times brighter than the average source flux.
Singh et al. Singh et al. (2019) found that the zone responsible for emission of VHE photons can be described by a one-zone SSC model with the following parameters: G, cm, and a viewing angle of .
The source has not been explicitly associated with a galaxy cluster and thus we will conservatively omit any contribution to the ALP-photon mixing from an intra-cluster magnetic field.
V.6 3C 66A
The intermediate-frequency peaked BL Lac object 3C 66A has been observed by several telescopes, e.g. VERITAS Acciari et al. (2009) and MAGIC Aleksic et al. (2011a). The blazar is located within a galaxy cluster at Torres-Zafra et al. (2018). Using this redshift, observations by MAGIC extend up to an optical depth of ( TeV) and the observations by VERITAS up to ( TeV). The HAWC observation at 7 TeV is at an optical depth of . The observations by VERITAS were performed when the blazar was in a flaring state. Therefore, we will use the observations by MAGIC to model the low-energy data. At the time of the MAGIC observations, the source experienced an increased flux about times larger than the mean flux as observed by the Fermi-LAT. Note that at the time of the HAWC observations, the source experienced a dip in the flux with a minimal flux of the mean flux.
Fermi-LAT observations in the GeV range detect this source at a significance of 170 with a high variability index of 1170. The maximum annual flux of this source (reached in early 2009) was 1.7 brighter than the average source flux.
The SED of the source was modelled by Ref. Abdo et al. (2011). They model the SED using both a pure SSC model and a SSC+EC model. We will use the best-fit parameters from the SSC+EC model since these models allow for variability timescales in better agreement with what has been reported. The parameters describing the emission region for this model with are: cm, and G. We assume the viewing angle is . The magnetic field of the galaxy cluster is unknown, so again we use the same strategy as MC14 and use the modified version of the magnetic field found around 3C 449.
V.7 1ES 1011+496
The high-frequency peaked BL Lac object 1ES 1011+496 has been observed by both VERITAS Dumm (2013) and MAGIC Ahnen et al. (2016). It has been observed by VERITAS for 10.4 hours and by MAGIC for 19.4 hours (after quality cuts). We will use the observations from MAGIC since they extend over the largest period of time. The flux observed by MAGIC extends up to TeV, or an optical depth of using a redshift of . The HAWC observation at 7 TeV is at an optical depth of .
Fermi-LAT observations detect this source at a significance of 158 in the 4FGL catalog, and with a variability index of 260. The maximum annual GeV -ray flux (observed in late 2014) reaches an amplitude 1.4 times brighter than the average -ray flux over the full observation period. At the time of the MAGIC observations, the source experienced a slight dip in flux about of the mean flux, as observed by the Fermi-LAT.
The MAGIC collaboration has also performed an analysis of the multi-wavelength spectrum of 1ES 1011+496 and used this to model the SED of the source Ahnen et al. (2016). They have found that the SED can be described by a one-zone SSC model with the following parameters: G, , cm. We assume that the viewing angle is , which will be our default viewing angle.
The source has not been explicitly associated with a galaxy cluster and thus we will conservatively omit any contribution to the ALP-photon mixing from an intra-cluster magnetic field.
V.8 MAGIC J2001+435
The high-frequency peaked Bl Lac object MAGIC J2001+435 was first discovered by the Fermi-LAT in 2009 Bassani et al. (2009) and later observed by MAGIC in 2009 and 2010 Aleksić et al. (2014a). Observations by MAGIC extend up to energies of TeV or an optical depth of , using a redshift of . The HAWC observation at TeV is at an optical depth of .
Fermi-LAT observations detect this source at a significance of just 58, but with a variability of 1270, indicating that this is a highly variable source. The maximum flux, observed during MAGIC observations in early 2010, was a remarkable 3.5 brighter than the average source flux. We note that the variation is more extreme, as this bright flare contributes 1/12 of the average flux. Based on this assessment, we remove this source from our analysis and do not analyze it further.
V.9 PKS 1222+216
PKS 1222+216 represents the only Flat-Spectrum Radio Quasar (FSRQ) we will use in our analysis.
Very high-energy emission from this source was first discovered by MAGIC in 2010 during a short (0.5 hours) observation campaign Aleksic et al. (2011b). These observations coincide with lower-energy activity measured by Fermi/LAT Tanaka et al. (2011). The observations performed by MAGIC extend up to energies of TeV, or an optical depth of , using a redshift of . Note that these observations were made when the source was in a flaring mode. The HAWC observation at 7 TeV is at an optical depth of .
The emission region of the source has not been modelled completely, but it is constrained due to the fast variability of the signal. The MAGIC collaboration has found that the source has fast variability min, indicating an extremely compact emission region. They find a lower limit on the Doppler factor of and the distance of the emitting region to be cm. Assuming a simple conical jet geometry, this gives cm. Furthermore, we take a conservative estimate of the magnetic field strength of G.
The source has not been explicitly associated with a galaxy cluster and thus we will omit any contribution to the ALP-photon mixing from an intra-cluster magnetic field. Since this source has only been observed in a flaring mode, we cannot compare the expected fluxes directly to the HAWC data. Thus, we will not include this source in the joint likelihood analysis.
VI Statistical Approach
ALP-photon mixing increases the transparency of the universe for very-high energy -rays, increasing the expected TeV flux from blazars. This implies that the signal of ALP-photon mixing is given by a flattening of the -ray spectrum – as the VHE -ray flux shifts from an exponentially falling spectrum (produced by -ray attenuation) to a flat-spectrum given by a relatively energy-independent ALP-photon mixing parameter that matches the injected -ray spectrum from each blazar.
Using the combined ACT and HAWC measurements of each source, we compare the goodness-of-fit of the ALP vs no ALP hypothesis by using the test statistic:
| (18) |
In the absence of ALP effects, the test statistic will be distributed according to a distribution with two degrees of freedom since models with an ALP add two more free parameters, and . Employing Wilks’ theorem, we can interpret the log-likelihood ratio by comparing the fits of our ALP and no-ALP models to the combined ACT and HAWC datasets as:
| (19) |
where is the expected flux in energy bin , as found by Eq.17 and is the flux observed by ACTs. denote the errors in the observed flux spectra.
HAWC quotes the upper limit of their flux measurements, along with the best-fit fluxes. Thus, the contribution to the total log-likelihood for the expected flux at 7 TeV is given by a modified :
| (20) |
where and are the best-fit flux and the upper limit on the flux as quoted by HAWC.
VII Results
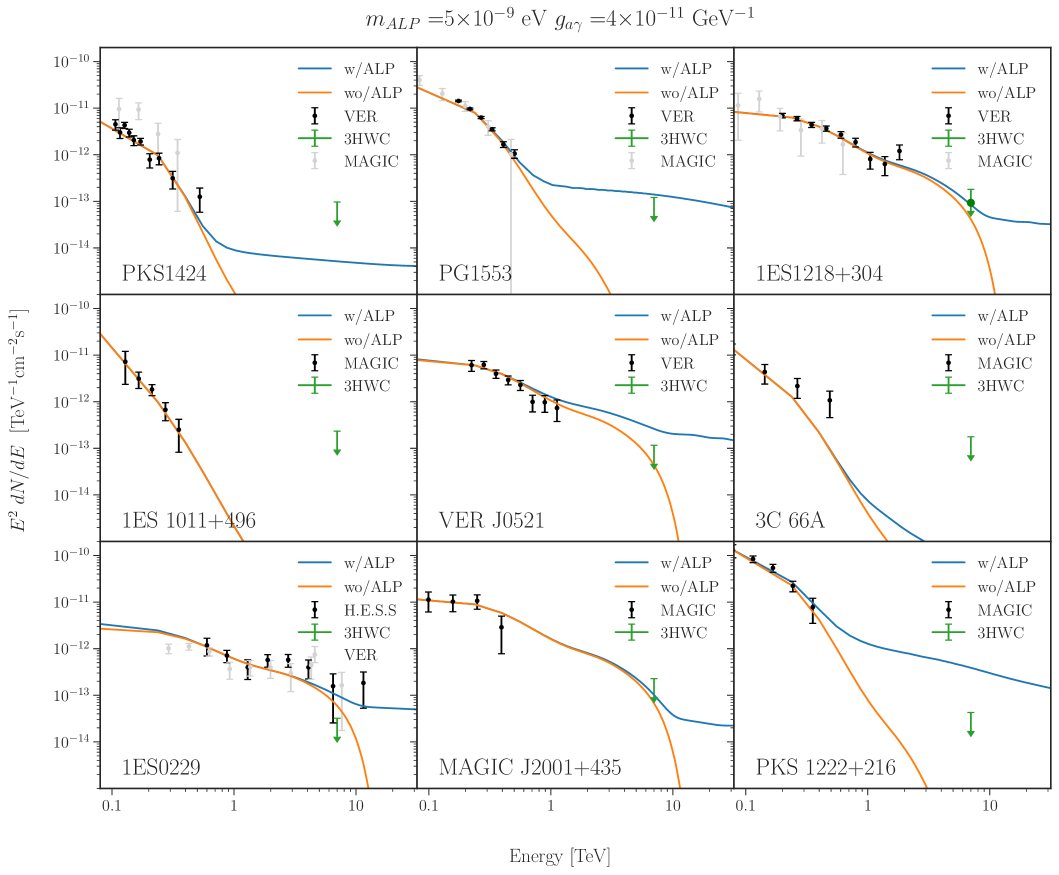
In Figure 1, we compare the expected flux (as calculated in Sec. IV) from each blazar with the combined ACT and HAWC datasets. The effect of ALP-photon mixing on the expected -ray flux from each blazar varies due to the different magnetic field environments in the vicinity of the blazar, the redshift of each blazar source, and the assumed ALP parameters. We show results for models that both include, and do not include, an ALP. For the ALP models, we adopt an assumed mass of neV and ALP-photon mixing of values chosen to be relatively close to the 3 upper limits on the ALP parameter space that will be obtained by our study.
Figure 1 immediately demonstrates several key results: (1) the effect of ALPs on the -ray spectra typically become apparent at energies above 1 TeV, with the exact transition depending on the redshift of each source. This demonstrates that, between the energy ranges of ACT and HAWC observations, our models efficiently transition from the regime where the “primary” -ray flux (produced by unattenuated -rays from each blazar) is dominant to the “secondary” regime where the -ray flux from ALP-photon conversion dominates, (2) the spectrum in the “secondary” regime is much harder than the spectrum in the primary regime due to the fact that -ray attenuation is no longer affecting the signal, indicating both that spectral signatures can provide important information regarding axion properties, and also that our results are relatively unaffected by energy-dispersion or energy-calibration uncertainties in the HAWC energy range (3) HAWC observations for all sources present only upper limits, and no source has been detected in the HAWC energy band. The significances of the sources as detected by HAWC are in the range = -1.6 – 2.24, where 1ES 1218+304 is the most significant source. We note that a negative value for is interpreted as a positive test statistic for a source with a negative flux.
We can already observe that this combination of is constrained by the sources 1ES 0229, VER J0521 and PKS 1222. In these cases, the HAWC upper limit on the flux falls below the expected blazar flux in models with ALPs. For sources such as PKS1424, PG1553, 1ES 1218+304, 3C 66A and MAGIC J2001+435, the expected fluxes in models with and without ALPs both fall below the HAWC sensitivity, preventing us from using these sources to exclude the ALP hypothesis for this combination of . We note that some of these sources may be capable of constraining the ALP parameter space with upcoming instruments such as CTA, as discussed in MC14.
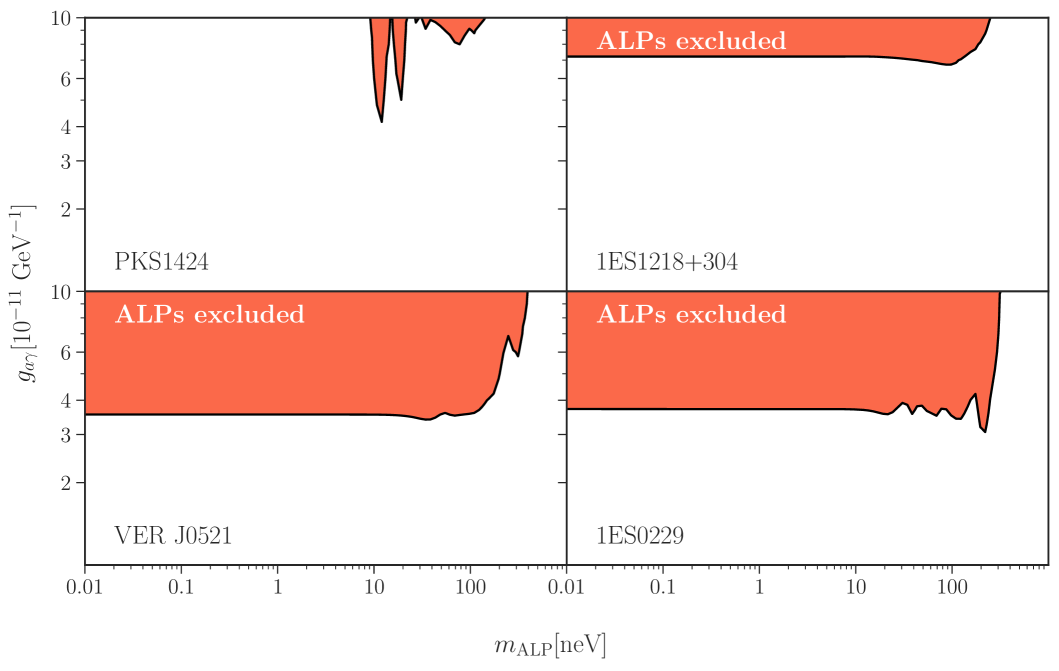
In Figure 2, we show the regions of the parameter space for our four most constraining sources, where the ALP hypothesis is disfavoured by more than compared to the no ALP hypothesis. In these regions, the upper limit from HAWC is consistent with the expected flux without ALP effects, but inconsistent with the flux including ALP effects. We do not include a likelihood analysis of the sources MAGIC J2001+435 and PKS 1222+216 because the ACT observations of each source were recorded during blazar flares, which makes them unsuitable for comparisons with the HAWC upper limits, which were based on continuous observations spanning several years. Because our modeled HAWC fluxes are normalized to ACT observations, our model will produce spuriously strong limits in the HAWC band. We note, however, that future ACT observations during non-flaring states may produce strong limits from these blazars.
We note that our theoretical models show that there are significant differences between the -ray fluxes expected in models with and without ALP effects, even for sources and regions of parameter space where the ALP-induced flux falls below HAWC sensitivity. This is illustrated in Figure 1 by the sources PG1553+113, PKS1424+240, 3C 66A, MAGIC J2001+435 and 1ES1218+304. In these cases, upcoming observations (e.g., by HAWC, LHAASO, or the Cherenkov Telescope Array), could be used to distinguish between the fluxes with and without ALP effects.
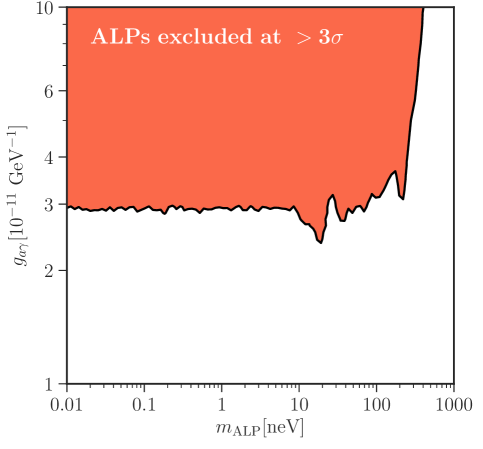
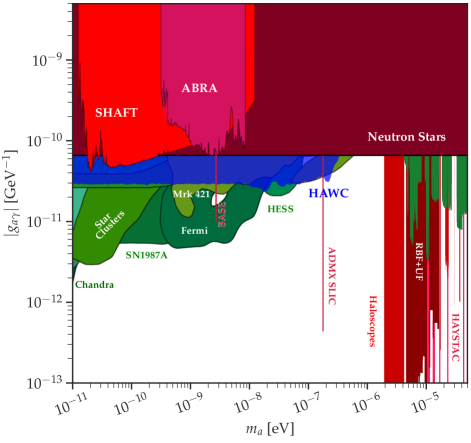
Figure 3 shows the combined constraints on the ALP parameter space, where the filled contour denotes the regions of parameter space excluded at . We find that the ALP hypothesis is excluded at for and masses up to eV. Figure 4 shows how these limits compare to previous results. As can be seen, the limits derived in this paper are comparable to previous limits in the ALP parameter space. We have managed to significantly constrain smaller couplings than e.g. CAST Anastassopoulos et al. (2017b), SHAFT Gramolin et al. (2021) and ABRA Salemi et al. (2021), and a larger ALP mass than other astrophysical searches such as H.E.S.S. Abramowski et al. (2013) and Fermi Ajello et al. (2016). Note that the higher-mass portion of our limits are similar to those recently derived in Ref. Li et al. (2021), which are based on searches of ALP-photon oscillations in the spectrum of Mrk 421 with ARGO-YBJ, but are derived from a larger sample of astrophysical sources.
VIII Conclusions
In this paper, we have studied how an ALP component alters the TeV -ray flux expected from a number of known blazars. Due to pair-production interactions with the EBL, the -ray flux from distant sources is expected to be strongly attenuated at TeV energies. This effect can be decreased if -rays can resonantly convert into ALPs that can survive the passage through the EBL. Specifically, since ALPs can mix with photons in the presence of an external magnetic field, photons from an extragalactic source may mix into ALPs in the magnetic fields surrounding the source, travel unattenuated through the EBL and then mix back into photons in the Milky Way magnetic field. It has been shown in previous work that upcoming telescopes such as CTA may be sensitive to the differences in the expected spectra of blazars with and without ALP effects Meyer and Conrad (2014).
We have studied whether this effect can be used to constrain the parameter space of ALPs using a combination of data from existing ACTs and the HAWC telescope. We compare the expected flux centered at the 7 TeV energy-range corresponding to HAWC observations in models that do or do not include an ALP component. We find that the expected flux with an ALP component is excluded at for ALP-photon couplings larger than and masses smaller than eV. While these limits fall short of constraints from Fermi-LAT observations for axion masses 10-9 eV, the higher energy range of HAWC observations make these studies comparable with the best limits derived from laboratory and astrophysical searches in the mass range near 10-7 eV, as shown in Fig. 4.
We note that these existing limits fall just short of the anticipated limits for upcoming CTA observations, as calculated by MC14 ( for axion masses smaller than eV). Upcoming HAWC observations (including both two recent years of data not included in the 3HWC catalog and improved spectral reconstructions) may strengthen these limits by a factor of a few over the next few years.
Additionally, and similarly to MC14, we have found that ALPs may produce significant differences in the high-energy -ray spectrum of multiple blazars, which provides significant theoretical potential for our -ray searches, even if current instrumentation do not yet reach the sensitivity to probe these spectral differences. Thus, future telescopes with higher sensitivity than HAWC, such as the CTA and LHAASO may be able to constrain larger parts of ALP parameter space using the method described in this paper.
Finally, we note that improved observations and models of -ray emission from blazars, including better measurements of their time-averaged -ray flux and spectrum (including the potential for high-energy cutoffs in the intrinsic blazar spectrum), as well as improved modeling of their magnetic fields, viewing angles, and surrounding cluster magnetic fields, may significantly improve our axion limits. Moreover, the addition of similar instrumentation in the southern hemisphere (such as SWGO Barres de Almeida (2021)) would significantly increase the available blazar sample.
Acknowledgements.
We would like to thank Manuel Meyer for making the GammaALPs package, which was employed in this analysis, publicly available. We would also like to thank Ciaran O’Hare for making the AxionLimits package, which was employed to produce Fig. 4, publicly available. We would also like to thank Pierluca Carenza, J. Patrick Harding and Alexander J. Millar for helpful comments regarding the manuscript. S.J. and K.F. acknowledge support by the Vetenskapsrådet (Swedish Research Council) through contract No. 638-2013-8993 and the Oskar Klein Centre for Cosmoparticle Physics. TL is partially supported by the Swedish Research Council under contract 2019-05135, the Swedish National Space Agency under contract 117/19 and the European Research Council under grant 742104. K.F. is Jeff & Gail Kodosky Endowed Chair in Physics at the University of Texas at Austin, and is grateful for support. K.F. acknowledges funding from the U.S. Department of Energy, Office of Science, Office of High Energy Physics program under Award Number DE-SC0022021 at the University of Texas, Austin.References
- Peccei and Quinn (1977) R. D. Peccei and H. R. Quinn, Phys. Rev. Lett. 38, 1440 (1977).
- Weinberg (1978) S. Weinberg, Phys. Rev. Lett. 40, 223 (1978).
- Wilczek (1978) F. Wilczek, Phys. Rev. Lett. 40, 279 (1978).
- Kim (1987) J. E. Kim, Phys. Rept. 150, 1 (1987).
- Witten (1984) E. Witten, Phys. Lett. B 149, 351 (1984).
- Svrcek and Witten (2006) P. Svrcek and E. Witten, JHEP 06, 051 (2006), arXiv:hep-th/0605206 .
- Conlon (2006a) J. P. Conlon, JHEP 05, 078 (2006a), arXiv:hep-th/0602233 .
- Conlon (2006b) J. P. Conlon, Phys. Rev. Lett. 97, 261802 (2006b).
- Ringwald (2014) A. Ringwald, in 49th Rencontres de Moriond on Electroweak Interactions and Unified Theories (2014) pp. 223–230, arXiv:1407.0546 [hep-ph] .
- Sikivie (1983) P. Sikivie, Phys. Rev. Lett. 51, 1415 (1983), [Erratum: Phys.Rev.Lett. 52, 695 (1984)].
- van Bibber et al. (1989) K. van Bibber, P. M. McIntyre, D. E. Morris, and G. G. Raffelt, Phys. Rev. D 39, 2089 (1989).
- Raffelt (1990) G. G. Raffelt, Phys. Rept. 198, 1 (1990).
- Berezhiani and Drago (2000) Z. Berezhiani and A. Drago, Phys. Lett. B 473, 281 (2000), arXiv:hep-ph/9911333 .
- Csaki et al. (2002) C. Csaki, N. Kaloper, and J. Terning, Phys. Rev. Lett. 88, 161302 (2002), arXiv:hep-ph/0111311 .
- Deffayet et al. (2002) C. Deffayet, D. Harari, J.-P. Uzan, and M. Zaldarriaga, Phys. Rev. D 66, 043517 (2002), arXiv:hep-ph/0112118 .
- Raffelt (2008) G. G. Raffelt, Lect. Notes Phys. 741, 51 (2008), arXiv:hep-ph/0611350 .
- Simet et al. (2008) M. Simet, D. Hooper, and P. D. Serpico, Phys. Rev. D 77, 063001 (2008), arXiv:0712.2825 [astro-ph] .
- Hauser and Dwek (2001) M. G. Hauser and E. Dwek, Ann. Rev. Astron. Astrophys. 39, 249 (2001), arXiv:astro-ph/0105539 .
- Dominguez et al. (2011a) A. Dominguez et al., Mon. Not. Roy. Astron. Soc. 410, 2556 (2011a), arXiv:1007.1459 [astro-ph.CO] .
- Jelley (1966) J. V. Jelley, Nature 211, 472 (1966).
- Gould and Schréder (1967) R. J. Gould and G. P. Schréder, Phys. Rev. 155, 1404 (1967).
- Van Bibber et al. (1987) K. Van Bibber, N. R. Dagdeviren, S. E. Koonin, A. Kerman, and H. N. Nelson, Phys. Rev. Lett. 59, 759 (1987).
- Blake (1970) G. M. Blake, Astrophys. Lett. 6: 201-5(Oct 1970). (Thu Jan 01 00:00:00 EST 1970).
- Blandford and Znajek (1977) R. D. Blandford and R. L. Znajek, Mon. Not. Roy. Astron. Soc. 179, 433 (1977).
- Maraschi et al. (1992) L. Maraschi, G. Ghisellini, and A. Celotti, Astrophys. J. Lett. 397, L5 (1992).
- Ajello et al. (2016) M. Ajello et al. (Fermi-LAT), Phys. Rev. Lett. 116, 161101 (2016), arXiv:1603.06978 [astro-ph.HE] .
- De Angelis et al. (2007) A. De Angelis, M. Roncadelli, and O. Mansutti, Phys. Rev. D 76, 121301 (2007), arXiv:0707.4312 [astro-ph] .
- Mirizzi et al. (2007) A. Mirizzi, G. G. Raffelt, and P. D. Serpico, Phys. Rev. D 76, 023001 (2007), arXiv:0704.3044 [astro-ph] .
- Sanchez-Conde et al. (2009) M. A. Sanchez-Conde, D. Paneque, E. Bloom, F. Prada, and A. Dominguez, Phys. Rev. D 79, 123511 (2009), arXiv:0905.3270 [astro-ph.CO] .
- Meyer and Conrad (2014) M. Meyer and J. Conrad, JCAP 12, 016 (2014), arXiv:1410.1556 [astro-ph.HE] .
- Meyer et al. (2014) M. Meyer, D. Montanino, and J. Conrad, JCAP 09, 003 (2014), arXiv:1406.5972 [astro-ph.HE] .
- Reesman and Walker (2014) R. Reesman and T. P. Walker, JCAP 08, 021 (2014), arXiv:1402.2533 [astro-ph.HE] .
- Meyer et al. (2017) M. Meyer, M. Giannotti, A. Mirizzi, J. Conrad, and M. A. Sánchez-Conde, Phys. Rev. Lett. 118, 011103 (2017), arXiv:1609.02350 [astro-ph.HE] .
- Abeysekara et al. (2013) A. U. Abeysekara et al., Astropart. Phys. 50-52, 26 (2013), arXiv:1306.5800 [astro-ph.HE] .
- Albert et al. (2020) A. Albert et al. (HAWC), Astrophys. J. 905, 76 (2020), arXiv:2007.08582 [astro-ph.HE] .
- Holder et al. (2006) J. Holder et al. (VERITAS), Astropart. Phys. 25, 391 (2006), arXiv:astro-ph/0604119 .
- Hinton (2004) J. A. Hinton (H.E.S.S.), New Astron. Rev. 48, 331 (2004), arXiv:astro-ph/0403052 .
- Lorenz (2004) E. Lorenz (MAGIC), New Astron. Rev. 48, 339 (2004).
- Abdollahi et al. (2020) S. Abdollahi et al. (Fermi-LAT), Astrophys. J. Suppl. 247, 33 (2020), arXiv:1902.10045 [astro-ph.HE] .
- Buehler et al. (2020) R. Buehler, G. Gallardo, G. Maier, A. Domínguez, M. López, and M. Meyer, JCAP 09, 027 (2020), arXiv:2004.09396 [astro-ph.HE] .
- Meyer and Petrushevska (2020) M. Meyer and T. Petrushevska, Phys. Rev. Lett. 124, 231101 (2020), [Erratum: Phys.Rev.Lett. 125, 119901 (2020)], arXiv:2006.06722 [astro-ph.HE] .
- Raffelt and Stodolsky (1988) G. Raffelt and L. Stodolsky, Phys. Rev. D 37, 1237 (1988).
- De Angelis et al. (2011) A. De Angelis, G. Galanti, and M. Roncadelli, Phys. Rev. D 84, 105030 (2011), [Erratum: Phys.Rev.D 87, 109903 (2013)], arXiv:1106.1132 [astro-ph.HE] .
- Blandford and Konigl (1979) R. D. Blandford and A. Konigl, Astrophys. J. 232, 34 (1979).
- Cavaliere and Fusco-Femiano (1976) A. Cavaliere and R. Fusco-Femiano, Astron. Astrophys. 49, 137 (1976).
- Govoni and Feretti (2004) F. Govoni and L. Feretti, Int. J. Mod. Phys. D 13, 1549 (2004), arXiv:astro-ph/0410182 .
- Ackermann et al. (2018) M. Ackermann et al. (Fermi-LAT), Astrophys. J. Suppl. 237, 32 (2018), arXiv:1804.08035 [astro-ph.HE] .
- Sigl et al. (2004) G. Sigl, F. Miniati, and T. A. Ensslin, Phys. Rev. D 70, 043007 (2004), arXiv:astro-ph/0401084 .
- Dolag et al. (2005) K. Dolag, D. Grasso, V. Springel, and I. Tkachev, JCAP 01, 009 (2005), arXiv:astro-ph/0410419 .
- Dominguez et al. (2011b) A. Dominguez, M. A. Sanchez-Conde, and F. Prada, JCAP 11, 020 (2011b), arXiv:1106.1860 [astro-ph.CO] .
- Jansson and Farrar (2012) R. Jansson and G. R. Farrar, Astrophys. J. 757, 14 (2012), arXiv:1204.3662 [astro-ph.GA] .
- Adam et al. (2016) R. Adam et al. (Planck), Astron. Astrophys. 596, A103 (2016), arXiv:1601.00546 [astro-ph.GA] .
- Meyer et al. (2021) M. Meyer, J. Davies, and J. Kuhlmann, PoS ICRC2021, 557 (2021), arXiv:2108.02061 [astro-ph.HE] .
- Vogel et al. (2019) H. Vogel, R. Laha, and M. Meyer, PoS NOW2018, 091 (2019), arXiv:1712.01839 [hep-ph] .
- Massaro et al. (2006) E. Massaro, A. Tramacere, M. Perri, P. Giommi, and G. Tosti, Astron. Astrophys. 448, 861 (2006), arXiv:astro-ph/0511673 .
- Mazin and Raue (2007) D. Mazin and M. Raue, Astron. Astrophys. 471, 439 (2007), arXiv:astro-ph/0701694 .
- Dzhatdoev et al. (2021) T. Dzhatdoev, V. Galkin, and E. Podlesnyi, Universe 7, 494 (2021), arXiv:2110.13119 [astro-ph.HE] .
- de León et al. (2021) S. C. n. de León, A. C. n. Alonso, D. Rosa-González, and A. L. Longinotti (HAWC), PoS ICRC2019, 654 (2021), arXiv:1909.01179 [astro-ph.HE] .
- Romoli et al. (2018) C. Romoli, D. A. Sanchez, M. Lorentz, and P. Brun (H.E.S.S.), PoS ICRC2017, 605 (2018), arXiv:1708.01153 [astro-ph.HE] .
- Sinha et al. (2017) A. Sinha, S. Sahayanathan, B. S. Acharya, G. C. Anupama, V. R. Chitnis, and B. B. Singh, Astrophys. J. 836, 83 (2017), arXiv:1612.00231 [astro-ph.HE] .
- Aharonian et al. (2007) F. Aharonian et al. (H.E.S.S.), Astron. Astrophys. 475, L9 (2007), arXiv:0709.4584 [astro-ph] .
- Cerruti (2013) M. Cerruti (VERITAS), in 33rd International Cosmic Ray Conference (2013) p. 0800, arXiv:1307.8091 [astro-ph.HE] .
- Woo et al. (2005) J.-H. Woo, C. M. Urry, R. P. van der Marel, P. Lira, and J. Maza, ApJ 631, 762 (2005), arXiv:astro-ph/0506316 [astro-ph] .
- Vovk et al. (2012) I. Vovk, A. M. Taylor, D. Semikoz, and A. Neronov, ApJ 747, L14 (2012), arXiv:1112.2534 [astro-ph.CO] .
- Hao et al. (2010) J. Hao et al. (SDSS), Astrophys. J. Suppl. 191, 254 (2010), arXiv:1010.5503 [astro-ph.CO] .
- Wen et al. (2012) Z. L. Wen, J. L. Han, and F. S. Liu, Astrophys. J. Suppl. 199, 34 (2012), arXiv:1202.6424 [astro-ph.CO] .
- Ajello et al. (2020) M. Ajello et al. (Fermi-LAT), Astrophys. J. 892, 105 (2020), arXiv:1905.10771 [astro-ph.HE] .
- Archambault et al. (2014) S. Archambault et al. (VERITAS, Fermi-LAT), Astrophys. J. Lett. 785, L16 (2014), arXiv:1403.4308 [astro-ph.HE] .
- Archambault et al. (2013a) S. Archambault et al. (VERITAS), Astrophys. J. 776, 69 (2013a), arXiv:1308.5017 [astro-ph.HE] .
- Aleksic et al. (2011a) J. Aleksic et al. (MAGIC), Astrophys. J. 726, 58 (2011a), arXiv:1010.0550 [astro-ph.HE] .
- Aleksić et al. (2014a) J. Aleksić et al. (MAGIC), Astron. Astrophys. 572, A121 (2014a), arXiv:1409.3389 [astro-ph.HE] .
- Fortin (2009) P. Fortin (VERITAS), AIP Conf. Proc. 1085, 565 (2009), arXiv:0810.0301 [astro-ph] .
- Ahnen et al. (2016) M. L. Ahnen et al. (MAGIC, AGILE), Mon. Not. Roy. Astron. Soc. 459, 2286 (2016), arXiv:1603.07308 [astro-ph.HE] .
- Aleksic et al. (2011b) J. Aleksic et al. (MAGIC), Astrophys. J. Lett. 730, L8 (2011b), arXiv:1101.4645 [astro-ph.HE] .
- Acciari et al. (2010a) V. A. Acciari et al. (VERITAS, Fermi), Astrophys. J. Lett. 708, L100 (2010a), arXiv:0912.0730 [astro-ph.CO] .
- Aleksić et al. (2014b) J. Aleksić et al. (MAGIC), Astron. Astrophys. 567, A135 (2014b), arXiv:1401.0464 [astro-ph.HE] .
- Rovero et al. (2016) A. C. Rovero, H. Muriel, C. Donzelli, and A. Pichel, Astron. Astrophys. 589, A92 (2016), arXiv:1602.08364 [astro-ph.HE] .
- Yang and Wang (2010) J. Yang and J. Wang, Publ. Astron. Soc. Jap. 62, L23 (2010), arXiv:1006.4401 [astro-ph.HE] .
- Prandini et al. (2011) E. Prandini, G. Bonnoli, L. Maraschi, M. Mariotti, and F. Tavecchio, Nuovo Cim. C 034N3, 241 (2011), arXiv:1101.4098 [astro-ph.CO] .
- Zahoor et al. (2021) M. Zahoor, S. Sahayanathan, S. Zahir, N. Iqbal, A. Manzoor, and N. Bhatt, “Model-independent Redshift Estimation of BL Lac Objects through VHE Observations,” (2021), accepted MNRAS, arXiv:2110.15953 [astro-ph.HE] .
- Aleksić et al. (2014c) J. Aleksić et al. (MAGIC), Astron. Astrophys. 567, A135 (2014c), arXiv:1401.0464 [astro-ph.HE] .
- Aliu et al. (2015) E. Aliu et al., Astrophys. J. 799, 7 (2015), arXiv:1411.1439 [astro-ph.HE] .
- Aleksic et al. (2012) J. Aleksic et al. (MAGIC), Astrophys. J. 748, 46 (2012), arXiv:1101.2764 [astro-ph.CO] .
- Aharonian et al. (2006) F. Aharonian et al. (H.E.S.S.), Astron. Astrophys. 448, L19 (2006), arXiv:astro-ph/0601545 .
- Aharonian et al. (2008) F. Aharonian et al. (H.E.S.S.), Astron. Astrophys. 477, 481 (2008), arXiv:0710.5740 [astro-ph] .
- Abdo et al. (2010) A. A. Abdo et al. (Fermi-LAT), Astrophys. J. 708, 1310 (2010), arXiv:0911.4252 [astro-ph.HE] .
- Ackermann et al. (2013) M. Ackermann et al. (Fermi-LAT), Astrophys. J. 771, 57 (2013), arXiv:1304.6082 [astro-ph.HE] .
- Danforth et al. (2010) C. W. Danforth, B. A. Keeney, J. T. Stocke, J. M. Shull, and Y. Yao, Astrophys. J. 720, 976 (2010), arXiv:1005.2191 [astro-ph.CO] .
- Abramowski et al. (2015) A. Abramowski et al. (H.E.S.S.), Astrophys. J. 802, 65 (2015), arXiv:1501.05087 [astro-ph.HE] .
- Nicastro (2018) F. Nicastro, Frascati Phys. Ser. 66, 179 (2018), arXiv:1811.03498 [astro-ph.CO] .
- Jones et al. (2021) J. D. Jones, S. D. Johnson, S. Muzahid, J. Charlton, H. W. Chen, A. Narayanan, S. Sameer, J. Schaye, and N. A. Wijers, Mon. Not. Roy. Astron. Soc. 509, 4330 (2021), arXiv:2111.06927 [astro-ph.GA] .
- Archambault et al. (2013b) S. Archambault et al. (VERITAS), Astrophys. J. 776, 69 (2013b), arXiv:1308.5017 [astro-ph.HE] .
- Paiano et al. (2017) S. Paiano, M. Landoni, R. Falomo, A. Treves, R. Scarpa, and C. Righi, Astrophys. J. 837, 144 (2017), arXiv:1701.04305 [astro-ph.GA] .
- Acciari et al. (2020) V. A. Acciari et al. (MAGIC), Astron. Astrophys. 640, A132 (2020), arXiv:2006.04493 [astro-ph.HE] .
- Acciari et al. (2010b) V. A. Acciari et al. (VERITAS), Astrophys. J. Lett. 709, L163 (2010b), arXiv:1001.2590 [astro-ph.HE] .
- Albert et al. (2006) J. Albert et al. (MAGIC), Astrophys. J. Lett. 642, L119 (2006), arXiv:astro-ph/0603529 .
- Lombardi et al. (2011) S. Lombardi, E. Lindfors, J. Becerra Gonzalez, P. Colin, J. Sitarek, and A. Stamerra (MAGIC), in 3rd International Fermi Symposium (2011) arXiv:1110.6786 [astro-ph.HE] .
- Singh et al. (2019) K. K. Singh, B. Bisschoff, B. van Soelen, A. Tolamatti, J. P. Marais, and P. J. Meintjes, Mon. Not. Roy. Astron. Soc. 489, 5076 (2019), arXiv:1909.02777 [astro-ph.HE] .
- Acciari et al. (2009) V. A. Acciari et al. (VERITAS), Astrophys. J. Lett. 693, L104 (2009), arXiv:0901.4527 [astro-ph.HE] .
- Torres-Zafra et al. (2018) J. Torres-Zafra, S. A. Cellone, A. Buzzoni, I. Andruchow, and J. G. Portilla, MNRAS 474, 3162 (2018), arXiv:1710.04309 [astro-ph.GA] .
- Abdo et al. (2011) A. A. Abdo, V. A. Acciari, t. G.-W. consortium, and m.-w. partners (FERMI-LAT, VERITAS), Astrophys. J. 726, 43 (2011), [Erratum: Astrophys.J. 731, 77 (2011)], arXiv:1011.1053 [astro-ph.HE] .
- Dumm (2013) J. Dumm (VERITAS), in 33rd International Cosmic Ray Conference (2013) arXiv:1308.0287 [astro-ph.HE] .
- Bassani et al. (2009) L. Bassani, R. Landi, N. Masetti, P. Parisi, A. Bazzano, and P. Ubertini, MNRAS 397, L55 (2009), arXiv:0905.0843 [astro-ph.CO] .
- Tanaka et al. (2011) Y. T. Tanaka et al., Astrophys. J. 733, 19 (2011), arXiv:1101.5339 [astro-ph.HE] .
- O’HARE (2020) C. O’HARE, “cajohare/axionlimits: Axionlimits,” (2020).
- Ehret et al. (2010) K. Ehret et al., Phys. Lett. B 689, 149 (2010), arXiv:1004.1313 [hep-ex] .
- Andriamonje et al. (2007) S. Andriamonje et al. (CAST), JCAP 04, 010 (2007), arXiv:hep-ex/0702006 .
- Betz et al. (2013) M. Betz, F. Caspers, M. Gasior, M. Thumm, and S. W. Rieger, Phys. Rev. D 88, 075014 (2013), arXiv:1310.8098 [physics.ins-det] .
- Anastassopoulos et al. (2017a) V. Anastassopoulos et al. (CAST), Nature Phys. 13, 584 (2017a), arXiv:1705.02290 [hep-ex] .
- Ballou et al. (2015) R. Ballou et al. (OSQAR), Phys. Rev. D 92, 092002 (2015), arXiv:1506.08082 [hep-ex] .
- Della Valle et al. (2016) F. Della Valle, A. Ejlli, U. Gastaldi, G. Messineo, E. Milotti, R. Pengo, G. Ruoso, and G. Zavattini, Eur. Phys. J. C 76, 24 (2016), arXiv:1510.08052 [physics.optics] .
- Homma et al. (2021) K. Homma et al. (SAPPHIRES), JHEP 12, 108 (2021), arXiv:2105.01224 [hep-ex] .
- Ge et al. (2020) S.-F. Ge, K. Hamaguchi, K. Ichimura, K. Ishidoshiro, Y. Kanazawa, Y. Kishimoto, N. Nagata, and J. Zheng, JCAP 11, 059 (2020), arXiv:2008.03924 [hep-ph] .
- Wouters and Brun (2013) D. Wouters and P. Brun, Astrophys. J. 772, 44 (2013), arXiv:1304.0989 [astro-ph.HE] .
- Marsh et al. (2017) M. C. D. Marsh, H. R. Russell, A. C. Fabian, B. P. McNamara, P. Nulsen, and C. S. Reynolds, JCAP 12, 036 (2017), arXiv:1703.07354 [hep-ph] .
- Reynolds et al. (2020) C. S. Reynolds, M. C. D. Marsh, H. R. Russell, A. C. Fabian, R. Smith, F. Tombesi, and S. Veilleux, Astrophys. J. 890, 59 (2020), arXiv:1907.05475 [hep-ph] .
- Reynés et al. (2021) J. S. Reynés, J. H. Matthews, C. S. Reynolds, H. R. Russell, R. N. Smith, and M. C. D. Marsh, Mon. Not. Roy. Astron. Soc. 510, 1264 (2021), arXiv:2109.03261 [astro-ph.HE] .
- Foster et al. (2020) J. W. Foster, Y. Kahn, O. Macias, Z. Sun, R. P. Eatough, V. I. Kondratiev, W. M. Peters, C. Weniger, and B. R. Safdi, Phys. Rev. Lett. 125, 171301 (2020), arXiv:2004.00011 [astro-ph.CO] .
- Darling (2020) J. Darling, Astrophys. J. Lett. 900, L28 (2020), arXiv:2008.11188 [astro-ph.CO] .
- Battye et al. (2022) R. A. Battye, J. Darling, J. I. McDonald, and S. Srinivasan, Phys. Rev. D 105, L021305 (2022), arXiv:2107.01225 [astro-ph.CO] .
- Jaeckel et al. (2018) J. Jaeckel, P. C. Malta, and J. Redondo, Phys. Rev. D 98, 055032 (2018), arXiv:1702.02964 [hep-ph] .
- Payez et al. (2015) A. Payez, C. Evoli, T. Fischer, M. Giannotti, A. Mirizzi, and A. Ringwald, JCAP 02, 006 (2015), arXiv:1410.3747 [astro-ph.HE] .
- Caputo et al. (2022) A. Caputo, G. Raffelt, and E. Vitagliano, Phys. Rev. D 105, 035022 (2022), arXiv:2109.03244 [hep-ph] .
- Dessert et al. (2020) C. Dessert, J. W. Foster, and B. R. Safdi, Phys. Rev. Lett. 125, 261102 (2020), arXiv:2008.03305 [hep-ph] .
- Anastassopoulos et al. (2017b) V. Anastassopoulos et al. (CAST), Nature Phys. 13, 584 (2017b), arXiv:1705.02290 [hep-ex] .
- Gramolin et al. (2021) A. V. Gramolin, D. Aybas, D. Johnson, J. Adam, and A. O. Sushkov, Nature Phys. 17, 79 (2021), arXiv:2003.03348 [hep-ex] .
- Salemi et al. (2021) C. P. Salemi et al., Phys. Rev. Lett. 127, 081801 (2021), arXiv:2102.06722 [hep-ex] .
- Abramowski et al. (2013) A. Abramowski et al. (H.E.S.S.), Phys. Rev. D 88, 102003 (2013), arXiv:1311.3148 [astro-ph.HE] .
- Li et al. (2021) H.-J. Li, J.-G. Guo, X.-J. Bi, S.-J. Lin, and P.-F. Yin, Phys. Rev. D 103, 083003 (2021), arXiv:2008.09464 [astro-ph.HE] .
- Barres de Almeida (2021) U. Barres de Almeida (SWGO), Astron. Nachr. 342, 431 (2021), arXiv:2012.13740 [astro-ph.IM] .