Effect of viscosity on surface acoustic wave driven collective particle dynamics in sessile droplets: nebula, black holes and white dwarfs
Abstract
Surface acoustic waves (SAW) can concentrate micro-particles in droplets within seconds. Yet, the mechanism is not clear and existing explanations fail by several orders of magnitude. In this paper, we analyze the effect of fluid viscosity and particle size on SAW-driven collective particle dynamics in droplets. In most of our experiments, the particles do not aggregate but instead remain away from the droplet center, thereby forming ”black holes”. We show that the black holes are due to steric hindrance wherein the poloidal streamlines that should drive particles to the center of the droplet come too close to the solid, so that the particles carried along these streamlines touch the solid wall on the edge of the black hole before reaching the center of the droplet. The size of these black holes is correlated with the size of the aggregates formed in less viscous droplets. This suggests a common formation mechanism for black holes and white dwarfs (aggregates). In the former, the particles touching the solid would be washed away by the fluid, whereas in the latter the particles would remain in contact with the solid and roll to the center of the droplet where an aggregate is formed. We also discuss the stability conditions of the aggregate at the bottom of the droplet. The concept of hydrodynamic shielding is then used to concentrate 1 m particles using 10 m beads as shields.
I Introduction
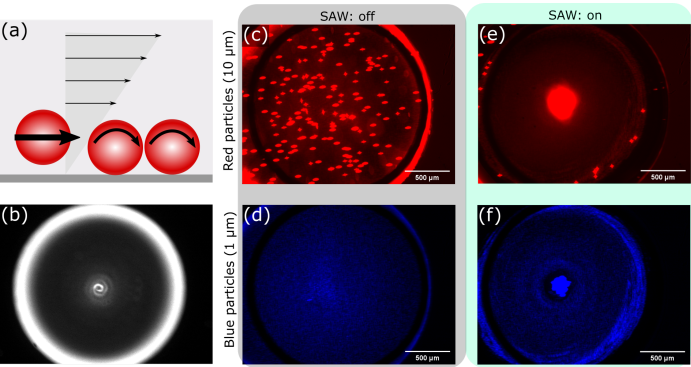
Enrichment and separation of solid particles from microliter fluid samples is an essential preparatory step for labs-on-chip. Compared to other methods such as inertial microfluidics [1, 2, 3, 4], electrophoresis [5], thermophoresis [6, 7, 8] and acoustophoresis [9, 10, 11], the aggregation of particles in droplets using surface acoustic waves (SAW) is surprisingly fast (10 s) and simple to operate: a droplet is placed on the path of a SAW and starts spinning quickly when hit by the wave Fig. 1(a). Particles are then observed to concentrate at the center of the droplet and form a dense aggregate, see Fig. 2 (c) and (f) (multimedia view).
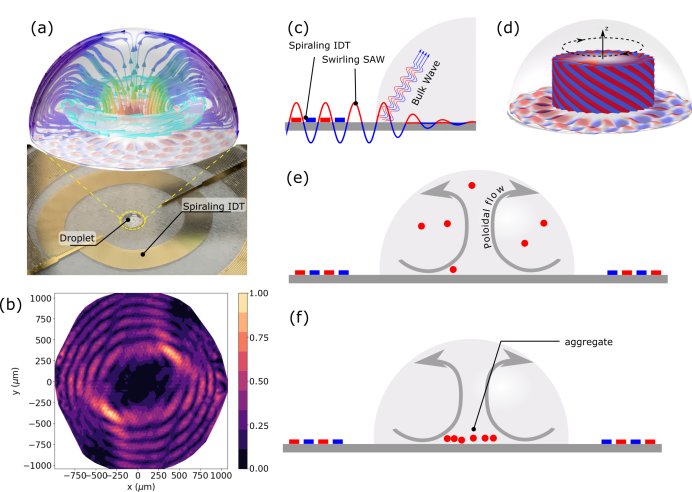
Although the operation is straightforward, the mechanism for particle aggregation is not firmly established. From the earliest experiments of SAW-based droplet actuation, it was understood that the liquid flow in the droplet is due to acoustic streaming [12], that is a steady hydrodynamic flow driven by the bulk acoustic wave radiating in the liquid as the SAW passes underneath the droplet Fig. 1(c). The bulk wave gradually transfers its pseudo-momentum [13] to the fluid while it is attenuated [14, 15]. The transferred pseudo-momentum then acts as an acoustic streaming force that drives the fluid motion. This mechanism has been confirmed by three-dimensional first-principle simulations [16]. Yet, the relation between the flow motion and the aggregation is less clear.
In the earliest observations of SAW-driven particle concentration, Li et al. [17] tentatively attributed the concentration to shear induced-migration. However, the authors themselves pointed out that this explanation requires unrealistically high concentration of particles. Raghavan et al. [18] then carefully reexamined the problem using particle image velocimetry and numerical simulations, and proposed that the particle aggregation was due to an analog of the tea-leaf effect (TLE) [19]. In TLE, a poloidal flow circulation (observed experimentally by Raghavan et al. [18]) drives the particles from the edge of the droplet to the center Fig. 1(e). The liquid then moves upward, however the particles are held back by their weight and remain trapped in the aggregate Fig. 1(f). The effect of weight on trapping is also supported by experiments of Bourquin et al. [20] showing that only particles denser than the fluid form aggregates. Although the TLE hypothesis can qualitatively explain all the experimental observations of Raghavan and Bourquin [18, 20], it is not very convincing for an order of magnitude analysis. For instance, the sedimentation speed of 10 m particles is 3 m/s, but the flow speed in the droplet is nearly 1000 times larger [18]. Accordingly, Peng et al. have simulated the aggregation of particles driven by a poloidal flow sufficiently slow, and found that aggregation was taking nearly 10 min instead of 40 s observed in their experiments. The discrepancy is blatant when considering that high-performance concentration devices proposed by Shilton et al. [21] or Zhang et al. [22] can concentrate particles within 1 s. Hence, there is no consensus about tea leaf effect interpretation, and alternative aggregation mechanisms have been proposed from time to time. For instance Sudeepthi et al. [23] postulated that aggregation was driven by the hydrodynamic pressure force acting on the particles. The question of the aggregation mechanism also has implications on the range of particle size that can be concentrated. Experiments suggests that particles larger than the acoustic wavelength tend to be driven toward the edge of the droplet by the acoustic radiation force [24, 25, 26], whereas sub-microscopic particles accumulate along the contact line [25, 27]. Throughout these previous studies, the effect of particle size [17, 24, 25], particle to fluid density ratio [20], particle suspension solid fraction [17], particle to acoustic wavelength ratio [25], acoustic field [21, 22], ultrasonic power [17, 24] and droplet contact angle [26] have been analyzed. It is therefore frustrating that no quantitative law is available to predict if particle aggregation will occur, or what will be the size of the aggregate.
In this paper, we analyze the collective dynamics of particles in sessile droplets. Depending on the fluid composition and particle size, we observe three different dynamics visually reminiscent of astrophysics: the particles remain dispersed in the entire droplet (nebula), the particles are only observed outside a trapping radius (black holes) and the particles aggregate in a small dot (white dwarfs). Unlike previous studies, we take a holistic view of these phenomena and use the scaling laws of the black holes to shed light on the aggregation mechanism. Finally, we illustrate how this gained understanding enables aggregating smaller particles.
II Methods
In order to simplify the analysis, we design the experiment to rule out the effects of the acoustic radiation force. This is done by using acoustic vortices instead of the plane waves used in most previous experiments [28, 25]. These acoustic waves are also the first ultrasonic field to have enabled aggregation and recovery of the concentrated pellet [22].
Acoustic vortices (Fig. 1 (d)) are helical waves that rotate around their propagation axis. The pitch of the helix is called topological charge and is the ratio of the wave pseudo-orbital-angular-momentum and pseudo-momentum [13]. Symmetry shows that the topological order is conserved when the wave propagates in an axisymmetric domain (such as the droplet). This places a condition on any acoustic field in the droplet akin to a diffraction limit wherein any acoustic field must rotate around the axis and can only exist outside a radius that satisfies (where is the acoustic wavelength in water). This topological protection ensures that regardless of the scattering in the droplet, the acoustic field at the center of the droplet is null. Acoustic vortices can conveniently be synthesized from the radiation of swirling SAW [29, 30] which can be synthesized using spiraling transducers [31] Fig. 1(a). In order to ensure that at least 50% of the SAW power radiates in the droplet while not affecting too much the acoustic field in the solid, the actuation frequency is set to 20 MHz. The topological charge is set to = -15 ( which ensures that no acoustic field exists within a radius of approximately 180 m. Hence, any aggregation occurring within this region is guaranteed to be due to non-acoustic forces. Unless specified, a sinusoidal 200 mVpp (peak to peak) voltage, amplified by a radiofrequency amplifier (ZHL-5W-1+, minicircuits), is applied to the spiraling IDT to generate the acoustic streaming. The experimental surface wave amplitude is shown in Fig. 1(b). The dark region at the center of the droplet Fig. 1(b,d) indicates the absence of acoustic field in this region.
To vary the viscosity, we mix glycerol and water by various amounts. The viscosity and density are provided in Table 1 (additional properties are available in ref. [16]). We note that glycerol-water mixtures are denser than the polystyrene particles used here ( kg/m3), such that the particles cannot be trapped except in pure water according to Bourquin et al. experiments [20]. This enables the formation of black holes that have been helpful to understand the formation of particle aggregates.
| mass fraction (w%) | viscosity (mPa.s) | density (kg/m3) |
| 0 | 0.89 | 1000 |
| 50 | 5.0 | 1130 |
| 70 | 18.1 | 1180 |
| 80 | 45.4 | 1210 |
| 90 | 156 | 1230 |
III Results and discussions
III.1 Forces and orders of magnitude
In most SAW-driven particle concentration, the particles are exposed to acoustic, electric, hydrodynamic and gravity forces. The drag and lift forces due to acoustic streaming are considered as hydrodynamic forces and will be discussed later. The remaining acoustic forces are mainly the acoustic radiation force [32, 33] and possibly some microstreaming [34, 35]. They only exist if the particle is immersed in an acoustic field, and can be omitted at the center of the droplet thanks to the topological protection offered by the acoustic vortex. The electric forces (electrophoresis [36, 37]) are due to the piezoelectric coupling with the substrate such that any surface acoustic wave field is coupled to an electric potential [38, 39]. However, the SAW field at the center of the droplet is null due to the phase singularity of the vortex, which ensures the absence of electric forces near the center of the droplet. Hence, only hydrodynamic forces remain.
In the following orders of magnitude estimates, we consider a polystyrene particle (diameter m, density kg/m3) immersed in water (density kg/m3, viscosity mPa.s). The droplet has a diameter mm and is experimentally observed to rotate at a speed rad/s. The characteristic shear rate is taken as . When a relative velocity (slip velocity) between the particle and the fluid is needed to compute a force, it is assumed to be mm/s with s the characteristic aggregation time. This is tantamount to assume that this force alone is responsible for particle aggregation.
Because the particle is small, it moves nearly at the fluid velocity with a very small particle Reynolds number . Accordingly, we first consider forces in the limit . Horizontal forces acting on the particles include the drag force (given in the bulk by Stokes law [40] , and near the walls by Goldman’s law [41] ). The particle is also exposed to a combination of accelerations and pressure forces that counteract each-other. In the vertical direction, the acceleration of gravity is balanced by buoyancy () whereas in the radial direction the centrifugal acceleration is balanced by the radial pressure distribution (). The fastest rotating water droplets are most likely to exhibit the strongest centrifugal forces. Their droplet Reynolds number approaches 100, which allows to express the acceleration in the inviscid approximation . We will subsequently see that centrifugal forces are negligible even in this case.
At nonvanishing particle Reynolds number, the particle also experiences lift, which is important in shear-induced migration. Saffman lift [40] ( and particle slip parallel to the flow direction) scales as , where is the shear Reynolds number of the particle. The lift of a particle in contact with a wall was studied by Krishnan et al. [42]. Expressions and resulting numerical values of forces acting on the particles in the bulk and at the bottom of the droplet are summarized in Tables 2 and 3.
| Force | Expression | Migration velocity |
|---|---|---|
| Centrifuge and pressure | 3 m/s | |
| Lift [40] | 20 m/s | |
| Drag (bulk) | 1 mm/s | |
| Drag (surface) [41] | 1 mm/s |
According to Table 2, the motion due to drag is much faster than the one due to any other force. In addition, there is a mismatch between the lift velocity (20 m/s) and the drift velocity ( mm/s) that was originally assumed to calculate this lift velocity. Therefore, lift is not responsible for the migration of particles to the center of the droplet. This supports the TLE model where the in-plane motion of the tea leaves (particles) is solely due to drag.
| Force | Expression | Magnitude |
|---|---|---|
| Weight and buoyancy | 0.3 pN | |
| Drag (bulk) | 100 pN | |
| Lift (stuck sphere) [42] | 0.06 pN | |
| Lift (free rolling sphere) [42] | 0.01 pN |
Table 3 shows the forces in the vertical direction. It indicates that drag is considerably larger than gravity forces (weight and buoyancy), such that the vertical motion of the particles in the bulk is likely to go along with the flow. However, drag is parallel to the walls at the bottom of the droplet (and therefore has no vertical component). Thus, only lift exists when particles are in contact with the solid, and gravitational forces are larger than lift, which suggests that contact with the floor is stable.
III.2 Three different concentration outcomes
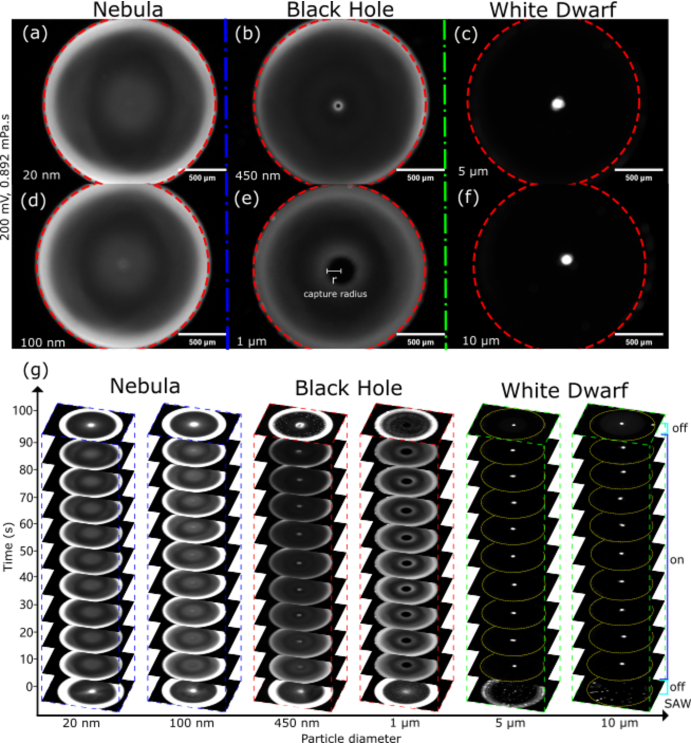
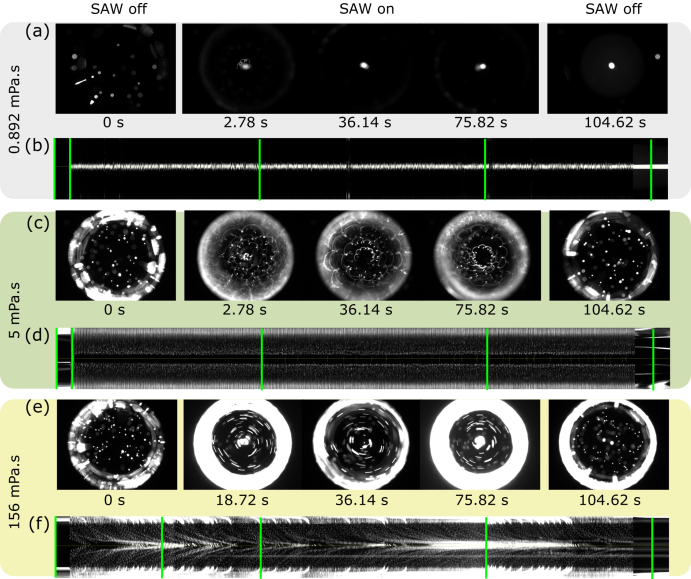
The dynamics of particles with different diameters ( = 20 nm, 100 nm, 450 nm, 1 m, 5 m, 10 m) dispersed in water are shown in Fig. 2. Three types of pattern are observed: nebula (a,d) black hole (b,e) and white dwarf (aggregate, e,f). These patterns are generated within 10 s of ultrasound exposure and remain stable during the entire 100 s of the experiment, as attested by experimental pictures taken every 10 s (g).
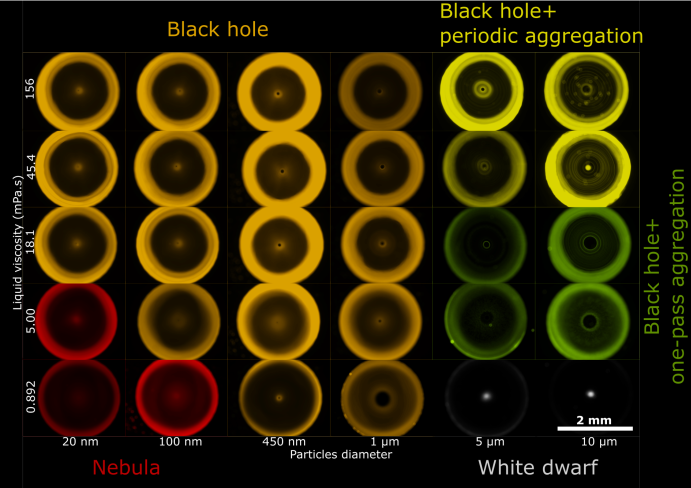
In order to clarify the origin of these patterns, we alter the force balance by using particles of various sizes (20 nm, 100 nm, 450 nm, 1 m, 5 m, 10 m) and using water-glycerol mixtures of increasing density and viscosity ( = 0.892 mPa.s, 5 mPa.s, 18.1 mPa.s, 45.4 mPa.s, 156 mPa.s). Fig. 3 displays the average of the last 4 s of the videos.
Over a range of viscosities and particle sizes, the black holes are the most common patterns found in our experiments. Aggregation is observed in all experiments using 5 and 10 m diameter particles, but the aggregates are only stable in water. Black holes position themselves at an intermediate level between pattern-free nebula and the aggregates, and therefore may provide a glimpse on the dynamics of aggregation of particles in droplets.
III.3 Formation mechanism of the hydrodynamic black holes

When a black hole is formed in the droplet, no particle is observed within a trapping radius shown in 4(b). This trapping radius increases with the particle size and decreases with the viscosity. When the particle diameter is small (20 nm and 100 nm), the trapping radius (that is, the radius of the dark hole) approaches zero, which can be regarded as a nebula. Because the black holes continue to exist even at very high viscosities, our force balance analysis suggests that they are formed via a purely steric mechanism. We postulate that particles are carried to the center of the droplet via some poloidal streamlines (see Fig. 4 (c)). The closer the streamline to the axis of the droplet, the closer it also flows next to the solid substrate. Therefore, large particles cannot flow along the streamlines closest to the center of the droplet, which results in large black holes for 5 and 10 m diameter particles in high viscosity droplets ( mPa.s). In lower viscosity droplets, such as pure water, the holes tend to become larger. This may be because the flow recirculation is now confined to a thin boundary layer at the bottom of the droplet. Indeed, the droplet Reynolds number approaches 100, and therefore the flow is essentially inviscid with a thin viscous boundary layer near the solid surface. The particle size should then be compared to the thickness of this boundary layer. In order to consider both high and low viscosities, we estimate the boundary layer thickness as the minimum between half the droplet radius and the Blasius boundary layer thickness , with the characteristic distance taken as half the droplet radius:
| (1) |
The flow velocity in Eq. (1) is estimated as at different viscosities based on experimental measurements of the droplet rotation speed (measured at the center of the droplet) (Fig. 4 (a)).
If the black holes are truly formed due to the contact between the particles and the solid surface, then the trapping radius of the black holes should only depend on the droplet radius and the ratio of the particle size to the boundary layer thickness. Fig. 4 (d) compares the trapping radius of the black holes to the ratio between the particle size and the boundary layer thickness as given by Eq. (1). The clean relationship supports the idea that black holes are due to the collision of the particles with the substrate before they reach the center of the droplet.
III.4 Implications for particles aggregation
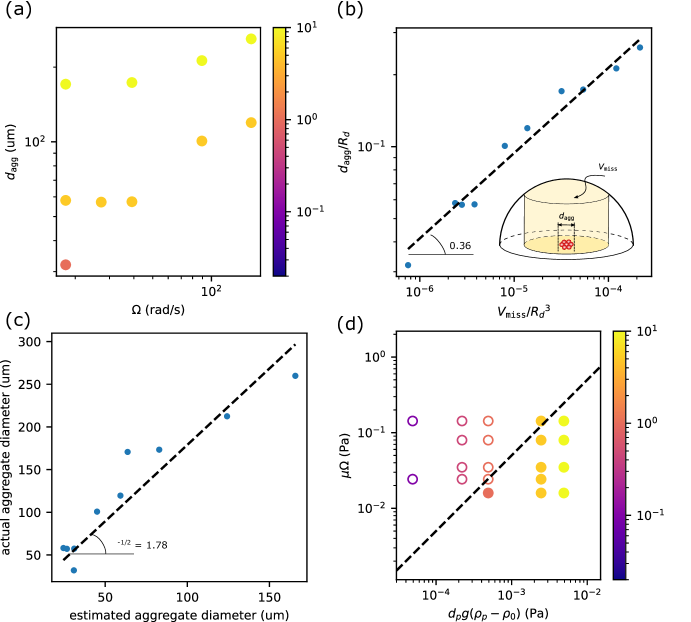
The existence of black holes suggest that some amount of particles have been removed from the flow circulation in the droplet. The size of the aggregates follows a similar trend with the black holes trapping radius: it increases with the particle size and with the droplet rotation speed (Fig. 5(a)). Therefore, we use the previously developed model to extrapolate the back hole sizes to the case where aggregates are formed, deduce the volumes of the missing particles and compare it to the size of the aggregates obtained with 1, 5 and 10 m particles in water using different power levels (Fig. 5(b)). We find a clear correlation between the experimental aggregate diameter and the missing volume which suggests that the missing particles form the aggregate.
Although the nearly exponent suggests that the particles form a three-dimensional aggregate, we find that a monolayer disc of volume , height and diameter describes better the experimental aggregate diameter than a sphere ((Fig. 5(c)). Indeed, the disc compacity is found to be , close to the maximum compacity of a monolayer of spheres () and also more reasonable than a compacity of 0.02 if assuming a spherical aggregate. Therefore, the formation of the aggregates would proceed through the following steps: (i) the acoustic streaming drives a poloidal flow motion, (ii) the particles driven by the flow hit the substrate due to their finite size, and start rolling, (iii) they roll until reaching the center of the droplet, where they accumulate. The stability of the aggregate is considered in the next section.
III.5 Stability of the aggregate
In the proposed black-hole model, the size of the aggregate is set by the ratio of the particle size to the viscous boundary layer at the bottom of the droplet. However, experiments in water-glycerol mixtures feature unstable aggregates that eventually break up. We unravel the phenomenon in a spatio-temporal cross-section of the droplet (Fig. 6). Three distinct dynamics are observed with increasing glycerol fraction: (i) the aggregate is stable (pure water), (ii) the aggregate forms once and disappears permanently (iii) the aggregate is formed and broken up regularly. Assuming that the cycles of aggregates creation/destruction are due to the the poloidal flow that washes particles and periodically brings them back, we conclude that the aggregate is formed during the first pass of the poloidal flow, as opposed to a gradual accumulation that would have been expected under the action of radial forces. This one-pass process explains the very fast aggregation speed observed experimentally [21]. The distinction between aggregates that form only once and those to reappear periodically may be due to different dynamics of particles during the recirculation near the droplet contact line, which is beyond the scope of this paper. Neveretheless, we note that all our water-glycerol mixtures are denser than the particles, which forbids trapping according to Bourquin et al. [20]. Although this explains why particles are never trapped in water-glycerol mixtures, it gives no indication about the power levels or particle size that would allow trapping. Indeed, our experiments using water droplets exposed to various ultrasonic power show there is a minimum particle size that can be aggregated, and that this size depends on the rotation speed of the droplet (Fig. 5(d)), in agreement with Li et al. [17].
To estimate the stability of the aggregate, we look at the stability of sphere aggregates in contact with a wall exposed to shear. Two cases may be distinguished (i) an isolated sphere exposed to a Couette flow [41, 42], (ii) a sphere positioned atop of a regular monolayer of other spheres, and exposed to a Couette flow [43, 44]. For isolated spheres, lift [42] is insufficient to balance the weight of the spheres, and therefore spheres in contact with the walls should remain stable. However, under the effect of drag, a sphere monolayer may be expected to buckle, and the emerging spheres may be dragged away by the flow [44]. Agudo et al. [44] have shown that particles located on a monolayer of sphere could be dislodged when the torque applied by the drag force exceeds that of gravity, which depends on the dimensionless Shields number [43] . This number represents the ratio of drag to buoyancy. We note that, due to the no-slip boundary conditions on the wall, the slip velocity in the drag force has to be replaced by the shear, which yields [41]. This scaling differs from previous studies [18, 20] by a factor . It therefore becomes more reasonable to compare this drag force to the particles weight. The Shields number can be interpreted as the ratio of viscous to gravitational torque , the ratio of drag to weight or the ratio of shear stress to hydrostatic pressure. The latter interpretation is advantageous as it the least skewed by and therefore allows distinguishing other effects such as the shear rate. The state of each aggregate observed in our experiments is presented in Fig. 5(d). We find that those states can be separated by a line , with , in agreement with theoretical and experimental studies that report depending on the flow conditions and the pattern of the spheres [44, 45].
III.6 particle concentration shock wave
While the shield is necessary to maintain the stability of the aggregate, the creation of the shield itself is an important question. We recall that the aggregate is formed by rolling particles. The speed of a rolling sphere is given by Goldman [41] as with the ratio of the speed between a particle that would be freely floating (without wall effects) and a rolling particle. is a cutoff size where molecular forces dominate over hydrodynamic effects (between 1 nm and 0.1 nm). Accordingly, for particle diameters ranging from 1 m to 10 m. This indicates that rolling particles move more slowly than floating ones (Fig. 7(a)). A concentration front is therefore formed between the slow-moving particle near the center of the droplet and fast-incoming floating particles on the periphery of the droplet. It is likely that dense layers of rolling particles move even more slowly due to hydrodynamic interactions between them. This creates a shock of highly concentrated particles converging to the center of the droplet, which has been observed in our experiments (7(b)).
III.7 Seed-assisted aggregation
According to the proposed model, the stability of the aggregate depends strongly on the shielding of aggregated particles from hydrodynamic forces. It is therefore possible to shift the balance between drag and gravity by creating an aggregate with large particles and then use it the shielding effect to aggregate smaller ones. This is shown in Fig. 7 where 1 m diameter particles (blue) can be aggregated inside a cluster of 10 m dimeter particles (red) that shields them from the flow, even though 1 m particles alone could not be aggregated.
IV Conclusion
In order to understand better the SAW-driven aggregation of particles in sessile droplets, we have varied the viscosity of the liquid. We have found that particles tend to organize as hydrodynamic black holes where the center of the droplet is empty of particles. The geometry of these black holes is dictated purely by geometric constraints where the largest particles are physically forbidden to reach the center of the droplet as they touch the solid substrate before doing so. When the particles are lighter than the liquid, they gradually detach from the solid and escape by buoyancy, whereas particles heavier than the solid continue to roll toward the center of the droplet. When the particles concentration is high enough, slowly rolling particles are caught up by the floating ones, which creates a shock wave of highly concentrated particles. Finally, the aggregate stability is found to depend on the balance between buoyancy and drag as mentioned by previous studies, and discrepancies in terms of order of magnitude are addressed once accounting for the shielding effect of the solid wall and nearby particles. This shielding effect allows the concentration of smaller particles by using larger ones as shields, which has not been demonstrated previously. Finally, this paper has largely focused on particle dynamics in the droplet bulk, but some exciting development has shown that the smallest particles accumulate instead along the contact line of the droplet [25] and can be separated using droplet doublets [27]. Recent theoretical progress showing the enhancement of acoustic radiation pressure near sharp edges [46] suggests that this is a different concentration mechanism that should also be investigated in order to gain a full understanding on particle concentration in SAW-driven droplets.
V Data Availability
The data that support the findings of this study are available from the corresponding authors upon reasonable request.
References
- Shelby et al. [2003] J. P. Shelby, D. S. Lim, J. S. Kuo, and D. T. Chiu, High radial acceleration in microvortices, Nature 425, 38 (2003).
- Chiu [2007] D. T. Chiu, Cellular manipulations in microvortices, Analytical and bioanalytical chemistry 387, 17 (2007).
- Mach et al. [2011] A. J. Mach, J. H. Kim, A. Arshi, S. C. Hur, and D. Di Carlo, Automated cellular sample preparation using a centrifuge-on-a-chip, Lab on a Chip 11, 2827 (2011).
- Martel and Toner [2012] J. M. Martel and M. Toner, Inertial focusing dynamics in spiral microchannels, physics of fluids 24, 032001 (2012).
- Mampallil et al. [2013] D. Mampallil, D. Tiwari, D. van den Ende, and F. Mugele, Sample preconcentration inside sessile droplets using electrowetting, Biomicrofluidics 7, 044102 (2013).
- Darhuber and Troian [2005] A. A. Darhuber and S. M. Troian, Principles of microfluidic actuation by modulation of surface stresses, Annu. Rev. Fluid Mech. 37, 425 (2005).
- Hu and Larson [2002] H. Hu and R. G. Larson, Evaporation of a sessile droplet on a substrate, The Journal of Physical Chemistry B 106, 1334 (2002).
- Brutin and Starov [2018] D. Brutin and V. Starov, Recent advances in droplet wetting and evaporation, Chemical Society Reviews 47, 558 (2018).
- Lenshof and Laurell [2011] A. Lenshof and T. Laurell, Emerging clinical applications of microchip-based acoustophoresis, JALA: Journal of the Association for Laboratory Automation 16, 443 (2011).
- Riaud et al. [2020] A. Riaud, W. Wang, A. L. Thai, and V. Taly, Mechanical characterization of cells and microspheres sorted by acoustophoresis with in-line resistive pulse sensing, Physical Review Applied 13, 034058 (2020).
- Kolesnik et al. [2021] K. Kolesnik, M. Xu, P. V. Lee, V. Rajagopal, and D. J. Collins, Unconventional acoustic approaches for localized and designed micromanipulation, Lab on a Chip (2021).
- Shiokawa et al. [1989] S. Shiokawa, Y. Matsui, and T. Ueda, Liquid streaming and droplet formation caused by leaky rayleigh waves, in Proceedings., IEEE Ultrasonics Symposium, (IEEE, 1989) pp. 643–646.
- Thomas and Marchiano [2003] J.-L. Thomas and R. Marchiano, Pseudo angular momentum and topological charge conservation for nonlinear acoustical vortices, Physical review letters 91, 244302 (2003).
- Lighthill [1978] J. Lighthill, Acoustic streaming, Journal of sound and vibration 61, 391 (1978).
- Eckart [1948] C. Eckart, Vortices and streams caused by sound waves, Physical review 73, 68 (1948).
- Riaud et al. [2017a] A. Riaud, M. Baudoin, O. B. Matar, J.-L. Thomas, and P. Brunet, On the influence of viscosity and caustics on acoustic streaming in sessile droplets: an experimental and a numerical study with a cost-effective method, Journal of Fluid Mechanics 821, 384 (2017a).
- Li et al. [2007] H. Li, J. R. Friend, and L. Y. Yeo, Surface acoustic wave concentration of particle and bioparticle suspensions, Biomedical microdevices 9, 647 (2007).
- Raghavan et al. [2010] R. V. Raghavan, J. R. Friend, and L. Y. Yeo, Particle concentration via acoustically driven microcentrifugation: micropiv flow visualization and numerical modelling studies, Microfluidics and Nanofluidics 8, 73 (2010).
- Einstein [1926] A. Einstein, The cause of the formation of meanders in the courses of rivers and of the so-called baer’s law, Die Naturwissenschaften 14, 223 (1926).
- Bourquin et al. [2014] Y. Bourquin, A. Syed, J. Reboud, L. C. Ranford-Cartwright, M. P. Barrett, and J. M. Cooper, Rare-cell enrichment by a rapid, label-free, ultrasonic isopycnic technique for medical diagnostics, Angewandte Chemie International Edition 53, 5587 (2014).
- Shilton et al. [2008] R. Shilton, M. K. Tan, L. Y. Yeo, and J. R. Friend, Particle concentration and mixing in microdrops driven by focused surface acoustic waves, Journal of Applied Physics 104, 014910 (2008).
- Zhang et al. [2021] N. Zhang, J. P. Zuniga-Hertz, E. Y. Zhang, T. Gopesh, M. J. Fannon, J. Wang, Y. Wen, H. H. Patel, and J. Friend, Microliter ultrafast centrifuge platform for size-based particle and cell separation and extraction using novel omnidirectional spiral surface acoustic waves, Lab on a Chip 21, 904 (2021).
- Sudeepthi et al. [2019] A. Sudeepthi, A. K. Sen, and L. Yeo, Aggregation of a dense suspension of particles in a microwell using surface acoustic wave microcentrifugation, Microfluidics and Nanofluidics 23, 1 (2019).
- Rogers et al. [2010] P. R. Rogers, J. R. Friend, and L. Y. Yeo, Exploitation of surface acoustic waves to drive size-dependent microparticle concentration within a droplet, Lab on a Chip 10, 2979 (2010).
- Destgeer et al. [2016] G. Destgeer, H. Cho, B. H. Ha, J. H. Jung, J. Park, and H. J. Sung, Acoustofluidic particle manipulation inside a sessile droplet: four distinct regimes of particle concentration, Lab on a Chip 16, 660 (2016).
- Destgeer et al. [2017] G. Destgeer, J. H. Jung, J. Park, H. Ahmed, and H. J. Sung, Particle separation inside a sessile droplet with variable contact angle using surface acoustic waves, Analytical chemistry 89, 736 (2017).
- Gu et al. [2021] Y. Gu, C. Chen, Z. Mao, H. Bachman, R. Becker, J. Rufo, Z. Wang, P. Zhang, J. Mai, S. Yang, et al., Acoustofluidic centrifuge for nanoparticle enrichment and separation, Science advances 7, eabc0467 (2021).
- Zhang et al. [2009] A. Zhang, W. Liu, Z. Jiang, and J. Fei, Rapid concentration of particle and bioparticle suspension based on surface acoustic wave, Applied Acoustics 70, 1137 (2009).
- Riaud et al. [2015a] A. Riaud, J.-L. Thomas, E. Charron, A. Bussonnière, O. B. Matar, and M. Baudoin, Anisotropic swirling surface acoustic waves from inverse filtering for on-chip generation of acoustic vortices, Physical Review Applied 4, 034004 (2015a).
- Riaud et al. [2015b] A. Riaud, J.-L. Thomas, M. Baudoin, and O. B. Matar, Taming the degeneration of bessel beams at an anisotropic-isotropic interface: Toward three-dimensional control of confined vortical waves, Physical Review E 92, 063201 (2015b).
- Riaud et al. [2017b] A. Riaud, M. Baudoin, O. B. Matar, L. Becerra, and J.-L. Thomas, Selective manipulation of microscopic particles with precursor swirling rayleigh waves, Physical Review Applied 7, 024007 (2017b).
- Baresch et al. [2013] D. Baresch, J.-L. Thomas, and R. Marchiano, Three-dimensional acoustic radiation force on an arbitrarily located elastic sphere, The Journal of the Acoustical Society of America 133, 25 (2013).
- Gong and Baudoin [2021] Z. Gong and M. Baudoin, Equivalence between angular spectrum-based and multipole expansion-based formulas of the acoustic radiation force and torque, The Journal of the Acoustical Society of America 149, 3469 (2021).
- Doinikov [1994] A. Doinikov, Acoustic radiation pressure on a rigid sphere in a viscous fluid, Proceedings of the Royal Society of London. Series A: Mathematical and Physical Sciences 447, 447 (1994).
- Baasch et al. [2019] T. Baasch, A. Pavlic, and J. Dual, Acoustic radiation force acting on a heavy particle in a standing wave can be dominated by the acoustic microstreaming, Physical Review E 100, 061102 (2019).
- Strobl et al. [2004] C. J. Strobl, C. Schäflein, U. Beierlein, J. Ebbecke, and A. Wixforth, Carbon nanotube alignment by surface acoustic waves, Applied physics letters 85, 1427 (2004).
- Ma et al. [2015] Z. Ma, J. Guo, Y. J. Liu, and Y. Ai, The patterning mechanism of carbon nanotubes using surface acoustic waves: The acoustic radiation effect or the dielectrophoretic effect, Nanoscale 7, 14047 (2015).
- White and Voltmer [1965] R. M. White and F. W. Voltmer, Direct piezoelectric coupling to surface elastic waves, Applied physics letters 7, 314 (1965).
- Bleustein [1968] J. L. Bleustein, A new surface wave in piezoelectric materials, Applied Physics Letters 13, 412 (1968).
- Stone [2000] H. A. Stone, Philip saffman and viscous flow theory, Journal of Fluid Mechanics 409, 165 (2000).
- Goldman et al. [1967] A. Goldman, R. G. Cox, and H. Brenner, Slow viscous motion of a sphere parallel to a plane wall—ii couette flow, Chemical engineering science 22, 653 (1967).
- Krishnan and Leighton Jr [1995] G. P. Krishnan and D. T. Leighton Jr, Inertial lift on a moving sphere in contact with a plane wall in a shear flow, Physics of Fluids 7, 2538 (1995).
- Shields [1936] A. Shields, Anwendung der aehnlichkeitsmechanik und der turbulenzforschung auf die geschiebebewegung, PhD Thesis Technical University Berlin (1936).
- Agudo et al. [2017] J. Agudo, C. Illigmann, G. Luzi, A. Laukart, A. Delgado, and A. Wierschem, Shear-induced incipient motion of a single sphere on uniform substrates at low particle reynolds numbers, Journal of Fluid Mechanics 825, 284 (2017).
- Topic et al. [2019] N. Topic, S. Retzepoglu, M. Wensing, C. Illigmann, G. Luzi, J. Agudo, and A. Wierschem, Effect of particle size ratio on shear-induced onset of particle motion at low particle reynolds numbers: From high shielding to roughness, Physics of Fluids 31, 063305 (2019).
- Doinikov et al. [2020] A. A. Doinikov, M. S. Gerlt, and J. Dual, Acoustic radiation forces produced by sharp-edge structures in microfluidic systems, Physical Review Letters 124, 154501 (2020).
Acknowledgements.
This work was supported by the National Natural Science Foundation of China with Grant No. 12004078 and No. 61874033, State Key Lab of ASIC and System, Fudan University 2021MS001, 2021MS002 and 2020KF006.VI Author contributions
AR and JZ proposed the research, SS did the experiments, AR and SS did the simulations. All the authors wrote the paper together.
VII Competing interests
The authors declare no competing interests.