Review of sterile neutrino searches at very short-baseline reactor experiments
Abstract
Search for New Physics beyond the Standard Model is the main direction in particle physics nowadays. There are several experimental hints of New Physics. The most statistically significant (5-6) are the hints of eV mass scale sterile neutrinos. They come from disappearance in reactor experiments, disappearance in experiments with very powerful radioactive sources, and electron (anti)neutrino appearance in the muon (anti)neutrino beams. Very important results in this field were obtained in 2021 by the BEST, MicroBooNE, and Neutrino-4 collaborations as well as by several other experiments. However, the situation is still or maybe even more controversial. We review these indications of New Physics and prospects for the next few years with the emphasis on reactor experiments.
Keywords: neutrino, reactor, sterile neutrino, neutrino oscillations, Beyond Standard Model
1 Introduction
The Standard Model is probably the most elaborate theory of Matter ever developed (for a recent review see e.g. [1]). It describes practically everything that we observe very often with very high precision. The final confirmation of the SM was the discovery of the famous Higgs Boson at the Large Hadron Collider (LHC) in 2012 [2, 3]. Still, it is commonly believed that SM is not the ultimate theory. First of all, it does not describe what we do not see, namely, the Dark Matter that is about 6 times more abundant in the Universe than the ordinary matter that is described by SM [4]. The dominance of matter over antimatter in the Universe is also not explained. Fine tuning of the model’s parameters is required to explain a relatively small mass of the Higgs Boson. And the number of these free model parameters is very large. SM does not predict the masses of fundamental particles, the couplings between quarks of different generations, and the strength of the weak, electromagnetic and strong interactions. It does not explain why there are just 3 generations of quark and leptons. Finally, the SM does not include gravity. Therefore, search for phenomena beyond SM is now the main direction in particle physics.
The are several indications of Physics beyond SM. The long-standing discrepancy between the very precise experimental measurements (relative accuracy is 0.35 ppm) and theoretical predictions (relative accuracy is 0.37 ppm) for the anomalous muon magnetic moment has about 4.2 standard deviation () statistical significance [5]. A considerable improvement in the experimental accuracy is expected in the near future.
There are several discrepancies at the level of 3 between experimental data and SM predictions in beauty hadron decays. Probably the most remarkable is the difference in the probabilities of decays with and in the final state which should be equal in SM (see [6] and references therein). Again, a better accuracy is required in order to make definite conclusions. A considerable improvement in experimental accuracy is expected in this field in experiments at LHC as well as at the SuperB Factory at KEK.
Finally, several indications of New Physics beyond SM exist in the neutrino sector. Discovery of neutrino oscillations [7, 8] demonstrated that neutrinos have masses. This fact can be considered as a sign of New Physics since neutrino are massless in SM. However, it is possible to extend SM and include neutrino masses to it. There is another hint of New Physics in the neutrino sector – sterile neutrinos. There are several experimental indications of existence of sterile neutrinos with masses of the order of 1 eV. A detailed discussion of these indications and future prospects for sterile neutrino searches with the emphasis on reactor experiments are the main topics of the present paper.
2 Hints for sterile neutrinos
Neutrino oscillations were discovered by the Super Kamikoande experiment [7] in case of atmospheric neutrinos and several solar neutrino experiments [9, 10, 11] with the final prove by SNO [8]. The observation of neutrino oscillations demonstrates that neutrino have masses and that the lepton mixing matrix (Pontecorvo, Maki, Nakagava, Sakata matrix) [12, 13, 14] is non trivial. This matrix connects the neutrino flavor eigenstates , , and with the neutrino mass eigenstates , , and . Since the measured neutrino mass-squared differences demonstrate a hierarchical structure ( eV2, eV2 [1]) the probabilities of neutrino flavor changes from to are often well approximated by a two-neutrino formula(see e.g. [15])
| (1) |
with only one mixing angle and one difference of neutrino masses squared of the relevant neutrino mass states. In this expression and L are the neutrino energy and the path length. The survival probability is than given by
| (2) |
At large distances the oscillation pattern is smeared out because of finite accuracy of energy and/or distance measurements and only the initial neutrino flux is reduced:
| (3) |
Oscillations of the three known neutrino flavors have been measured with a good precision. The two mass-squared differences and three angles describing such oscillations are well known by now[1]. Z boson can decay into a neutrino-antineutrino pair. Therefore measurements of the Z boson decay width can be used to determine the number of light active neutrinos to be equal to 3 [16]. However, additional sterile neutrinos are allowed. They are singlets of the SM gauge group and do not interact directly with gauge bosons. Usually only one sterile neutrino is considered which consists mainly of the heavy neutrino mass state while the 3 active neutrinos , , and are mainly composed of light neutrino mass states , , and . This is the so called 3+1 sterile-active neutrino mixing model which we will call the 4 model for brevity. In this model since all relevant angles are small. Addition of more sterile neutrinos usually does not change results considerably in comparison with the 3+1 model.
Sterile neutrinos appear naturally in many extensions of SM. Moreover, there are several experimental hints of their existence. The GALEX and SAGE solar neutrino Gallium experiments performed calibrations with very powerful radioactive sources. They observed only events of the expected number [10]. The deficit of events in the calibration runs of the SAGE and GALEX experiments [10, 11] (“Galium Anomaly”(GA) [17]) can be explained by electron neutrino to sterile neutrino oscillations at very short distances with quite a large according to equation (3).
Analogously the 6% deficit of in comparison with the re-evaluated reactor fluxes [18, 19] (“Reactor Antineutrino Anomaly”(RAA) [20]) can be explained by the active-sterile neutrino oscillations again at very short distances. The required short distances of the oscillations imply that the mass-squared difference should be about 1 eV2, much larger than the two known mass-squared differences. Therefore an additional neutrino is needed and, as explained above, it should be sterile. Since the mass-squared difference between a new and known neutrinos is much larger than the mass-squared differences between known neutrinos the oscillations between known and sterile neutrinos can be well described by a two-neutrino oscillation formula (1) with only one . RAA leads to the best-fit values for sterile neutrino parameters of eV2 and = 0.14.
More recent estimates of the fluxes from reactors [21, 22] have not solved the problem with RAA since one of them [22] predicts a smaller flux while the other one [21] predicts a larger flux in comparison with the Huber-Mueller (H-M) model [18, 19]. The Daya Bay [23] and RENO [24] collaborations have measured the 235U contribution to the reactor flux multiplied by the Inverse Beta Decay (IBD) reaction cross section. The IBD process is used to detect at reactors. The results are about 10% smaller than the H-M model predictions.
The H-M model converts the measurements of the beta spectra from thermal neutron fission products of 235U, 239Pu, and 241Pu at ILL [25, 26, 27, 28] to the spectra. Recent measurements at the Kurchatov Institute [29, 30] of the ratio of beta spectra of fission products of 235U and 239Pu give smaller ratio than the ILL results.
Smaller values for 235U contribution to the IBD rate obtained by Daya Bay and RENO, and the Kurchatov Institute experiment result reduce considerably the significance of RAA. There is also a difference between measured and predicted energy spectra. Their ratio has a bump at about 6 MeV[31, 32, 33]. However, all modern searches for sterile neutrinos measure the ratio of the energy spectra at different distances from reactors and therefore they do not rely on the absolute flux predictions as well as on the shape of the predicted energy spectrum.
Very recently the BEST experiment has confirmed GA [34, 35]. The observed deficit of events is even larger ( and in the inner and outer volumes of the detector) and has a significance of above 5 [36]. For eV2 the very large values of preferred by BEST (see equation (3)) have been already excluded by DANSS [37, 38] and NEOS [39]. This will be discussed in the next section. For large eV2 and the BEST results are in tension with the limits obtained by Daya Bay, Bugey-3 and RENO (see e.g. [40]) using predictions for the absolute flux from reactors including their large uncertainties. A part of the BEST preferred region at large was already excluded by the PROSPECT [41] and STEREO [42] experiments.
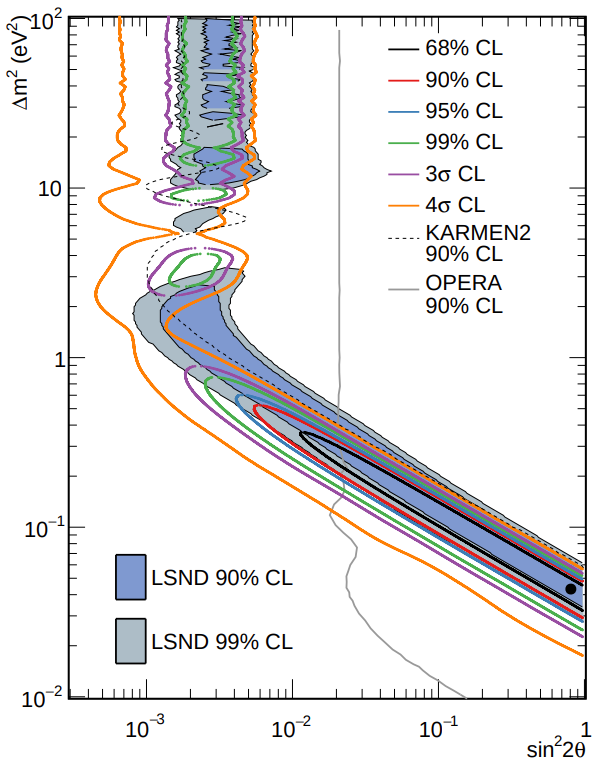
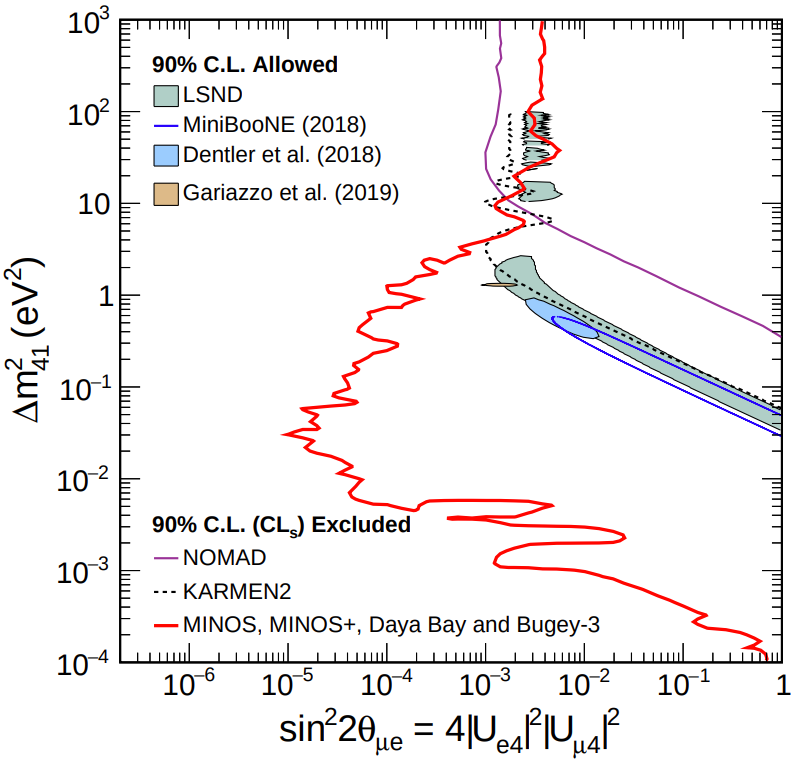
The LSND collaboration obtained evidence for electron antineutrino appearance in the muon antineutrino beams at distances where known neutrino oscillations can not contribute [43]. This signal can be explained by the oscillations of muon antineutrinos to sterile neutrinos followed by oscillation of sterile neutrinos to electron antineutrinos. The corresponding mass-squared difference should be larger than eV2 [43] that is much bigger than the mass-squared differences of known neutrino oscillations. The first MiniBooNE checks of the LSND signal were not conclusive [44, 45, 46]. Later the MiniBooNE collaboration obtained the evidence for electron (anti)neutrino appearance in the muon (anti)neutrino beams [47, 48]. The significance of the signal grows to 6.1 if the LSND and MiniBooNE results are combined [48]. The best-fit point in the sterile neutrino parameter space is close to the maximal mixing () and a small mass-square difference of (see Figure 1). However, this area is excluded by OPERA [49] and only a region with larger mass-squared differences and smaller mixing is still allowed.
The sterile neutrino explanation of the LSND and MiniBooNE results requires mixing of sterile neutrinos both with electron and muon neutrinos. Therefore the probability of the electron neutrino appearance in the muon neutrino beam is proportional to the probabilities of the disappearance and disappearance ( for small angles). Hence the strong upper limits on and disappearance lead to strong limits on the appearance in beams that contradict the LSND and MiniBooNE results [50, 51]. However one should mention that a weak indication of disappearance was obtained by the Ice Cube experiment () [52]. With such a large mixing parameter appearance and disappearance results are marginally compatible at large . On the other hand such large mixing is in contradiction with strong limits on disappearance mainly form the MINOS/MINOS+ experiments [53].
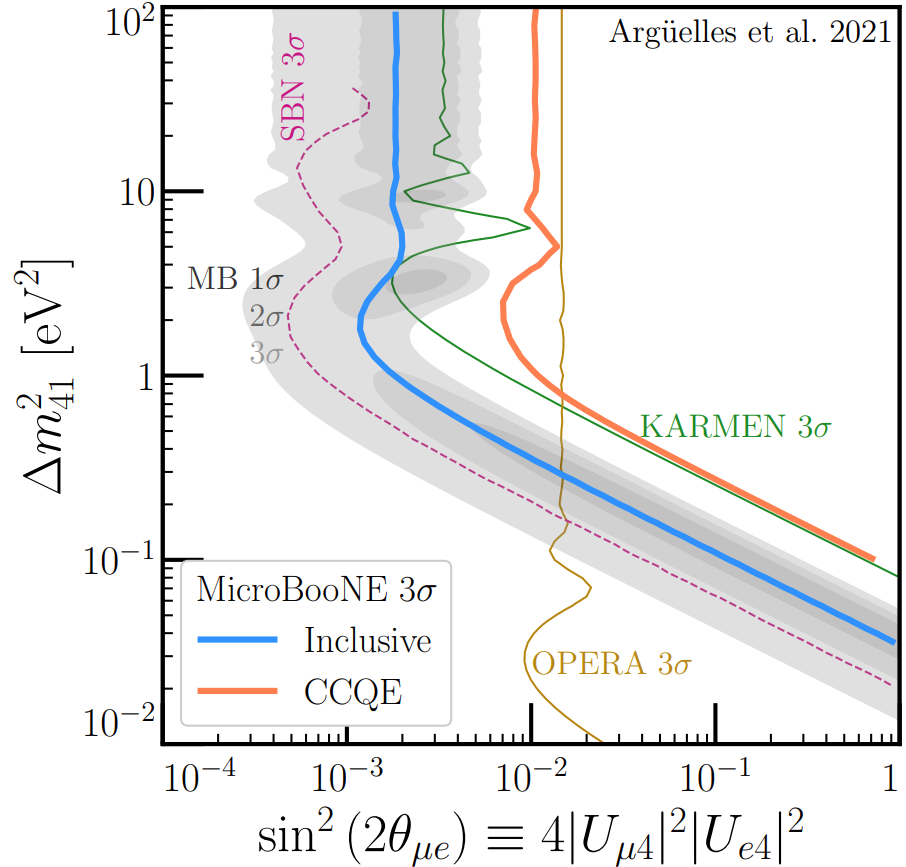
The overall situation with the appearance is not yet clear and more results are needed to clarify it. The MiniBooNE results are scrutinized by the MicroBooNE experiment at the same neutrino beam. MicroBooNE observed even smaller number of events than expected and established upper limits on the possible excess [54]. However, the sterile neutrino explanation of the MiniBooNE excess is not completely ruled out [55] (see Figure 2).
The Neutrino-4 collaboration claimed in 2018 an observation of oscillations to sterile neutrinos with very large values of eV2 and although the significance of the result was only 2.8[58, 59] (see Figure 3).
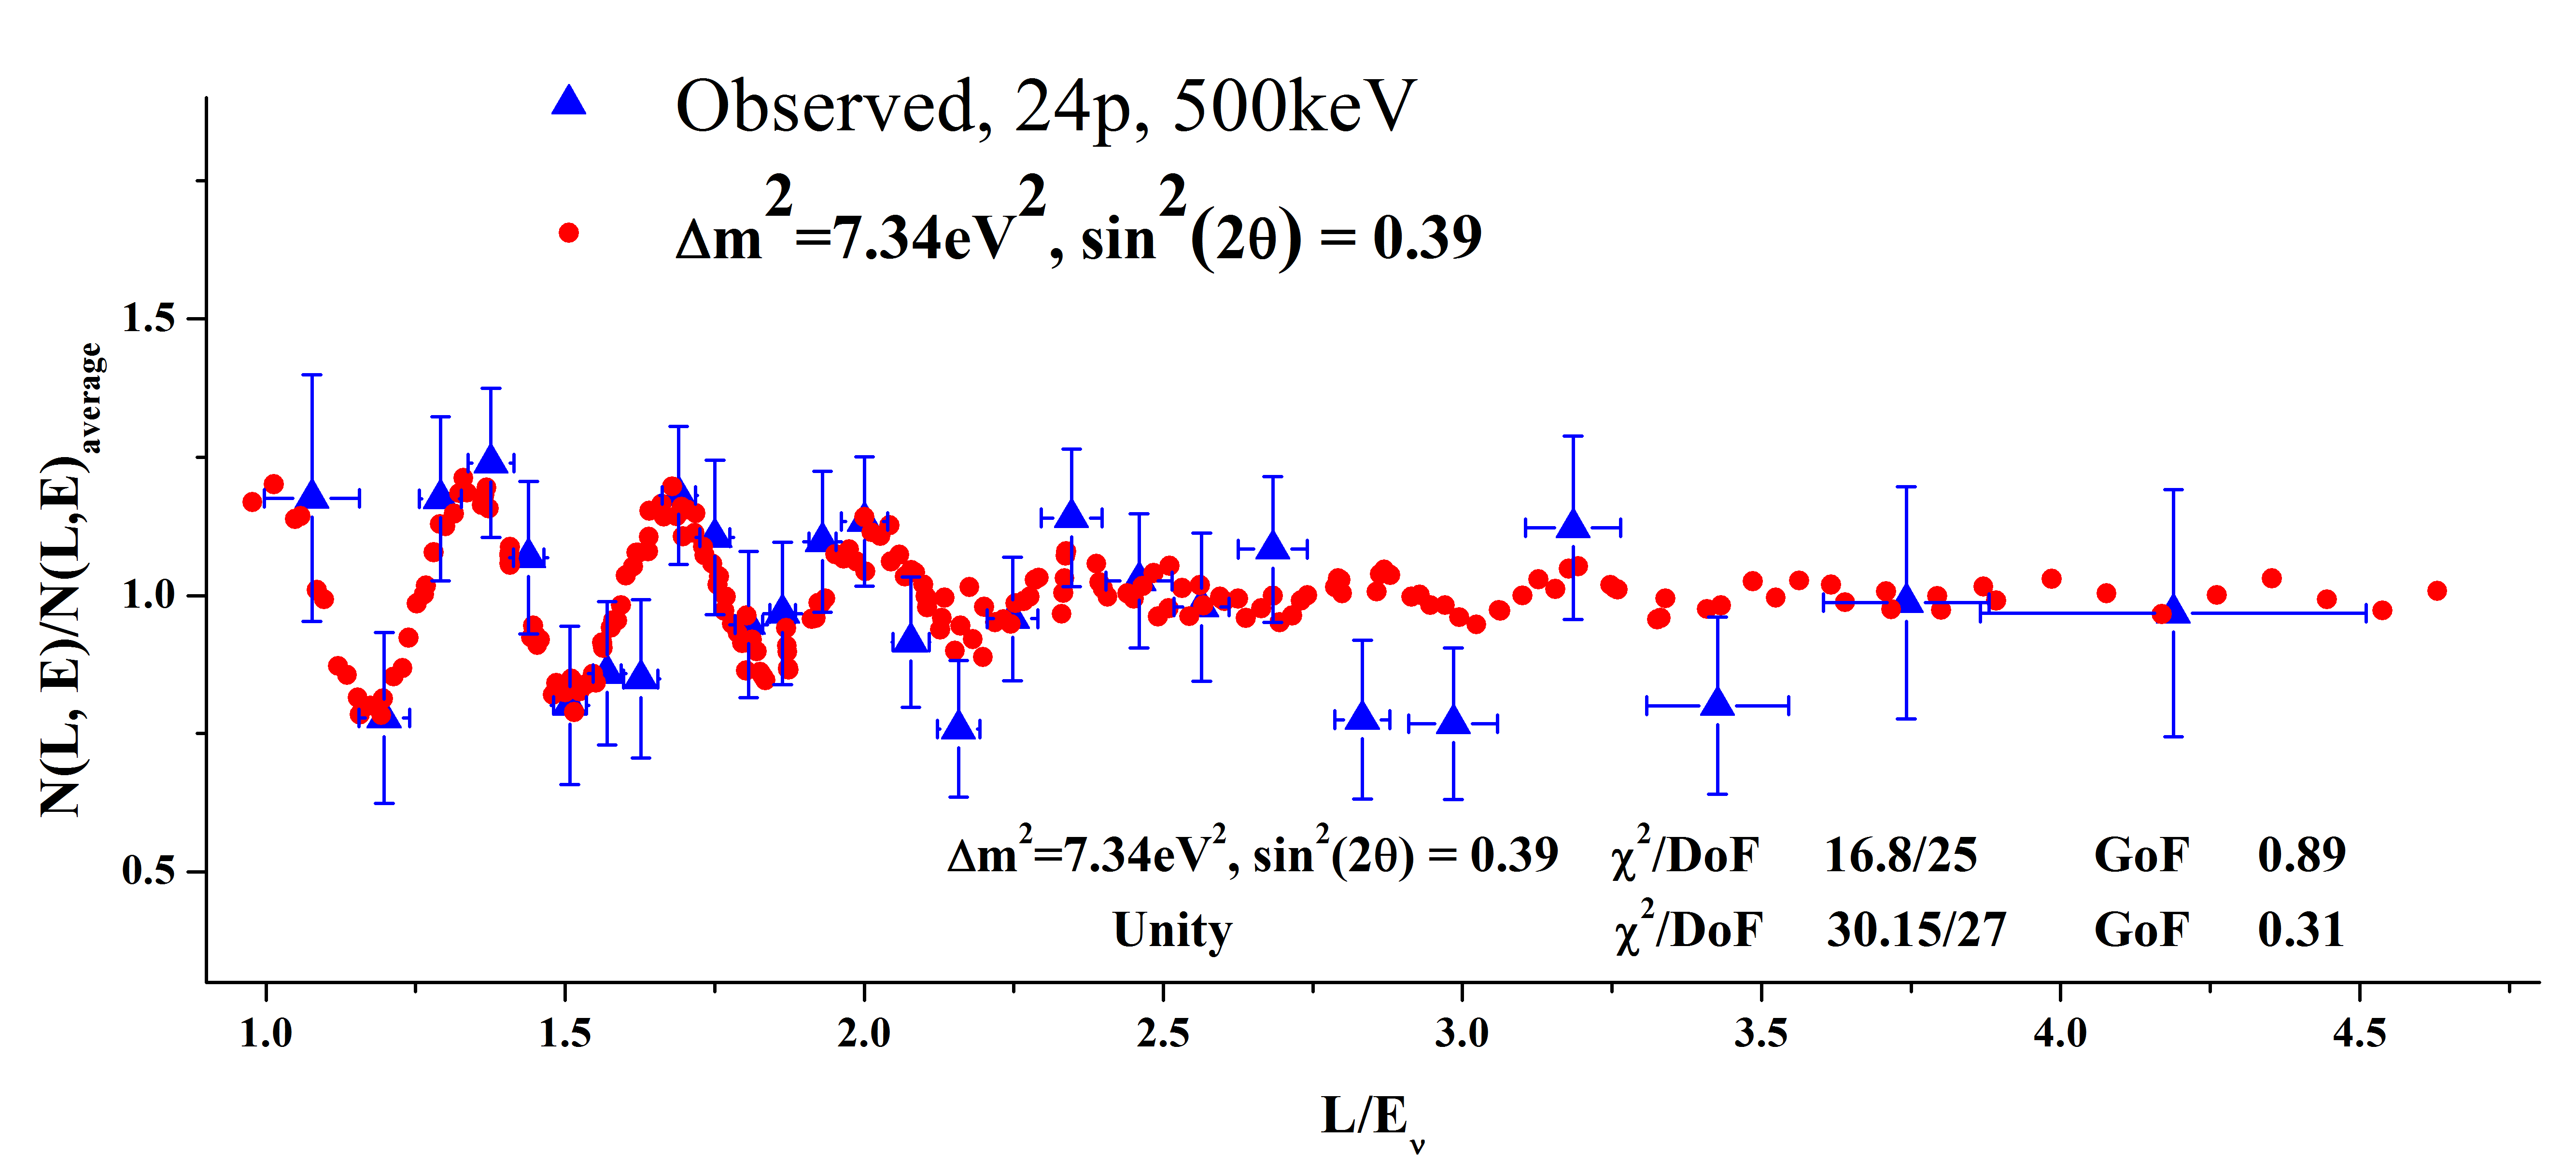
The Neutrino-4 analysis was criticized in [60, 61, 62, 63]. Neutrino-4 initially refused these critical comments [64, 65] but later took into account two of them [66]. This reduced the significance of the result by . The best-fit point for the improved analysis and increased data sample is eV2, [66]. The statistical significance of the result is 2.7. The Neutrino-4 claim is in tension with the PROSPECT results [41] as well as with the measurements of the absolute flux from reactors [40] and Solar neutrino measurements [67]. On the other hand the Neutrino-4 results are in a perfect agreement with the recent BEST result [34, 35].
3 Searches for sterile neutrinos at very short base-line reactor experiments
This section is a cardinal update of the presentation at ICCPA-2018 [60].
3.1 The DANSS Experiment
The DANSS detector [68] consists of 2.5 thousand scintillator strips ( cm3) with a thin ( mm) Gd-containing reflective surface coating. It is surrounded with a composite shielding to suppress backgrounds. DANSS is placed on a movable platform under the core of the 3.1 GWth industrial power reactor at the Kalinin Nuclear Power Plant (KNPP) in Russia. The detector distance to the reactor core center is changed from 10.9 m to 11.9 m, and 12.9 m 2-3 times a week. Reactor materials provide 50 m of water equivalent (m.w.e.) shielding that removes the hadron component of the cosmic background and reduces the cosmic muon flux by a factor of 6. The very good suppression of the cosmic background and the high granularity of the detector allow DANSS to achieve a very high signal/background (S/B) ratio of more than 50 (at 10.9 m from the reactor, after model independent subtraction of the accidental background). The size of the reactor core is quite big (3.7 m in height and 3.2 m in diameter) which leads to smearing of the oscillation pattern. This drawback is compensated by a high flux which allows DANSS to detect more than 5 thousand at a distance of 10.9 m. The energy resolution of the DANSS detector is very modest ( at MeV). This leads to additional smearing of the oscillation pattern, comparable with the smearing due to the large reactor core size.
The IBD reaction is used to detect . Positrons immediately deposit their energy in the detector and annihilate with production of 2 or 3 gammas with the total energy of 1.02 MeV. Neutrons are slowed down to thermal energies where the capture cross-section is high and then captured by Gd which in turn emits gammas with the total energy of about 8 MeV. Thus the IBD reaction produces two signals, prompt and delayed. The delayed coincidence of these two signals allows to suppress the background drastically. The energy can be inferred from the positron energy or from the prompt signal energy that includes 1.02 MeV from the annihilation gammas.
The DANSS experiment compares the positron energy spectra measured with the same detector at the three distances from the reactor core using only relative IBD counting rates. This is the most conservative approach which does not depend on the predicted flux and spectrum as well as on the detector efficiency (only short term variations of the efficiency can influence the results).
Figure 4 shows the ratio of positron energy spectra at the bottom and top detector positions. It is consistent with the 3 hypothesis (black curve). There is no statistically significant evidence for sterile neutrinos. The best 4 hypothesis fit (red curve) is only slightly better (1.3). Hence there is no statistically significant evidence for sterile neutrinos. The best-fit point of RAA (cyan curve) is clearly excluded at more than 5.
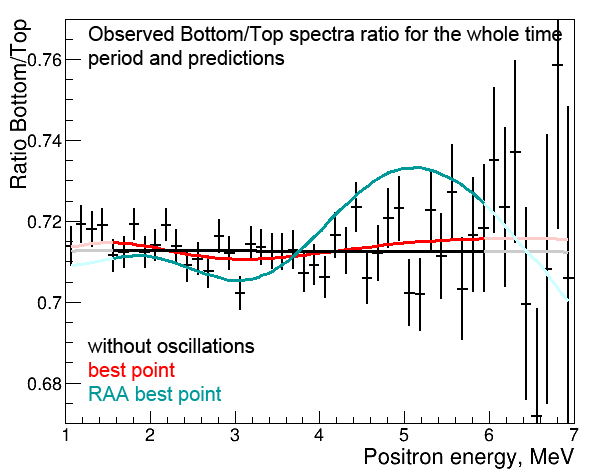
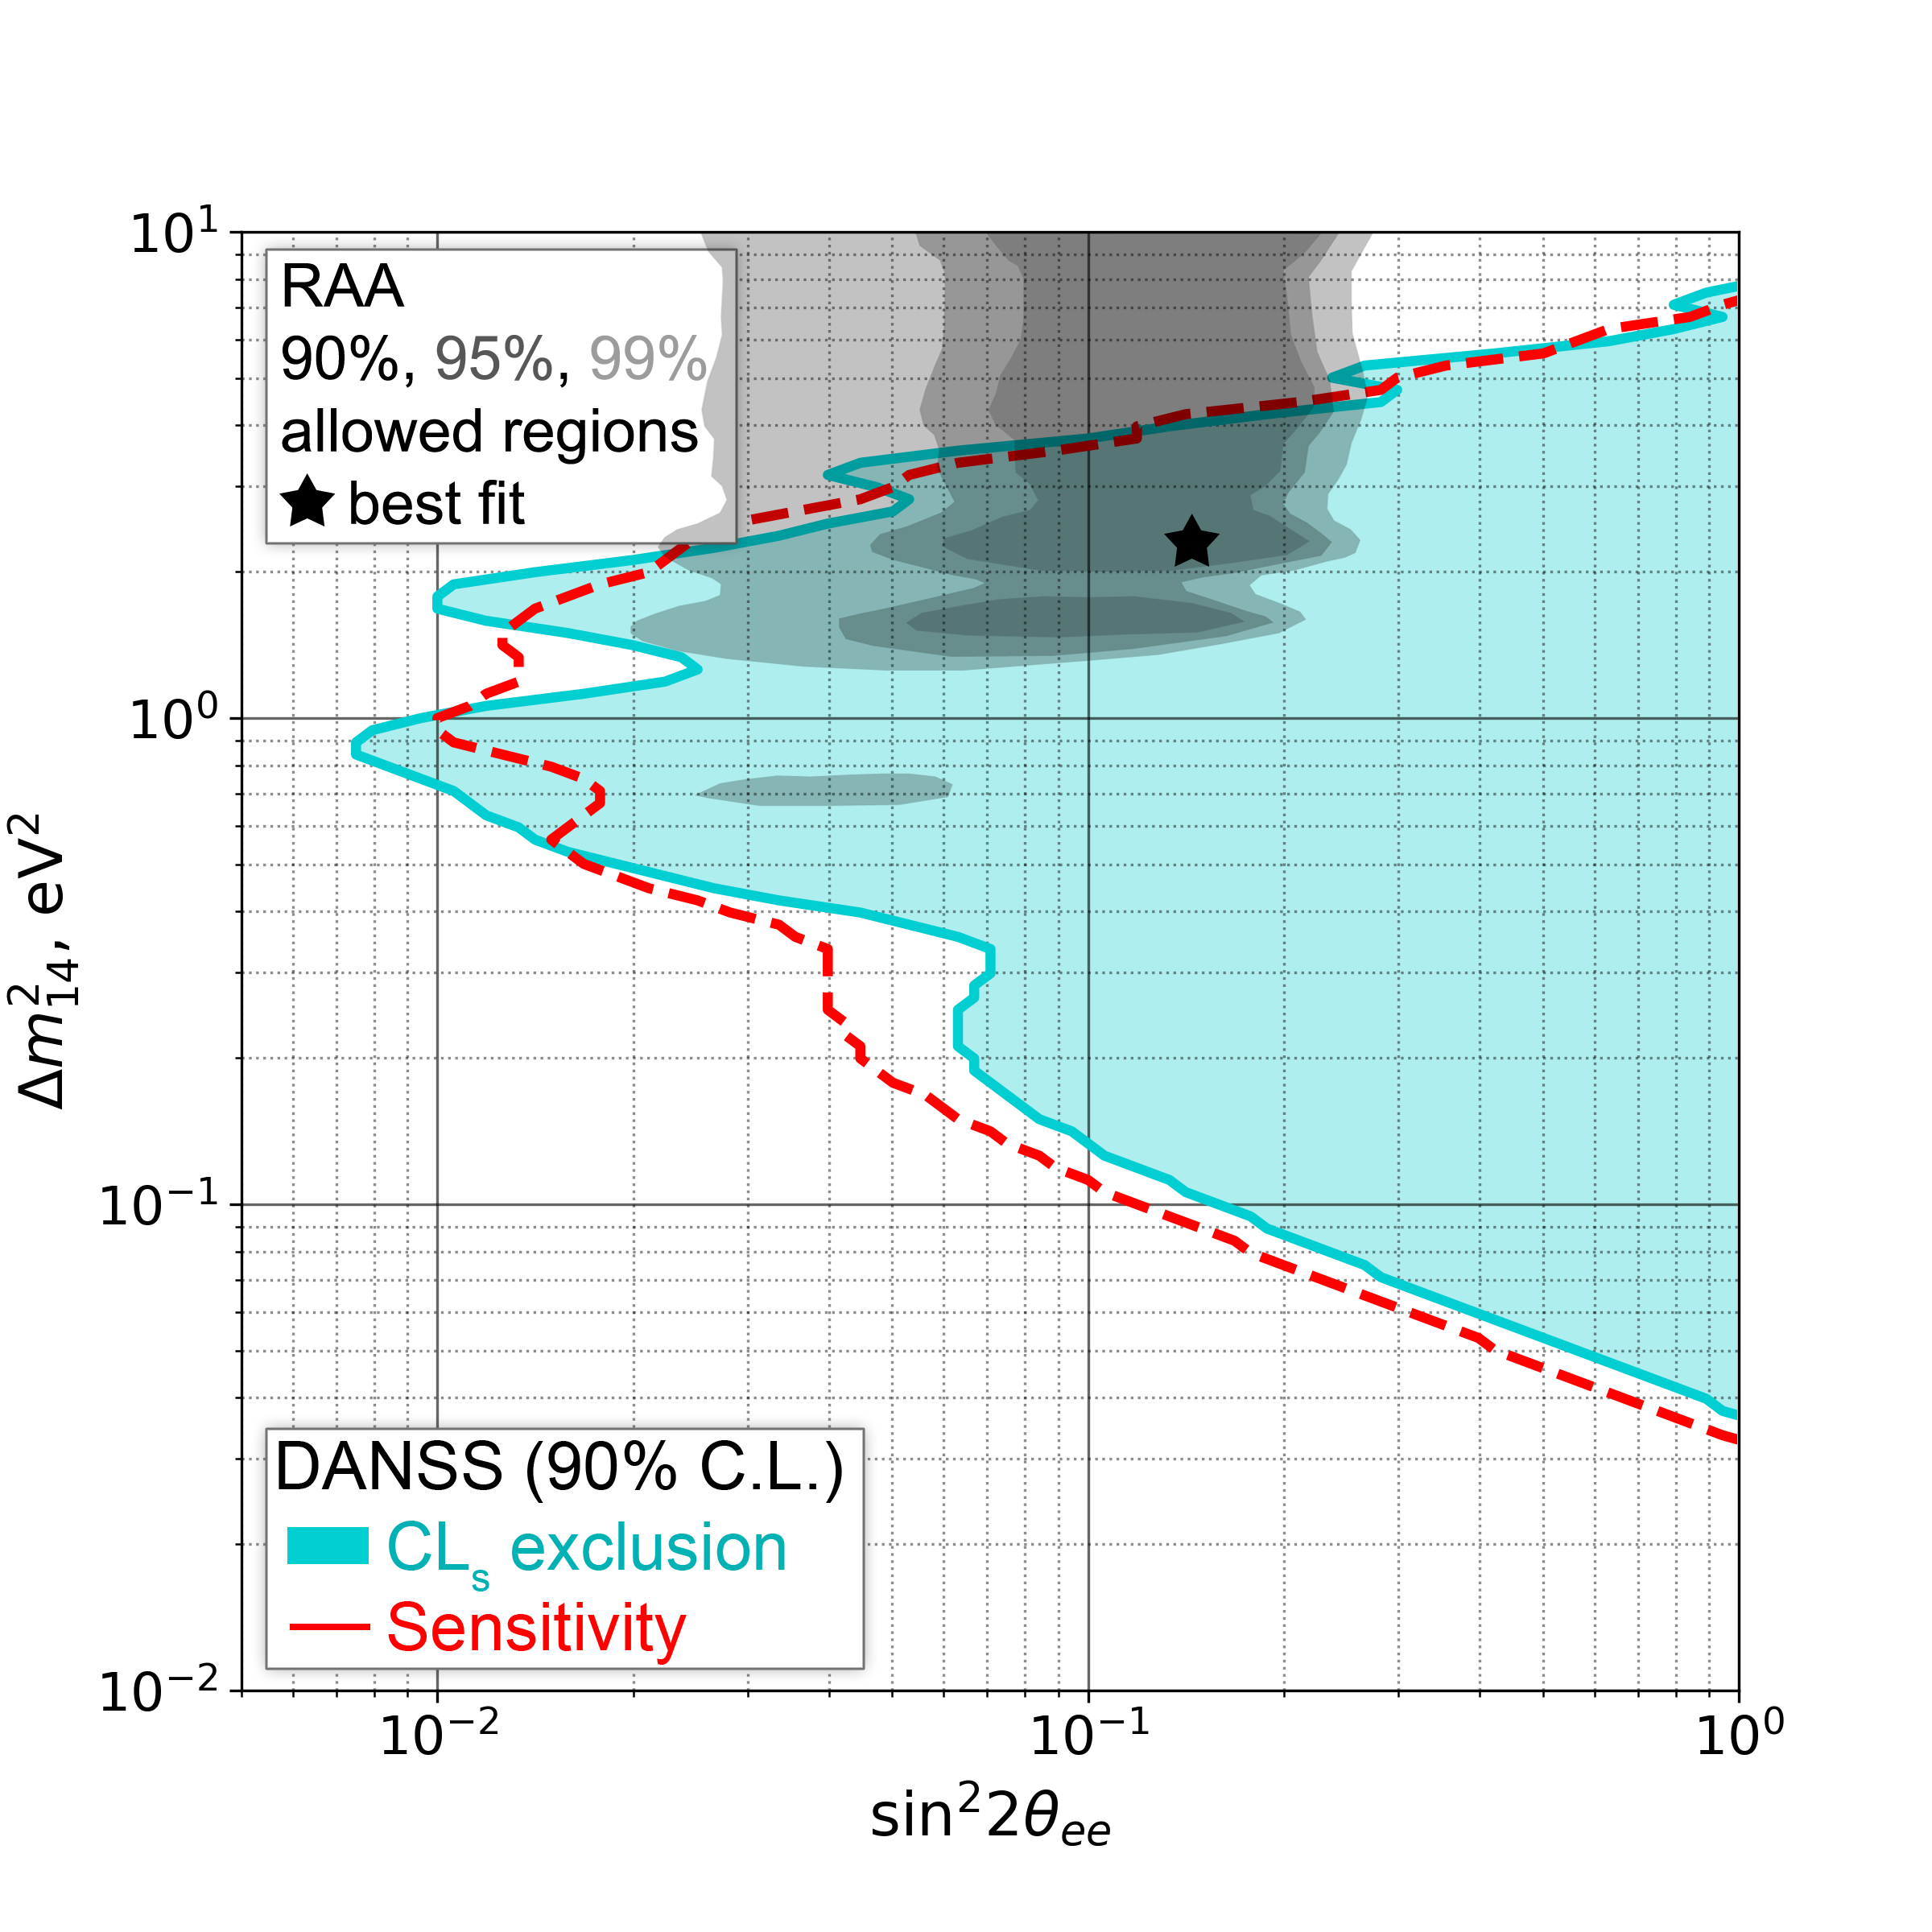
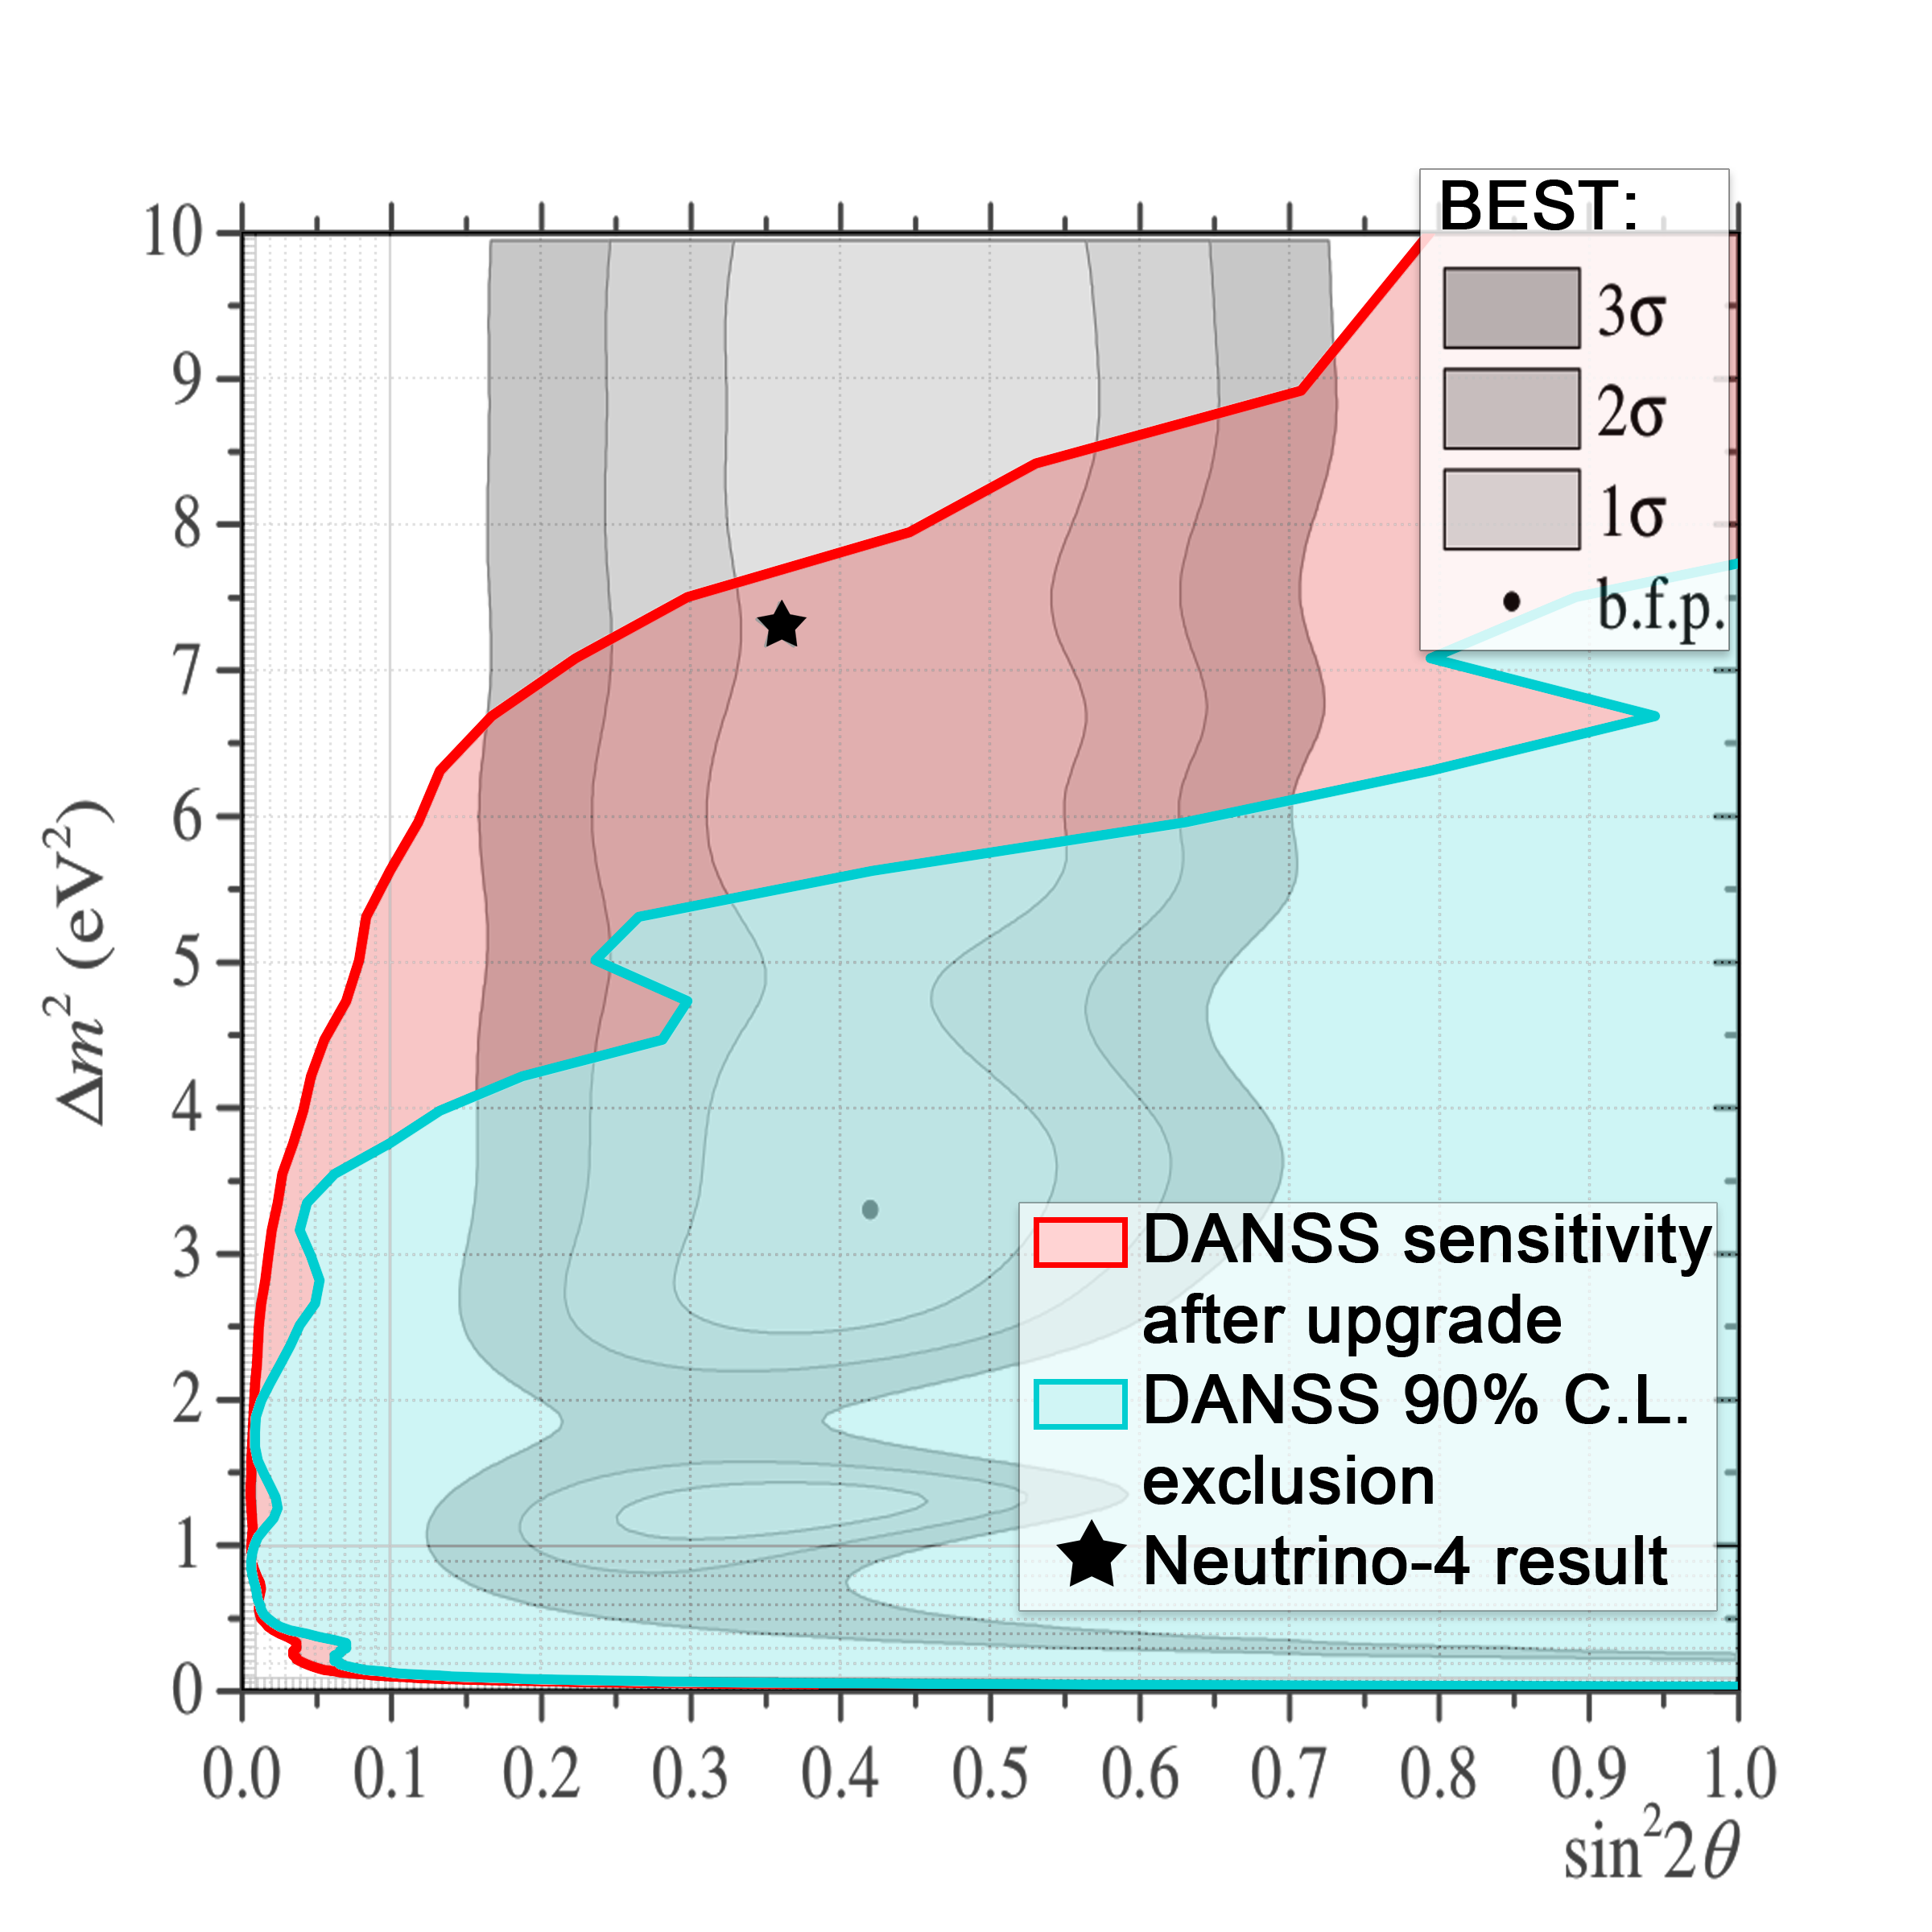
Figure 5 (left) shows the 90% Confidence Level (C.L.) area excluded by DANSS in the plane. The excluded area covers a large fraction of regions indicated by the RAA. In particular, the best fit point [20] is excluded at more than 5 C.L. A large sterile neutrino parameter region preferred by the recent BEST results [35, 34] including the best fit point was already excluded by DANSS and NEOS (see Figure 5(right)). After modernization in 2022 DANSS will be able to scrutinize much larger area including the Neutrino-4 preferred region (see Figure 5(right)). Upgraded DANSS will have almost 3 times better energy resolution and 1.7 times larger volume[69].
3.2 The NEOS Experiment
The NEOS detector [39] had one unsegmented volume filled with 0.87 ton of 0.5% Gd-doped liquid scintillator. It was installed at a 2.8 GWth reactor unit 5 of the Hanbit Nuclear Power Complex (Korea) at m from the reactor core center. As in the DANSS case a quite large active core size ( 3.1 m in diameter, 3.8 m in height) leads to the oscillation pattern smearing. On the other hand the IBD counting rate is quite high (2000 events/day). The background caused by the neutron scattering which imitates the positron signal and subsequent capture of neutrons is rejected with a high efficiency of 73% using pulse shape discrimination(PSD) that suppresses signals from the recoil protons. Together with the sizable overburden of 20 m.w.e. this allows to achieve a very good S/B ratio of 22.
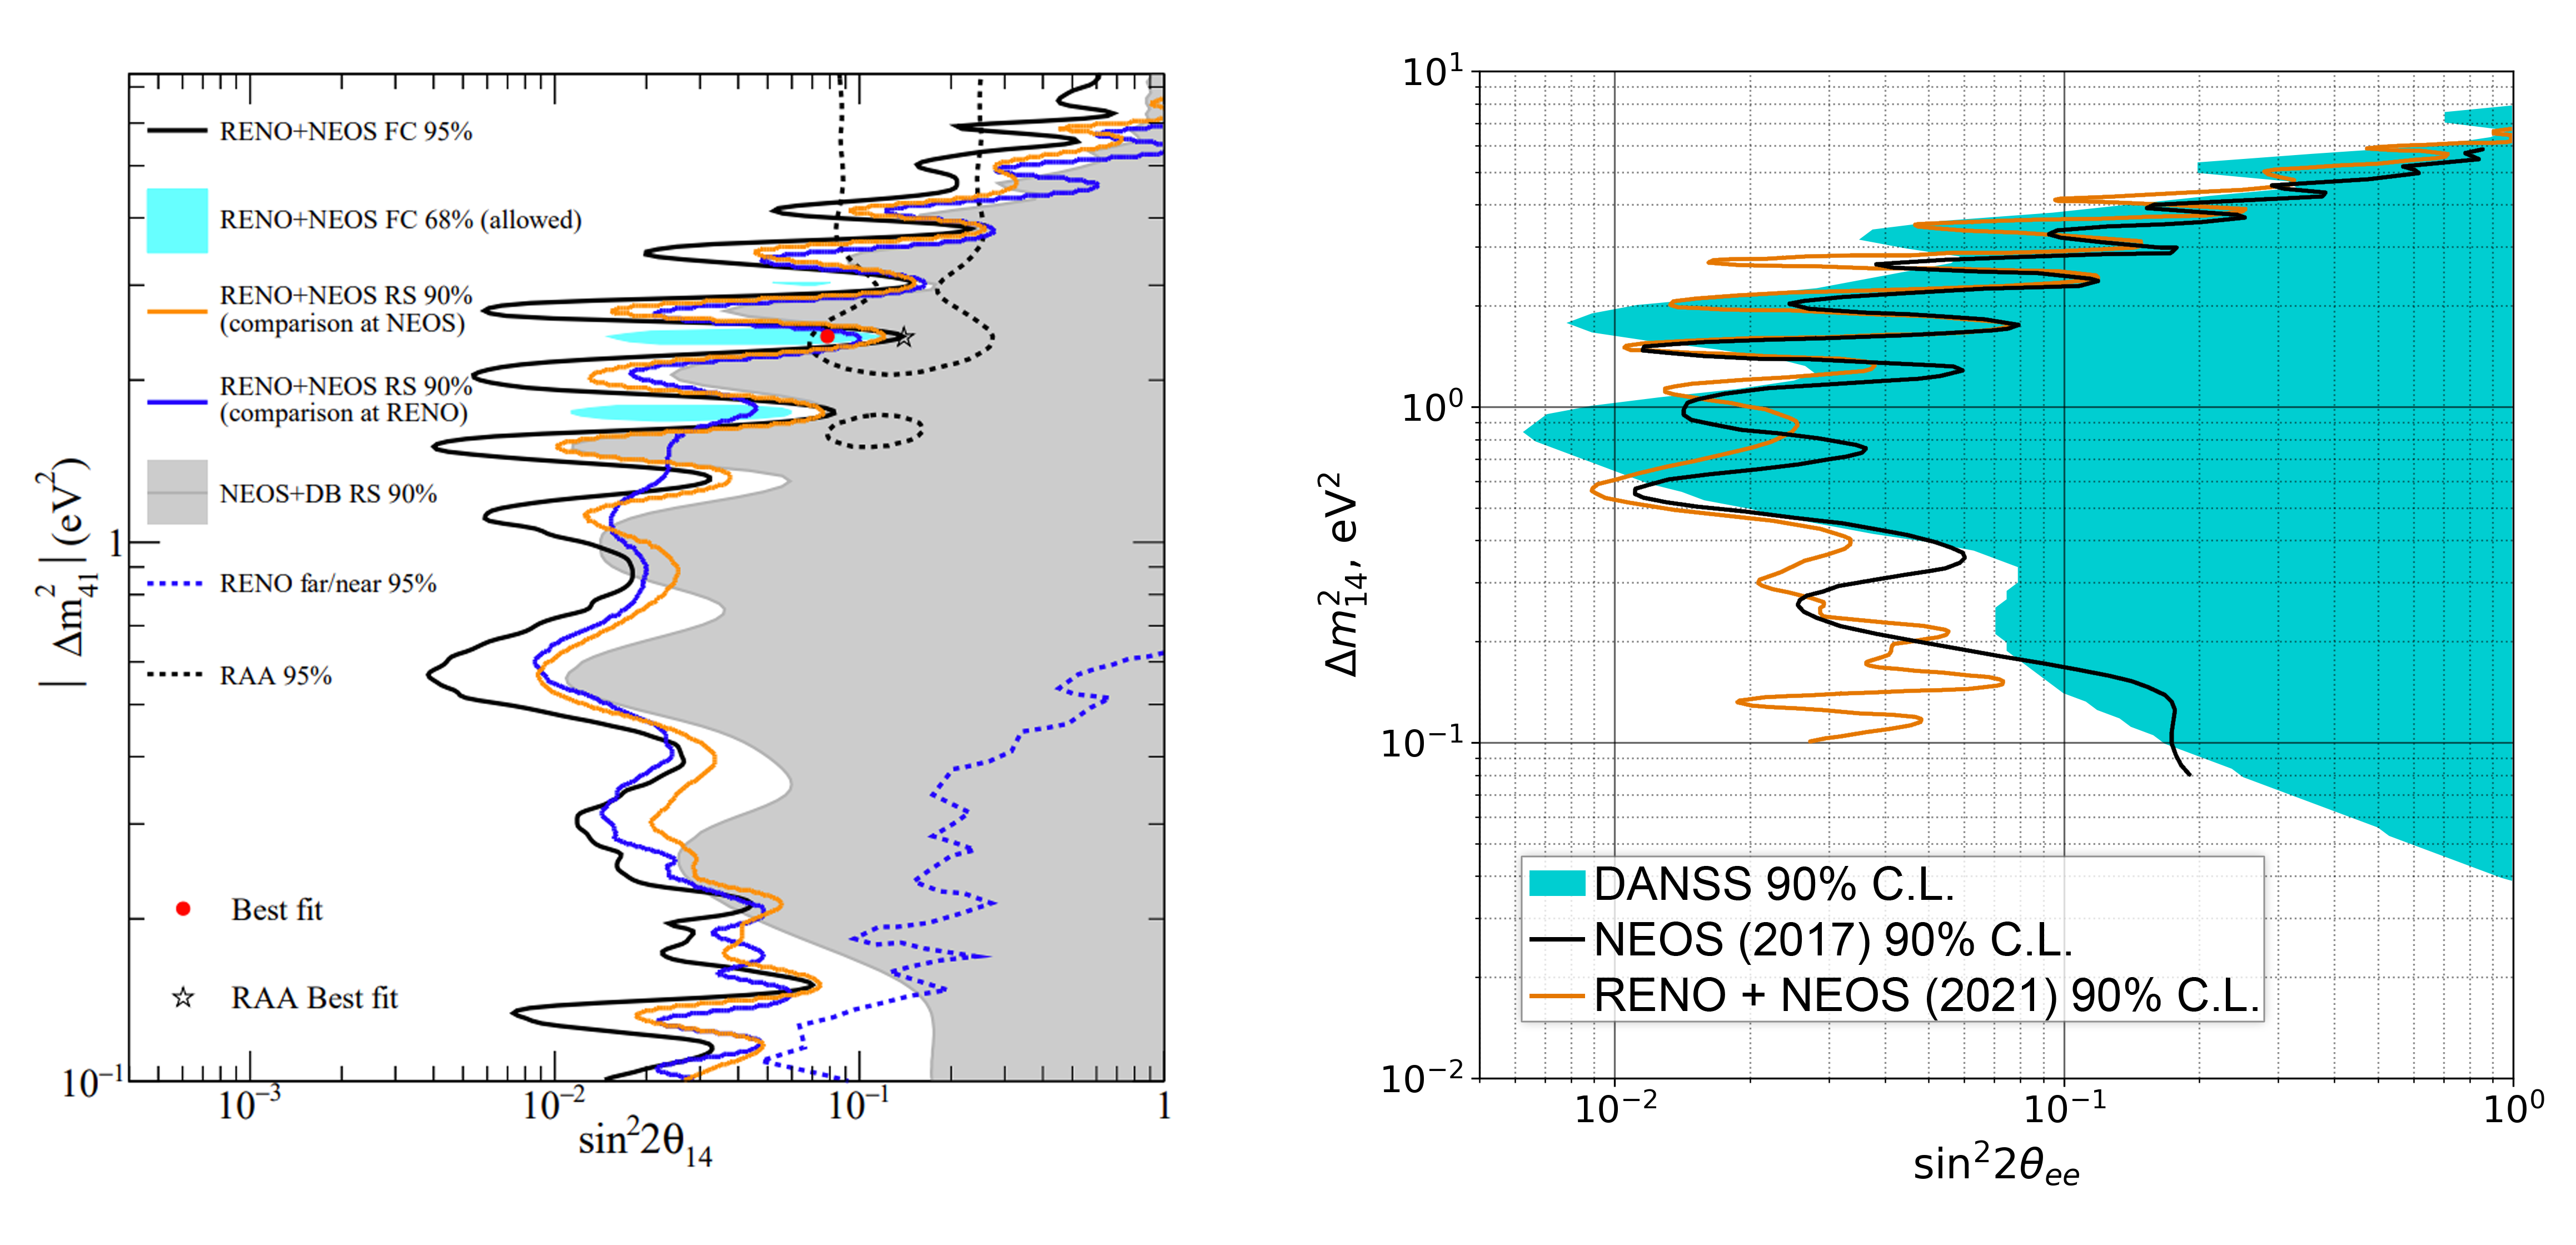
NEOS took data only at one distance from the reactor. Initially NEOS normalized its data on the energy spectrum measured at a different reactor by the Daya Bay collaboration and obtained strong limits on the sterile neutrino parameters[39] shown in Figure 6 (left). Later the RENO and NEOS collaborations established even stronger limits using a joint analysis of the data from the same reactor complex [70] (see Figure 6 (left)). It is not clear why the Feldman-Cousine statistical analysis method [71] leads to much stronger limits in comparison with the raster scan or CLs [72] methods. Monte Carlo simulations of generic experiments searching for sterile neutrinos predicted comparable sensitivities for these methods [72]. Figure 6 (right) shows that the DANSS and NEOS limits obtained with the same raster scan method complement each other. The RENO-NEOS best-fit point agrees nicely with the RAA best-fit point. However these parameters are already excluded by DANSS.
In the phase-II NEOS collected data during the whole reactor cycle of 500 days and 2 reactor-off periods. There was some instability in the liquid scintillator response. The data analysis is ongoing.
3.3 The Neutrino-4 Experiment
The Neutrino-4 detector is made of 50 liquid scintillator sections with a total (fiducial) volume of [66]. The detector is installed on a movable platform near a very compact () and powerful (100 MW) SM-3 research reactor at Dmitrovgrad (Russia). The distance to the reactor core is changed every 10-15 days which allows to perform measurements in the range from 6 m to 12 m. This is an enormous asset in the control of systematic uncertainties. A small overburden of 3.5 m.w.e. and absence of PSD lead to a very modest S/B ratio of 0.54. The energy resolution is also modest ( 16% at 1 MeV). In analysis the energy resolution is assumed to be equal to 250 keV for all energies. Such unusual energy independence of the resolution is inferred from the background shape that is dominated by several lines. However the resolution for sources that is dominated by measurements of several Compton electrons can be different from the resolution for IBD positrons.
There were several critical remarks on the Neutrino-4 analysis [60, 61, 62, 63]. Two of them were taken into account in the recent analysis (see Figure 7) [66]. The results were obtained assuming that the test statistics has the distribution with 2 degrees of freedom. Since this assumption is only approximately valid Neutrino-4 performed Monte Carlo studies and obtained the 2.7 significance of the sterile neutrino signal including systematic uncertainties. The best fit point is eV2, [66]. The obtained sterile neutrino parameters are in tension with the limits obtained by the reactor flux measurements at larger distances even when the large uncertainties in the predictions of the flux are taken into account (see, for example [40]). The PROSPECT and STEREO results [41, 42] are also in tension with the Neutrino-4 claim as will be discussed below. The analysis of solar neutrino data excludes at 95% C.L. [63] that is a large fraction of the Neutrino-4 preferred area including the best-fit point.
The Neutrino-4 collaboration is constructing a new detector that will have 3 times better sensitivity [66]. The new liquid scintillator with larger amount of Gd will decrease the neutron capture time and hence the background. PSD will further decrease the background. The energy resolution will be considerably improved by using a two-sided readout of horizontal sections (now they are vertical with one Photo-Electron Multiplier (PMT)). The new detector should be completed already in 2022.
3.4 The PROSPECT experiment
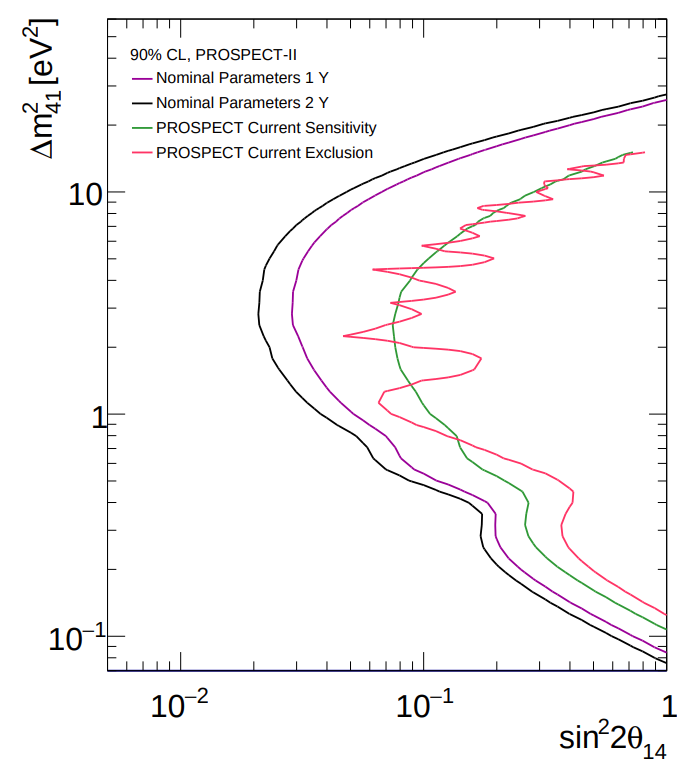
The PROSPECT detector [75, 41] consists of 154 optically isolated rectangular segments (14.5 cm14.5 cm117.6 cm) filled with liquid scintillator loaded with 6Li in order to capture and detect neutrons and read out by two PMT each. The PROSPECT detector is installed at the High Flux Isotope Reactor (HFIR) at Oak Ridge National Laboratory with less than 1 m.w.e. overburden. Nevertheless, a very good PSD and 3D reconstruction of events allowed PROSPECT to achieve a decent S/B ratio of 1.36. A high reactor power (85 MW), the large detector ( ton), and a small distance from the reactor (6.7 m) allow PROSPECT to collect about 800 IBD events per day with excellent energy resolution of 4.5% at 1 MeV. Unfortunately 42% of segments were not operational because of problems with PMTs. Nevertheless PROSPECT excluded a sizable part of the sterile neutrino parameters (see Figure 8) [41]. The obtained limits are in tension with the Neutrino-4 result but can not exclude it.
PROSPECT plans to upgrade the detector and increase considerably the sensitivity (see Figure 8 right) [76].
3.5 The SoLid experiment
The extremely highly segmented SoLid detector consists of 12800 polyvinyltoluene cubes ((555) cm3) with thin sheets of 6LiF:ZnS(Ag) to capture and detect neutrons [77]. Light from each cube is collected with three orthogonal wavelenght-shifting fibers read out with Silicon Photo Multipliers (SiPM). The SoLid detector is installed at a distance of 6 m of the 60 MW SCKCEN BR2 research reactor in Belgium. It has a modest energy resolution of 14% at 1 MeV and good PSD for background rejection. Unfortunately the internal radioactivity from the contamination of 6LiF:ZnS layers leads to a very high background. With complicated machine learning techniques SoLid managed to extract the IBD signal but so far has no results on sterile neutrino searches. SoLid upgrades the detector with new SiPMs to mitigate the problems [78].
3.6 The STEREO experiment
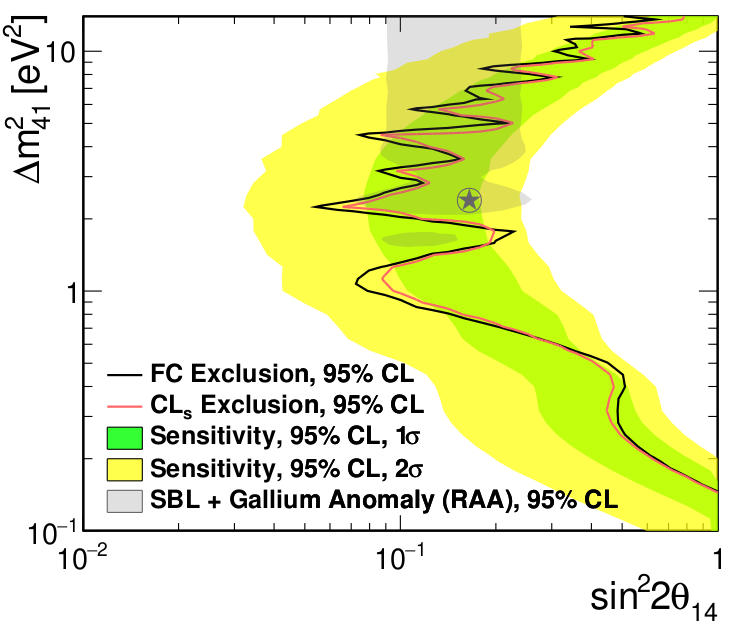
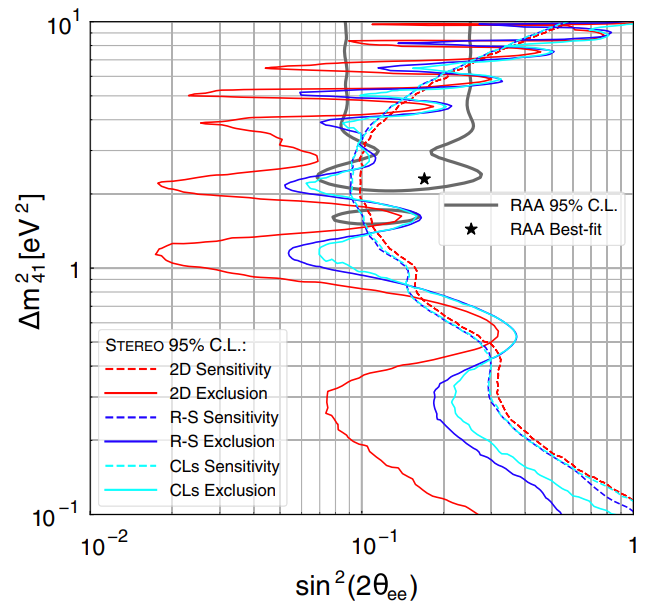
The STEREO detector [42] is made of six optically separated cells filled with a gadolinium loaded liquid scintillator. STEREO was installed at the High Flux Reactor of the Institute Laue-Langevin. The cell distances from the core range from 9.4 m to 11.1 m. Elaborated PSD technique was used to suppress the background from fast neutrons. Still, the achieved S/B ratio of 0.9 was quite modest. STEREO excluded a sizable fraction of the sterile neutrino parameter space [42] (see Figure 9). As in the case of NEOS, the Feldman-Cousines analysis method gives much stronger limits in comparison with other methods. Moreover, the limits are much stronger than the experiment sensitivity.
STEREO finished the data taking but the data analysis is still ongoing.
3.7 The JUNO-TAO experiment
The Juno-TAO is a ton-level liquid scintillator detector at 30 meters from a reactor core of the Taishan Nuclear Power Plant in Guangdong, China [79]. The detector will have extremely good energy resolution of 2% at 1 MeV and will detect 2000 per day. The expected Juno-TAO 90% C.L. sensitivity on with 3 years of data taking is about 0.01-0.02 in the wide range of between 0.06 eV2 and 3 eV2. JUNO-TAO plans to start data taking in 2022.
3.8 Summary on Very Short Base-Line (VLBS) experiments
The advantages (red color) and disadvantages (blue color) of recent VSBL experiments are summarized in Table 1. The experiments at industrial reactors (DANSS and NEOS) benefit from the high counting rates up to 5000 /day. They have the highest sensitivity of at (1-2) eV2. At larger oscillations are averaged out already inside the large reactor core and the sensitivity deteriorates. For large the experiments at the research reactors in particular upgraded Neutrino-4 and PROSPECT have higher sensitivity. The upgraded DANSS, Neutrino-4, and PROSPECT experiments will soon test the Neutrino-4 claim of the sterile neutrino observation and scrutinize even larger part of the sterile neutrino parameters preferred by the recent BEST results.
| DANSS | NEOS | Neutrino-4 | PROSPECT | SoLid | STEREO | |
| Power [MW] | 3100 | 2815 | 100 | 85 | 50-80 | 58 |
| Core size [cm] | ||||||
| Overburden [mwe] | 50 | 20 | 3.5 | 10 | 15 | |
| Distance [m] | 10.9-12.9 | 23.7 | 6-12 | 7-9 | 6-9 | 9-11 |
| movable | movable | |||||
| IBD events/day | 5000 | 2000 | 200 | 750 | ? | 400 |
| PSD | No | Yes | No | Yes | Yes | Yes |
| Readout | Quasi-3D | 1D | 2D | 3D | 3D | 2D |
| S/B | 50 | 23 | 0.54 | 1.36 | ? | 0.9 |
| [%] at 1 MeV | 34 | 5 | 16 | 4.5 | 14 | 8 |
4 Global fits
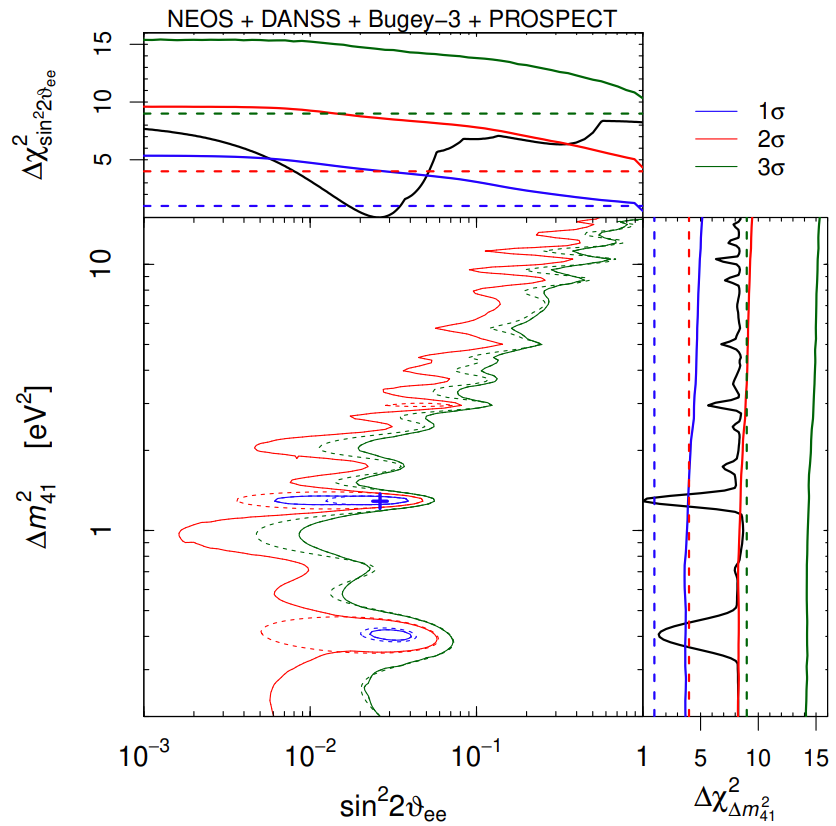
It is not trivial to combine the results of different experiments on sterile neutrino searches. Initially this was done (see e.g. [51, 50]) assuming that the test statistics follows the distribution with 2 degrees of freedom which is not corrects in the sterile neutrino searches (see e.g. [80]). The Monte Carlo simulation of the distribution is needed for correct estimates of the significance that requires deep knowledge of experiments. To circumvent this very serious complication several authors performed a simplified simulation of experiments used in their analysis [80, 81]. With the Monte Carlo determination of the distribution the significance of the evidence for sterile neutrinos in disappearance experiments (without Neutrino-4 and BEST) was reduced from 2.4 to 1.8 (see Figure 10) [80].
The strong limits on and disappearance do not allow to explain by sterile neutrinos simultaneously the LSND/MiniBooNE excess in the () appearance and RAA/GA deficit(see Figure 11) [40]. However, the Neutrino-4 result and the highly significant BEST result were not included into the comparison.
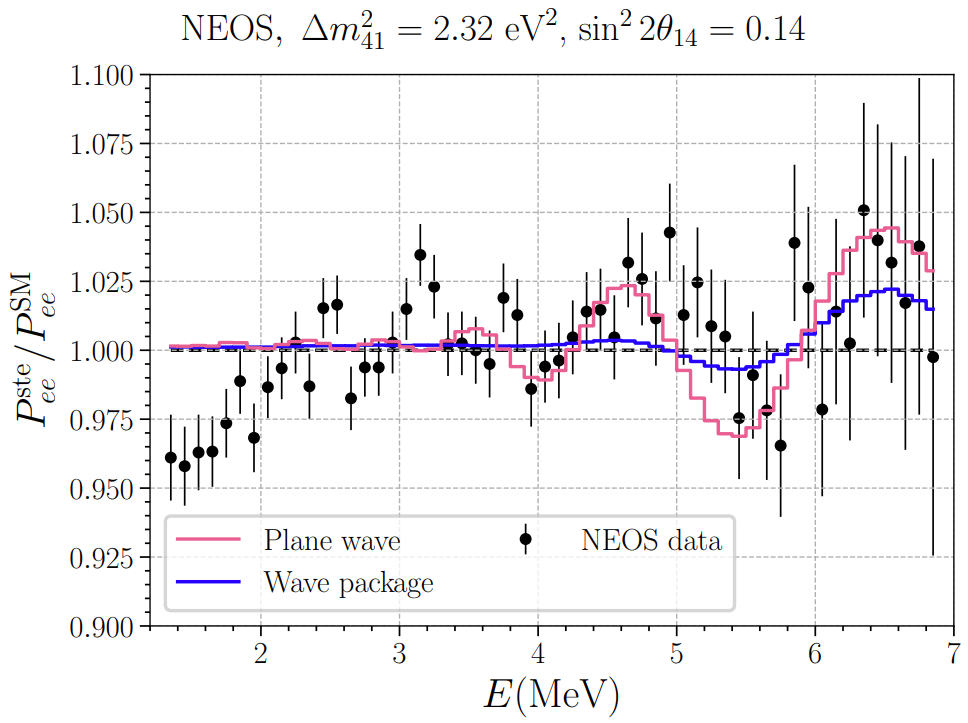
The validity of existing limits on sterile neutrino parameters was questioned recently [82]. For very small neutrino wave packet sizes evolution of the neutrino beams with time becomes more complicated than equation (2) and the oscillation behavior is smeared out (see Figure 12). Existing experimental limits on the size of reactor antineutrino wave packets are quite weak. If one uses the present upper limits as the actual values of the reactor antineutrino wave packet size, the limits on the sterile neutrino mixing parameter become considerably weaker and the tension between the results for neutrino disappearance in radioactive sources experiments and reactor experiments vanishes at least for some values of . The contradiction between appearance and disappearance experiments is also reduced. However there is no reason for the wave packet size to be equal to its current upper limit. Most probably the size is much larger and it does not change the present limits on the sterile neutrino parameters.
The standard cosmological model strongly disfavors the eV-scale sterile neutrinos. However there are models which include eV-scale sterile neutrinos and reduce the tension between different determinations of the Hubble constant [83].
5 Conclusions
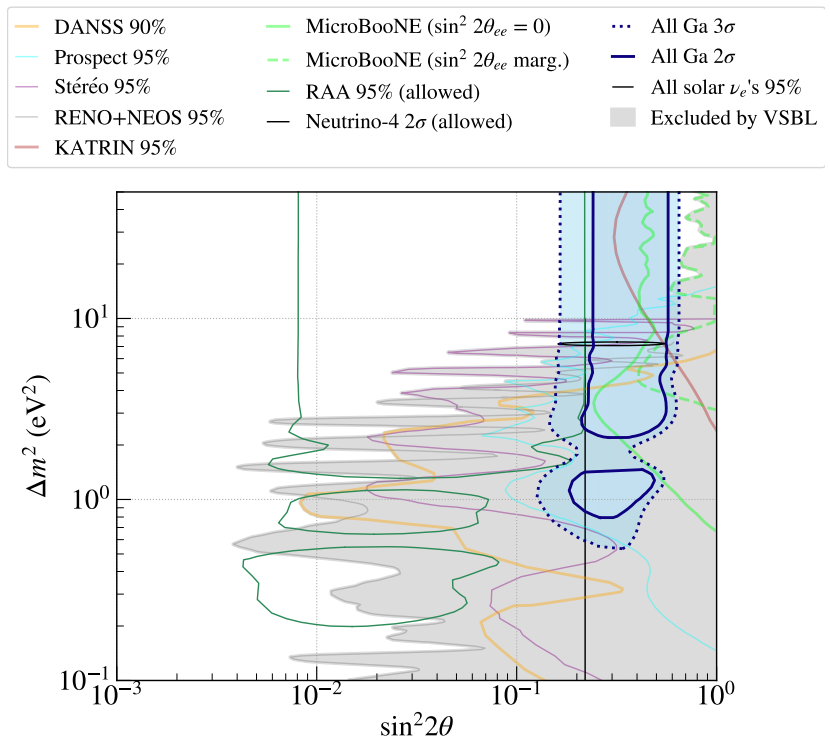
The situation with the experimental indications of eV-scale sterile neutrino existence is quite controversial. Indications from all but one reactor experiments have statistical significance below 2. This should be compared with the initial estimates of the RAA significance of about 3. On the other hand Neutrino-4 claims the observation of sterile neutrinos with 2.7 significance. Moreover the large deficit observed recently by BEST with more than 5 significance perfectly agrees with the Neutrino-4 result. However a large fraction of sterile neutrino parameters preferred by Neutrino-4 and BEST are either excluded or are in tension with results from several experiments. This is nicely illustrated by Figure 13 [35].
Upgraded DANSS, Neutrino-4, and PROSPECT experiments as well as JUNO-TAO will clarify the situation in a few years.
More than 6 evidence for () appearance from LSND/MiniBooNE is not confirmed by MicroBooNE, but not excluded completely. The Fermilab Short Baseline Neutrino program and the JSNS2 experiment at J-PARK [90] will clarify the situation in a few years.
The next several years will be crucial for the searches for eV-scale sterile neutrinos.
6 Acknowledgments
Author would like to thank N.Skrobova for the invaluable help in the preparation of the manuscript. This work is supported by the Ministry of Science and Higher Education of the Russian Federation under the Contract No. 075-15-2020-778.
References
References
- [1] Zyla P et al. (Particle Data Group) 2020 PTEP 2020 083C01
- [2] Chatrchyan S et al 2012 Physics Letters B 716 30–61 ISSN 0370-2693 URL https://www.sciencedirect.com/science/article/pii/S0370269312008581
- [3] Aad G et al 2012 Physics Letters B 716 1–29 ISSN 0370-2693 URL https://www.sciencedirect.com/science/article/pii/S037026931200857X
- [4] Aghanim N et al 2020 Astron. Astrophys. 641 A6
- [5] Abi, B et al (Muon Collaboration) 2021 Phys. Rev. Lett. 126(14) 141801 URL https://link.aps.org/doi/10.1103/PhysRevLett.126.141801
- [6] Aaij, R et al (LHCb) 2021 arXiv:2110.09501v2 URL https://arxiv.org/abs/2110.09501v2
- [7] Fukuda Y et al 1998 Physical Review Letters 81 1562 URL https://doi.org/10.1103/PhysRevLett.81.1562
- [8] Ahmad, Q R et al (SNO Collaboration) 2001 Phys. Rev. Lett. 87(7) 071301 URL https://link.aps.org/doi/10.1103/PhysRevLett.87.071301
- [9] Davis R 2003 Int. J. Mod. Phys. A 18 3089–3108
- [10] Abdurashitov J N et al 2006 Phys.Rev. C 73 045805
- [11] Kaether F et al 2010 Phys.Rev. B 685 47
- [12] Pontecorvo B 1958 Sov. Phys. JETP 7 172
- [13] Maki Z and Nakagawa M and Sakata S 1962 Prog. Theor. Phys. 28 870
- [14] Pontecorvo B 1968 Sov. Phys. JETP 26 984
- [15] Sajjad Athar et al 2022 Progress in Particle and Nuclear Physics 103947 ISSN 0146-6410 URL https://www.sciencedirect.com/science/article/pii/S0146641022000084
- [16] The ALEPH Collaboration, the DELPHI Collaboration, the L3 Collaboration, the OPAL Collaboration, the SLD Collaboration, the LEP Electroweak Working Group, the SLD Electroweak and Heavy Flavour Groups 2006 Physics Reports 427 257–454 ISSN 0370-1573 URL https://www.sciencedirect.com/science/article/pii/S0370157305005119
- [17] Carlo Giunti, Marco Laveder 2011 Phys.Rev. C 83 065504
- [18] Huber P 2011 Phys.Rev. C 84 024617
- [19] Mueller T A et al 2011 Phys.Rev. C 83 054615
- [20] Mention G et al 2011 Phys.Rev. D 83 073006
- [21] Hayen L et al 2019 Phys. Rev. C 100(5) 054323 URL https://link.aps.org/doi/10.1103/PhysRevC.100.054323
- [22] Estienne M et al 2019 Phys. Rev. Lett. 123(2) 022502 URL https://link.aps.org/doi/10.1103/PhysRevLett.123.022502
- [23] An F et al. (Daya Bay) 2017 Phys. Rev. Lett. 118 251801 (Preprint 1704.01082)
- [24] Bak, G et al (RENO Collaboration) 2019 Phys. Rev. Lett. 122(23) 232501 URL https://link.aps.org/doi/10.1103/PhysRevLett.122.232501
- [25] Schreckenbach K, Faust H, von Feilitzsch F, Hahn A, Hawerkamp K and Vuilleumier J 1981 Physics Letters B 99 251–256 ISSN 0370-2693 URL https://www.sciencedirect.com/science/article/pii/0370269381911205
- [26] Schreckenbach K, Colvin G, Gelletly W and Von Feilitzsch F 1985 Physics Letters B 160 325–330 ISSN 0370-2693 URL https://www.sciencedirect.com/science/article/pii/0370269385913371
- [27] von Feilitzsch F, Hahn A and Schreckenbach K 1982 Physics Letters B 118 162–166 ISSN 0370-2693 URL https://www.sciencedirect.com/science/article/pii/0370269382906220
- [28] Hahn A, Schreckenbach K, Gelletly W, von Feilitzsch F, Colvin G and Krusche B 1989 Physics Letters B 218 365–368 ISSN 0370-2693 URL https://www.sciencedirect.com/science/article/pii/0370269389915980
- [29] Kopeikin V I, Panin Y N and Sabelnikov A A 2021 Phys. Atom. Nucl. 84 1–10
- [30] Kopeikin V, Skorokhvatov M and Titov O 2021 Phys. Rev. D 104(7) L071301 URL https://link.aps.org/doi/10.1103/PhysRevD.104.L071301
- [31] Seo S H 2015 AIP Conference Proceedings 1666 080002 (Preprint https://aip.scitation.org/doi/pdf/10.1063/1.4915563) URL https://aip.scitation.org/doi/abs/10.1063/1.4915563
- [32] Abe, Y et al Journal of High Energy Physics 2014 86 URL https://doi.org/10.1007/JHEP10(2014)086
- [33] An, F P et al (Daya Bay Collaboration) 2016 Phys. Rev. Lett. 116(6) 061801 URL https://link.aps.org/doi/10.1103/PhysRevLett.116.061801
- [34] Barinov V et al arXiv:2109.11482 URL https://arxiv.org/abs/2109.11482
- [35] Barinov V et al arXiv:2201.07364v1 URL https://arxiv.org/abs/2201.07364v1
- [36] Barinov V and Gorbunov D arXiv:2109.14654 URL https://arxiv.org/abs/2109.14654
- [37] Alekseev I et al. (DANSS) 2018 Phys. Lett. B 787 56–63 (Preprint 1804.04046)
- [38] Danilov M 2021 PoS ICHEP2020 121
- [39] Ko Y et al. (NEOS) 2017 Phys. Rev. Lett. 118 121802 (Preprint 1610.05134)
- [40] Adamson P et al. (MINOS+, Daya Bay) 2020 Phys. Rev. Lett. 125 071801 (Preprint 2002.00301)
- [41] Andriamirado, M et al (PROSPECT Collaboration) 2021 Phys. Rev. D 103(3) 032001 URL https://link.aps.org/doi/10.1103/PhysRevD.103.032001
- [42] Almazán, et al (STEREO Collaboration) 2020 Phys. Rev. D 102(5) 052002 URL https://link.aps.org/doi/10.1103/PhysRevD.102.052002
- [43] Athanassopoulos C et al 1996 Phys.Rev.Lett. 77 3082 URL https://doi.org/10.1103/PhysRevLett.77.3082
- [44] Aguilar-Arevalo, A A et al (MiniBooNE Collaboration) 2007 Phys. Rev. Lett. 98(23) 231801 URL https://link.aps.org/doi/10.1103/PhysRevLett.98.231801
- [45] Aguilar-Arevalo, A A et al (MiniBooNE Collaboration) 2009 Phys. Rev. Lett. 102(10) 101802 URL https://link.aps.org/doi/10.1103/PhysRevLett.102.101802
- [46] Aguilar-Arevalo, A A et al (MiniBooNE Collaboration) 2013 Phys. Rev. Lett. 110(16) 161801 URL https://link.aps.org/doi/10.1103/PhysRevLett.110.161801
- [47] Aguilar-Arevalo A A et al 2018 Phys.Rev.Lett. 121 221801
- [48] Aguilar-Arevalo et al (MiniBooNE Collaboration) 2021 Phys. Rev. D 103(5) 052002 URL https://link.aps.org/doi/10.1103/PhysRevD.103.052002
- [49] Agafonova N et al (The OPERA collaboration) 2018 Journal of High Energy Physics 2018(6) 151 URL https://doi.org/10.1007/JHEP06(2018)151
- [50] Gariazzo S et al 2017 JHEP 1706 135
- [51] Dentler M et al 2018 JHEP 1808 010
- [52] Aartsen, M G et al (IceCube Collaboration) 2020 Phys. Rev. Lett. 125(14) 141801 URL https://link.aps.org/doi/10.1103/PhysRevLett.125.141801
- [53] Adamson, P et al (MINOS+ Collaboration) 2019 Phys. Rev. Lett. 122(9) 091803 URL https://link.aps.org/doi/10.1103/PhysRevLett.122.091803
- [54] Abratenko P et al. (MicroBooNE) 2021 (Preprint 2110.14054)
- [55] Arguelles Delgado et al 2021 arXiv:2111.10359v1 URL https://arxiv.org/abs/2111.10359v1
- [56] Armbruster, B et al (KARMEN Collaboration) 2002 Phys. Rev. D 65(11) 112001 URL https://link.aps.org/doi/10.1103/PhysRevD.65.112001
- [57] Machado P A, Palamara O and Schmitz D W 2019 Annual Review of Nuclear and Particle Science 69 363–387 (Preprint https://doi.org/10.1146/annurev-nucl-101917-020949) URL https://doi.org/10.1146/annurev-nucl-101917-020949
- [58] Serebrov AP et al (NEUTRINO-4) 2019 Pisma Zh. Eksp. Teor. Fiz. 109 209–218 (Preprint arXiv:1809.10561)
- [59] Serebrov A P and Samoilov R M 2020 JETP Lett. 112 199–212 (Preprint 2003.03199)
- [60] Danilov M 2019 J. Phys. Conf. Ser. 1390 012049 (Preprint 1812.04085)
- [61] Danilov M V and Skrobova N A 2020 JETP Lett. 112 452–454
- [62] Andriamirado M et al. (PROSPECT, STEREO) 2020 (Preprint 2006.13147)
- [63] Giunti C, Li Y F, Ternes C A and Zhang Y Y 2021 Phys. Lett. B 816 136214 (Preprint 2101.06785)
- [64] Serebrov A P and Samoilov R M 2020 JETP Lett. 112 455–456
- [65] Serebrov A P and Samoilov R M (Neutrino-4) 2020 (Preprint 2006.13639)
- [66] Serebrov A P et al 2021 Phys. Rev. D 104(3) 032003 URL https://link.aps.org/doi/10.1103/PhysRevD.104.032003
- [67] Giunti C, Li Y, Ternes C and Zhang Y 2021 Physics Letters B 816 136214 ISSN 0370-2693 URL https://www.sciencedirect.com/science/article/pii/S0370269321001544
- [68] Alekseev I et al 2016 JINST 11 P11011
- [69] Skrobova, N 2020 Bull. Lebedev Phys. Inst. 47 101–104 URL https://doi.org/10.3103/S1068335620040077
- [70] Atif Z et al (RENO Collaboration) 2020 arXiv:2011.00896v2 URL https://arxiv.org/abs/2011.00896v2
- [71] Feldman G J and Cousins R D 1998 Phys. Rev. D 57(7) 3873–3889
- [72] Qian X et al 2016 Nucl.Inst.Meth. A 827 63
- [73] Choi, J H at al (RENO Collaboration) 2020 Phys. Rev. Lett. 125(19) 191801 URL https://link.aps.org/doi/10.1103/PhysRevLett.125.191801
- [74] Abazajian K N arXiv:1204.5379 URL https://arxiv.org/abs/1204.5379
- [75] Ashenfelter J et al 2018 Phys. Rev. Lett. 121(25) 251802 URL https://link.aps.org/doi/10.1103/PhysRevLett.121.251802
- [76] Andriamirado M et al. (PROSPECT) 2021 (Preprint arXiv:2107.03934)
- [77] Abreu Y et al 2021 Journal of Instrumentation 16 P02025–P02025 URL https://doi.org/10.1088/1748-0221/16/02/p02025
- [78] Gallego S 2021 Solid – measuring reactor anti-neutrinos at very short baselines talk at ICNFP-2021 URL https://indico.cern.ch/event/1025480/contributions/4442719/
- [79] Abusleme A et al. (JUNO) 2020 (Preprint 2005.08745) URL https://arxiv.org/abs/2005.08745
- [80] Giunti C 2020 Phys. Rev. D 101(9) 095025 URL https://link.aps.org/doi/10.1103/PhysRevD.101.095025
- [81] Berryman J M and Huber P 2021 Journal of High Energy Physics 2021(1) 167 URL https://doi.org/10.1007/JHEP01(2021)167
- [82] Argüelles Carlos A, Toni Bertólez-Martínez, Jordi Salvado arXiv:2201.05108v1 URL https://arxiv.org/abs/2201.05108v1
- [83] Archidiacono M, Gariazzo S, Giunti C, Hannestad S and Tram T 2020 Journal of Cosmology and Astroparticle Physics 2020 029–029 URL https://doi.org/10.1088/1475-7516/2020/12/029
- [84] Danilov M arXiv:1911.10140 URL https://arxiv.org/abs/1911.10140
- [85] Achkar A et al 1995 Nucl. Phys. B 434 503
- [86] Astier P et al 2003 Physics Letters B 570 19–31 ISSN 0370-2693 URL https://www.sciencedirect.com/science/article/pii/S0370269303010505
- [87] Gariazzo S, Giunti C, Laveder M and Li Y 2018 Physics Letters B 782 13–21 ISSN 0370-2693 URL https://www.sciencedirect.com/science/article/pii/S0370269318303514
- [88] Skrobova N 2020 International Journal of Modern Physics A 35 2044015 URL https://doi.org/10.1142/S0217751X20440157
- [89] Aker M et al (KATRIN Collaboration) 2021 Phys. Rev. Lett. 126(9) 091803 URL https://link.aps.org/doi/10.1103/PhysRevLett.126.091803
- [90] Ajimura S et al 2021 Nuclear Instruments and Methods in Physics Research Section A: Accelerators, Spectrometers, Detectors and Associated Equipment 1014 165742 ISSN 0168-9002 URL https://www.sciencedirect.com/science/article/pii/S0168900221007270