11email: jfeng@psi.edu 22institutetext: Roy M. Huffington Department of Earth Sciences, Southern Methodist University, 6425 Boaz Lane, Dallas, TX 75205, USA
Dielectric properties and stratigraphy of regolith in the lunar South Pole-Aitken basin: Observations from the Lunar Penetrating Radar
Abstract
Aims. We examine data obtained by the Lunar Penetrating Radar (LPR) onboard the Chang’E-4 (CE-4) mission to study the dielectric properties and stratigraphy of lunar regolith on the far side of the Moon.
Methods. The data collected from January 2019 to September 2020 were processed to generate a 540 m radargram. The travel velocity of the radar signal and the permittivity of the regolith were deduced from hyperbolas in the radargram. As CE-4 LPR detected distinct planar reflectors, we evaluated the dielectric loss from the maximum penetration depth based on the radar equation. The derived dielectric properties are compared with the measurements of Apollo samples and Chang’E-2 microwave radiometer observations.
Results. The results suggest that regolith at the landing site has a permittivity of 2.64–3.85 and a loss tangent of 0.0032–0.0044, indicating that the local regolith is composed of a fine-grained, low-loss material that is much more homogeneous than that found at the Chang’E-3 landing site. The total thickness of weathered material is 40 m, with several regolith layers and a buried crater identified in the reconstructed subsurface structure.
Conclusions. These layers clearly record a series of impact events from the adjacent regions. We suggest that the top layer is primarily made up of the ejecta from a large crater 140 km away. In contrast, the material source of other thinner layers comes from nearby smaller craters.
Key Words.:
Moon – Planets and satellites: surfaces – space vehichles: instruments – methods: data analysis1 Introduction
Impact cratering has shaped the surface of the Moon throughout the Moon’s evolutionary history. Due to continuous impact gardening, nearly the entire lunar surface consists of a layer of regolith that completely covers the underlying bedrock (Heiken et al. 1991). Generally, the regolith has an average thickness of 4–5 m in the maria and 10–15 m in the highlands (McKay et al. 1991). Subsurface structures in the regolith record substantial evidence of impact cratering processes and volcanic eruptions. In 2014, Chang’E-3 (CE-3) mission surveyed the lunar subsurface at its landing site in northern Mare Imbrium using the Lunar Penetrating Radar (LPR) — the first ground penetrating radar (GPR) onboard a rover on the Moon (e.g., Su et al. 2014; Feng et al. 2017). In 2019, Chang’E-4 (CE-4) landed on the eastern floor of Von Kármán crater on the far side of the moon. The Yutu-2 rover of CE-4 mission carried an LPR with the same configuration as CE-3 (e.g., Li et al. 2020; Lai et al. 2019; Ding et al. 2020). The LPR is an ultra-wideband carrier-free pulse radar with two channels. The first channel installed on the back of the rover operates at a center frequency of 60 MHz with a bandwidth of 40 MHz, while the second channel installed on the underside of the rover works at a center frequency of 500 MHz with a bandwidth of 500 MHz (Zhang et al. 2014; Li et al. 2020).
Studies have investigated the thickness of lunar regolith in various ways. From the Lunar Orbiter program in the 1960s to the Lunar Reconnaissance Orbiter (LRO) mission throughout the last 12 years, many researchers have used the morphology of small craters and crater counting techniques to constrain the regolith thickness (e.g., Bart et al. 2011; Bart 2014; Oberbeck & Quaide 1967, 1968; Shoemaker et al. 1969; Wilcox et al. 2005). During the Apollo 15, 16, and 17 missions, astronauts took in-situ measurements at the landing sites. The maximum penetration depth of the drills of Apollo 15, 16, and 17 are 2.4 m, 2.25 m, and 2.95 m, respectively (Allton & Waltz 1980). Although the drills did not touch the base rock, they provided an upper boundary constraint on the regolith thickness at the landing sites. Passive seismic experiments estimated the thickness from the shear-wave resonance at the Apollo 11, 12, and 15 sites to be 4.4, 3.7, and 4.4 m, respectively (Nakamura et al. 1975). As microwave and radio wave signals can penetrate the regolith much deeper than optical signals, orbital radar technology has been effectively applied to detect lunar subsurface structures since the 1970s (e.g., Phillips et al. 1973; Spudis et al. 2009; Ono et al. 2010). Earth-based radio telescopes are also used to observe the near side of the Moon and calculate the regolith thickness and associated dielectric properties (e.g., Thompson 1987; Shkuratov & Bondarenko 2001; Fa & Wieczorek 2012; Campbell et al. 2014).
The dielectric properties of the lunar regolith are primarily characterized by permittivity (the real component of the complex permittivity) and dielectric loss. The permittivity is used to quantify the electric polarizability of a dielectric medium. Dielectric loss (parameterized in terms of the loss tangent) quantifies a dielectric material’s inherent dissipation of electromagnetic (EM) energy (e.g., heat). The permittivity determines the propagation velocity of EM waves, while the dielectric loss constrains how deeply the EM waves can penetrate into a medium. The dielectric properties of Apollo samples have been measured in a laboratory setting (e.g., Carrier et al. 1991; Olhoeft & Strangway 1975) and these experiments showed that the relative permittivity of lunar regolith is density-dependent, while the loss tangent is a function of both density and TiO+ FeO content. Recently, Fa & Wieczorek (2012) reanalyzed the Apollo samples data and suggested that the loss tangent has a significant dependence on titanium but not iron. Using LRO Diviner surface temperatures and the microwave radiometer (MRM) on board the Chang’E-2 (CE-2) orbiter, Feng et al. (2020) and the companion Siegler et al. (2020) produced global maps of loss tangent at 3, 7.8, 19.35, and 37 GHz. These maps not only showed a positive correlation between the loss tangent and titanium abundance, but also unveiled differences in highland and mare material as a function of frequency.
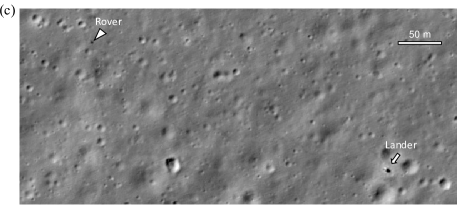
The CE-4 landing site (45.456∘S, 177.588∘E) is located on the eastern floor of the Von Kármán crater, in the South Pole-Aitken (SPA) basin — the largest impact basin on the Moon. The Von Kármán crater formed in the Nectarian epoch with its floor flooded by low-albedo mare basalt in the late Imbrian age (Pasckert et al. 2018). The subsurface structure of the CE-4 landing site preserves a record of the sequence of major impact events of this region. Notably, there are several younger large (¿25 km) impact craters around the Von Kármán that may contribute ejecta materials to the local regolith in the Von Kármán: Leibnitz, Von Kármán L, Alder, and Finsen craters (Wilhelms et al. 1979). The eastern part of the mare surface where CE-4 landed is covered by bright ejecta. Mineralogy and morphology analysis suggest that the Finsen crater is the primary source of this bright ejecta (Huang et al. 2018). Figure 1a shows the mosaic of the LRO Wide Angle Camera (WAC) for the regional vicinity of the Von Kármán crater. Figure 1b gives the WAC mosaic at 415 nm after photometric normalization, showing that bright ejecta from Finsen crater covers a large portion of Von Kármán crater and Leibnitz crater. Figure 1c shows an LRO Narrow Angle Cameras (NAC) image of the landing site captured in September, 2020. The CE-4 lander and Yutu-2 rover can be seen from the NAC image.
2 Data and method
We processed the published LPR second channel data obtained from January 2019 to September 2020. The CE-4 LPR is a common-offset radar and its data processing includes some regular steps widely used in GPR, such as time-zero correction, bandpass filtering, and background removal (Jol 2008) (similar to the data processing of CE-3 LPR). The raw data is shown in Fig. 2a, with all the repeating traces deleted. In contrast to CE-3 LPR data, a continuous subsurface interface is visible in the CE-4 raw data without any processing (between 400–800 samples). A finite impulse response (FIR) filter with a pass range of 250–750 MHz was used for the bandpass filtering. To remove the background, we take the mean of all traces and subtract it from each trace in each section. Strong ”ringing” and reverberation in the shallow near-surface layer are removed through the background removal. A spherical exponential compensation (SEC) gain is then implemented to correct the signal amplitude for loss of energy due to the geometrical spreading effect. After the data processing, the subsurface structure in deep regolith with more details are revealed (Fig. 2b). Multiple interfaces are able to be distinguished, with the deepest one at the two-way travel time larger than 400 ns.
The permittivity of lunar regolith can be computed from velocity of EM waves traveling in the regolith as , where is the light speed in the vacuum. We employ hyperbolic velocity analysis (Jol 2008) in our study because buried targets beneath the surface usually reflect as hyperbola patterns in GPR radargrams. The same method has been successfully used on CE-3 LPR data (Feng et al. 2017; Lai et al. 2016). The equation relating the two-way travel time, , of the reflection from a target and the radar position, , can be expressed in the hyperbolic form:
| (1) |
where and are the horizontal and vertical position of the subsurface target in the radargram (- plane), respectively, and and determine the shape of the hyperbolas (or the angles between their asymptotes). By using a least-squares method to fit the hyperbolic form of the observed data, the travel speed and the target’s position can be computed. To avoid incorrect recognitions, we selected the twelve clearest hyperbolas from the LPR radargram. Figure 3 shows examples of these hyperbolas. These pronounced curves represent strong echoes from subsurface isolated rocks.
The decay of a radar signal through a medium is governed by geometric spreading loss, scattering loss, and dielectric loss. At the maximum penetration depth, the radar signal decays to an undetectable level and is lost in the system noise. Here, we use the radar equation and penetration depth of LPR in the landing site to estimate the average attenuation in the regolith. The basic radar range equation for GPR (e.g., Annan & Davis 1977; Hamran et al. 1995; Skolnik Merrill 1990) is: , where is the received power, is the transmitted power, is the gain of receiving antenna, is the gain of transmitting antenna, and is the wavelength of EM signal in the medium. is the distance between the target and radar, is the attenuation constant in the medium, and is the backscatter radar cross-section (RCS) of the subsurface target or interface. According to Noon et al. (1998) we rewrite the radar equation for CE-4 LPR as:
| (2) |
where is the system gain of LPR, which is 133.3 dB (Zhang et al. 2014); is the minimum detectable signal power; is the transmissivity at the vacuum-regolith interface; and is the maximum penetration depth. We assume the attenuation is dominated by an effective dielectric loss, which includes the scattering effect. The laboratory measurements of Apollo samples at 450 MHz indicate that lunar regolith has a loss tangent, , smaller than 0.03 (Carrier et al. 1991). When the , . In this study, since subsurface layers at the CE-4 landing site are detected (shown in Fig. 2b), we consider as the RCS of a planar reflector. Given that the roughness of subsurface interfaces relative to the LPR center wavelength is greater than 0.5/, these interfaces are considered as rough planar reflectors, and their cross-section can be taken as the area of the ”first Fresnel zone,” with (e.g., Annan & Davis 1977; Cook 1975; Grimm et al. 2006; Noon et al. 1998). Therefore, the average loss tangent of regolith could be calculated from the maximum signal penetration distance by:
| (3) |
Here, can be replaced by maximum travel time in the form of , where is the signal frequency, is the signal wavelength in regolith (, where is the signal wavelength in vacuum). Equation (3) then becomes:
| (4) |
For low-loss mediums, the reflectivity of the substrate can be calculated from , where and are the permittivity of regolith and rocks (we assume = 7 in this study (Carrier et al. 1991)). The transmissivity of the regolith surface is determined by , where is the permittivity of the vacuum. In Figure 4, we compare the radargram of CE-4 LPR with that of CE-3 LPR, both of which are shown in a very small dynamic range (0.5 to 0.5) to display the boundary between signals and noise. It can be seen that the maximum penetration time at the CE-4 landing site is roughly four times longer than that at the CE-3 landing site.
To better interpret the subsurface features in the deposits and convert the travel time to penetration depth, an imaging method was applied to the radargram. The algorithm we used is the Kirchhoff migration. In migration, observed reflections are moved from the apparent locations back to their real spatial locations. A hyperbola in the radargram will be “refocused” to a target’s position. Kirchhoff migration is based on an integral solution of the scalar wave equation. According to Schneider (1978) and Özdemir et al. (2014), in a 2-D situation the far-field approximation of Kirchhoff integral for LPR can be expressed as:
| (5) |
where is the wave field at a subsurface scatter point , is the wave field observed by LPR at surface position () at time two-way travel time , is the refraction angle of wave field in the medium, is the propagation distance of radar signal from the point to the observation position, and is half of the travel speed in the regolith.
3 Result
3.1 Permittivity and dielectric loss
As shown in Fig. 5a, the average EM velocity in the regolith at the landing site ranges from 15.30 to 18.46 cm/ns. The EM velocity at the CE-3 landing site (Feng et al. 2017) is also plotted in the figure for comparison. Accordingly, the depth-averaged permittivity of CE-4 regolith varies from 2.64 to 3.85 (Fig. 5b), consequently falling within the range constrained by Apollo soil samples with a density lower than 2.1 g/cm3 (Olhoeft & Strangway 1975) (Fig. 5c). Because we did not find any clear hyperbolas before 20 ns in the radargram, the shallowest point in Fig. 5b for which we can calculate the dielectric constant is at a depth of 2 m. Generally, the permittivity increases with depth in the upper 4 m but remains within the range between three and four for 4 to 10 m. This implies that the local regolith (at least the first layer) consists of fine-grained soil and is much more homogeneous than the regolith at the CE-3 landing site, where the weathered material contains more rocks and the permittivity reaches six at 3 m depth (Feng et al. 2017; Lai et al. 2016). Carrier et al. (1991) proposed that the permittivity of lunar regolith is density-dependent in the form of , where is bulk density. The depth-averaged bulk density at the CE-4 landing site derived from this equation ranges from 1.49 to 2.07 g/cm3 (Fig. 5c) and is always greater than 1.68 g/cm3 below depths of 3 m. We compare the CE-4 density with the models constrained by the measurements of Apollo core samples (Carrier et al. 1991) in Fig. 5d. The blue and red lines are deduced from the Apollo density profile model, and (Carrier et al. 1991), where is the depth in cm. In the deeper regolith, the result is in good agreement with the Apollo curves. At the shallower depths, the CE-4 density is smaller than the Apollo model prediction. This may be due to the lateral inhomogeneity (e.g., variations in mineralogy or density) or because the regolith at the CE-4 site is more porous than that of the Apollo sites.
To examine the maximum penetration depth of the LPR along the Yutu-2 rover’s traverse, this study uses the average trace amplitude (ATA) plot of the radar echoes. Typically, ATA plots are used in GPR data analysis to determine the signal penetration (attenuation) from the overall decay of the ATA curve (e.g., Butler 2005; Pettinelli et al. 2021). Here, we compressed the radargram after bandpass filtering and background removal into a single trace by taking the mean absolute value over all traces at each time to produce the ATA plot. Figure 6a gives the ATA curve of a 100-m subsets of CE-4 radar cross-section. Given that the radar systems and rover configurations of CE-4 LPR are identical to CE-3 LPR, we compare the ATA of data from both instruments. The CE-4 LPR signal reaches the noise floor after 460 ns. The small peaks on the ATA curve represent the reflections from subsurface interfaces, agreeing with the features shown in Fig. 2b. The last peak at 510 ns refers to the echoes from the deepest planar reflector LPR could detect, so 460–510 ns is considered as the range of maximum travel time of the LPR signal. The loss tangent of local regolith as a function of is shown in Fig. 6b, wherein a penetration curve corresponds to a specific permittivity of local regolith. Penetration curves with permittivities of 2.64 and 3.85 are used as the upper and lower boundaries at the CE-4 landing site, resulting in dielectric loss tangents ranging from 0.0031–0.0044, according to the range.
In contrast to the CE-4 landing site, the attenuation at the CE-3 landing site is much greater, with echoes reaching noise floor at 100–120 ns. According to the calculation from Lai et al. (2016) and Feng et al. (2017), we used 3.85 and 6 as the upper and lower boundaries of CE-3 regolith permittivity in Fig. 6b. This is meant to lead to a loss tangent falling in the range of 0.016–0.032. However, because there is no apparent planar reflector or interface in the regolith at the CE-3 landing site (Feng et al. 2017; Lai et al. 2016), Eqs. (3) and (4) are not adequately applicable and the loss tangent may be inaccurate. The calculated value may just provide an upper boundary of CE-3 , since a regolith or bedrock interface is assumed to be at the maximum penetration depth. Even so, from these estimates we can infer that the lunar regolith is more highly attenuating beneath CE-3 than under CE-4.
Figure 6c compares of CE-4 regolith with that of soil samples ( 2.1 g/cm3) from Apollo 11, 12, 14, 15, 16, and 17 (Carrier et al. 1991). The Apollo data clearly show the density normalized is positively correlated with the TiO2 abundance. Due to a low TiO2 content (less than 2%) (Sato et al. 2017), the density normalized of CE-4 regolith is very close to the low of highland samples brought back by Apollo 14, 15 16, and 17 missions. CE-3 site has a higher TiO2 content of 6.7% (Sato et al. 2017), and its is close to that of mare samples from Apollo 11. Figure 6d combines the results from LPRs and CE-2 microwave radiometer, showing that the at CE-4 site increases with frequency, while at CE-3 site the decreases with frequency. These trends are consistent with the models proposed by Siegler et al. (2020) as for highland and for mare, where is frequency in GHz. Both Figs. 6c and 6d indicate that the dielectric behavior of CE-4 regolith is similar to that of highland materials.
3.2 Stratigraphy
The regolith structure of the CE-4 landing site is unveiled in the radargram after migration demonstrated in Fig. 7a, with Figs. 7b–7e showing that each hyperbola in Fig. 3 is refocused to a rock’s position. The mean travel velocity below 3 m depth (16.3 cm/ns) was applied in the migration. Several planar reflectors appear and split the cross-section into multiple subsurface layers. These reflectors, at the bottom of each layer, are composed of rock fragments and fresh impact ejecta from nearby craters. Due to the continuous comminution and reworking by micrometeorite impact, the upper material in each layer is overturned and pulverized much more frequently, thus taking on a smaller and more uniform grain size. The top layer thickness is 7–16 m with a relatively ”transparent” background, indicating a mature fine grain material with low rock abundance. This is consistent with the smooth surface seen in the picture of the landing site captured by the panoramic camera on board the rover (Li et al. 2020). The permittivity result also shows that this fine-grained layer that lacks scatterers is relatively homogeneous along the rover’s traverse. The other layers in the cross-section are thinner and have higher rock abundances, indicating a shorter period of gardening and evolution. These may be the ejecta delivered by craters smaller than the source of the first layer. The deepest reflector distinguishable is at a depth of 40 m. Its echo is weak, continuous, and flat. This may reflect the boundary between paleoregolith and basaltic base rock.
In the middle of the radargram (between roughly 200–300 m along the traverse), subsurface reflectors or layers are disrupted by a symmetric bowl-shaped structure filled with point reflectors, as illustrated in Fig. 8. It penetrates three subsurface layers with a height of 13–15 m and a horizontal length of 128 m on its top. The echoes beneath this structure become weaker than those on other parts of the horizontal interfaces. Using LRO NAC Digital Terrain Models, Stopar et al. (2017) recently found that craters with diameters less than 400 m have a depth-to-diameter (d/D) ratio ranging from 0.11 to 0.17. As the d/D ratio of this structure is 0.10–0.12, we speculate it is the profile of an impact crater. This finding is also supported by the recent work from Zhang et al. (2021). This crater might form before the new material covered the paleoregolith surface. It is unlikely to be a secondary crater caused by the ejected debris because there is no topographic evidence on the surface of top layer (Fig. 1c) and the crater was filled with fragments before it was buried. As the rock fragments filled in the crater scatter the EM signal in all directions, the echoes from deeper layers attenuate faster and the penetration depth of LPR is shallower under this carter.
The stratigraphic diagram illustrated in Fig. 8 displays six layers from L1 at the top to L6 at the bottom. It is inferred from the local geological context that the soil at the landing site may consist of ejecta coming from the Finsen, Von Kármán L, Von Kármán L’, Alder, and Leibnitz craters. To analyze the contributions of nearby impact events to the regolith at the landing site, we estimated the thickness of distal ejecta from each crater. As reported by McGetchin et al. (1973), the ejecta thickness model is described by , where t is the thickness at radial distance r from the crater center, T is the ejecta thickness at the rim of the crater, R is the radius of the crater, and b is the exponent of the power-law. Pike (1974) pointed out R should be the transient radius and defined T and b as: , .
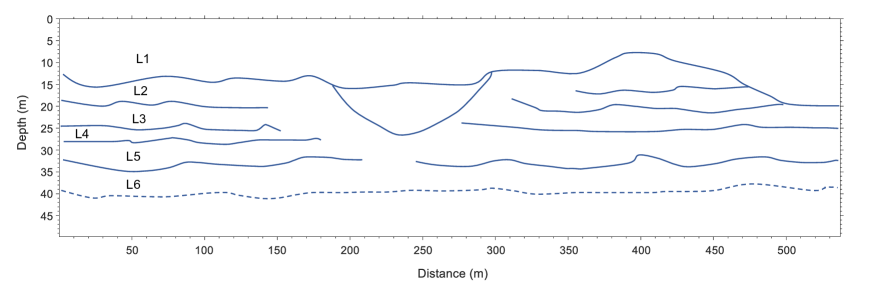
Figure 9 demonstrates the computed ejecta thickness based on this model. The result suggests that 8.1 m thickness of material comes from Finsen. Finsen is an Eratosthenian crater, and therefore younger than the Imbrian Mare in the Von Kármán crater (Fortezzo et al. 2020; Wilhelms et al. 1987). Figure 1b indicates the ejecta blanket of the Finsen crater lies on the top of the local regolith and is not overlapped by ejecta from other craters. Therefore, it is reasonable to propose that the majority of top layer L1 is provided by Finsen crater. After billions of years of quiescent soil development and in-situ reworking, the thickness of Layer L1 grows to the current level. Ejecta from Von Kármán L and Von Kármán L’ crater are 1.6 m and 2.2 m thick, respectively. Since these two craters are of a similar age to Finsen (Fortezzo et al. 2020) and some of their secondary craters are found near the landing region (Huang et al. 2018), we believe they contribute the majority of the regolith of two other layers (L2 and L3). According to the ejecta thickness model, the Nectarian Leibnitz crater and Imbrian Alder crater might also transport massive ejected material ( 146 m and 14 m) at the landing site. However, the latest studies suggest that they are older than the Imbrian mare unit in Von Kármán (e.g., Fortezzo et al. 2020; Lu et al. 2021), indicating that material from Leibnitz and Alder may be buried underneath the mare basalt layer (Huang et al. 2018). For layers L4–L6, we did not find any potential source from outside the Von Kármán crater and, thus, their source might come from small craters close to the landing site inside this crater. These craters were formed after the emplacement of flood basalt lava flows and then buried by L3, L2, and L1; therefore it is hard to tell their exact locations from the optical images.
4 Conclusions
The LPR onboard the Yutu-2 rover of the CE-4 mission provides an effective method to survey the dielectric properties and subsurface structure of lunar regolith on the far side of the Moon. In this study, we estimate the permittivity, evaluate the dielectric loss, and reveal the shallow stratum of regolith at CE-4 landing site using LPR data.
The average permittivity increases with depth in the upper 4 m of regolith and remains constant in the deeper regolith. The depth-averaged bulk density profile inverted from permittivity is generally consistent with models from Apollo core samples. The dielectric loss is small, with the maximum penetration time of the LPR signal reaching 40 m depth. The comparison of our results with measurements of Apollo samples shows that the loss tangent of CE-4 regolith is close to that of highland materials. This is also supported by the combination of LPR and CE-2 MRM observations. Both the permittivity and dielectric loss are much lower at the CE-4 landing site than at the CE-3 landing site. This implies that the CE-4 regolith is made up of highly-porous, low-loss, fine-grained materials, while the CE-3 regolith has higher ilmenite content and is dominated by large rock debris ejected from the nearby Ziwei crater. The stratification structure in the post-processed radargram shows local deposit consisting of multiple layers preserves ejecta from several nearby large craters. We suggest that the bowl-shape structure with a d/D ratio of 0.10–0.12 identified in the cross-section is a buried paleo crater. The crater-ejecta thickness model and 415 nm LRO WAC mosaic indicate that the majority of the top layer is ejecta from Finsen crater. The Von Kármán L crater and Von Kármán L’ crater also contribute the two additional, thinner layers beneath the top layer.
Acknowledgements.
The Chang’E-3 and Chang’E-4 Lunar Penetrating Radar data are downloaded from https://moon.bao.ac.cn/web/enmanager/home. The Lunar Reconnaissance Orbiter (LRO) Wide Angle Camera images and the LRO Narrow Angle Camera image are available at http://wms.lroc.asu.edu/lroc.References
- Allton & Waltz (1980) Allton, J. & Waltz, S. 1980, in Lunar and Planetary Science Conference Proceedings, Vol. 11, 1463–1477
- Annan & Davis (1977) Annan, A. & Davis, J. 1977, Geological Survey of Canada, 77, 117
- Bart (2014) Bart, G. D. 2014, Icarus, 235, 130
- Bart et al. (2011) Bart, G. D., Nickerson, R. D., Lawder, M. T., & Melosh, H. J. 2011, Icarus, 215, 485
- Butler (2005) Butler, D. K. 2005, Near-surface geophysics (Society of Exploration Geophysicists)
- Campbell et al. (2014) Campbell, B. A., Ray Hawke, B., Morgan, G. A., et al. 2014, Journal of Geophysical Research: Planets, 119, 313
- Carrier et al. (1991) Carrier, W. D., Olhoeft, G. R., & Mendell, W. 1991, Physical properties of the lunar surface, ed. G. Heiken, D. Vaniman, & B. French (Cambridge, UK: Cambridge University Press), 475–594
- Cook (1975) Cook, J. C. 1975, Geophysics, 40, 865
- Ding et al. (2020) Ding, C., Xiao, Z., Wu, B., et al. 2020, Geophysical Research Letters, 47, e2020GL087361
- Fa & Wieczorek (2012) Fa, W. & Wieczorek, M. A. 2012, Icarus, 218, 771
- Feng et al. (2020) Feng, J., Siegler, M. A., & Hayne, P. O. 2020, Journal of Geophysical Research: Planets, 125, e2019JE006130
- Feng et al. (2017) Feng, J., Su, Y., Ding, C., et al. 2017, Icarus, 284, 424
- Fortezzo et al. (2020) Fortezzo, C., Spudis, P., & Harrel, S. 2020, in Lunar and Planetary Science Conference, 2760
- Grimm et al. (2006) Grimm, R. E., Heggy, E., Clifford, S., et al. 2006, Journal of Geophysical Research: Planets, 111
- Hamran et al. (1995) Hamran, S.-E., Gjessing, D., Hjelmstad, J., & Aarholt, E. 1995, Journal of Applied Geophysics, 33, 7
- Heiken et al. (1991) Heiken, G., Vaniman, D., & French, B. 1991, Lunar sourcebook: A user’s guide to the Moon (Cambridge, UK: Cambridge University Press)
- Huang et al. (2018) Huang, J., Xiao, Z., Flahaut, J., et al. 2018, Journal of Geophysical Research: Planets, 123, 1684
- Jol (2008) Jol, H. M. 2008, Ground penetrating radar theory and applications (Elsevier)
- Lai et al. (2016) Lai, J., Xu, Y., Zhang, X., & Tang, Z. 2016, Planetary and Space Science, 120, 96
- Lai et al. (2019) Lai, J., Xu, Y., Zhang, X., et al. 2019, Geophysical Research Letters, 46, 12783
- Li et al. (2020) Li, C., Su, Y., Pettinelli, E., et al. 2020, Science advances, 6, eaay6898
- Lu et al. (2021) Lu, Y., Wu, Y., Michael, G. G., et al. 2021, Icarus, 354, 114086
- McGetchin et al. (1973) McGetchin, T. R., Settle, M., & Head, J. 1973, Earth and Planetary Science Letters, 20, 226
- McKay et al. (1991) McKay, D. S., Heiken, G., Basu, A., et al. 1991, The lunar regolith, Vol. 567, 285–356
- Melosh (2011) Melosh, H. J. 2011, Planetary surface processes, Vol. 13 (Cambridge University Press)
- Nakamura et al. (1975) Nakamura, Y., Dorman, J., Duennebier, F., Lammlein, D., & Latham, G. 1975, The Moon, 13, 57
- Noon et al. (1998) Noon, D. A., Stickley, G. F., & Longstaff, D. 1998, Journal of Applied Geophysics, 40, 127
- Oberbeck & Quaide (1967) Oberbeck, V. R. & Quaide, W. L. 1967, Journal of Geophysical Research, 72, 4697
- Oberbeck & Quaide (1968) Oberbeck, V. R. & Quaide, W. L. 1968, Icarus, 9, 446
- Olhoeft & Strangway (1975) Olhoeft, G. & Strangway, D. 1975, Earth and Planetary Science Letters, 24, 394
- Ono et al. (2010) Ono, T., Kumamoto, A., Kasahara, Y., et al. 2010, Space science reviews, 154, 145
- Özdemir et al. (2014) Özdemir, C., Demirci, Ş., Yiğit, E., & Yilmaz, B. 2014, Mathematical Problems in Engineering, 2014
- Pasckert et al. (2018) Pasckert, J. H., Hiesinger, H., & van der Bogert, C. H. 2018, Icarus, 299, 538
- Pettinelli et al. (2021) Pettinelli, E., Lauro, S. E., Mattei, E., Cosciotti, B., & Soldovieri, F. 2021, Nature Astronomy, 1
- Phillips et al. (1973) Phillips, R., Adams, G., Brown Jr, W., et al. 1973, in Lunar and Planetary Science Conference Proceedings, Vol. 4, 2821
- Pike (1974) Pike, R. J. 1974, Earth and Planetary Science Letters, 23, 265
- Sato et al. (2017) Sato, H., Robinson, M. S., Lawrence, S. J., et al. 2017, Icarus, 296, 216
- Schneider (1978) Schneider, W. A. 1978, Geophysics, 43, 49
- Shkuratov & Bondarenko (2001) Shkuratov, Y. G. & Bondarenko, N. V. 2001, Icarus, 149, 329
- Shoemaker et al. (1969) Shoemaker, E., Batson, R., Holt, H., et al. 1969, Journal of Geophysical Research, 74, 6081
- Siegler et al. (2020) Siegler, M. A., Feng, J., Lucey, P. G., et al. 2020, Journal of Geophysical Research: Planets, 125, e2020JE006405
- Skolnik Merrill (1990) Skolnik Merrill, I. 1990, New York st. louis: MCGRAW-Hill Publishing Company
- Spudis et al. (2009) Spudis, P., Nozette, S., Bussey, B., et al. 2009, Current Science, 533
- Stopar et al. (2017) Stopar, J. D., Robinson, M. S., Barnouin, O. S., et al. 2017, Icarus, 298, 34
- Su et al. (2014) Su, Y., Fang, G.-Y., Feng, J.-Q., et al. 2014, Research in Astronomy and Astrophysics, 14, 1623
- Thompson (1987) Thompson, T. 1987, Earth, Moon, and Planets, 37, 59
- Wilcox et al. (2005) Wilcox, B., Robinson, M., Thomas, P., & Hawke, B. 2005, Meteoritics & Planetary Science, 40, 695
- Wilhelms et al. (1979) Wilhelms, D. E., Howard, K. A., & Wilshire, H. G. 1979, Geologic map of the south side of the Moon (Department of the Interior, US Geological Survey)
- Wilhelms et al. (1987) Wilhelms, D. E., John, F., & Trask, N. J. 1987, The geologic history of the Moon, Report 2330-7102
- Zhang et al. (2014) Zhang, H.-B., Zheng, L., Su, Y., et al. 2014, Research in Astronomy and Astrophysics, 14, 1633
- Zhang et al. (2021) Zhang, L., Xu, Y., Bugiolacchi, R., et al. 2021, Earth and Planetary Science Letters, 564, 116912