28 GHz Phased Array-Based Self-Interference Measurements for Millimeter Wave Full-Duplex
Abstract
We present measurements of the 28 GHz self-interference channel for full-duplex sectorized multi-panel millimeter wave (mmWave) systems, such as integrated access and backhaul. We measure the isolation between the input of a transmitting phased array panel and the output of a co-located receiving phased array panel, each of which is electronically steered across a number of directions in azimuth and elevation. In total, nearly 6.5 million measurements were taken in an anechoic chamber to densely inspect the directional nature of the coupling between 256-element phased arrays. We observe that highly directional mmWave beams do not necessarily offer widespread high isolation between transmitting and receiving arrays. Rather, our measurements indicate that steering the transmitter or receiver away from the other tends to offer higher isolation but even slight steering changes can lead to drastic variations in isolation. These measurements can be useful references when developing mmWave full-duplex solutions and can motivate a variety of future topics including beam/user selection and beamforming codebook design.
I Introduction
Millimeter wave (mmWave) communication systems equipped with full-duplex capability could offer networks with improvements at the physical layer and in medium access [1]. In particular, full-duplex integrated access and backhaul (IAB) could simultaneously deliver access and maintain backhaul in-band, making better use of mmWave spectrum while reducing latency between the network core and its edge [2]. For example, a pole-mounted IAB node with full-duplex capability could serve a user on the ground while simultaneously maintaining wireless backhaul with a fiber-connected node, all using the same mmWave spectrum.
To enable such a capability, researchers have proposed a number of beamforming-based solutions that leverage dense mmWave antenna arrays to strategically steer transmission and reception to mitigate self-interference [3, 4, 5, 6, 7, 8]. The majority of existing proposed solutions, however, have been evaluated using highly idealized mmWave self-interference channel models that have not yet been verified with measurements. As a result, the practical efficacy of these solutions remains unknown.
An early attempt to characterize the self-interference channel at mmWave was in [9], where a beam-sweeping approach was taken to measure the received self-interference power for a combination of transmit and receive beams. A relatively low number of beams were swept using 28 GHz 8 8 uniform planar arrays (UPAs) in sample indoor and outdoor environments. While not particularly extensive in characterizing the spatial characteristics nor the distribution of isolation levels, this work provided a valuable first look at the expected isolation levels seen by a multi-panel mmWave full-duplex system. In [10], a proof-of-concept 60 GHz, short-range, full-duplex link was established using phased array transceivers, which found that there was a clear performance improvement when the angle difference between the two transceivers was varied. The work of [11] presents indoor and outdoor self-interference channel measurements at approximately 28 GHz using a pair of horn antennas for transmission and reception as well as dipole antennas. Little was shown on the impacts and variability due to transmit and receive steering direction, though it was noted that some steering combinations were starkly more favorable than others. In [12] and [13], the authors conducted indoor measurements of the 60 GHz self-interference channel with a rotating channel sounder using fixed horn antennas, which showed large variations in self-interference power across azimuth and elevation due to reflective objects such as furniture.
The data and insights on the mmWave self-interference channel in [9, 10, 11, 12, 13, 14] are certainly useful, but do not provide much in terms of proposing or verifying multiple-input multiple-output (MIMO) channel models that mmWave full-duplex research relies so heavily on. To evaluate beamforming-based mmWave full-duplex solutions thus far, researchers have primarily used relatively idealized models, particularly the spherical-wave MIMO model of [15]. The extremely idealized geometric model in [15] is sensitive to small modeling errors and does not capture the isolation and effects of practical systems such as enclosures, mounting infrastructure, and non-isotropic antenna elements. To account for environmental reflections, which were observed in [9], it is common for researchers to combine a ray-based model with the spherical-wave model in a Rician fashion [16, 5]. These channel models have been widely used by mmWave full-duplex literature but have yet to be verified with measurement.
In this work, we conduct the first known dense, phased array-based measurements of the 28 GHz self-interference channel. We use 256-element UPAs to take nearly 6.5 million measurements of the self-interference channel using finely steered, highly directional beams. In an anechoic chamber, we measure the isolation between each pair of transmit and receive beams to better understand the spatial profile of the direct coupling between a transmitting and receiving arrays of a full-duplex transceiver. Our measurements show that:
-
•
generally, more isolation is seen when the transmitter or receiver steer away from the other
-
•
small changes in transmit and receive steering directions can lead to significant changes in isolation.
These measurements act as a first step toward practical characterization of mmWave self-interference and shed light on the levels of isolation one can realistically expect between transmit and receive beams of a mmWave full-duplex transceiver. Our future work will involve modeling mmWave self-interference.
II Measurement Setup & Methodology

Our measurement setup, illustrated as a functional block diagram in Figure 1, consists of two identical Anokiwave AWA-0134 28 GHz 256-Element Active Antenna Innovator’s Kit phased array modules [17]: one for transmission and one for reception. Each of these modules consists of a half-wavelength UPA designed for the 26.5 GHz to 29.5 GHz frequency band. As shown in Figure 2, the array modules are mounted on two faces of a triangular metal platform where each side is cm in length and each face is separated by an angle of ; this is a realistic sectorized deployment configuration. The size of each array module is cm by cm by cm, and the antenna elements are oriented in the center of the array module face. The centers of the transmit UPA and receive UPA are separated by approximately cm.
The transmit and receive arrays are each connected to a National Instruments’ Universal Software Radio Platform (USRP) 2954 software-defined radio (SDR). Up to 120 dB of mmWave isolation, as defined in Figure 1, can be measured by this system to within 0.25 dB of accuracy. There are many design decisions behind achieving such a high level of isolation measurement such as using physically separate transmit and receive baseband SDRs, driving both SDRs with a single Rubidium oscillator, and employing novel multi-stage averaging algorithms to reduce noise.
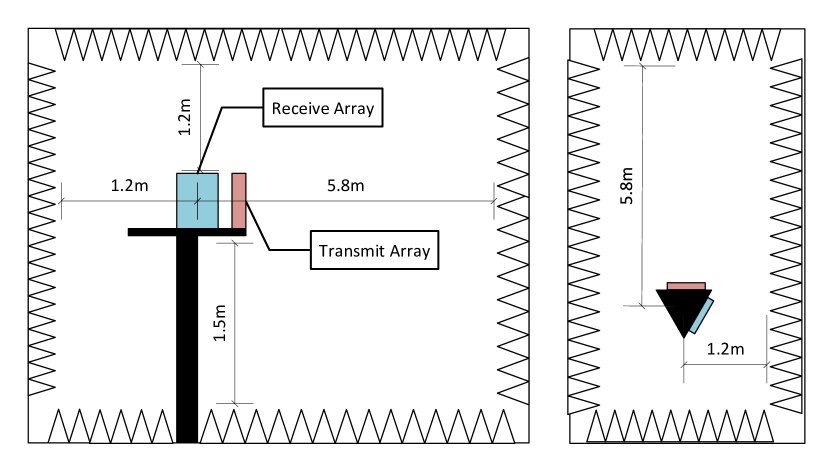
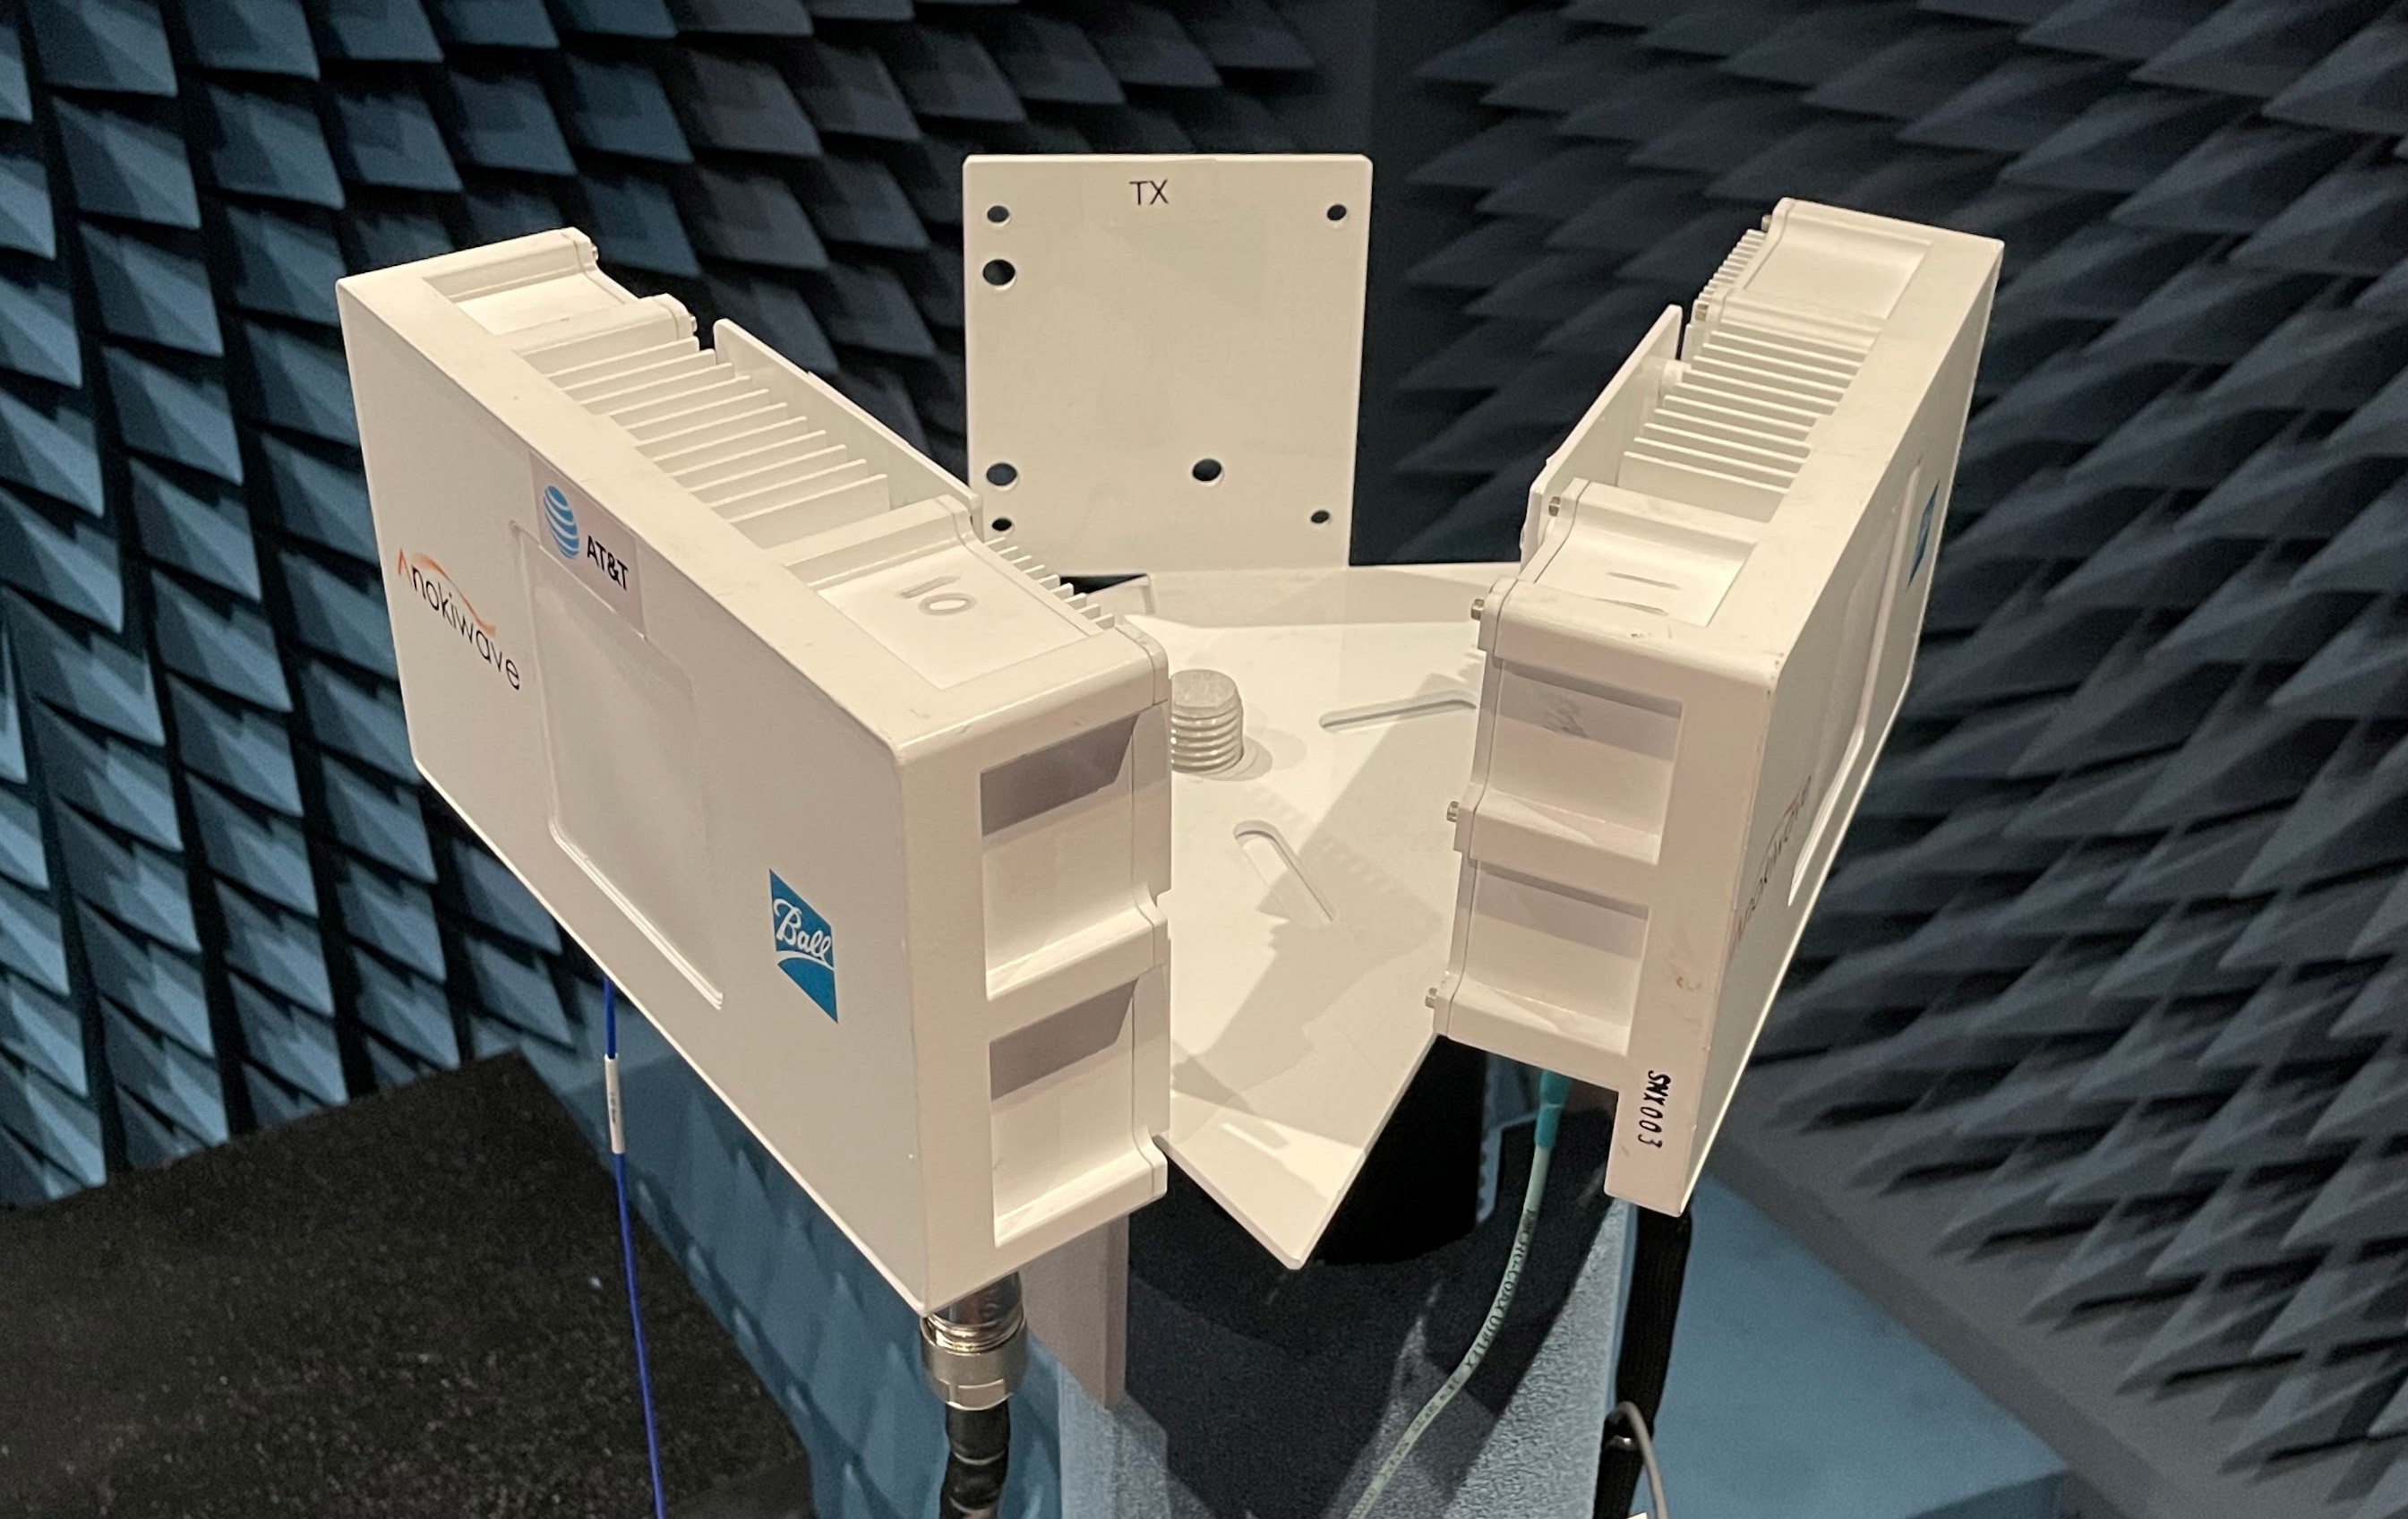
The self-interference measurement platform was placed inside an anechoic chamber free from any significant reflectors; future work will investigate the impact of reflectors. The dimensions of the anechoic chamber and the placement of the array inside the chamber are shown using side- and top-views in Figure 2. A photo of the phased array measurement platform inside the chamber is shown in Figure 3. Once injected into the phased array, the transmitted signals propagate over the air to the receive array. Both the transmit and receive arrays are configured to steer in a desired direction via digitally controlled beamforming weights.
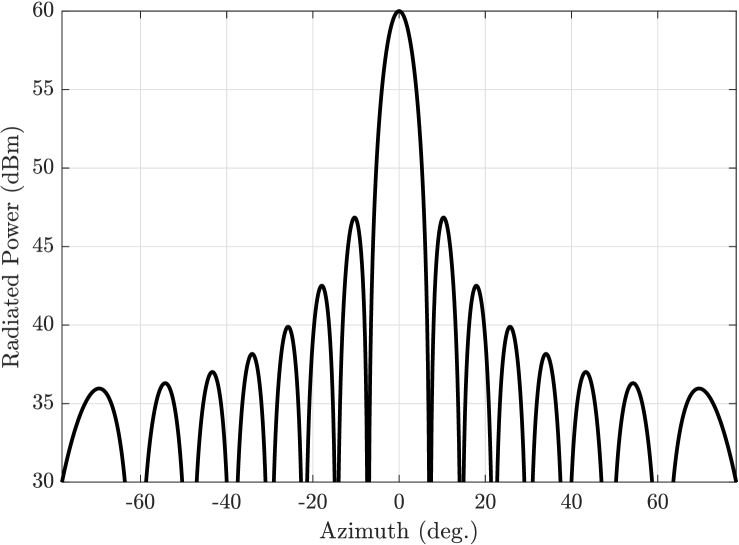
For context, the approximate pattern of a beam steered broadside by our transmit array is shown in Figure 4, which delivers an effective isotropic radiated power (EIRP) of approximately dBm and has a dB beamwidth of approximately in both azimuth and elevation. Given that we are interested in measuring isolation between the transmit array and receive array for a variety of transmit and receive beams, it is especially important to take note of what we reference our received signal power to. Our isolation measurements are captured at the output of the receive array and referenced to the power delivered to the input of the transmit array, which is approximately dBm, meaning a measured isolation value of dB maps to received power of dBm. As a result, our isolation measurements inherently include gain/losses incurred in between, most notably: (i) spatial combining between the transmit beam, self-interference channel, and receive beam; (ii) amplification in the transmit array module; (iii) amplification in the receive array module; and (iv) various artifacts within the transmit and receive array modules. While the spatial combining is the primary interest, we have decided not to estimate and abstract out the gains/losses of the other contributors to preserve the accuracy of our measurements. As such, it is also important to note that the noise power out of our receive array is approximately dBm over 100 MHz ( dB below the power delivered into our transmit array).
III Summary of Measurements
To describe the arrays’ steering directions in 3-D, we use an azimuth-elevation convention. A vector in the direction from the center of an array is described by azimuth being the angle between the positive axis and the vector’s orthogonal projection onto the - plane and elevation being the angle from the - plane to the vector itself. Each phased array can be (independently) steered toward a desired direction via beamforming weights .
A set of transmit directions and a set of receive directions described as
| (1) |
are specified prior to executing measurement. The isolation between each combination of transmit-receive beam pairs is measured to form an matrix , where the isolation between the -th transmit beam and the -th receive beam is
| (2) |
where is the over-the-air self-interference channel matrix between our arrays.
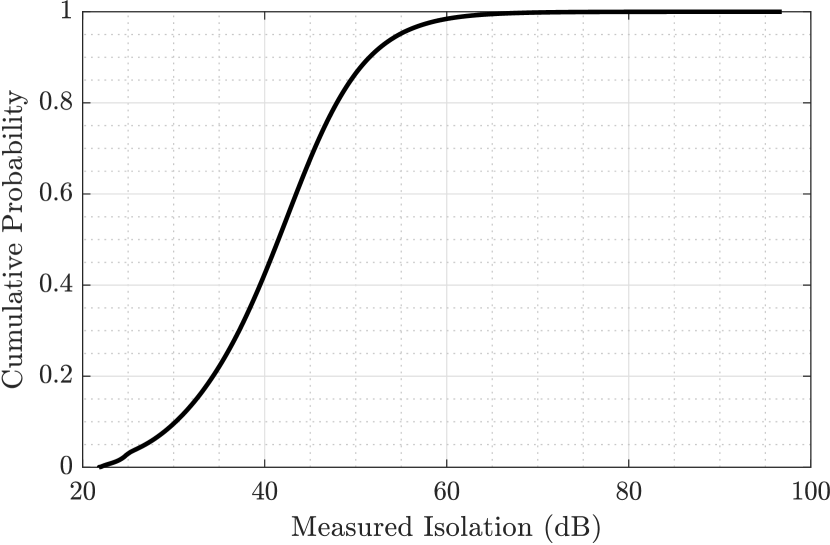
The results in this work are based on measurements whose transmit beams and receive beams are each distributed uniformly in azimuth from to with spacing and in elevation from to with spacing. This amounts to a total of beams for transmission and for reception. Measuring all transmit-receive pairs yields a matrix of isolation values. The maximum and minimum isolation seen across transmit-receive beam pairs is dB and dB, respectively. The mean and median isolation seen across transmit-receive beam pairs is dB and dB, respectively, indicating the distribution of measured isolation values is likely right-skewed, pulling our mean higher than the median. The cumulative density function (CDF) of measurements, shown in Figure 5, confirms this, which is even more apparent when isolation (the axis) is in linear units. We see that high-isolation measurements (e.g., dB or more) are far less frequent than low-isolation ones.
IV Spatial Characteristics
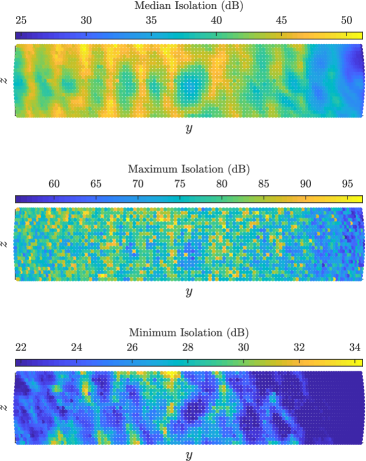
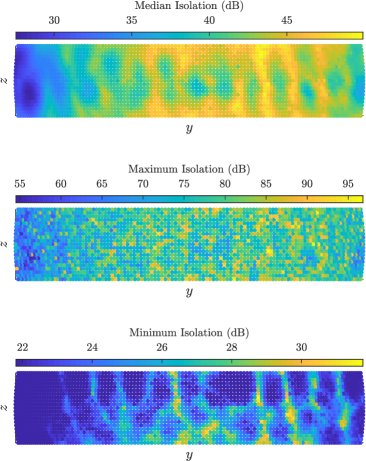
We now hone in on narrower perspectives to better visualize and interpret our measurements. First, let us begin by considering Figure 6a, where each dot shows the median, maximum, and minimum isolation observed by each transmit beam across all receive beams; each dot is over a column in . Figure 6b similarly shows these statistics observed when receiving a particular direction; each dot is over a row in . Referencing Figure 6b, we see that the median isolation per receive beam ranges from around dB to around dB. The maximum isolation observed per receive beam is at least around dB and at most over dB, while the minimum isolation is at least around dB and at most around dB. We similarly observe these statistics for each transmit beam in Figure 6a, which tell a similar story visually and numerically as the receive side.
Takeaways.
We notice some symmetry between Figure 6a and Figure 6b, especially in median isolation, which validates some degree of channel symmetry/reciprocity. Also, we see much more variation across than , suggesting that the azimuth of the steering direction plays a greater role than elevation, which one may expect since our transmitter and receiver are separated in azimuth but not in elevation.
We see that, even when steering our transmitter toward the receiver, there exists some receive beam(s) that offer dB or more of isolation. Likewise, when steering our receiver toward the transmitter, there exists some transmit beam(s) that offer around dB or more of isolation. This suggests that, while transmitting toward the receiver and receiving toward the transmitter generally results in lower isolation, there exist receive beams and transmit beams that can offer high isolation. In a similar fashion, the minimum isolation exhibits that there also exist choices that can lead to low isolation.
While it may seem obvious that transmitting toward the receiver and receiving toward the transmitter would couple the most self-interference, it was not clear that this would be the case since the transmit and receive arrays exist in the near-field of one another. The far-field distance of our arrays is approximately meters based on the rule-of-thumb ; recall, our arrays are separated by approximately cm. Operating in a near-field regime, the highly directional beams created by our UPAs are not necessarily “highly directional” from the perspective of one another [1].
Takeaways.
From this, we can conclude that there are not transmit beams nor receive beams that universally offer high or low isolation—though there exist those that tend to. Rather, the amount of isolation observed depends heavily on one’s choice of transmit beam and receive beam.
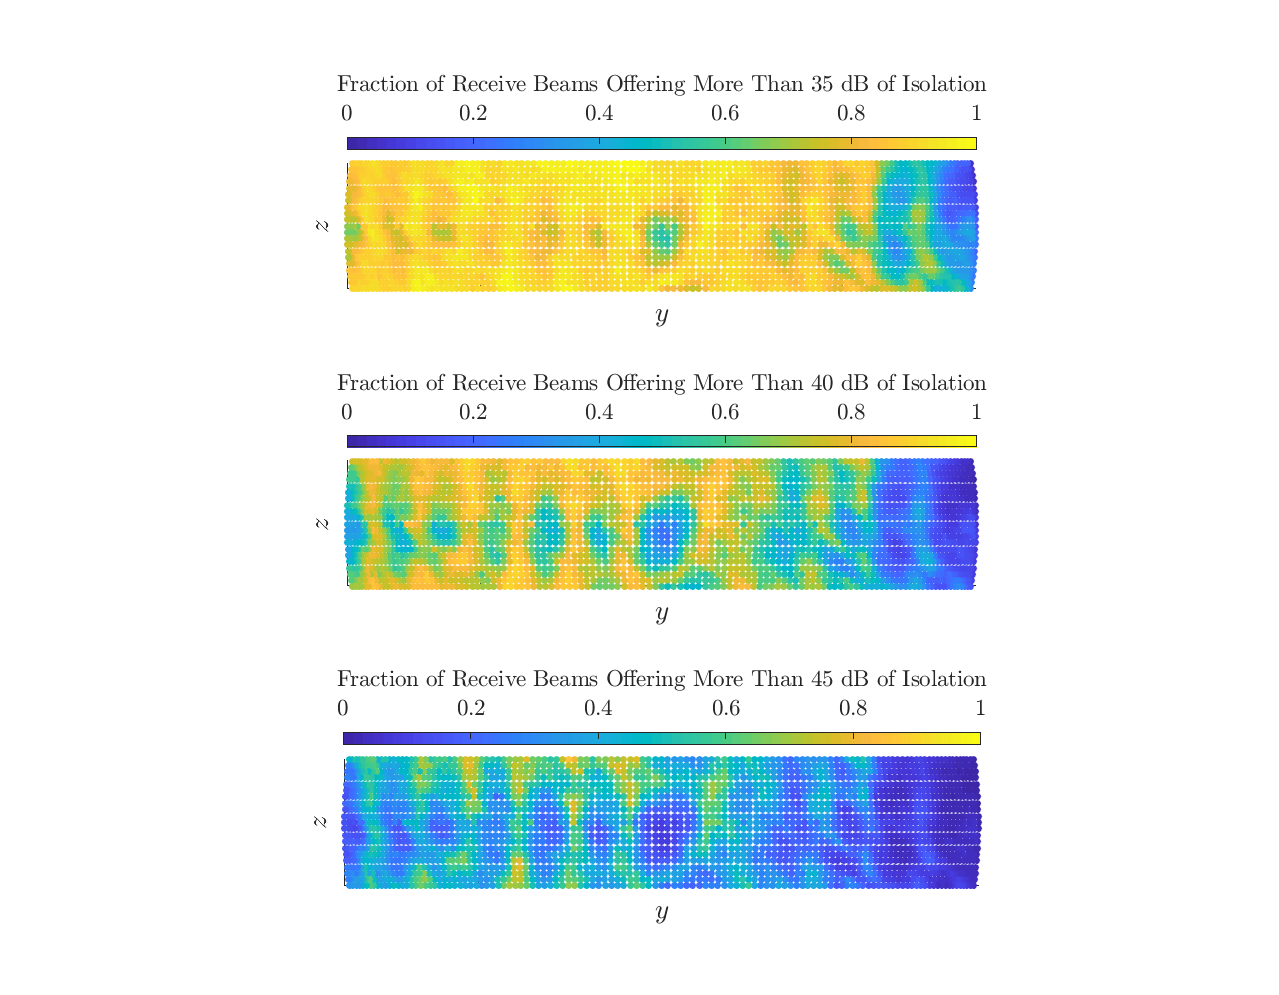
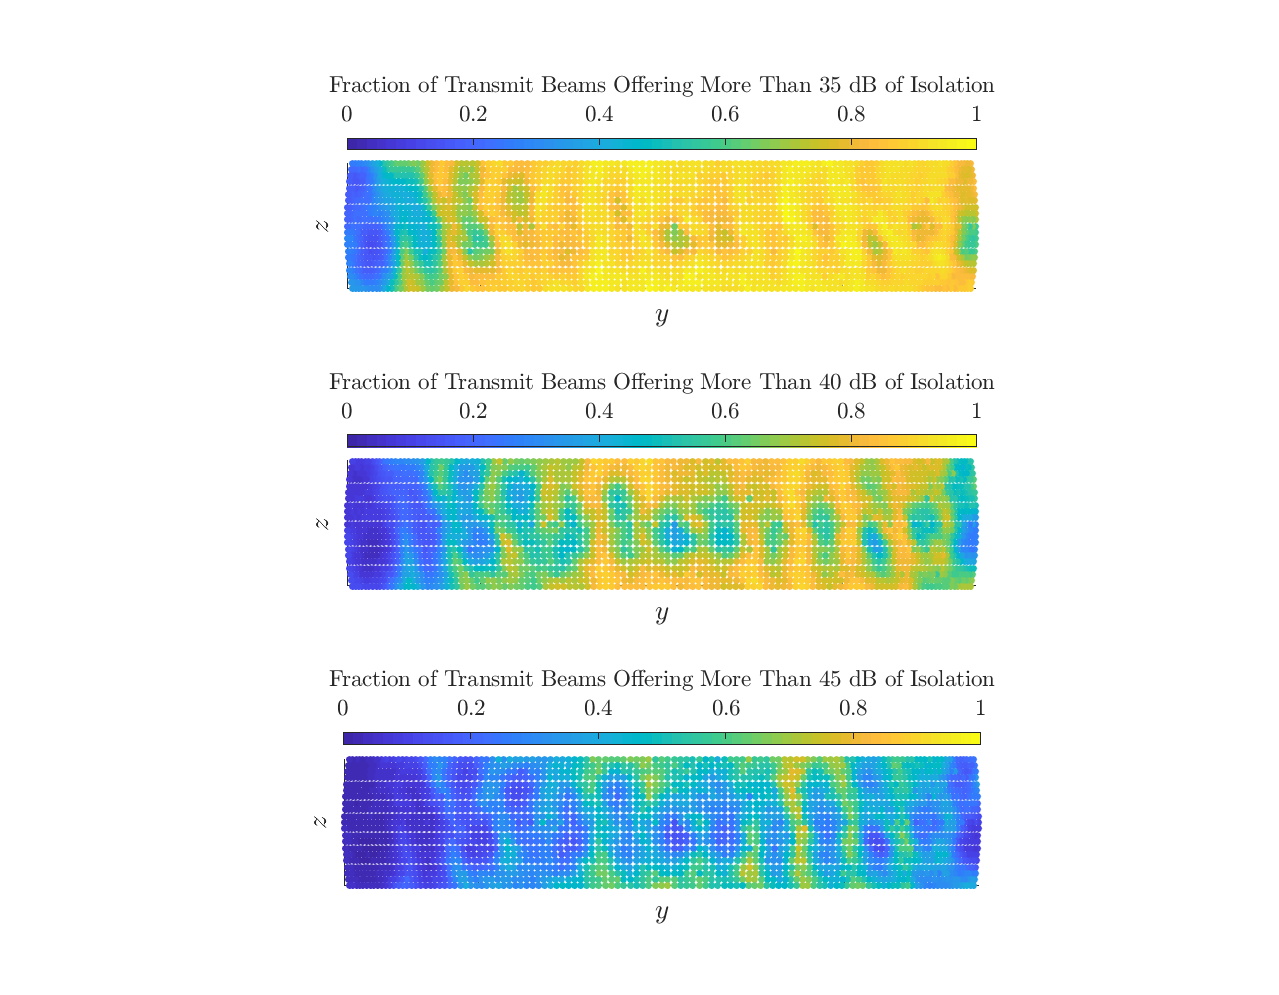
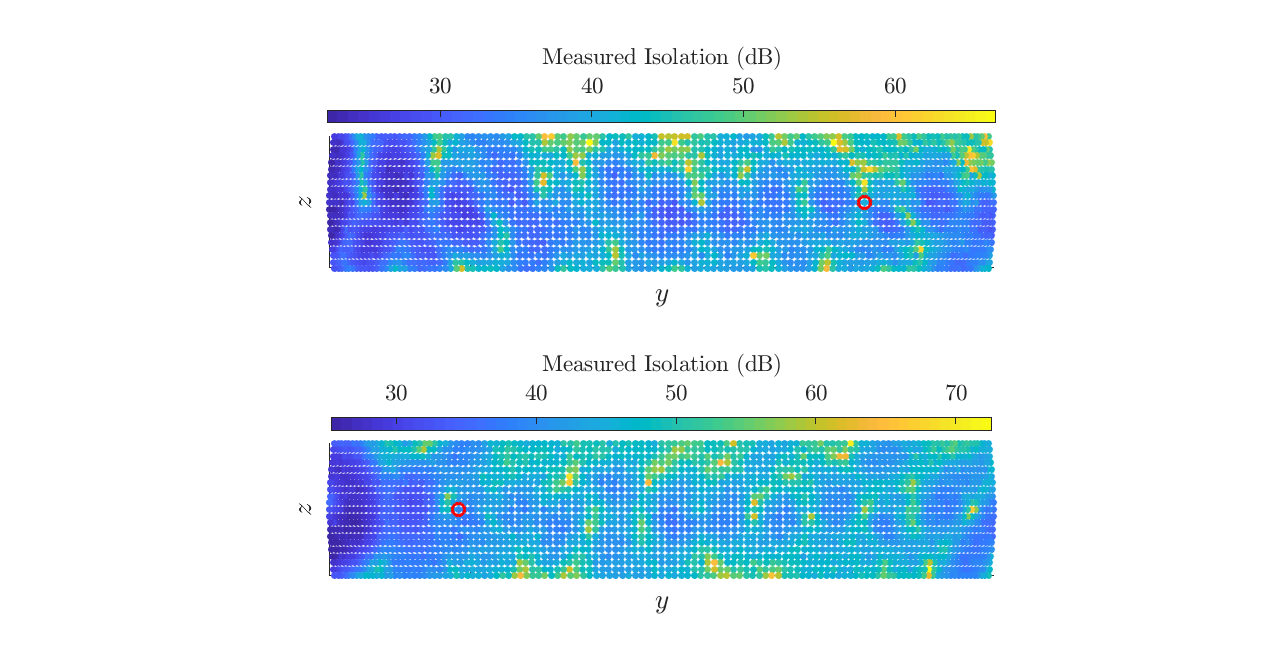
In Figure 7a, for each transmit beam, we look at the fraction of receive beams that offer at least , , and dB of isolation. Similarly, in Figure 7b, for each receive beam, we look at the fraction of transmit beams that offer these same levels of isolation. These two figures begin to further explain where the bulk of low isolation beam pairs come from: most of their density (visible in the CDF in Figure 5) lay in transmit beams steering toward the receive array and in receive beams steering toward the transmit array. These directions correspond to the transmit and receive directions that couple high amounts of self-interference almost regardless of the receive and transmit direction, respectively. For example, when transmitting to the upper right, only around –% of receive beams offer more than 35 dB of isolation, as evidenced by the top plot in Figure 7a.
Less dramatically, a large portion of the moderately high to high isolation beam pairs can be seen as coming from select transmit and receive directions. In fact, these directions seem to be fairly agnostic to elevation, existing as vertical strips of bright dots. These vertical strips of high isolation separated by strips of low isolation are speculated to be caused by the interaction of side lobes (which are not well defined in the near-field). The transmit and receive beams offering high isolation across large fractions of receive beams and transmit beams, respectively, correspond to approximate transmit and receive nulls at the channel input and output (i.e., approximate left and right null spaces of ), respectively, that offer high isolation. Recall, from Figure 6, we did not see any transmit or receive beams that universally provided high isolation.
From both figures, we see that transmitting and receiving in and around broadside (azimuth and elevation of zero) leads to low isolation across many receive beams and transmit beams, respectively. These results are not necessarily expected nor easily explained; it can perhaps be attributed to the presence of side lobes and their enhancement in this near-field setting.
Honing in further, we now look at the isolation achieved at each transmit beam for a particular receive beam and at each receive beam for a particular transmit beam, as shown in Figure 8a and Figure 8b; this can be thought of as considering a single row or column of the matrix , respectively. Let us first consider the isolation observed across receive beams for particular transmit beams. In Figure 8b, we have selected two transmit directions: toward the receive array and away from the receive array. For each, have shown the isolation measured between the transmit beam and each receive beam. As expected, when the transmit beam changes, the isolation profile across receive beams also changes.
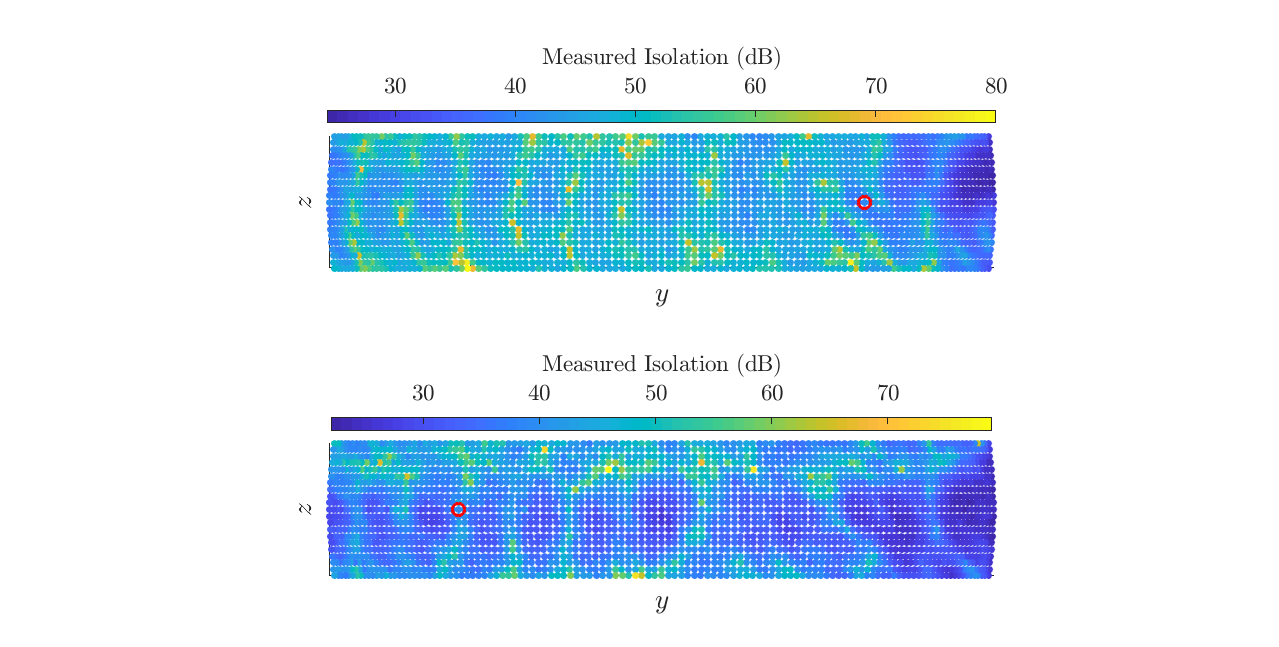
When transmitting to the left (away from the receiver; bottom plot), we see that receive beams offer moderately high or high isolation more often. Receiving toward the transmitter leads to low isolation, unavoidably. When transmitting toward the receiver (top plot), receive beams offering moderately high to high isolation are less widespread. They exist, however, particularly in high and low elevation. Also, we see a small vertical strip of higher isolation receive beams that steer leftward, toward the transmit array. This reinforces that isolation may tend to be lower when transmitting toward the receiver and receiving toward the transmitter but is not universally the case. Looking at both plots in Figure 8b, the receive beam that offers maximum isolation varies with transmit beam, which further backs our claim that there are not receive beams that universally offer high isolation.
Similarly, in Figure 8a, we have selected two receive directions and, for each, have shown the isolation measured between the receive beam and each transmit beam. Analogous conclusions can be drawn as with Figure 8b, though there are useful comments to make. Again, varying with each receive beam, there exists an isolation-maximizing transmit beam. Notice that even when the receive beam is steered away from the transmit array (to the right; top plot), transmitting toward the receive array (to the right) still inflicts substantial self-interference.
We observe a certain degree of symmetry in Figure 8. Transmitting toward the receiver (top Figure 8b) is similar to receiving toward the transmitter (bottom Figure 8a). Transmitting away from the receiver (bottom Figure 8b) is similar to receiving away from the transmitter (top Figure 8a). This further verifies a sense of symmetry of our self-interference channel .
Takeaways.
We can clearly see that simply steering the transmitter away from the receiver or steering the receiver away from the transmitter does not offer widespread isolation. Moreover, the high-isolation receive directions are often quite narrow in the sense that small changes in receive direction can lead to significant changes in isolation. For instance, when transmitting toward the right, the isolation across receive beams varies by about 45 dB, and we see that shifting a receive beam by only – degrees in azimuth and/or elevation can lead to changes of dB in isolation or more. We note that this sensitivity to steering direction is much more apparent with high-isolation beams than low-isolation ones.
V Conclusion
Inspection of the 28 GHz self-interference channel between transmit and receive arrays has shown that highly directional mmWave beams can offer high levels of isolation but are not necessarily likely to. From 6.5 million measurements, we observe that transmitting toward the receive array or receiving toward the transmit array tends to couple more self-interference. Likewise, we see that transmitting away from the receive array or receiving away from the transmit array tends to couple less self-interference, but no transmit or receive beams are guaranteed to offer widespread high isolation. We simultaneously observe that small changes in steering direction can lead to significant variability in the degree of self-interference coupled. Valuable future work includes self-interference channel modeling, investigating the impact of environmental reflections, and the design of beamforming codebooks for mmWave full-duplex.
Acknowledgments
I. P. Roberts is supported by the National Science Foundation Graduate Research Fellowship Program under Grant No. DGE-1610403. Any opinions, findings, and conclusions or recommendations expressed in this material are those of the author(s) and do not necessarily reflect the views of the National Science Foundation.
References
- [1] I. P. Roberts, J. G. Andrews, H. B. Jain, and S. Vishwanath, “Millimeter-wave full duplex radios: New challenges and techniques,” IEEE Wireless Commun., pp. 36–43, Feb. 2021.
- [2] Qualcomm, “3GPP RP-193251: New WID on IAB enhancements,” Dec. 2019.
- [3] X. Liu et al., “Beamforming based full-duplex for millimeter-wave communication,” Sensors, vol. 16, no. 7, p. 1130, Jul. 2016.
- [4] Z. Xiao, P. Xia, and X. Xia, “Full-duplex millimeter-wave communication,” IEEE Wireless Commun., vol. 24, no. 6, pp. 136–143, Dec. 2017.
- [5] K. Satyanarayana et al., “Hybrid beamforming design for full-duplex millimeter wave communication,” IEEE Trans. Veh. Technol., vol. 68, no. 2, pp. 1394–1404, Feb. 2019.
- [6] I. P. Roberts, J. G. Andrews, and S. Vishwanath, “Hybrid beamforming for millimeter wave full-duplex under limited receive dynamic range,” IEEE Trans. Wireless Commun., vol. 20, no. 12, pp. 7758–7772, Dec. 2021.
- [7] R. López-Valcarce and N. González-Prelcic, “Beamformer design for full-duplex amplify-and-forward millimeter wave relays,” in Proc. ISWCS, Aug. 2019, pp. 86–90.
- [8] Y. Cai et al., “Robust joint hybrid transceiver design for millimeter wave full-duplex MIMO relay systems,” IEEE Trans. Wireless Commun., vol. 18, no. 2, pp. 1199–1215, Feb. 2019.
- [9] S. Rajagopal, R. Taori, and S. Abu-Surra, “Self-interference mitigation for in-band mmWave wireless backhaul,” in Proc. IEEE CCNC, Jan. 2014, pp. 551–556.
- [10] Y. Kohda et al., “Single-channel full-duplex mmWave link using phased-array for Ethernet,” in Proc. IEEE CCNC, Jan. 2015, pp. 400–405.
- [11] B. Lee et al., “Reflected self-interference channel measurement for mmWave beamformed full-duplex system,” in Proc. IEEE GLOBECOM Wkshp., Dec. 2015, pp. 1–6.
- [12] H. Yang et al., “Interference measurement and analysis of full-duplex wireless system in 60 GHz band,” in Proc. IEEE APCCAS, Oct. 2016, pp. 273–276.
- [13] Y. He, X. Yin, and H. Chen, “Spatiotemporal characterization of self-interference channels for 60-GHz full-duplex communication,” IEEE Antennas Wireless Propag. Lett., vol. 16, pp. 2220–2223, May 2017.
- [14] K. Haneda, J. Järveläinen, A. Karttunen, and J. Putkonen, “Self-interference channel measurements for in-band full-duplex street-level backhaul relays at 70 GHz,” in Proc. IEEE PIMRC, Sep. 2018, pp. 199–204.
- [15] J.-S. Jiang and M. A. Ingram, “Spherical-wave model for short-range MIMO,” IEEE Trans. Commun., vol. 53, no. 9, pp. 1534–1541, Sep. 2005.
- [16] L. Li, K. Josiam, and R. Taori, “Feasibility study on full-duplex wireless millimeter-wave systems,” in Proc. IEEE ICASSP, May 2014, pp. 2769–2773.
- [17] “Anokiwave AWA-0134 5G active antenna innovator kit,” Apr. 2021. [Online]. Available: https://www.anokiwave.com/products/awa-0134/index.html