Rib Suppression in Digital Chest Tomosynthesis
Abstract
Digital chest tomosynthesis (DCT) is a technique to produce sectional 3D images of a human chest for pulmonary disease screening, with 2D X-ray projections taken within an extremely limited range of angles. However, under the limited angle scenario, DCT contains strong artifacts caused by the presence of ribs, jamming the imaging quality of the lung area. Recently, great progress has been achieved for rib suppression in a single X-ray image, to reveal a clearer lung texture. We firstly extend the rib suppression problem to the 3D case at the software level. We propose a Tomosynthesis RIb SuPpression and Lung Enhancement Network (TRIPLE-Net) to model the 3D rib component and provide a rib-free DCT. TRIPLE-Net takes the advantages from both 2D and 3D domains, which model the ribs in DCT with the exact FBP procedure and 3D depth information, respectively. The experiments on simulated datasets and clinical data have shown the effectiveness of TRIPLE-Net to preserve lung details as well as improve the imaging quality of pulmonary diseases. Finally, an expert user study confirms our findings.
Keywords:
Digital chest tomosynthesis Rib suppression Limited angle artifacts1 Introduction
Digital chest tomosynthesis (DCT) is a relatively novel imaging modality using limited angle tomography to provide the benefits of 3D imaging [23, 30, 29], which is reconstructed from a series of X-ray projections acquired within an extremely limited angle range [10] using filtered back projection (FBP) [18]. DCT shares some tomographic benefits with computed tomography (CT) as an adjunct to a conventional chest radiography exam for diagnosing pulmonary disease, and carries promise in clinical decision making. Compared with conventional chest radiography, DCT greatly improves the performance in lung nodule detection [15, 21]. While compared with low-dose CT, DCT achieves competitive performance with lower cost and less radiation dosage [10] on the diagnosis of lung cancer [25]. DCT has advantages in the detection of the early stages of COVID-19 [22, 28], too.
However, the limited angle scenario of DCT leaves strong artifacts of ribs overlapped with lung textures, making it difficult for doctors to identify some lung disease contexts close to the rib artifacts. Recently, great progress has been achieved for rib suppression in a single 2D X-ray radiograph. At the software level, DecGAN [20, 19] proposes a CycleGAN-based network that translates chest X-ray images to the simulated images. Furthermore, RSGAN [12] improves the performance by using a disentanglement network. For rib suppression in DCT at the device level, dual-energy chest tomosynthesis (DE-DCT) [24] can provide rib-free DCT by irradiating the tissues with two different energy levels of radiation, but exposes the patient to extra radiation doses. Therefore, rib suppression for DCT at the software level remains an important and unsolved problem.
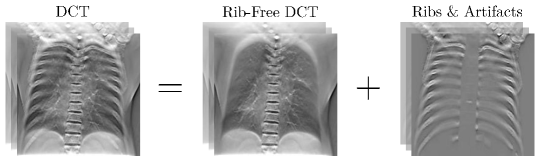
We first visualize the difference between DCT and rib-free DCT in Fig. 1. The difference consists of the rib voxel itself and the artifacts generated by limited angle reconstruction using FBP, which should be removed simultaneously. In this paper, we propose a Tomosynthesis RIb SuPpression and Lung Enhancement Network (TRIPLE-Net) to suppress the ribs and their artifacts in DCT without additive radiation dose. TRIPLE-Net leverages knowledge in both 2D X-ray projection images and 3D DCT reconstructed volumes with three convolutional neural networks: projection-net, volume-net, and aggregation-net.
The projection-net suppresses rib component in the 2D projection, resulting in rib-free volume reconstructed by FBP, which is better at modeling artifacts based on the knowledge of FBP. However, decomposing rib components with high accuracy from the overlapped 2D projective textures might be difficult. Conversely, the volume-net directly extracts the artifacts from lung tissues in 3D DCT volumes, which is expert in accurate and fine modeling. While our proposed TRIPLE-Net reaps the advantages of two sub-modules by merging their outputs with an aggregation-net.
To the best of our knowledge, we are the first to suppress ribs along with their artifacts in DCT. Extensive quantitative results, visualizations, and user studies validate that TRIPLE-Net can effectively suppress rib artifacts in DCT and keep the textures of lung tissues accurate and clear, which greatly outperforms competitive rib suppression methods in 2D X-ray radiograph.
2 TRIPLE-Net
2.1 Problem Formulation
The acquisition of DCT can be viewed as taking X-ray projection from multiple viewing angles within a limited range. The detector is stationary while the X-ray radiator moves vertically, which forms a cone-beam geometry. The collected X-ray projection logarithm can be expressed as,
| (1) |
where is the 3D object’s attenuation coefficient at energy level , is the 3D Radon transformation of DCT geometry at angle , and is the energy distribution function of the X-ray spectrum.
Denote and as the 2D X-ray projection at angle and its corresponding rib-free projection, where is a set of angles in range of . The difference image represents the rib component and artifacts:
| (2) |
The 3D DCT volume and rib-free volume reconstructed by a FBP operator can be expressed as:
| (3) |
Similarly, we denote the rib artifacts in 3D DCT as . Given the linearity of FBP operator [18], we have
| (4) |
Accordingly, there are two approaches to suppress the rib artifacts in DCT: (i) remove rib component from in 2D projection at each projection angle ; (ii) or estimate directly from in 3D.
2.2 Method
Figure 2 shows the framework of TRIPLE-Net, consisting of three convolutional neural networks: projection-net , volume-net , and aggregation-net .
2D rib component modeling. A 2D Residual U-Net (ResUNet) [16] is utilized to extract from . shares weights for each projection across all . The FBP operator is employed to reconstruct 3D rib component in DCT with the 2D predictions from all viewing angles.
3D rib component modeling. In the 2D projection domain, the rib component and other textures in lung tissues are overlapped. Besides, there is a lack of 3D consistency of the rib structures across different . To more accurately model rib artifacts, a 3D ResUNet is employed to directly predict , modeling rib artifacts in 3D reconstructed volume domain.
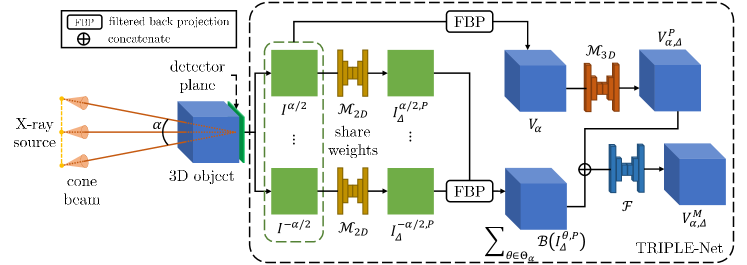
Merging the results. and are able to suppress ribs in DCT based on the knowledge in 2D X-ray projections and 3D DCT volumes respectively. Here is the instinctive difference: is good at modeling artifacts, while is expert in modeling rib components with high accuracy. Therefore, is trained to learn the difference and leverages both the advantages of and . A 3D ResUNet is employed to merge the output of and , producing the final prediction of ribs and their artifacts in DCT:
| (5) |
Loss functions. With the ground truth and , we perform supervised learning with the loss function defined as follows,
| (6) |
Since we have ground truth for both 2D and 3D domain, and are trained separately and the parameters are fixed before training . With the pretrained and , the loss function for training is defined as,
| (7) |
We experimentally set the hyperparameters , and to 20, 50, and 50.
3 Experiment
3.1 Experimental Setup
CT datasets. We use 4 online available CT datasets, LIDC-IDRI(“LI”) [5, 4, 9], RibFrac (“RF”) [14], MIDRC-RICORD-1a (“MR”) [27, 26, 9] and NSCLC Radiogenomics (“NR”) [7, 6, 11, 9], to simulate DCT. As DCT requires a high resolution in the coronal plane, only CTs with spacing in the longitudinal direction are selected. “MR” and “NR” have manually labeled masks for COVID-19 and lung cancer (mostly in nodule manifestation), which are utilized for testing the DCT image quality on lung disease. We use 90% of “LI” and 90% of “RF” for training, and 10% of “LI”, 10% of “RF”, “MR”, and “NR” for testing. In total, there are 1353 training and 402 test data.
Simulating DCT from CT. With CT, we have the 3D attenuation coefficient distribution of an object. We can simulate 2D X-ray projection images with our DCT geometry from CT using (1) by deriving from HU values. This procedure is known as the digitally reconstructed radiography (DRR) technique. We segment ribs in CT with a 3D U-Net [8] and inpaint rib mask with surrounding tissues, deriving the 3D attenuation coefficient distribution function denoted as . Then we can obtain rib suppressed 2D X-ray projections with DRR similarly. The volumes and are accordingly reconstructed by FBP with the simulated projections as described in (3). In this paper, we do not focus on reconstruction algorithms for DCT, but on rib suppression in DCT; so we refer to and as “ground truth” for ribs on DCT and rib-free DCT.
Implementation details. The 3D field of view (FOV) for DCT is set to with a shape of , for the desired resolution of DCT in the anterior-posterior direction is lower. Before DRR, the lung area of CT is placed at the center of FOV. The DRR and FBP procedures are implemented with ODL [3]. The shape of and are . We train and evaluate models separately for and , with 59 and 29 projections taken equiangularly in the range of . , and are implemented with MONAI [1] in PyTorch [2] framework and trained with Adam [17] optimizer with a learning rate of for 100 epochs.
Performance metrics. We segment the lung area in CT with a lung mask [13], and calculate and criteria within of DCT () and on the whole DCT volume () for evaluation over the whole test dataset. Besides, we use peak signal-to-noise ratio (PSNR) for evaluation within disease masks of “MR” and “NR” images pre-normalized to .
Clinical study. We collect 4 clinical DCTs with and 1 clinical DCT with for evaluation, referred as the clinical dataset. We randomly select 30 cases from the test dataset and simulate DCTs with both and , resulting in 60 simulated DCTs. We invited 2 clinical doctors to give rankings from 1-5 (higher is better) for the DCTs by paying attention to the rib suppression performance and lung details. The DCT processed by different methods are randomly shuffled before presenting to the doctors. Doctor A is a proficient radiologist for chest imaging with over 20 years of reading experience. Doctor B is an orthopedist but with the knowledge of DCT. We use paired Wilcoxon signed-rank test deriving p-values to compare scores of other methods with TRIPLE-Net’s.
3.2 Comparison on simulated dataset
Quantitative metrics. RSGAN [12] is a disentanglement method with generative adversarial networks designed for better performance on clinical chest X-ray images, which may have deteriorated performances on the simulated dataset. Therefore, we train solely on the DRR domain to make a fair comparison of 2D and 3D methods on our simulated dataset. Table 1 shows the quantitative comparison of different methods, where TRIPLE-Net achieves the best performance. TRIPLE-Net has the best rib suppression ability on the whole DCT volume, and within the lung area which is the major concern of DCT. Moreover, TRIPLE-Net has better image quality where the pulmonary disease lies.
| Method | ||||||
|---|---|---|---|---|---|---|
| RSGAN | 0.853 | 3.272 | 1.891 | 6.997 | 25.09 | |
| 0.753 | 2.406 | 1.793 | 6.344 | 25.07 | ||
| 0.662 | 1.590 | 1.033 | 2.280 | 33.37 | ||
| TRIPLE-Net | 0.471 | 0.948 | 0.869 | 1.658 | 33.56 | |
| RSGAN | 1.164 | 5.957 | 2.641 | 13.45 | 25.11 | |
| 1.013 | 4.323 | 2.446 | 11.51 | 25.46 | ||
| 0.873 | 2.756 | 1.640 | 5.356 | 30.52 | ||
| TRIPLE-Net | 0.687 | 2.058 | 1.397 | 4.200 | 30.85 |
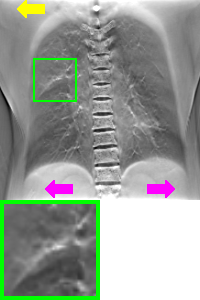
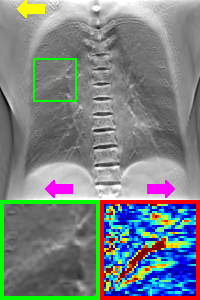
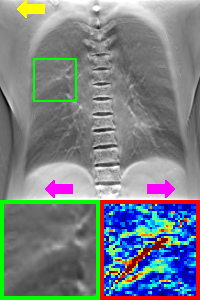
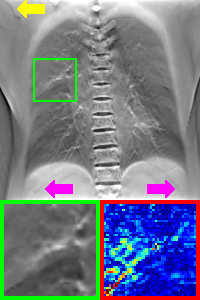
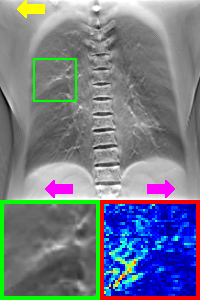
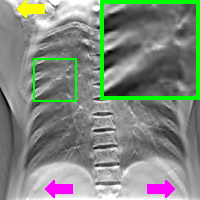
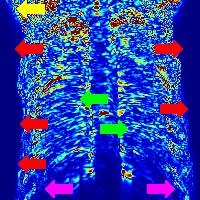
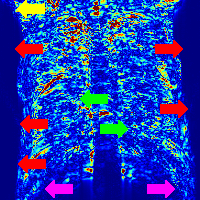
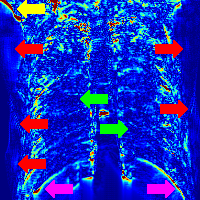
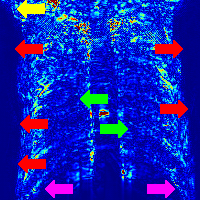
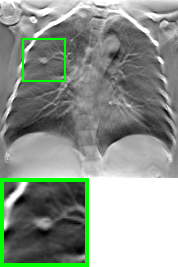
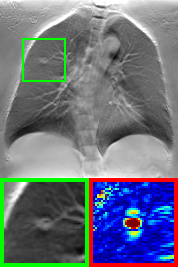
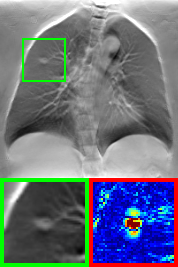
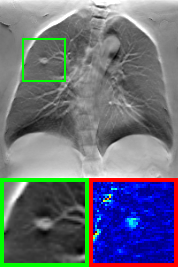
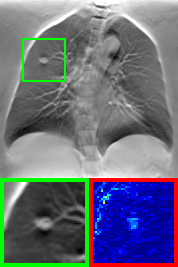
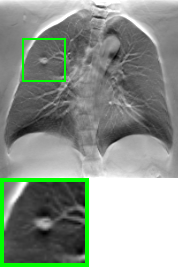
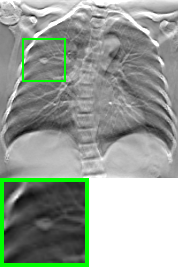
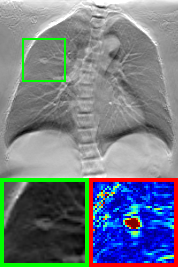
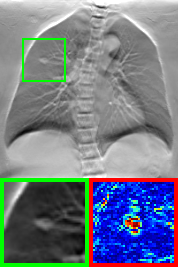
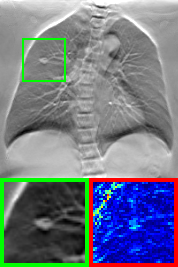
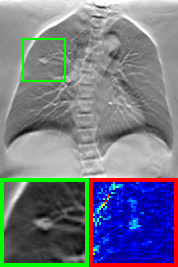
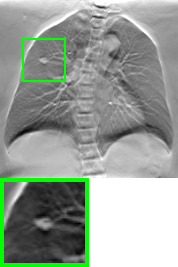
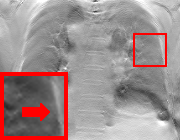
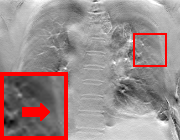
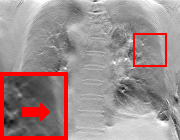
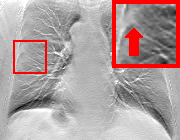
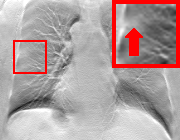
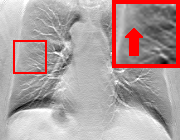
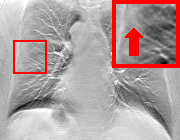
Visualization on rib suppression performance. Figure 3 shows the rib suppression performance of different methods on DCT with . The lung details are magnified in the green rectangles with a unified window level, whose corresponding difference maps are in the red rectangles. We can observe that with DCT rib suppression techniques, the lung details (green rectangles) intersecting with rib artifacts can be revealed more clearly.
Since 2D methods extract rib components in the 2D domain and model with the exact FBP procedure, they only affect the “rib-FBP” area and no more, as pointed by red arrows in Figure 3. On the contrary, simply approximates the volumetric ground truth with a 3D neural network without the knowledge of the FBP mechanism, leaving error widely spread on the whole volume. Moreover, bone components are sometimes complex (bones around shoulders) or with lower contrast (ribs in tissue), as pointed by yellow and pink arrows in Figure 3. So, 3D models have difficulty extracting features and modeling those tricky artifacts. 2D models are easier to model those tricky artifacts in DCT for they are caused by FBP and not that tricky in the 2D domain. With both 2D and 3D information, TRIPLE-Net effectively learns the modality difference by leveraging the advantages of both 2D and 3D domains and achieves the best visual quality with high accuracy within and beyond the lung area.
(a)
(b)
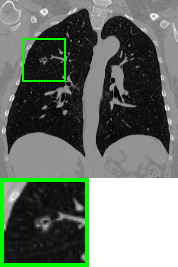
Visualization on disease imaging quality. In Figure 4, images with lung nodules are visualized, where the affected area is magnified in the green rectangles with a unified window level for and , respectively. The corresponding original CT, from which the DCTs are simulated, is also presented. With DCT rib suppression techniques, lung nodules buried by rib artifacts can be identified more easily with clearer boundaries. In the result of 2D models, the lung nodule and lung texture are smoothed. The lung nodule is more distinguishable with better contrast in the result of 3D models. Besides, TRIPLE-Net has a more accurate intensity compared with , within and around the diseased area.
Reducing the DCT’s acquisition angle range. Because of a more limited range of angles, DCT with contains stronger artifacts than . It is harder to identify lung nodules when than as shown in Figure 4. But with TRIPLE-Net, visually the DCT with has a comparative imaging quality as for lung textures, especially lung nodules. This shows that TRIPLE-Net has the potential to further reduce the DCT acquired angle range. It is beneficial to scenarios that do not allow for a large source movement, e.g., intraoperative imaging. Furthermore, it also carries a promise in reducing a radioactive dose, which is harmful to patients.
3.3 Clinical study
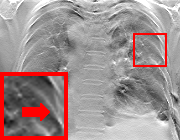
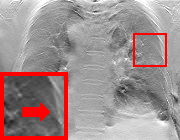
Visualization. We directly run our trained model on clinical data from two patients and visualize the results in Fig. 5. To better generalize TRIPLE-Net to clinical data, RSGAN is substituted for the 2D sub-module . The noticeable difference is contained in the red rectangle, being magnified and showed in a unified window level respectively for and . RSGAN preserves more lung detail than , for its stronger generalization ability in the clinical data. However, without cross-view or 3D information, there is still some rib component leftover in the result of RSGAN (red arrows). Lung details in the red rectangle in the result of are smoothed. With 3D information, models can better remove rib components and preserve lung details on the whole image.

Expert rating. In Table 2, TRIPLE-Net has a score greater than other models with a statistical significance on the simulated dataset. On clinical dataset, models with 3D information have slightly better performance than other methods as in Table 2, which motivates us to further improve our method in future.
| Clinical dataset | Simulated dataset | |||||||
| Method | Doctor A | Doctor B | Doctor A | Doctor B | ||||
| Rating | p-value | Rating | p-value | Rating | p-value | Rating | p-value | |
| FBP | 1.000.00 | 0.031 | 1.000.00 | 0.031 | 1.000.00 | 0.001 | 1.020.13 | 0.001 |
| RSGAN | 2.200.40 | 0.031 | 2.000.00 | 0.031 | 2.380.49 | 0.001 | 2.030.26 | 0.001 |
| 3.000.63 | 0.031 | 3.000.00 | 0.031 | 2.920.78 | 0.001 | 3.020.34 | 0.001 | |
| 4.400.80 | 0.500 | 4.600.49 | 0.688 | 4.200.81 | 0.057 | 4.180.53 | 0.001 | |
| TRIPLE-Net | 4.400.49 | n.a. | 4.400.49 | n.a. | 4.500.65 | n.a. | 4.750.43 | n.a. |
4 Conclusion
In this paper, we have proposed TRIPLE-Net to model rib artifacts in DCT caused by limited angle FBP, leveraging information in both 2D and 3D domains and reaps the benefits from both worlds. TRIPLE-Net can suppress rib artifacts in DCT to obtain a clearer lung texture and better visualization of pulmonary disease areas, which has the potential for better diagnosis of lung nodules and COVID-19 in clinics. In future, research could be furthered for higher resolution in rib-suppressed DCT and better performance in clinical data.
References
- [1] Medical open network for artificial intelligence (monai). https://monai.io/, accessed 27 Feb 2022
- [2] Pytorch. https://pytorch.org/, accessed 27 Feb 2022
- [3] Adler, J., Kohr, H., Oktem, O.: Operator discretization library (odl). Software available from https://github.com/odlgroup/odl (2017)
- [4] Armato III, S.G., McLennan, G., Bidaut, L., McNitt-Gray, M.F., Meyer, C.R., Reeves, A.P., Zhao, B., Aberle, D.R., Henschke, C.I., Hoffman, E.A., et al.: The lung image database consortium (lidc) and image database resource initiative (idri): a completed reference database of lung nodules on ct scans. Medical physics 38(2), 915–931 (2011)
- [5] Armato III, S.G., McLennan, G., Bidaut, L., McNitt-Gray, M.F., Meyer, C.R., Reeves, A.P., Zhao, B., Aberle, D.R., Henschke, C.I., Hoffman, E.A., et al.: Data from lidc-idri [data set]. The Cancer Imaging Archive (2015). https://doi.org/https://doi.org/10.7937/K9/TCIA.2015.LO9QL9SX
- [6] Bakr, S., Gevaert, O., Echegaray, S., Ayers, K., Zhou, M., Shafiq, M., Zheng, H., Benson, J.A., Zhang, W., Leung, A.N., et al.: A radiogenomic dataset of non-small cell lung cancer. Scientific data 5(1), 1–9 (2018)
- [7] Bakr, S., Gevaert, O., Echegaray, S., Ayers, K., Zhou, M., Shafiq, M., Zheng, H., Zhang, W., Leung, A.N., Kadoch, M., et al.: Data for nsclc radiogenomics collection. The Cancer Imaging Archive (2017). https://doi.org/http://doi.org/10.7937/K9/TCIA.2017.7hs46erv
- [8] Çiçek, Ö., Abdulkadir, A., Lienkamp, S.S., Brox, T., Ronneberger, O.: 3d u-net: learning dense volumetric segmentation from sparse annotation. In: International conference on medical image computing and computer-assisted intervention. pp. 424–432. Springer (2016)
- [9] Clark, K., Vendt, B., Smith, K., Freymann, J., Kirby, J., Koppel, P., Moore, S., Phillips, S., Maffitt, D., Pringle, M., et al.: The cancer imaging archive (tcia): maintaining and operating a public information repository. Journal of digital imaging 26(6), 1045–1057 (2013)
- [10] Dobbins III, J.T., McAdams, H.P.: Chest tomosynthesis: technical principles and clinical update. European journal of radiology 72(2), 244–251 (2009)
- [11] Gevaert, O., Xu, J., Hoang, C.D., Leung, A.N., Xu, Y., Quon, A., Rubin, D.L., Napel, S., Plevritis, S.K.: Non–small cell lung cancer: identifying prognostic imaging biomarkers by leveraging public gene expression microarray data—methods and preliminary results. Radiology 264(2), 387–396 (2012)
- [12] Han, L., Lyu, Y., Peng, C., Zhou, S.K.: Gan-based disentanglement learning for chest x-ray rib suppression. Medical Image Analysis p. 102369 (2022)
- [13] Hofmanninger, J., Prayer, F., Pan, J., Röhrich, S., Prosch, H., Langs, G.: Automatic lung segmentation in routine imaging is primarily a data diversity problem, not a methodology problem. European Radiology Experimental 4(1), 50 (2020)
- [14] Jin, L., Yang, J., Kuang, K., Ni, B., Gao, Y., Sun, Y., Gao, P., Ma, W., Tan, M., Kang, H., Chen, J., Li, M.: Deep-learning-assisted detection and segmentation of rib fractures from ct scans: Development and validation of fracnet. EBioMedicine (2020)
- [15] Jung, H., Chung, M., Koo, J., Kim, H., Lee, K.: Digital tomosynthesis of the chest: utility for detection of lung metastasis in patients with colorectal cancer. Clinical radiology 67(3), 232–238 (2012)
- [16] Kerfoot, E., Clough, J., Oksuz, I., Lee, J., King, A.P., Schnabel, J.A.: Left-ventricle quantification using residual u-net. In: International Workshop on Statistical Atlases and Computational Models of the Heart. pp. 371–380. Springer (2018)
- [17] Kingma, D.P., Ba, J.: Adam: A method for stochastic optimization. In: 3rd International Conference on Learning Representations (2015)
- [18] Lauritsch, G., Härer, W.H.: Theoretical framework for filtered back projection in tomosynthesis. In: Medical Imaging 1998: Image Processing. vol. 3338, pp. 1127–1137. International Society for Optics and Photonics (1998)
- [19] Li, H., Han, H., Li, Z., Wang, L., Wu, Z., Lu, J., Zhou, S.K.: High-resolution chest x-ray bone suppression using unpaired ct structural priors. IEEE transactions on medical imaging 39(10), 3053–3063 (2020)
- [20] Li, Z., Li, H., Han, H., Shi, G., Wang, J., Zhou, S.K.: Encoding ct anatomy knowledge for unpaired chest x-ray image decomposition. In: International Conference on Medical Image Computing and Computer-Assisted Intervention. pp. 275–283. Springer (2019)
- [21] Machida, H., Yuhara, T., Tamura, M., Ishikawa, T., Tate, E., Ueno, E., Nye, K., Sabol, J.M.: Whole-body clinical applications of digital tomosynthesis. Radiographics 36(3), 735–750 (2016)
- [22] Miroshnychenko, O., Miroshnychenko, S., Nevgasymyi, A., Khobta, Y.: Contrasts comparison of same cases of chest pathologies for radiography and tomosynthesis. In: 2020 International Symposium on Electronics and Telecommunications (ISETC). pp. 1–4. IEEE (2020)
- [23] Molk, N., Seeram, E.: Digital tomosynthesis of the chest: a literature review. Radiography 21(2), 197–202 (2015)
- [24] Sone, S., Kasuga, T., Sakai, F., Hirano, H., Kubo, K., Morimoto, M., Takemura, K., Hosoba, M.: Chest imaging with dual-energy subtraction digital tomosynthesis. Acta Radiologica 34(4), 346–350 (1993)
- [25] Terzi, A., Bertolaccini, L., Viti, A., Comello, L., Ghirardo, D., Priotto, R., Grosso, M., Group, S.S., et al.: Lung cancer detection with digital chest tomosynthesis: baseline results from the observational study sos. Journal of Thoracic Oncology 8(6), 685–692 (2013)
- [26] Tsai, E.B., Simpson, S., Lungren, M.P., Hershman, M., Roshkovan, L., Colak, E., Erickson, B.J., Shih, G., Stein, A., Kalpathy-Cramer, J., et al.: The rsna international covid-19 open radiology database (ricord). Radiology 299(1), E204–E213 (2021)
- [27] Tsai, E.B., Simpson, S., Lungren, M.P., Hershman, M., Roshkovan, L., Colak, E., Erickson, B.J., Shih, G., Stein, A., Kalpathy-Cramer, J., et al.: Data from the medical imaging data resource center - rsna international covid radiology database release 1a - chest ct covid+ (midrc-ricord-1a). Data from The Cancer Imaging Archive (2022). https://doi.org/https://doi.org/10.7937/VTW4-X588
- [28] Yao, Q., Xiao, L., Liu, P., Zhou, S.K.: Label-free segmentation of covid-19 lesions in lung ct. IEEE transactions on medical imaging 40(10), 2808–2819 (2021)
- [29] Zhou, S.K., Greenspan, H., Davatzikos, C., Duncan, J.S., Van Ginneken, B., Madabhushi, A., Prince, J.L., Rueckert, D., Summers, R.M.: A review of deep learning in medical imaging: Imaging traits, technology trends, case studies with progress highlights, and future promises. Proceedings of the IEEE (2021)
- [30] Zhou, S.K., Rueckert, D., Fichtinger, G.: Handbook of medical image computing and computer assisted intervention. Academic Press (2019)