Measurement of the neutron-neutron effective range in neutron-deuteron breakup 111This article is registered under preprint number: /nucl-ex/2203.02619
Abstract
We report the most precise determination of the neutron-neutron effective range parameter () from neutron-neutron quasifree scattering in neutron-deuteron breakup. The experiment setup utilized a collimated beam of 15.5 MeV neutrons and an array of eight neutron detectors positioned at angles sensitive to several quasifree scattering kinematic configurations. The two neutrons emitted from the breakup reaction were detected in coincidence and time-of-flight techniques were used to determine their energies. The beam-target luminosity was measured in-situ with the yields from neutron-deuteron elastic scattering. Rigorous Faddeev-type calculations using the CD Bonn nucleon-nucleon potential were fit to our cross-section data to determine the value of . The analysis was repeated using a semilocal momentum-space regularized N4LO+ chiral interaction potential. We obtained values of fm and fm using the CD Bonn and N4LO+ potentials, respectively. Our results are consistent with charge symmetry and previously reported values of .
keywords:
few-nucleon , neutron-neutron , effective range , neutron-deuteron breakup , neutron time-of-flight arXiv:2203.02619Since the discovery of the neutron [1, 2], much effort has been devoted to characterizing the properties of nuclei based on the interactions of their constituent nucleons. Due to the technical challenges associated with quantum chromodynamics, interactions between individual nucleons are described by effective theories [3]. Modern nucleon-nucleon () phenomenological potential models [4, 5], one-boson exchange models [6, 7], and chiral effective theory [8, 3, 9] are used to describe scattering data. Because no direct neutron-neutron () scattering data exist, the isovector component of potential models are fit to proton-proton () scattering data. Neutron-neutron potentials are assumed to be the same as those for nuclear interactions due to charge symmetry [10] with small adjustments for charge-symmetry breaking effects such as the different masses of the neutron and proton [4, 11, 6].
The scattering length () and effective range () have long been used to quantify charge-symmetry breaking in the interaction [12, 13, 14]. While there have been several recent measurements of to resolve a long-standing discrepancy [15, 16, 17, 18, 19, 20], measurements of have not been published for over 40 years. Early experiments that determined from the final state interaction (FSI) in various scattering systems resulted in a large spread of values (2.0 - 3.2 fm) with large uncertainties (20 - 60%) [21, 22, 23, 24, 25, 26, 27]. Gabioud et al. extracted both and based on measurements of the photon energy spectrum from the reaction and achieved the most precise result to date, , consistent with charge symmetry [28, 29, 30]. More recently, was calculated from the value of determined from measurements of the FSI in neutron-deuteron () breakup [31, 32, 33, 34]. These determinations are not ideal because the low relative momentum between the neutrons in the FSI makes this configuration much more sensitive to than to .
Neutron-neutron quasifree scattering (QFS) in the system is ideal for measuring . In this kinematic configuration, the momentum of the incident neutron is transferred exclusively to the neutron in the deuteron, i.e., the proton remains at rest in the laboratory frame during the scattering process. The cross section for QFS in breakup is highly sensitive to and is insensitive to off-shell effects of the potential, three-nucleon forces, and [35, 36]. For this reason, several early experiments determined from measurements of QFS in breakup. These experiments were performed at incident neutron energies between 14 and 25 MeV [37, 38, 39, 40, 41]. Although these measurements agreed well with theory, they were limited by large statistical uncertainties and were compared to theory which implemented several simplifying assumptions and used phenomenological interactions. A weighted average of the results gives a value of fm, consistent with the value from Gabioud [12]. The recommended value of fm is a weighted average of all previous measurements, but the value is dominated by the and QFS experiments [12]. The average value is consistent with the charge-symmetric proton-proton value of fm [12, 13, 14].
The situation was complicated by three recent measurements of QFS in breakup at incident neutron energies of 10.3, 26, and 25 MeV [42, 43, 44]. Rigorous Faddeev calculations [45] using the CD Bonn potential [6] underpredicted the measured cross section by about 16% [43, 44, 36]; the theory predicted the shape of the data but not its magnitude. Inclusion of three-nucleon () forces did not significantly change the predicted cross section [35]. Experimentally, a large error (%) in the determination of the beam-target luminosity would explain the discrepancy. On the theory side, the discrepancy could be removed by scaling the interaction matrix element by a factor of 1.08. However, this remedy drastically alters the value of , resulting in a significant charge-symmetry breaking effect [36].
We have performed new measurements of the cross section for QFS in breakup to investigate the discrepancy reported in Refs. [42, 43, 44]. In contrast to previous experiments, the integrated beam-target luminosity was determined from the yields for elastic scattering. This removes several sources of systematic uncertainty because the elastic scattering yields are measured simultaneously with the breakup yields and the absolute neutron flux and number of deuterium nuclei in the target do not need to be known independently. This technique has been successfully implemented in a previous measurement [46]. The present experiment was conducted at a different energy with more configurations sensitive to QFS than previous work [43, 44]. In this letter, we discuss the setup of the experiment, the data-analysis procedures, and the results for the kinematic configurations sensitive to . More details about the experiment and results from other breakup configurations will be discussed in a forthcoming publication.
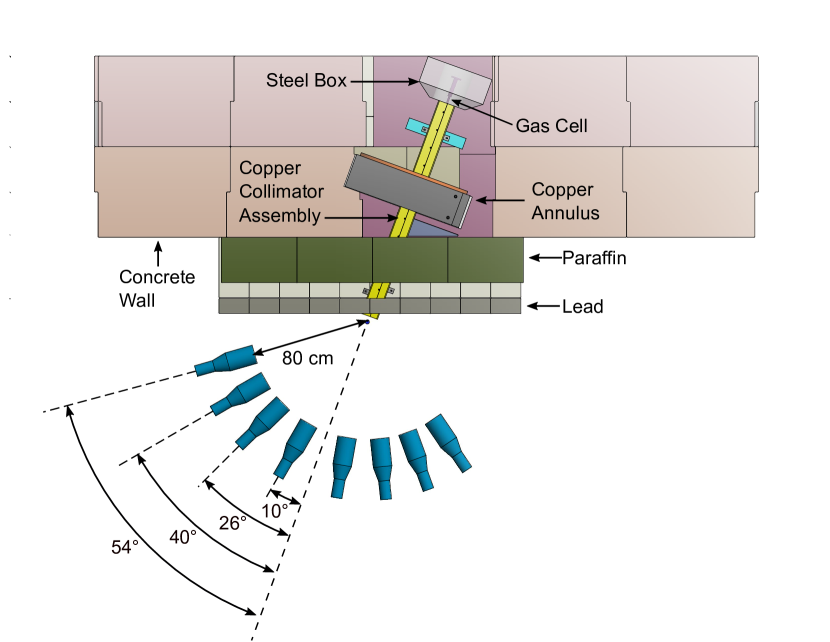
Measurements were performed at the tandem accelerator facility at the Triangle Universities Nuclear Laboratory. The experiment setup is shown in Fig. 1. A beam of deuterons was directed into a 7.26-cm long cell of deuterium gas pressurized to 7.1 atm to produce neutrons at MeV (full width) via the 2H()3He reaction. The incident deuteron beam was pulsed (T = 400 ns, t = 2 ns FWHM) and the arrival of each beam pulse was detected by a capacitive beam pickoff unit immediately upstream of the deuterium gas cell. This provided a time reference for neutron time-of-flight (TOF) measurements. The average deuteron beam current on target was kept at 800 nA.
The use of a copper collimator surrounded by a large shielding wall resulted in a rectangular neutron beam with a plateau of constant flux 36 mm wide 55 mm high at the location of the CD2 target, which was suspended 177.6 cm downstream from the center of the neutron production cell.
Eight BC-501A liquid organic scintillators were used for neutron detection. The detectors were right cylinders (diameter = 12.7 cm, thickness = 5.08 cm) oriented with symmetry axes pointing at the scattering sample. Detectors were placed approximately 80 cm from the scattering sample (center-to-center distance) at nominal angles of 10°, 26°, 40°, and 54° on opposite sides of the neutron beam axis. The exact positions and scattering angles for each detector were determined from a survey of the detectors and scans of the neutron beam profile. Another cylindrical BC-501A scintillator (diameter = 3.81 cm, thickness = 3.81 cm) was placed in the neutron beam 507.4 cm downstream from the neutron production cell to monitor the neutron beam flux during data collection (not shown in Fig. 1).
To reduce background events, two cuts were applied to the data. A pulse-height threshold equal to one-half the energy of the 137Cs Compton-scattering edge (239 keV-electron-equivalent) was used to reduce backgrounds from low-energy particles. Pulse-shape discrimination (PSD) techniques were used to reduce backgrounds from gamma-ray events.
Two right cylinders composed of deuterated polyethylene (CD2, Cambridge Isotope Laboratories, Inc., DLM-220-0) and graphite were used as scattering samples. Physical properties of the samples are given in Table 1. Each sample was mounted in the beam with their symmetry axes vertical. The entire volume of each sample was within the area of constant neutron flux. The graphite sample was used to measure backgrounds from neutron scattering on carbon in the CD2 sample. Other backgrounds such as neutron scattering from air were measured with an empty sample holder.
| Sample | Mass (g) | Diameter (mm) | Height (mm) |
|---|---|---|---|
| CD2 | 25.172 | 28.3 | 36.4 |
| Graphite | 42.055 | 28.6 | 38.0 |
To avoid unacceptably high dead times of the data-acquisition system (DAQ), a trigger circuit with separate branches for single detector events and coincidence events was used. Coincidences between detectors on opposite sides of the neutron beam () within a window of 850 ns triggered the DAQ. The single-event branch trigger rate was divided by a factor of 10, delayed 400 ns, and vetoed by the coincidence branch before triggering the DAQ. This allowed all coincidence events to be measured with a reasonable DAQ dead time () while accumulating sufficient counts from nd elastic scattering to achieve a statistical accuracy better than 0.1% in the beam-target luminosity determination.
Two types of coincidence spectra were measured: (1) the raw coincidence spectrum containing true and accidental coincidences, and (2) the accidental coincidence spectrum. Coincidences between events originating from two consecutive beam pulses ( ns) were used to measure the accidental coincidence spectra. The coincidence spectrum for the pair of detectors at 40° on opposite sides of the beam is shown in Fig. 2, where accidental coincidence spectrum has been subtracted from the raw coincidence spectrum for display.
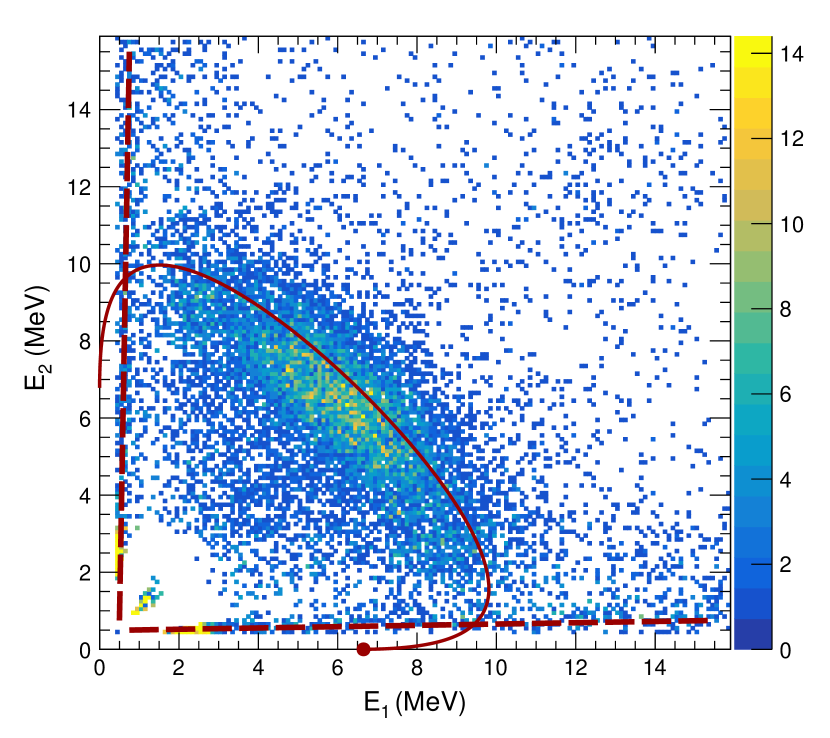
A background due to detector cross talk, in which a single neutron scattered between two detectors and was detected in both, contributed to the raw coincidence spectrum. These events were separated by less than 100 ns in time and were indistinguishable from real coincidences. However, due to the experiment geometry, these events fell outside the region of the data reported here. Coincidences due to cross talk form the bands indicated by the red dashed lines in Fig. 2. The events around MeV are due to cross-talk coincidences from gamma rays not removed by the PSD cut.
Coincidence events from breakup fall on a locus of kinematically allowed neutron energies. The red curve in Fig. 2 is the ideal locus, or curve, defined by the central geometry of the detector pair. The variable measures the arc length along the curve in a counterclockwise direction beginning at the point where the energy of the second neutron reaches a minimum [45], indicated by the red dot in Fig. 2. For each detector pair, the raw and accidental coincidence events in a band around the curve were projected onto the ideal kinematic locus. The curve was divided into 0.5 MeV-wide bins and each detected event was projected into the nearest bin on the curve. The projected accidental coincidence spectrum was subtracted from the projected raw spectrum for each detector pair to obtain the true coincidence yields as a function of . The breakup cross section was computed using these yields.
The present data were compared to rigorous ab-initio three-body calculations using the CD-Bonn potential [6, 7] and the semilocal momentum-space (SMS) regularized N4LO+ chiral interaction of the Bochum group [9] with the cutoff MeV in the Faddeev formalism applying the technique described in Ref. [45]. A Monte-Carlo (MC) simulation of the experiment was used to average the point-geometry theory predictions over the energy spread and finite geometry of the experiment to allow accurate comparison between theory and data. The MC simulation was also used to determine the average values of the product of neutron detector efficiencies and neutron transmission probabilities as a function of , which were necessary to compute the breakup cross section. Finally, the simulation was used to quantify contributions of background processes to neutron scattering yields. The details of the simulation can be found in Ref. [46].
Background processes that were simulated for both breakup and elastic scattering included: multiple scattering of neutrons in the sample, in-scattering of neutrons from shielding materials and adjacent detectors, and neutrons produced via on deuterons implanted in the gold beam stop at the end of the gas cell. Two additional backgrounds for elastic scattering were simulated: neutron scattering from the 1.6% hydrogen impurity in the CD2 sample, and breakup events in which only one neutron was detected. The fraction of background events determined with the MC simulation was subtracted from the measured coincidence yields and the elastic scattering yields. The corrections for elastic scattering were between 7-12% and the average correction for breakup events varied from 6-8%, depending on the scattering configuration.
The yields from nd elastic scattering in each detector were used to determine the integrated beam-target luminosity. Backgrounds from neutron scattering on carbon and air were measured using the graphite sample and an empty target holder, respectively. The TOF spectrum for each detector accumulated with the empty target holder was normalized and subtracted from the spectra measured with the CD2 and graphite samples. The empty-target TOF spectra were normalized using the integrated beam current (BCI), the gas pressure in the neutron production cell, and the DAQ live time fraction. The TOF spectra measured with the graphite sample were normalized to the spectra measured with the CD2 sample in a similar way. The normalization factor also included the ratio of carbon nuclei in the two samples determined using data from a previous experiment [46]. The normalized graphite TOF spectra were subtracted from the CD2 TOF spectra to obtain the raw yields from elastic scattering. Also, the raw yields were corrected for backgrounds quantified with the MC simulation.
The luminosity per BCI measured by all eight detectors agreed with a standard deviation of 2.1%. The geometric mean of the beam-target luminosity measured by all detectors except those at 10° was used to compute the breakup cross section. The yields measured by the detectors at 10° were excluded from the luminosity determination because of the large uncertainty in subtracting the background contributions () due to neutron scattering on carbon and air.
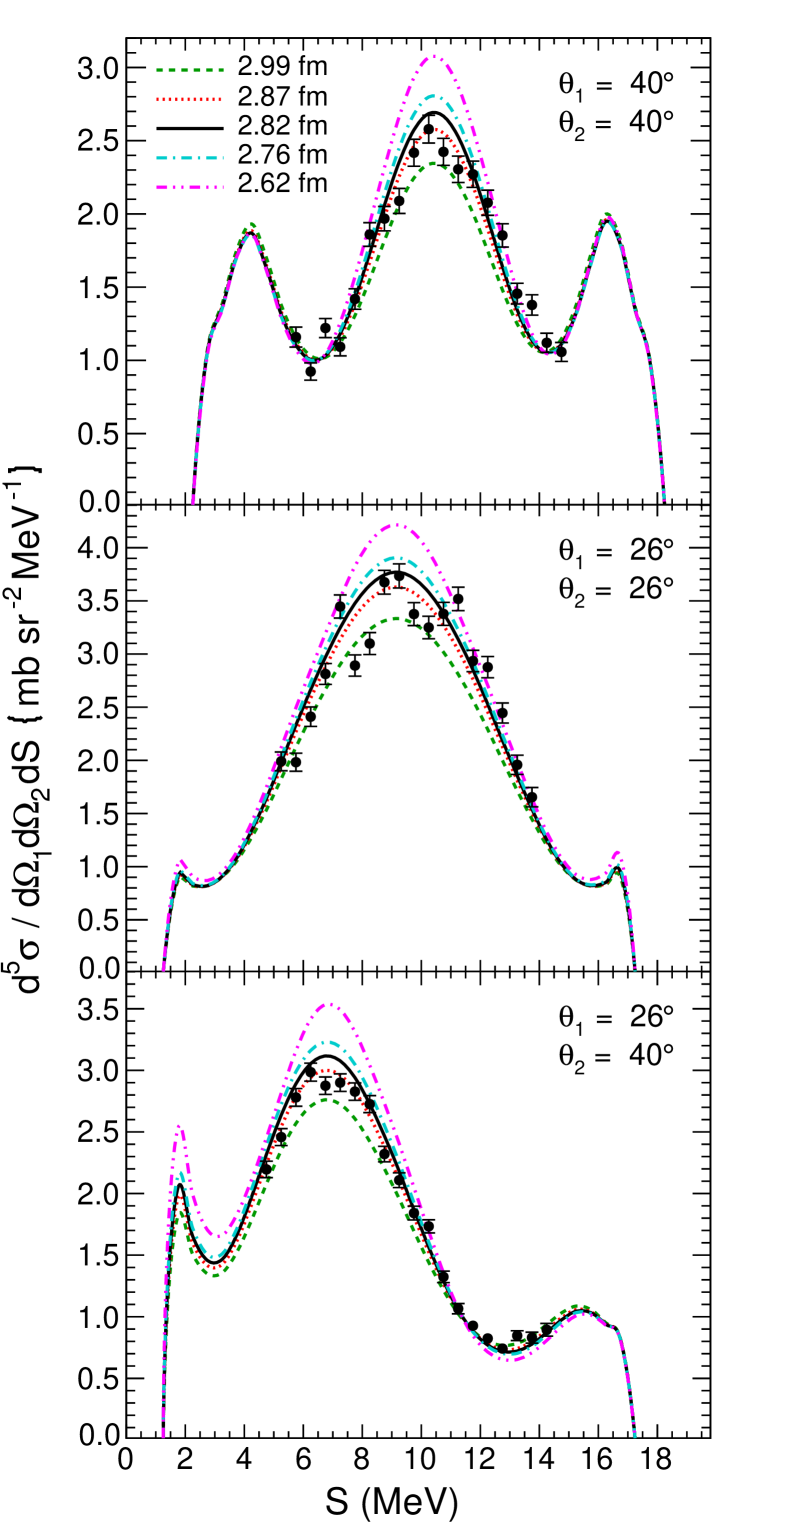
Several QFS configurations were measured using detectors positioned on opposite sides of the beam axis. The detector pair at ° measured an exact quasifree-scattering configuration. The detector pair at ° and the two pairs at °, °, measured configurations near QFS, where the proton energy reaches a minimum of 0.4 MeV and 0.1 MeV, respectively. Two other QFS configurations were measured; however, the cross sections for those configurations are dominated by final-state interactions and therefore were not used to determine .
Our results for the QFS cross section are presented in Fig. 3. The measured data are given by the points and the error bars represent statistical uncertainty. Not shown on the plot is a systematic uncertainty of . The data points for the configuration at °, ° are a statistically weighted average of the results from the two detector pairs. The curves in Fig. 3 represent the result of the MC simulation using breakup cross sections calculated with the CD Bonn potential with different values of . The curves provide a representative sample covering the full range of the values used in the analysis.
| Source | Magnitude (%) |
|---|---|
| Coincidence yields | 1.5 |
| Elastic scattering yields | 2.8 |
| Efficiency normalization | 2.9 |
| Efficiency shape | 3.0 |
| Detector gain drift | 1.0 |
| Neutron transmission | 2.7 |
| elastic cross section | 1.6 |
| Detector solid angle | 0.9 |
| Single event live time | 0.1 |
| Coincidence event live time | 0.6 |
| Total | 6.3 |
Sources of systematic uncertainty are listed in Table 2. The uncertainty in the measured coincidence yields is mainly due to the MC corrections for multiple scattering and in-scattering, but also includes contributions from the accidental background subtraction and neutrons produced at energies below 15.5 MeV via reactions on contaminants in the gas cell. Subtraction of the graphite spectra and simulated backgrounds contribute the most to the uncertainty in the extracted elastic scattering yields. The MC simulation uses as input simulated detector efficiency curves fit to measurements of the neutron flux from the 2H()3He reaction at zero degrees [47, 48]. The uncertainty in the overall normalization and shape of the efficiency curve were determined from those measurements as in Ref. [46]. The effect of small changes in the detector gain on the simulated detector efficiency was estimated using variations of the efficiency curve due to changes in the detector threshold setting. Neutron transmission factors were calculated with the MC simulation using cross sections and associated uncertainties from ENDF/B-VII.1 [49]. The elastic scattering cross section was computed using the CD Bonn potential, and the error is estimated as the difference between predictions of several modern potentials [50]. The uncertainty in the detector solid angle is due to the precision of measuring the positions of the detector faces (0.1 cm). The difference between multiple methods used to determine the DAQ live-time fraction is used as an estimate of its uncertainty.
To determine , the MC simulation was run using breakup cross sections calculated with the CD Bonn matrix element scaled by seven different factors, resulting in different values of . Scaling this matrix element also alters ; however, because the QFS cross section is sensitive only to variations in the effective range and not the scattering length, this is adequate to determine [36]. For every detector configuration, the value of was computed as a function of using the integral of the cross section over the QFS peak where the sensitivity to changes of is greatest. A second-degree polynomial was fit to the function and the minimum of this fit was taken as the best value of . The statistical uncertainty in the extracted value of is given by . The integral of the QFS theoretical cross section as a function of was used to convert the systematic uncertainty in the cross section to uncertainty in . The analysis was repeated using the SMS chiral N4LO+ potential of the Bochum group [9] with the cutoff MeV. Our results are summarized in Table 3. The values of determined from the three QFS configurations agreed within statistical uncertainties. The final result is given as a weighted average of those values. The values extracted using the two different potentials agree well, and our values are consistent with the recommended value fm and the charge-symmetric value of fm [12, 13, 14].
| Configuration | (fm) |
|---|---|
| ° ° | |
| ° ° | |
| ° ° | |
| CD Bonn Average | |
| N4LO+ Average |
We have performed measurements of the cross section for QFS in breakup using a new technique to determine the integrated beam-target luminosity based on the elastic scattering yields measured simultaneously with the coincidences from breakup. Our results, summarized in Table 3, provide the first measurement of the effective range parameter using modern potentials and the most precise determination from QFS in breakup. The data also suggest that the previously reported discrepancies between theory and data in the QFS cross section at 10.3, 26 and 25 MeV [42, 43, 44] may be due to systematic errors in the determination of the beam-target luminosity leading to incorrect normalization of the breakup cross section. Another possibility is that the discrepancy is energy dependent and only becomes evident in measurements at incident neutron energies above 20 MeV. Further measurements at higher incident neutron energies should be carried out to investigate this possibility.
Acknowledgments
The authors thank the TUNL technical staff for their contributions. The authors appreciate the use of the supercomputer cluster of the JSC in Jülich, Germany, where parts of the numerical calculations were performed. This work is supported in part by the U.S. Department of Energy under grant Nos. DE-FG02-97ER41033 and DE-SC0005367 and by the Polish National Science Center under grant No. DEC-2016/22/M/ST2/00173. Part of this work was performed under the auspices of the U.S. Department of Energy by Lawrence Livermore National Laboratory under Contract DE-AC52-07NA27344.
References
-
[1]
J. Chadwick, Possible existence of a neutron, Nature
129 (3252) (1932) 312.
doi:10.1038/129312a0.
URL 10.1038/129312a0 -
[2]
J. Chadwick, The existence of a
neutron, Proc. R Soc. London A 136 (830) (1932) 692–708.
URL http://www.jstor.org/stable/95816 -
[3]
R. Machleidt, D. Entem,
Chiral
effective field theory and nuclear forces, Phys. Rep. 503 (1) (2011) 1–75.
doi:10.1016/j.physrep.2011.02.001.
URL https://www.sciencedirect.com/science/article/pii/S0370157311000457 -
[4]
V. G. J. Stoks, R. A. M. Klomp, C. P. F. Terheggen, J. J. de Swart,
Construction of
high-quality potential models, Phys. Rev. C 49 (1994) 2950–2962.
doi:10.1103/PhysRevC.49.2950.
URL https://link.aps.org/doi/10.1103/PhysRevC.49.2950 -
[5]
R. B. Wiringa, V. G. J. Stoks, R. Schiavilla,
Accurate
nucleon-nucleon potential with charge-independence breaking, Phys. Rev. C 51
(1995) 38–51.
doi:10.1103/PhysRevC.51.38.
URL https://link.aps.org/doi/10.1103/PhysRevC.51.38 -
[6]
R. Machleidt, F. Sammarruca, Y. Song,
Nonlocal nature of
the nuclear force and its impact on nuclear structure, Phys. Rev. C 53
(1996) R1483–R1487.
doi:10.1103/PhysRevC.53.R1483.
URL https://link.aps.org/doi/10.1103/PhysRevC.53.R1483 -
[7]
R. Machleidt,
High-precision,
charge-dependent Bonn nucleon-nucleon potential, Phys. Rev. C 63 (2001)
024001.
doi:10.1103/PhysRevC.63.024001.
URL https://link.aps.org/doi/10.1103/PhysRevC.63.024001 -
[8]
E. Epelbaum, H.-W. Hammer, Ulf.-G. Meißner,
Modern theory of
nuclear forces, Rev. Mod. Phys. 81 (2009) 1773–1825.
doi:10.1103/RevModPhys.81.1773.
URL https://link.aps.org/doi/10.1103/RevModPhys.81.1773 -
[9]
P. Reinert, H. Krebs, E. Epelbaum, Semilocal
momentum-space regularized chiral two-nucleon potentials up to fifth order,
Eur. Phys. J. A 54 (2018) 86.
doi:10.1140/epja/i2018-12516-4.
URL 10.1140/epja/i2018-12516-4 -
[10]
W. Heisenberg, Über den bau der atomkerne. I,
Z. Phys. 77 (1932) 1–11.
doi:10.1007/BF01342433.
URL 10.1007/BF01342433 -
[11]
V. G. J. Stoks, R. A. M. Klomp, M. C. M. Rentmeester, J. J. de Swart,
Partial-wave analysis
of all nucleon-nucleon scattering data below 350 MeV, Phys. Rev. C 48
(1993) 792–815.
doi:10.1103/PhysRevC.48.792.
URL https://link.aps.org/doi/10.1103/PhysRevC.48.792 -
[12]
I. Šlaus, Y. Akaishi, H. Tanaka,
Neutron-neutron
effective range parameters, Physics Reports 173 (5) (1989) 257–300.
doi:10.1016/0370-1573(89)90127-0.
URL https://www.sciencedirect.com/science/article/pii/0370157389901270 -
[13]
G. Miller, B. Nefkens, I. Šlaus,
Charge
symmetry, quarks and mesons, Physics Reports 194 (1) (1990) 1–116.
doi:10.1016/0370-1573(90)90102-8.
URL https://www.sciencedirect.com/science/article/pii/0370157390901028 -
[14]
R. Machleidt, I. Slaus, The nucleon-nucleon
interaction, J Phys. G 27 (5) (2001) R69–R108.
doi:10.1088/0954-3899/27/5/201.
URL 10.1088/0954-3899/27/5/201 -
[15]
C. Howell, Q. Chen, T. Carman, A. Hussein, W. Gibbs, B. Gibson, G. Mertens,
C. Moore, C. Morris, A. Obst, E. Pasyuk, C. Roper, F. Salinas, I. Slaus,
S. Sterbenz, W. Tornow, R. Walter, C. Whiteley, M. Whitton,
Toward
a resolution of the neutron-neutron scattering-length issue, Physics Letters
B 444 (3) (1998) 252–259.
doi:10.1016/S0370-2693(98)01386-0.
URL https://www.sciencedirect.com/science/article/pii/S0370269398013860 -
[16]
Q. Chen, C. R. Howell, T. S. Carman, W. R. Gibbs, B. F. Gibson, A. Hussein,
M. R. Kiser, G. Mertens, C. F. Moore, C. Morris, A. Obst, E. Pasyuk, C. D.
Roper, F. Salinas, H. R. Setze, I. Slaus, S. Sterbenz, W. Tornow, R. L.
Walter, C. R. Whiteley, M. Whitton,
Measurement of the
neutron-neutron scattering length using the
capture reaction, Phys. Rev. C 77
(2008) 054002.
doi:10.1103/PhysRevC.77.054002.
URL https://link.aps.org/doi/10.1103/PhysRevC.77.054002 -
[17]
D. E. González Trotter, F. Salinas, Q. Chen, A. S. Crowell, W. Glöckle,
C. R. Howell, C. D. Roper, D. Schmidt, I. Šlaus, H. Tang, W. Tornow,
R. L. Walter, H. Witała, Z. Zhou,
New measurement
of the neutron-neutron scattering length using the
neutron-proton scattering length as a standard, Phys. Rev. Lett. 83 (1999)
3788–3791.
doi:10.1103/PhysRevLett.83.3788.
URL https://link.aps.org/doi/10.1103/PhysRevLett.83.3788 -
[18]
D. E. Gonzalez Trotter, F. S. Meneses, W. Tornow, C. R. Howell, Q. Chen, A. S.
Crowell, C. D. Roper, R. L. Walter, D. Schmidt, H. Witała, W. Glöckle,
H. Tang, Z. Zhou, I. Šlaus,
Neutron-deuteron
breakup experiment at :
Determination of the neutron-neutron scattering length
, Phys. Rev. C 73 (2006) 034001.
doi:10.1103/PhysRevC.73.034001.
URL https://link.aps.org/doi/10.1103/PhysRevC.73.034001 -
[19]
V. Huhn, L. Wätzold, Ch. Weber, A. Siepe, W. von Witsch,
H. Witała, W. Glöckle,
New attempt to
determine the n-n scattering length with the
reaction, Phys. Rev. Lett. 85 (2000) 1190–1193.
doi:10.1103/PhysRevLett.85.1190.
URL https://link.aps.org/doi/10.1103/PhysRevLett.85.1190 -
[20]
V. Huhn, L. Wätzold, Ch. Weber, A. Siepe, W. von Witsch,
H. Witała, W. Glöckle,
New investigation
of the neutron-neutron and neutron-proton final-state interaction in the
n-d breakup reaction, Phys. Rev. C 63 (2000) 014003.
doi:10.1103/PhysRevC.63.014003.
URL https://link.aps.org/doi/10.1103/PhysRevC.63.014003 -
[21]
E. Baumgartner, H. E. Conzett, E. Shield, R. J. Slobodrian,
Determination of
the neutron-neutron scattering length from the reaction , Phys. Rev. Lett. 16 (1966) 105–108.
doi:10.1103/PhysRevLett.16.105.
URL https://link.aps.org/doi/10.1103/PhysRevLett.16.105 -
[22]
E. E. Gross, E. V. Hungerford, J. J. Malanify, R. Woods,
Nucleon-nucleon
scattering parameters from final-state interactions, Phys. Rev. C 1 (1970)
1365–1376.
doi:10.1103/PhysRevC.1.1365.
URL https://link.aps.org/doi/10.1103/PhysRevC.1.1365 -
[23]
H. Larson, A. Bacher, K. Nagatani, T. Tombrello,
Neutron-neutron
effective range parameters from the and
reactions, Nuclear Physics A 149 (1) (1970) 161–196.
doi:10.1016/0375-9474(70)90385-4.
URL https://www.sciencedirect.com/science/article/pii/0375947470903854 -
[24]
R. J. Slobodrian, Final-state interactions,
Reports on Progress in Physics 34 (1) (1971) 175–282.
doi:10.1088/0034-4885/34/1/304.
URL 10.1088/0034-4885/34/1/304 -
[25]
B. Zeitnitz, R. Maschuw, P. Suhr, W. Ebenhöh,
Neutron-neutron
scattering parameters from a kinematically complete experiment
on the reaction , Phys. Rev. Lett. 28
(1972) 1656–1658.
doi:10.1103/PhysRevLett.28.1656.
URL https://link.aps.org/doi/10.1103/PhysRevLett.28.1656 -
[26]
B. Zeitnitz, R. Maschuw, P. Suhr, W. Ebenhöh, J. Bruinsma, J. H.
Stuivenberg,
Neutron-neutron
effective range parameters from kinematically complete experiments on the
reaction , Nucl. Phys. A 231 (1) (1974)
13–28.
doi:10.1016/0375-9474(74)90290-5.
URL https://www.sciencedirect.com/science/article/pii/0375947474902905 -
[27]
J. Kecskeméti, T. Czibók, B. Zeitnitz,
Investigation
of the reaction at = 0°, Nucl.
Phys. A 254 (1) (1975) 110–130.
doi:10.1016/0375-9474(75)90585-0.
URL https://www.sciencedirect.com/science/article/pii/0375947475905850 -
[28]
B. Gabioud, J.-C. Alder, C. Joseph, J.-F. Loude, N. Morel, A. Perrenoud, J.-P.
Perroud, M. T. Tran, E. Winkelmann, W. Dahme, H. Panke, D. Renker, Č. Zupančič, G. Strassner, P. Truöl,
n-n
scattering length from the photon spectra of the reactions and , Phys.
Rev. Lett. 42 (1979) 1508–1511.
doi:10.1103/PhysRevLett.42.1508.
URL https://link.aps.org/doi/10.1103/PhysRevLett.42.1508 -
[29]
B. Gabioud, J.-C. Alder, C. Joseph, J.-F. Loude, N. Morel, A. Perrenoud, J.-P.
Perroud, M. T. Trân, E. Winkelmann, W. Dahme, H. Panke, D. Renker,
G. Strassner, P. Truöl, G. F. de Téramond,
n-n
effective range from the photon spectrum of the reaction , Phys. Lett. B 103 (1) (1981) 9–12.
doi:10.1016/0370-2693(81)90182-9.
URL https://www.sciencedirect.com/science/article/pii/0370269381901829 -
[30]
B. Gabioud, J.-C. Alder, C. Joseph, J.-F. Loude, N. Morel, A. Perrenoud, J.-P.
Perroud, M. T. Tran, E. Winkelmann, W. Dahme, H. Panke, D. Renker,
G. Strassner, P. Truöl, G. F. De Téramond,
scattering parameters and from the photon spectrum of the
reaction , Nucl. Phys. A 420 (3) (1984)
496–524.
doi:10.1016/0375-9474(84)90669-9.
URL https://www.sciencedirect.com/science/article/pii/0375947484906699 -
[31]
V. A. Babenko, N. M. Petrov, Low-energy
parameters of neutron-neutron interaction in the effective-range
approximation, Phys. Atom. Nucl. 76 (2012) 684.
doi:10.1134/S1063778813060033.
URL 10.1134/S1063778813060033 -
[32]
S. V. Zuyev, E. S. Konobeevski, M. V. Mordovskoy, S. I. Potashev,
Study of the nd-breakup reaction in the
kinematical region of the nn final-state interaction, Bull. Rus. Acad. Sci.
Phys. 73 (6) (2009) 796–798.
doi:10.3103/S1062873809060215.
URL 10.3103/S1062873809060215 -
[33]
E. S. Konobeevski, Yu. M. Burmistrov, S. V. Zuyev, M. V. Mordovskoy,
S. I. Potashev, Determination of the
neutron-neutron scattering length in the nd breakup reaction
at energies in the range = 40-60 MeV, Phys. Atom. Nucl. 73 (8)
(2010) 1302–1308.
doi:10.1134/S106377881008003X.
URL 10.1134/S106377881008003X -
[34]
E. S. Konobeevsky, V. I. Kukulin, M. V. Mordovskoi, V. N. Pomerantsev, S. I.
Potashev, O. A. Rubtsova, V. A. Sergeev, S. V. Zuev, I. M. Sharapov,
Determination of neutron-neutron scattering
length from the nd-breakup reaction: Experimental and theoretical aspects,
Bull. Rus. Acad. Sci. Phys. 75 (4) (2011) 443.
doi:10.3103/S1062873811040265.
URL 10.3103/S1062873811040265 -
[35]
H. Witała, W. Glöckle, On the
discrepancies in the low-energy neutron–deuteron breakup, J
Phys. G 37 (6) (2010) 064003.
doi:10.1088/0954-3899/37/6/064003.
URL 10.1088/0954-3899/37/6/064003 - [36] H. Witała, W. Glöckle, The nn quasifree nd breakup cross section: Discrepancies with theory and implications for the nn force, Phys. Rev. C 83 (2011) 034004. doi:10.1103/PhysRevC.83.034004.
-
[37]
I. Slaus, J. W. Sunier, G. Thompson, J. C. Young, J. W. Verba, D. J.
Margaziotis, P. Doherty, R. T. Cahill,
Neutron-neutron
quasifree scattering, Phys. Rev. Lett. 26 (1971) 789–792.
doi:10.1103/PhysRevLett.26.789.
URL https://link.aps.org/doi/10.1103/PhysRevLett.26.789 -
[38]
E. Bovet, F. Foroughi, J. Rossel,
Neutron-neutron
quasifree scattering in the 2H(n, nn)p reaction at
MeV, Nucl. Phys. A 304 (1) (1978) 29–39.
doi:10.1016/0375-9474(78)90093-3.
URL https://www.sciencedirect.com/science/article/pii/0375947478900933 -
[39]
J. Soukup, J. Cameron, H. Fielding, A. Hussein, S. Lam, G. Neilson,
2H(n,
nn)p reaction at 21.5 MeV, Nucl. Phys. A 322 (1) (1979) 109–116.
doi:10.1016/0375-9474(79)90335-X.
URL https://www.sciencedirect.com/science/article/pii/037594747990335X -
[40]
H. Guratzsch, B. Kühn, H. Kumpf, J. Mösner, W. Neubert, W. Pilz, G. Schmidt,
S. Tesch,
Neutron-neutron
effective range from quasifree scattering 2H(n, nn)p at 25 MeV, Nucl.
Phys. A 342 (2) (1980) 239–251.
doi:10.1016/0375-9474(80)90252-3.
URL https://www.sciencedirect.com/science/article/pii/0375947480902523 -
[41]
W. von Witsch, B. Gómez Moreno, W. Rosenstock, R. Franke,
B. Steinheuer,
Neutron-neutron
effective range from a comparison of n-n and n-p quasi-free scattering at 24
MeV, Phys. Lett. B 91 (3) (1980) 342–344.
doi:10.1016/0370-2693(80)90991-0.
URL https://www.sciencedirect.com/science/article/pii/0370269380909910 - [42] W. Lübcke, Kinematisch vollständige messungen an der reaktion 2H(n,nn)1H bei En = 10 MeV in FSI-konfigurationen, Ph.D. thesis, University of Bochum (1992).
-
[43]
A. Siepe, J. Deng, V. Huhn, L. Wätzold, C. Weber, W. von Witsch,
H. Witała, W. Glöckle,
Neutron-proton and
neutron-neutron quasifree scattering in the n-d breakup reaction at 26
MeV, Phys. Rev. C 65 (2002) 034010.
doi:10.1103/PhysRevC.65.034010.
URL https://link.aps.org/doi/10.1103/PhysRevC.65.034010 -
[44]
X. C. Ruan, Z. Y. Zhou, X. Li, J. Jiang, H. X. Huang, Q. P. Zhong, H. Q. Tang,
B. J. Qi, J. Bao, B. Xin, W. von Witsch, H. Witała,
Experimental study
of neutron-neutron quasifree scattering in the breakup reaction
at 25 MeV, Phys. Rev. C 75 (2007) 057001.
doi:10.1103/PhysRevC.75.057001.
URL https://link.aps.org/doi/10.1103/PhysRevC.75.057001 -
[45]
W. Glöckle, H. Witała, D. Hüber, H. Kamada, J. Golak,
The
three-nucleon continuum: achievements, challenges and applications, Physics
Reports 274 (3) (1996) 107–285.
doi:10.1016/0370-1573(95)00085-2.
URL https://www.sciencedirect.com/science/article/pii/0370157395000852 -
[46]
R. C. Malone, A. S. Crowell, L. C. Cumberbatch, B. A. Fallin, F. Q. L. Friesen,
C. R. Howell, C. R. Malone, D. R. Ticehurst, W. Tornow, D. M. Markoff, B. J.
Crowe, H. Witała,
Neutron-neutron
quasifree scattering in neutron-deuteron breakup at 10 MeV, Phys. Rev. C
101 (2020) 034002.
doi:10.1103/PhysRevC.101.034002.
URL https://link.aps.org/doi/10.1103/PhysRevC.101.034002 - [47] G. Dietze, H. Klein, NRESP4 and NEFF4 monte carlo codes for the calculation of neutron response functions and detection efficiencies for NE 213 scintillation detectors, Tech. Rep. PTB-ND-22, Physikalisch-Technische Bundesanstalt, Braunschweig, Germany (1982).
-
[48]
M. Drosg, N. Otuka,
Evaluation
of the absolute angle-dependent differential neutron production cross
sections by the reactions 3H(p,n)3He, 1H(t,n)3He,
2H(d,n)3He, 3H(d,n)4He, and 2H(t,n)4He and of
the cross sections of their time-reversed counterparts up to 30 mev and
beyond, Tech. Rep. INDC(AUS)-0019, IAEA Nuclear Data Section, Vienna,
Austria (2015).
URL https://www-nds.iaea.org/publications/indc/indc-aus-0019.pdf -
[49]
M. Chadwick, M. Herman, P. Obložinský, M. Dunn, Y. Danon, A. Kahler,
D. Smith, B. Pritychenko, G. Arbanas, R. Arcilla, R. Brewer, D. Brown,
R. Capote, A. Carlson, Y. Cho, H. Derrien, K. Guber, G. Hale, S. Hoblit,
S. Holloway, T. Johnson, T. Kawano, B. Kiedrowski, H. Kim, S. Kunieda,
N. Larson, L. Leal, J. Lestone, R. Little, E. McCutchan, R. MacFarlane,
M. MacInnes, C. Mattoon, R. McKnight, S. Mughabghab, G. Nobre, G. Palmiotti,
A. Palumbo, M. Pigni, V. Pronyaev, R. Sayer, A. Sonzogni, N. Summers,
P. Talou, I. Thompson, A. Trkov, R. Vogt, S. van der Marck, A. Wallner,
M. White, D. Wiarda, P. Young,
ENDF/B-VII.1
nuclear data for science and technology: Cross sections, covariances, fission
product yields and decay data, Nuclear Data Sheets 112 (12) (2011) 2887 –
2996, special Issue on ENDF/B-VII.1 Library.
doi:10.1016/j.nds.2011.11.002.
URL https://www.sciencedirect.com/science/article/pii/S009037521100113X -
[50]
R. Skibiński, Yu. Volkotrub, J. Golak, K. Topolnicki,
H. Witała,
Theoretical
uncertainties of the elastic nucleon-deuteron scattering observables, Phys.
Rev. C 98 (2018) 014001.
doi:10.1103/PhysRevC.98.014001.
URL https://link.aps.org/doi/10.1103/PhysRevC.98.014001