Pressure-induced structural phase transition of vanadium:
A revisit from the perspective of ensemble theory
Abstract
For realistic crystals, the free energy strictly formulated in ensemble theory can hardly be obtained because of the difficulty in solving the high-dimension integral of the partition function, the dilemma of which makes it even a doubt if the rigorous ensemble theory is applicable to phase transitions of condensed matters. In the present work, the partition function of crystal vanadium under compression up to GPa at room temperature is solved by an approach developed very recently, and the derived equation of state is in a good agreement with all the experimental measurements, especially the latest one covering the widest pressure range up to 300 GPa. Furthermore, the derived Gibbs free energy proves the very argument to understand most of the experiments reported in the past decade on the pressure-induced phase transition, and, especially, a novel phase transition sequence concerning three different phases observed very recently and the measured angles of two phases agree with our theoretical results excellently.
The structural phase transition of crystal vanadium (V) under high pressure at room temperature attracts a long-time interests. Although it had been already a consensus that the BCC phase is highly stableTakemura (2000) and early experiments affirmed this stability up to GPaNakamoto et al. (2005), theoretical works based on calculations of phonon mode softening and trigonal shear elastic instability predicted a likely structural transformation within a range from GPaSuzuki and Otani (2002) to GPaLanda et al. (2006a, b), which inspired an experimentDing et al. (2007) in year 2007 showing that a phase transition does take place at about GPa. Specifically, the BCC phase transits into a rhombohedral (RH) structure with the RH angle () denoted as RH1 to distinguish from a similar structure RH2 with .
The above mentioned phase transition was further confirmed by later experiments Jenei et al. (2011); Yuying et al. (2014); Errandonea et al. (2019); Wang et al. (2021); Daniele et al. (2016), and the relevant theoretical works, based on either approximate calculations of free energyYi X. et al. (2016); Qiu and Marcus (2008) or ab initio lattice dynamicsLuo et al. (2007); A. K. and P. (2007); Lee et al. (2007, 2008); Landa et al. (2018), reached a qualitative agreement that the transition pressure () would be GPa for BCCRH1, and predicted that for RH RH2 and RH BCC are around and GPa respectively. Nevertheless, two experiments reported in year 2021Akahama et al. (2021); Stevenson et al. (2021) exhibited different results. Akahama et al.Akahama et al. (2021) compressed foil V up to GPa at room temperature and found that BCC lattice is a stable phase until the RH2 and BCC phase coexisting at pressure () larger than GPa, while the RH1 phase is a metastable phase caused by nonhydrostatic pressure effects. Stevenson et al.Stevenson et al. (2021), on the other hand, observed that the BCC lattice transform into RH2 when GPa and then turns back to BCC until RH1 emerges for GPa. It is noticeable that the measured by Stevenson et al. for RH1 (or RH2) is (or ), which is significantly different from the theoretical result, (or ) for RH1 (or RH2).
In the viewpoint of statistical mechanics, all the discrepancies stated above as well as others mentioned in literaturesUshcats et al. (2016); Martynov (1999); Hansen and van Gunsteren (2014) should be settled down as long as the partition function (PF) can be obtained to produce the free energy (FE). Unfortunately, the exact solution to the PF of condensed matters is almost impossible because of the -fold configurational integral, and various approximationsLiu (2020), such as the one in Ref.Qiu and Marcus (2008), were developed to calculate the FE without knowledge of the PF. As expected, those approximated methods provided lots of interesting information on the phase transitions of condensed matters, while may not address all the issues substantially.
Very recently, we put forward a direct integral approach (DIA) to the PF of condensed state systems with ultrahigh efficiency and precisionNing et al. (2021); Liu et al. (2019); Gong et al. (2019, 2020), and has been successfully applied to reproduce the equation of state (EOS) for solid copperNing et al. (2021), argonGong et al. (2019) and -D materialsLiu et al. (2019) obtained from experiments or molecular dynamics simulations. Compared with phonon model based on harmonic or quasi-harmonic approximations, which is currently applied to produce EOS, DIA is applicable to much wider realm with much higher precisionGong et al. (2020). In the present work, DIA is used to compute the PF of crystal V with various phases and the derived Gibbs FE is applied to investigate the phase transitions induced by pressure at room temperature.
For a crystal containing atoms confined within volume at temperature , the atoms are regarded as point particles of the atomic mass with Cartesian coordinate , and the total potential energy, , as the function of is computed by quantum mechanics, i.e., for a given set of , the total potential energy concerned with the motions of electrons in the field of the nucleus fixed at the lattice sites is calculated by quantum mechanics. With knowledge of , the PF of the system reads
| (1) |
where is the Planck constant and with the Boltzmann constant. If the configurational integral is solved, then the pressure and the Gibbs FE can be computed by
| (2) | |||||
| (3) |
In this way, the contributions from both the electrons and nucleus are included in the calculations.
According to our proposed DIANing et al. (2021), for a single-component crystal with atoms placed in their lattice sites and with the total potential energy , we firstly introduce a transformation,
| (4) |
where represents the displacements of atoms away from their lattice positions, and then the configurational integral can be expressed in a one-fold integral,
| (5) |
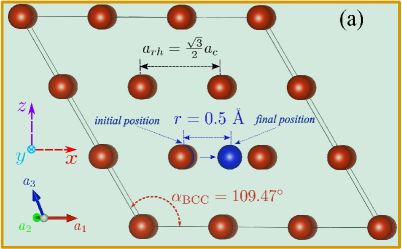
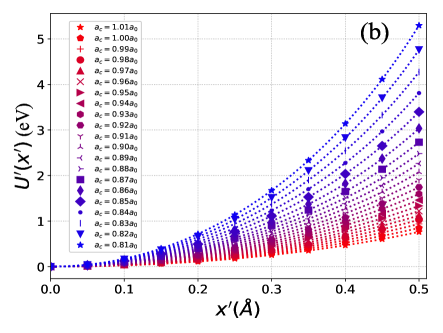
where denotes the distance of the th atom moving along the (or , ) direction relative to its lattice site while the other two degrees of freedom of the atom and all the other atoms are kept fixed. As shown in Fig.1, we take BCC structure of V placed in a RH supercell as an example to illustrate the implementation of the DIA. The basis vectors of the primitive cell are set as , , and the volume of the cell equals to , where with for the lattice constant of a cubic primitive cell. According to Eq.(5), an arbitrary atom is selected and moved Å by a step of Å along the direction of as shown in Fig.1(a) with the initial and final positions of the atom colored in blue. During the movement, the total potential energy is computed by the density functional theory (DFT) at every steps and the spline interpolation algorithmDierckx (1975); *spl2 is used to smooth the curves, which are shown in Fig.1(b).
The DFT calculations is performed in Vienna Ab initio Simulation PackageKresse and Furthmüller (1996a, b) with the projector-augmented wave formalismBlöchl (1994); Kresse and Joubert (1999), and the general gradient approximation of the Perdew-Burke-Ernzerhf parametrizationsPerdew et al. (1996) is adopted for the exchange-correlation functional with 13 valence electrons () consideredZhang et al. (2021). A -centered uniform -mesh grid is set to sample the Brillouin zone by the Monkhorst-Pack schemeMonkhorst and Pack (1976) and the tetrahedron method with Blöchl corrections is used to determine the electron orbital partial occupancy, together with eV set as the cut-off energy of the plane-wave basis, eV as the convergence energy criterion of the electron self-consistent computations.
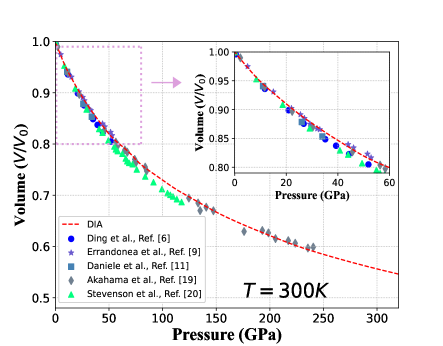
As shown in Fig.2, the isothermal - curve derived from the PF via Eq.(2) coincides very well with the experiments, which can be seen from the relative difference (RD) between the theoretical volume and the experimental one , defined as RD, where and are the theoretical and experimental atomic volumes under ambient conditions (room temperature and one atmospheric pressure). In the low-pressure zone ( GPa), the average RD for all the shown experiments is about , which can be seldom achieved in common theoretical work without using empirical data or empirical EOS. In the higher-pressure zone ( GPa), the RD for all the experiments except for the one of Ref.Akahama et al. (2021) get a little larger with the pressure increasing, which may be attributed to the difficulty in precise measurements of higher pressure in considerations of the fact that the results of different experiments diverge larger with increases of the pressure (see the experimental points shown in the inset of Fig.2). It is worthwhile to see that the RD for one of the latest experimentsAkahama et al. (2021) (grey diamonds shown in Fig.2), covering the widest pressure range, keeps to be smaller than except for three pressure points at , and GPa. Such an excellent agreement enables us to theoretically determine the lattice constant under exactly given pressure and temperature. As listed in Table.1, the RD between the theoretical and the experimental ones is smaller than , exhibiting a good agreement.
It should be pointed out that the implementation of DIA excludes all the artificial dependence of adjustable parameters, empirical EOS or experimental data, and accordingly, the good agreements between the theory and the experiments for the EOS and the lattice constant strongly indicate that the ensemble theory is the very approach to understand the thermodynamics properties of condensed matters.
| DIA | Ref.Errandonea et al. (2019) | Ref.Daniele et al. (2016) | Ref.Akahama et al. (2021) | Ref.Stevenson et al. (2021) | |
| (Å) | 3.008 | 3.029 | 3.03 | 3.027 | 3.023 |
| Deviations | / | ||||
| EOS | / | B-M | no report | Vinet | AP2 |
To consider the transitions of crystal V from the BCC to RH phases with the angle different from , the PF of four RH1 and RH2 phases with the angle deviation, , , , and is solved by the DIA in the same way as described above (see potential-energy curves of the RH phases in supplementary material), and, the derived Gibbs FE differences between the RH and BCC per atom, , are shown in Fig.3(a). When the amplitude of the angle deviation, , equals to , the Gibbs FE of both RH1 and RH2 is close to , and increases abruptly to be larger than by more than meV/atom with the increased by only , while further increasing the angle deviation leads to a little changes of . These results show clearly, based on the Gibbs FE criterion, that the phase transition with the angle equal to or larger than cannot take place unless the deviation being smaller, and furthermore, Fig.3(b) indicates that the two phases, RH1 with a deviation of and RH2 with a deviation of , would emerge when the pressure is larger than GPa. It is interesting to note that the phase transition was very recently examined by Stevenson et al.Stevenson et al. (2021) who concluded that two kinds of phase transitions, BCC RH1 and BCC RH2, indeed take place, qualitatively coinciding with the previous experiments or theories, and the determined RH angle for RH1 (or RH2) is (or ), corresponding to as our theoretical results, which is a little smaller than the one, for RH1, measured in previous experimentDing et al. (2007); Jenei et al. (2011) where RH2 was not observed, but significantly different from the theoretically predicted (or )Luo et al. (2007); Lee et al. (2007); A. K. and P. (2007); Qiu and Marcus (2008); Yi X. et al. (2016), corresponding to . Since the unique difference between BCC and RH1 (or RH2) phase is the RH angle deviation of about only , it should be quite a challenge for experimental observations of the subtle difference, which may be the reason why early literatures reported no phase transitions for V induced by pressure less than GPaNakamoto et al. (2005).
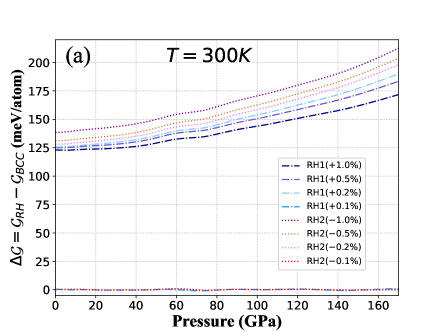
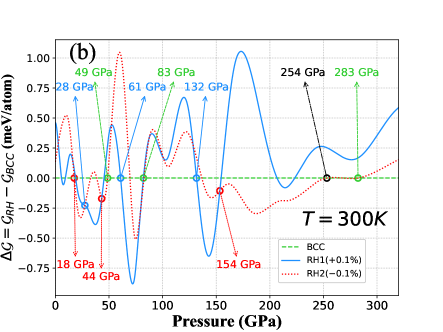
Now we make a detailed comparison between our theoretical results and the experimental observations. As shown in Fig.3(b), the Gibbs FE of the RH1 and RH2 differ from that of BCC less than meV, which is much smaller than the average kinetic energy, meV, of a thermal atom at room temperature, and it seems that RH1 or RH2 is just the thermal fluctuation from the BCC structure instead of a phase transition. Actually, the very “driving force” accounting for the phase transition under given pressure and temperature is not the thermal kinetic energy (or internal energy), but instead, the Gibbs FE that determines the probability for a given phase existence. According to ensemble theory, the relative probability for RH with respective to BCC equals to , where , , and the number of the atoms in a piece of macro bulk crystal is on an order of . Thus, our calculation results indicate clearly that the phase transition BCC RH2 must take place at room temperature when the pressure is larger than GPa, and then RH1 emerges at GPa. This RH1 transition was observed by Jenei et al.Jenei et al. (2011) at GPa and by Daniele et al.Daniele et al. (2016) at GPa, respectively. As the pressure increasing, our results show that RH2 would emerge at GPa, then transforms back to BCC for the pressure larger than GPa until RH1 emerges at GPa, displaying a transition process, RH BCC RH1, with the pressure increased. Experimentally, Akahama et al.Akahama et al. (2021) observed a RH phase comes to existence from GPa, and the BCC RH1 transition was reported at GPa in Ref.Ding et al. (2007), GPa in Ref.Yuying et al. (2014) and GPa in Ref.Errandonea et al. (2019), which are all in a good agreement with our results, in considerations of the deviations among the measured pressures being of GPa. It is noticeable that the RH BCC RH1 transition sequence, neither observed in earlier experiments nor proposed by previous computations, was observed in the one of the latest experimentsStevenson et al. (2021), and the measured transition pressure of RH2, GPa, coincides with our theoretical one, GPa. When the pressure is increased larger than GPa, our results indicate that RH1 would exist until RH2 transition occurs at GPa and the RH2 phase keeps stable with the pressure up to GPa, over which the BCC may coexist with RH2 until the pressure increases up to GPa when BCC becomes the most stable for higher pressures. It is very interesting to note that this coexistence phase of RH2 and BCC, never reported in previous literatures, was observed by Akahama et al.Akahama et al. (2021) very recently at GPa.
The above discussions show that most results of our calculations coincide well with the experiments, especially the EOS, the angle deviations of the RH and some transition pressures, such as , , , GPa for BCC RH1, RH2 existence, BCC and coexistence of RH2 and BCC, respectively. Based on these facts, it should be reasonable to expect that the disagreements between our results and the experimental observations, such as the theoretical phase transition under GPa, which was not reported in all the experiments, may be settled down by future experiments.
In conclusion, the rigorous ensemble theory is applied, for the first time, to investigate phase transitions of crystal V via DIA solving the PF without any artificial tunable parameters or empirical EOS, achieving very good agreements with experimental measurements and observations, and showing that the theory is substantial to describe phase transitions of condensed matters. The theoretical approach of this work may find its vast applications in the field to predict parameter-free EOS and phase behaviors of condensed matters under extreme conditions.
I acknowledgement
BYN is grateful to A. Daniele, M. McMahon and Y. Akahama for their kindly providing the raw experimental data in Refs.Daniele et al. (2016), Akahama et al. (2021) and Stevenson et al. (2021), respectively. Part of the computational tasks was conducted in HPC platform supported by The Major Science and Technology Infrastructure Project of Material Genome Big-science Facilities Platform supported by Municipal Development and Reform Commission of Shenzhen.
References
- Takemura (2000) K. Takemura, Science and Technology of High Pressure, edited by M. H. Manghnani, W. J. Nellis, and M. F. Nicol (Universities Press, Hyderabad, India, 2000) p. 443.
- Nakamoto et al. (2005) Y. Nakamoto, K. Takemura, M. Ishizuka, K. Shimizu, and T. Kikegawa, in Joint AIRAPT - EHPRG, Karlsruhe/Germany (2005).
- Suzuki and Otani (2002) N. Suzuki and M. Otani, J. Phys.: Condens. Matter 14, 10869 (2002).
- Landa et al. (2006a) A. Landa, J. Klepeis, P. Söderlind, I. Naumov, O. Velikokhatnyi, L. Vitos, and A. Ruban, Journal of Physics: Condensed Matter 18, 5079 (2006a).
- Landa et al. (2006b) A. Landa, J. Klepeis, P. Söderlind, I. Naumov, and O. Velikokhatnyi, J. Phys. Chem. Solids 67, 2056 (2006b).
- Ding et al. (2007) Y. Ding, R. Ahuja, J. Shu, P. Chow, W. Luo, and H.-k. Mao, Phys. Rev. Lett. 98, 085502 (2007).
- Jenei et al. (2011) Z. Jenei, H. P. Liermann, H. Cynn, J.-H. P. Klepeis, B. J. Baer, and W. J. Evans, Phys. Rev. B 83, 054101 (2011).
- Yuying et al. (2014) Y. Yuying, T. Ye, D. Chengda, L. Xuemei, L. Yinghua, W. Qiang, and T. Hua, Appl. Phys. Lett. 105, 201910 (2014).
- Errandonea et al. (2019) D. Errandonea, S. G. MacLeod, L. Burakovsky, D. Santamaria-Perez, J. E. Proctor, H. Cynn, and M. Mezouar, Phys. Rev. B 100, 094111 (2019).
- Wang et al. (2021) H. Wang, J. Li, X. M. Zhou, Y. Tan, L. Hao, Y. Y. Yu, C. D. Dai, K. Jin, Q. Wu, Q. M. Jing, X. R. Chen, X. Z. Yan, Y. X. Wang, and H. Y. Geng, Phys. Rev. B 104, 134102 (2021).
- Daniele et al. (2016) A. Daniele, F. Daniel L., B. Alexei, A. Chantel M., R. David G., and K. Michael, Sci. Rep. 6, 31887 (2016).
- Yi X. et al. (2016) W. Yi X., W. Q., C. Xiang R., and G. Hua Y., Sci. Rep. 6, 32419 (2016).
- Qiu and Marcus (2008) S. Qiu and P. Marcus, J. Phys.: Condens. Matter 20, 275218 (2008).
- Luo et al. (2007) W. Luo, R. Ahuja, Y. Ding, and H.-k. Mao, Proc. Natl Acad. Sci. 104, 16428 (2007).
- A. K. and P. (2007) V. A. K. and M. P., Europhysics Letters 81, 37003 (2007).
- Lee et al. (2007) B. Lee, R. E. Rudd, J. E. Klepeis, P. Söderlind, and A. Landa, Phys. Rev. B 75, 180101 (2007).
- Lee et al. (2008) B. Lee, R. E. Rudd, J. E. Klepeis, and R. Becker, Phys. Rev. B 77, 134105 (2008).
- Landa et al. (2018) A. Landa, P. Söderlind, I. I. Naumov, J. E. Klepeis, and L. Vitos, Computation 6, 29 (2018).
- Akahama et al. (2021) Y. Akahama, S. Kawaguchi, N. Hirao, and Y. Ohishi, J. Appl. Phys. 129, 135902 (2021).
- Stevenson et al. (2021) M. G. Stevenson, E. J. Pace, C. V. Storm, S. E. Finnegan, G. Garbarino, C. W. Wilson, D. McGonegle, S. G. Macleod, and M. I. McMahon, Phys. Rev. B 103, 134103 (2021).
- Ushcats et al. (2016) M. V. Ushcats, L. A. Bulavin, V. M. Sysoev, V. Y. Bardik, and A. N. Alekseev, J. Mol. Liq. 224, 694 (2016).
- Martynov (1999) G. A. Martynov, Phys. Usp. 42, 517 (1999).
- Hansen and van Gunsteren (2014) N. Hansen and W. F. van Gunsteren, J. Chem. Theory Comput. 10, 2632 (2014).
- Liu (2020) Z.-K. Liu, Acta Materialia 200, 745 (2020).
- Ning et al. (2021) B.-Y. Ning, L.-C. Gong, T.-C. Weng, and X.-J. Ning, J. Phys.: Condens. Matter 33, 115901 (2021).
- Liu et al. (2019) Y.-P. Liu, B.-Y. Ning, L.-C. Gong, T.-C. Weng, and X.-J. Ning, Nanomaterials 9, 978 (2019).
- Gong et al. (2019) L.-C. Gong, B.-Y. Ning, T.-C. Weng, and X.-J. Ning, Entropy 21, 1050 (2019).
- Gong et al. (2020) L.-C. Gong, B.-Y. Ning, C. Ming, T.-C. Weng, and X.-J. Ning, J. Phys.: Condens. Matter 33, 085901 (2020).
- Dierckx (1975) P. Dierckx, Journal of Computational and Applied Mathematics 1, 165 (1975).
- Dierckx (1985) P. Dierckx, SIAM J.Numer.Anal 19, 1286 (1985).
- Kresse and Furthmüller (1996a) G. Kresse and J. Furthmüller, Comput. Mat. Sci. 6, 15 (1996a).
- Kresse and Furthmüller (1996b) G. Kresse and J. Furthmüller, Phys. Rev. B 54, 11169 (1996b).
- Blöchl (1994) P. E. Blöchl, Phys. Rev. B 50, 17953 (1994).
- Kresse and Joubert (1999) G. Kresse and D. Joubert, Phys. Rev. B 59, 1758 (1999).
- Perdew et al. (1996) J. P. Perdew, K. Burke, and M. Ernzerhof, Phys. Rev. Lett. 77, 3865 (1996).
- Zhang et al. (2021) T. Zhang, Y. Wang, J. Xian, S. Wang, J. Fang, S. Duan, X. Gao, H. Song, and H. Liu, Matter Radiat. Extremes 6, 068401 (2021).
- Monkhorst and Pack (1976) H. J. Monkhorst and J. D. Pack, Phys. Rev. B 13, 5188 (1976).