Majorana Collaboration
Search for charge nonconservation and Pauli exclusion principle violation with the Majorana Demonstrator
Abstract
Charge conservation and the Pauli exclusion principle (PEP) result from fundamental symmetries in the Standard Model, and are typically taken as axiomatic. High-precision tests for small violations of these symmetries could point to new physics. In this work we consider three models for violation of these processes which would produce detectable ionization in the high-purity germanium detectors of the Majorana Demonstrator. Using a 37.5 kg-yr exposure, we report a new lower limit on the electron mean lifetime of yr (90% CL), the best result for this decay channel ( or more generally ) in more than two decades. We also present searches for two types of violation of the PEP, setting new limits on the probability of two electrons forming a symmetric quantum state. Using our 228Th calibration data set, which introduces electrons new to the system through electron-positron pair production, we obtain a world-leading model-independent limit for a terrestrial experiment of (99.7% CL). Our 37.5 kg-yr exposure is also used to search for a process where an electron in an atomic system spontaneously violates the PEP, resulting in a model-dependent upper limit of (90% CL).
pacs:
23.40-s, 23.40.Bw, 14.60.Pq, 27.50.+j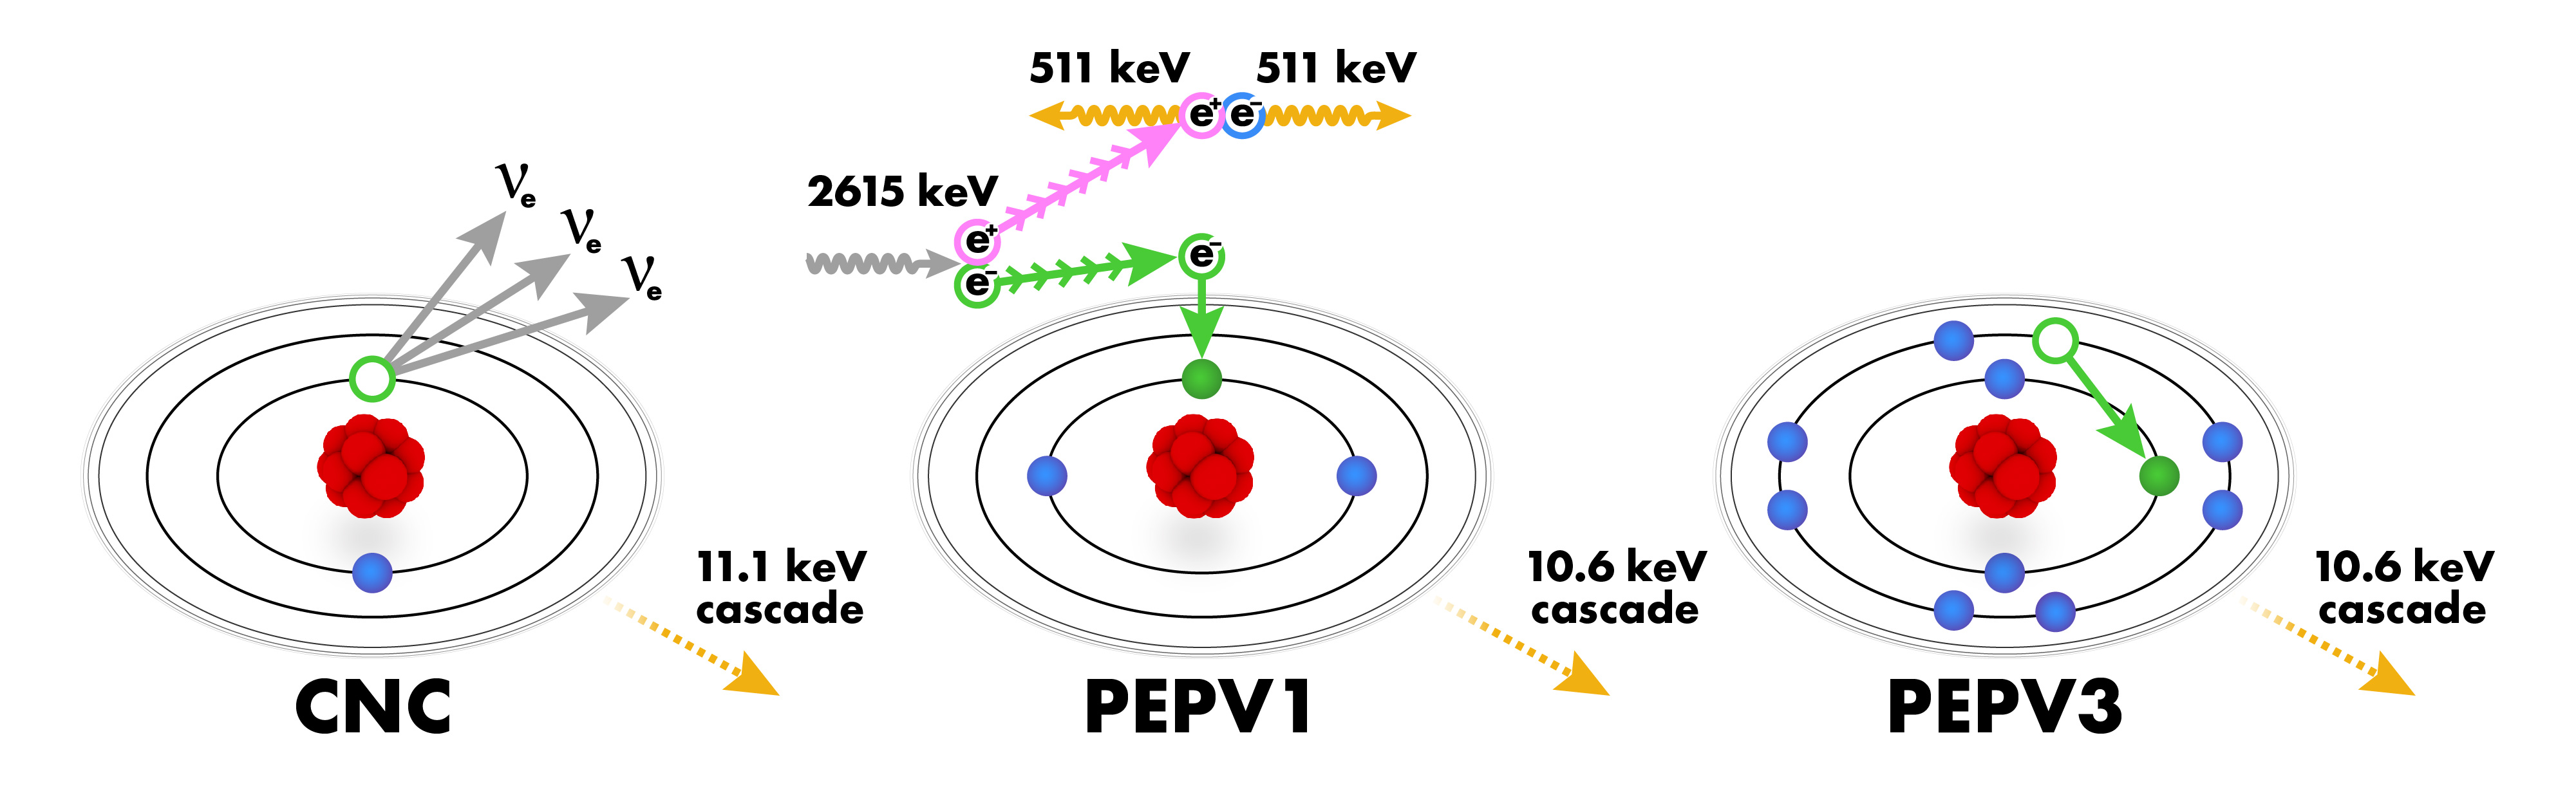
Searches for small violations of fundamental symmetries have driven modern experimental physics, from the discovery of parity nonconservation in -decay [1], to tests disproving Bell’s inequality [2, 3, 4]. In this work we consider two well-validated principles of quantum mechanics, charge conservation and Pauli exclusion, which emerge from robust mathematical frameworks and are typically taken as axioms. Many models have been proposed which allow their violation by exotic mechanisms [5, 6, 7, 8, 9, 10, 11, 12, 13], and point to signs of new physics.
Large underground radiation detectors offer a novel environment to search for rare signals produced by such symmetry violations. The Majorana Demonstrator, a high-purity germanium (HPGe) array, has world-leading energy resolution and ultra-low levels of radioactive backgrounds, and in addition to its primary search for neutrinoless double beta decay [14, 15], it has been used to search for bosonic dark matter [16, 17], fractionally charged particles [18], trinucleon decay [19], and signatures of quantum wavefunction collapse [20].
The Demonstrator consists of two separate modules of p-type point contact (PPC) HPGe detectors, with 29.7 kg enriched in 76Ge, and collected an ultimate exposure of 65 kg-yr [15]. From this primary data set, an exposure of 37.5 kg-yr of enrGe data was selected for analysis of the 1–100 keV low-energy range. To produce the final spectrum, a series of analysis cuts are applied which remove events from electronics noise and energy-degraded surface events, while retaining bulk events above 20 keV with 92% efficiency [17]. The enrGe detectors achieved background rates of 0.01 counts/(keV kg d) from 20–40 keV and 0.06 counts/(keV kg d) at 5 keV through use of highly radiopure materials, the deep underground location, and careful control of the surface exposure time. In the spectrum, we observe a nearly flat continuum consisting of Compton scatter events between 20–100 keV, with contributions from 3H, 55Fe, and 68Ge below 20 keV.
In this work, we present an experimental test of charge conservation, searching for the spontaneous disappearance of an electron to “invisibles” (no photons), with the most favorable mode being to three neutrinos, [21]. Our result for the mean lifetime of the electron is the best in more than two decades [22]. We then report new limits on violations of the Pauli exclusion principle, which would also have a detectable ionization signature in our HPGe array. These “forbidden” mechanisms considered are illustrated in Fig. 1.
I Test of Electric Charge Conservation
Conservation of electric charge arises from the global U(1) symmetry gauge invariance of the electric field [23]. The photon is the associated gauge boson, massless and exactly symmetric under gauge transformation with an unobservable quantum phase. Extremely small experimental upper limits on the photon mass are generally considered to be evidence of exact electric charge conservation. However, there are theoretical BSM frameworks which allow electric charge nonconservation, either by broken gauge symmetry or by hidden processes such as charge leakage into extra dimensions [24, 25, 26, 27].
Violation of charge conservation implies that electrons, the lightest charged leptons, may have a finite lifetime. Hence, the conservation of electric charge can be tested by searching for the decay of electrons to chargeless particles with lighter mass, such as neutrinos and photons. Experiments have set limits on the decay process by searching for a peak at 255.5 keV, with the best result from Borexino giving a mean lifetime y [28]. The electron may also decay without a photon to multiple neutrinos or other unknown chargeless BSM particles, often referred to as a “disappearance” mode. Decay to three neutrinos is considered the most favorable of these modes, being comprised of known particles which can balance angular momentum and conserve lepton number. In general, a search for electron disappearance would include effects from any “invisible” mechanism, not only the three-neutrino mode. Disappearance mechanisms to date give lifetimes on the order of years [21], and we point out that if more than one decay mode is available for an electron, the channel with the shorter lifetime will be favored.
Data from the low-background physics run of the Demonstrator can be used to search for decay of atomic electrons within the HPGe detectors. If a K-shell (ground state) electron in a Ge atom decays to neutrinos (or other invisibles), a hole is produced in the shell, and electrons in higher shells will cascade to fill it, emitting X-rays and Auger electrons until the full binding energy (11.1 keV) is released. This cascade occurs in a short time scale relative to the HPGe charge collection time, making the signature of this process a Gaussian peak in the spectrum at 11.1 keV.
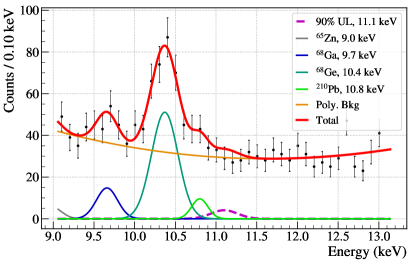
We perform an unbinned maximum likelihood fit in the region of interest, and extract an upper limit on the potential contribution from an absent peak by varying the number of counts in the peak and profiling the likelihood function to a particular confidence level (90%, 95%, or 99%) to compare with previous literature values. The excellent energy resolution allows discrimination from the nearby 10.37 keV X-ray line originating from 68Ge electron capture decay, and the acceptance efficiency of the pulse shape analysis cuts is ()% at 11.1 keV. The energy calibration provided by the analysis is validated by observation of the 10.37 keV line at the expected energy. The background function is a second-order Chebyshev polynomial, and nearby cosmogenic peaks are included in the model. This method is the same one used to search for peaked signatures for exotic dark matter in Ref. [17] and further details are given in Sec. A. The fit result is shown in Fig. 2, giving a 90% upper limit on the event rate at 11.1 keV of counts/(kg-d). The limit on the mean lifetime is calculated from the upper limit on the decay rate per unit time , the number density of Ge atoms, /kg, and two K-shell electrons for each Ge atom, . We find a mean lifetime of y at 90% CL, the most stringent limit for this decay channel by a factor 13 over Ref. [22].
II Tests of Pauli Exclusion Principle Violation
The Pauli exclusion principle (PEP) states that two identical fermions cannot occupy the same quantum state [29]. In modern quantum mechanics, it is understood to originate from the spin-statistics theorem, which describes the antisymmetric behavior of fermions in quantum systems [30]. Many mechanisms of PEP-violation have been proposed, making a direct comparison difficult [31, 32, 8, 9, 33, 34]. Experimental tests of the PEP may set limits on the probability of two fermions to form a symmetric quantum state. In this work it is taken to be a ratio of lifetimes between PEP-obeying (antisymmetric) and PEP-violating (symmetric) atomic transitions of electrons,
| (1) |
The transitions in which a model allows the PEP to be violated are determined by the initial symmetric states of the electron. In particular, the Messiah-Greenberg superselection rule [35] forbids transitions of individual electrons between antisymmetric and symmetric states, allowing only newly created electrons, or electrons already in a symmetric state, to make the transition. As electrons in symmetric states have not been observed, the newly created ones are the only model-independent test currently available. This constraint, however, can be evaded by exotic physics such as the existence of extra dimensions or electron substructure [36, 37]. More recently, it has been proposed that the violation of the spin-statistics theorem and hence PEP violation can emerge naturally from quantum gravity [38]. The paper by Elliott et al. [39] reviews the experimental and theoretical considerations. Following this framework, processes that can violate the PEP are classified into three categories:
-
•
Type I interactions are between a system of electrons and a PEP-violating electron that has not previously interacted with other electrons. A newly created electron from pair production has not established previous symmetry with any system, and a PEP-violating process is allowed by any model. It can travel a short distance between atoms before interacting with (or being captured by) an atomic shell.
-
•
Type II interactions are between a system of electrons and an electron that has not previously interacted with that given system. An electron may be created (or already exist in a steady state), travel some distance, and interact with another system such as an atom, e.g. through an electric current, with some probability of PEP violation.
-
•
Type III interactions are between a system of electrons and an electron within that given system. This is the most model-dependent search, since the PEP-violating electron is already in a steady state in its host atom.
Each type of PEP violation can be tested experimentally with HPGe detectors, and tests of Types I and III are possible with the Demonstrator data set. A Type I search is performed using the 228Th calibration data, and a Type III search is performed with the 37.5 kg-yr low-energy background data. A Type II search has been done previously in Ref. [39] with a prototype Majorana detector, using electrical current through Pb as the transition source, and more recently the VIP-2 experiment has improved this limit [40, 41]. We note that in the final state, a PEP-violating electron could in principle persist in the K shell indefinitely, which would change the chemical properties of the atom and be detectable by spectroscopic methods [42]. Ref. [39] considers these long-lived final states unlikely, and the PEP-violating electron could subsequently decay (e.g. to three neutrinos).
II.1 Type I PEP Violation: Electrons generated by pair production in 228Th calibration data
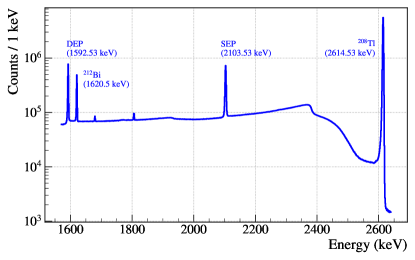
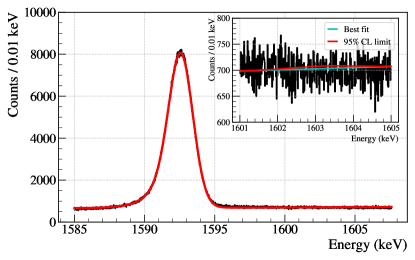
The calibration system of the Demonstrator consists of twin 228Th line sources, periodically introduced into the system for weekly 60-90 minute calibrations of each module and periodic longer runs. We utilize 40.43 days from the first detector module, and 21.38 days from the second module. The signature of Type I PEP violation in the Majorana calibration data set can be observed from pair production events produced by 2614.5 keV gamma rays from the decay of 208Tl in the 228Th line source (Fig. 1), which create electron-positron pairs in the detectors. The positron annihilation produces two 511.0 keV gamma rays, and one or both may escape the detector, creating single-escape peak (SEP) events at 2103.5 keV and double-escape peak (DEP) events at 1592.5 keV. If the PEP is violated, the pair-produced electron may be captured by a Ge atom and transition to the already occupied K shell. The transition energy of this forbidden process and the cascade of electrons to fill the empty L-shell will add up to release 10.6 keV of energy, when correcting for the additional shielding of the nuclear charge when the K shell is occupied [39]. The full-energy peak contains a significant contribution of ionization events with no pair production, which precludes its use in our search. The additional cascade produced by the PEP-violating capture to the K shell sums with the SEP or DEP energy, making the signature of the transition a peak 10.6 keV above the SEP and DEP peaks. The best prior limit for this process is ( CL) [39] achieved by using a single HPGe detector and 228Th source. Our calibration runtime and active detector mass are both significantly larger, comprising a multi-year run of the Demonstrator. The spectrum used for our Type I search is shown in Fig. 3, with standard data cleaning and quality cuts applied [43].
| method | 95% CL | (99.7%) CL |
|---|---|---|
| SEP + DEP | ||
| SEP | ||
| DEP |
Analysis of the peaks 10.6 keV above the SEP (2104 keV) and DEP (1592 keV) peak can be done separately or with a combined fit. Since is defined in terms of the ratio , many systematics including uncertainties in efficiency and exposure cancel out, resulting in a more robust search. For each detection method, we employ a binned likelihood fit approach adapted to a variable binning, to reduce statistical and systematic errors associated with each peak. The SEP and DEP are fit with a precision peakshape function to reduce systematic error [43], while the PEP-violating peak 10.6 keV above is counted using a single bin to minimize statistical error and measure the rate only. The primary peak is selected to compute an upper limit on , and the upper region gives . This allows us to compute the lifetimes and and set limits on , by performing a simple counting analysis of the events in each peak.
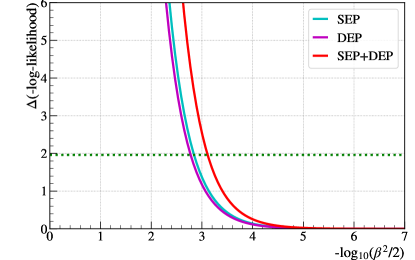
The sensitivity of the three detection techniques depends on the signal peak and background count rates at each energy, and the results from each method are given in Table 1 and Fig. 4. Our most stringent result is obtained from a combined fit of the SEP+DEP regions of interest, at 99.7% CL (). This is currently the best of all terrestrial Type I PEP violation searches, improving the previous best limit by 30%.
II.2 Type III PEP Violation: Electron transition in low-energy background data
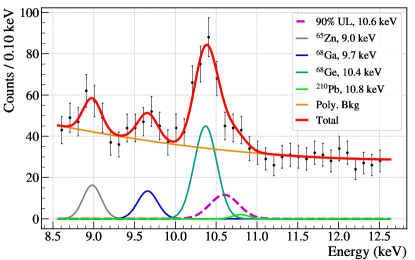
We also searched for Type-III PEP-violating transition of an L-shell electron in a Ge atom to the already occupied K-shell [10, 16], shown in Fig. 1. The signature of this process is a Gaussian peak at 10.6 keV, which would appear as a shoulder on the 10.37 keV 68Ge peak. Similar to the CNC search, we search for the PEP-violating atomic transition with the 37.5 kg-yr low-energy data set. The total efficiency of the low-energy cuts is ()% at 10.6 keV, and we set an upper limit of the count rate in the spectrum at the region of interest with the same profile likelihood technique.
We find an upper limit on the count rate at 10.6 keV, counts/kg-d (90% CL), shown in Fig. 5. We then calculate the mean lifetime using the same expression for lifetime as in Sec. II.1, . We find a mean lifetime of s (90 % CL). Majorana previously set the most stringent upper limit at 90% CL on this process, at with 478 kg-d exposure [16]. Comparing to the s mean lifetime of a standard K- transition in Ge, we set an improved limit on the PEP-violating transition at (90% CL), a factor 8.9 improvement over the previous limit [16].
II.3 Discussion
Low-background underground radiation detectors offer a unique enviroment to search for weak signatures from nonstandard processes. This work is an important complement to searches such as VIP-2 [40, 41], which search for Type-II PEP-violation by circulating large numbers of charge carriers through a sensitive detection volume. Larger Ge arrays with lower backgrounds are currently in active development [44] and an order-of-magnitude improvement in these tests of fundamental quantum mechanical principles may soon be attained.
Acknowledgements.
This material is based upon work supported by the U.S. Department of Energy, Office of Science, Office of Nuclear Physics under contract / award numbers DE-AC02-05CH11231, DE-AC05-00OR22725, DE-AC05-76RL0130, DE-FG02-97ER41020, DE-FG02-97ER41033, DE-FG02-97ER41041, DE-SC0012612, DE-SC0014445, DE-SC0018060, DE-SC0022339, and LANLEM77/LANLEM78. We acknowledge support from the Particle Astrophysics Program and Nuclear Physics Program of the National Science Foundation through grant numbers MRI-0923142, PHY-1003399, PHY-1102292, PHY-1206314, PHY-1614611, PHY-1812409, PHY-1812356, PHY-2111140, and PHY-2209530. We gratefully acknowledge the support of the Laboratory Directed Research & Development (LDRD) program at Lawrence Berkeley National Laboratory for this work. We gratefully acknowledge the support of the U.S. Department of Energy through the Los Alamos National Laboratory LDRD Program and through the Pacific Northwest National Laboratory LDRD Program for this work. We gratefully acknowledge the support of the South Dakota Board of Regents Competitive Research Grant. We acknowledge the support of the Natural Sciences and Engineering Research Council of Canada, funding reference number SAPIN-2017-00023, and from the Canada Foundation for Innovation John R. Evans Leaders Fund. This research used resources provided by the Oak Ridge Leadership Computing Facility at Oak Ridge National Laboratory and by the National Energy Research Scientific Computing Center at Lawrence Berkeley National Laboratory, a U.S. Department of Energy Office of Science User Facility. We thank our hosts and colleagues at the Sanford Underground Research Facility for their support.Appendix A Methods
A.1 Detectors and data taking scheme
The Demonstrator was located at the 4850-ft underground of the Sanford Underground Research Facility (SURF) in Lead, South Dakota, consisting of two separate ultra-low background modules of PPC HPGe detectors with a total mass of 44.1 kg, of which 29.7 kg were enriched to 88% in 76Ge [45]. The detectors were operated in a vacuum cryostat within a graded shield made from ultra-low background electroformed Cu and other shielding materials sourced to meet stringent material purity requirements [46].
The Demonstrator calibration system accomodates a 228Th line source through a track penetrating the shield and surrounding each cryostat in a helical shape [47]. When deployed, the line source exposed all detectors in the array for energy calibration and stability determination. During normal operations, sources were deployed weekly for 60-90 minutes to perform routine energy calibrations, while longer runs (12-24 hours) were taken to refine energy and other pulse shape analysis parameters.
From 2015–2019 the original set of 35 enrGe detectors were operated, using a data blindness scheme of alternating 31 hours of open data followed by 93 hours of blinded data, to mitigate possible bias in the development of analysis routines. Analysis of the calibration data set does not employ a blinded approach. The Demonstrator continues to operate with 14.3 kg of natural Ge detectors in a single module for background studies and other rare-event searches.
A.2 Peak fits at low energy
The peak scanning algorithm uses a (7 + 1) keV window near the peak position as the fit region of interest (ROI), where is the exposure-weighted combined detector resolution as a function of energy. The 1 keV offset ensures an ROI of at least 2 keV, even for a vanishingly small . The ROI for the PEP-violating transition search at 10.6 keV is 8.6–12.6 keV, and the ROI for the charge nonconserving electron decay at 11.1 keV is 9.1–13.2 keV. In the low-energy background data near the 10.6 keV signature, cosmogenic peaks at 65Zn (8.98 keV), 68Ga (9.66 keV), and 68Ge (10.37 keV) are expected. External 210Pb may also induce a peak at 10.8 keV. The energy calibration in the low-energy region is precise enough to treat the location of the cosmogenic peaks as fixed at the literature values. Other contributions from tritium beta decay and Compton scattering from higher energy peaks form a background continuum that is separable from the peak-like signature, and is approximated by a second-order polynomial within the ROIs.
In the narrow ROIs where the background continuum can be approximated as a second-order polynomial, the spectrum is modeled as
| (2) |
where and are the normalized spectral distributions for the polynomial background, -th cosmogenic peak and the rare event peak of interest, respectively, and and are the number of events in each distribution. Additional nuisance parameters are denoted . We fit the model spectrum to the data using the unbinned extended likelihood method [48, 49, 50]. While the shape parameters for the polynomial background are unbounded, the widths of the Gaussian rare peak and background peaks are constrained by the detector energy resolution.
Profiling the likelihood function by varying the number of counts in the rare signal peak, and fixing all other nuisance parameters at their best-fit values, is a standard technique which results in a conservative upper limit on the rate. The signal peaks in both the CNC and Type III PEP searches overlap to some extent with the cosmogenic lines. The likelihood contour is typically flat up to the number of counts assigned to the overlapping peaks, and only increases to the desired CL above these counts; hence the presence of overlapping peaks does not result in an artificially better limit. Fig. 5 shows the spectral fit in the ROI of the PEP-violating atomic transition in Ge at the 90% CL upper limit.
The total acceptance efficiency of the low-energy data cleaning cuts is determined by convolving the data cleaning efficiency, the individual detector threshold efficiencies, and the efficiency of the energy-degraded slow pulse event rejection [51]. The low-energy cuts retain % of single-site events in our ROI, which we take to be constant within each narrow fit window. We note that the efficiency correction is a smooth function and will not introduce peak structures, and remains above 80% acceptance down to 3 keV [17]. A complementary search for the signature of a PEP-violating transition to the L-shell ( 1.3 keV) may be undertaken, but would produce a weaker signal and less well-motivated result.
A.3 Peak fits at high energy
Our search for the peaks 10.6 keV above the single- and double-escape peaks, and resulting limit, uses a binned profile likelihood analysis method. The PEP-violating peak is expected to be very faint, and in this analysis we refer to this region as the “echo” peak. Initial values for the SEP and DEP parameters are obtained from a fit to each peak, and are input to the main fit containing both the escape and echo peak regions. The PEP-violating parameter is defined by the ratio of lifetimes, , and is obtained from the ratio of counts in each peak region of interest,
| (3) |
We maximize the sensitivity by considering counts from both the SEP and DEP regions, as shown by Table 1.
Our signal model consists of contributions from the two peaks , , which we write as a cumulative distribution function over energy with nuisance parameters and bin index :
| (4) | ||||
We precisely measure the escape peak counts with a precision peakshape function , and combine all counts in the echo peak into a single bin with width . A multi-bin peak fit is not optimal for a faint (or nonexistent) bump, since its shape is completely hidden within the Poisson uncertainty of the background. The energy regions selected for the DEP and SEP peaks are chosen where the Compton background can be accurately modeled by a linear term, avoiding one nearby gamma peak from 212Bi at 1620 keV, and are given in Table 2.
We fit the DEP and SEP peaks with a germanium peakshape , comprised of the Ge response [43], a smoothed step function and linear background term, and an overall count normalization,
| (5) |
The peakshape function is a sum of a Gaussian with several correction terms. At its mean energy , the Gaussian width is allowed to float from the expected resolution . The error function describes the low-energy tail, including an exponential slope and the fraction of signal events in the tail . A smoothed step function contribution with height is included to account for events which have undergone small-angle Compton scattering, losing energy and not contributing directly to the main peak. The parameters and define the slope and floor of the linear background below the peak, respectively.
Grouping the nuisance parameters, we have
| (6) |
Prior to fitting with the full peakshape in Eq. 5, the peaks are fit to a simple Gaussian and linear background to obtain initial values. The expected energy resolution is calculated by the primary analysis using calibration data [15]. The other parameters in the peakshape function are set to initial values of keV, and .
| SEP | DEP | |
|---|---|---|
| Escape peak (keV) | [2090.0 – 2132.0] | [1585 – 1607.6] |
| Echo peak (keV) | [2110.1 – 2118.1] | [1599.9 – 1606.3] |
| Bin size (keV) | 0.01 | 0.01 |
To search for the existence of the echo peak, and set an upper limit if its best-fit value is not significant, we construct a variable-width binned likelihood function based on the signal model . We use products of the Poisson probability of finding the observed number of events in bin when the expected value is :
| (7) |
This is easily extended to a fit that combines the SEP and DEP energy regions (index ),
| (8) |
Since the energies of the escape peaks are well known, we include a constraint on as a pull term to penalize any fit where deviates significantly from the expected value,
| (9) |
The final binned likelihood used for our analysis is given by
| (10) |
The best-fit values for our search are given in Table 3.
| Parameter | SEP | DEP | |
|---|---|---|---|
| (counts) | 33340 | 23300 | |
| (keV) | 2103.5 | 1592.6 | |
| (keV) | 1.92 | 1.20 | |
| 0.133 | 0.14 | ||
| (keV) | 2.5 | 1.02 | |
| (counts) | 0 | 0 | |
| (counts/keV) | 0.31 | 2.47 | |
| (counts) | 210 | -3240 |
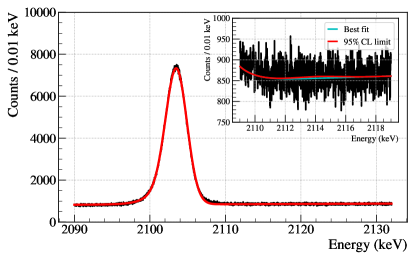
Finding no significant signal in either echo peak region, we profile the likelihood function to set an upper limit on . Nuisance parameters are fixed to their best-fit values, and the number of counts in the echo peak is increased until reaching a 95% CL upper limit. Fig. 6 expresses this profile over the likelihood function in terms of the parameter, for the SEP-only, DEP-only, and combined SEP+DEP analysis.
Alternate analysis schemes exploiting the close-packed detector arrangement of the Demonstrator were also considered, including a technique of selecting only calibration events (multi-detector hits) where one detector records a 511 keV energy deposition, and searching for the same weak peaks alongside the DEP/SEP regions. For the Majorana data set, we find this method increases the signal-to-background (S/B) of the peaks by % but lowers the overall number of events available for analysis by 66%. Near the SEP, we would require 1000 times more calibration data to make this method competitive, and the DEP requires another factor of 100 increase in statistics to provide similar results as the primary scheme of considering all available events.
References
- Wu et al. [1957] C. S. Wu, E. Ambler, R. W. Hayward, D. D. Hoppes, and R. P. Hudson, Phys. Rev. 105, 1413 (1957).
- Freedman and Clauser [1972] S. J. Freedman and J. F. Clauser, Phys. Rev. Lett. 28, 938 (1972).
- Aspect et al. [1982] A. Aspect, J. Dalibard, and G. Roger, Phys. Rev. Lett. 49, 1804 (1982).
- Bouwmeester et al. [1997] D. Bouwmeester, J.-W. Pan, K. Mattle, M. Eibl, H. Weinfurter, and A. Zeilinger, Nature 390, 575 (1997).
- Ignatiev and Kuzmin [1987] A. Y. Ignatiev and V. Kuzmin, JETP Lett. 47, 6 (1987).
- Greenberg and Mohapatra [1987] O. W. Greenberg and R. N. Mohapatra, Phys. Rev. Lett. 59, 2507 (1987).
- Greenberg [1991] O. W. Greenberg, Phys. Rev. D 43, 4111 (1991).
- Greenberg [2000] O. W. Greenberg, in AIP Conf. Proc., Vol. 545 (American Institute of Physics, 2000) pp. 113–127.
- Bernabei et al. [2009] R. Bernabei, P. Belli, F. Cappella, R. Cerulli, C. Dai, A. d’Angelo, H. He, A. Incicchitti, H. Kuang, X. Ma, et al., Eur. Phys. J C 62, 327 (2009).
- Abgrall et al. [2016a] N. Abgrall et al., Eur. Phys. J C 76, 1 (2016a).
- Okun and Zeldovich [1978] L. Okun and Y. Zeldovich, Phys. Lett. B 78, 597 (1978).
- Mohapatra [1987] R. N. Mohapatra, Phys. Rev. Lett. 59, 1510 (1987).
- Chen et al. [2016] J.-W. Chen, H.-C. Chi, S.-T. Lin, C.-P. Liu, L. Singh, H. T. Wong, C.-L. Wu, and C.-P. Wu, Phys. Rev. D 93, 093012 (2016).
- Aalseth et al. [2018] C. E. Aalseth et al. (Majorana Collaboration), Phys. Rev. Lett. 120, 132502 (2018).
- Arnquist et al. [2022a] I. Arnquist et al. (Majorana Collaboration), arXiv:2207.07638 (2022a), accepted to Phys. Rev. Letters.
- Abgrall et al. [2017a] N. Abgrall et al., Phys. Rev. Lett. 118, 161801 (2017a).
- Arnquist et al. [2022b] I. Arnquist et al. (Majorana Collaboration), arXiv preprint arXiv:2206.10638 (2022b).
- Alvis et al. [2018] S. Alvis et al. (Majorana Collaboration), Phys. Rev. Lett. 120, 211804 (2018).
- Alvis et al. [2019a] S. I. Alvis et al. (Majorana Collaboration), Phys. Rev. D 99, 072004 (2019a).
- Arnquist et al. [2022c] I. J. Arnquist et al. (Majorana Collaboration), Phys. Rev. Lett. 129, 080401 (2022c).
- Workman [2022] R. Workman, Prog. Theor. Exp. Phys. 2022, 083C01 (2022).
- Belli et al. [1999] P. Belli, R. Bernabei, C. Dai, H. He, G. Ignesti, A. Incicchitti, H. Kuang, J. Ma, F. Montecchia, O. Ponkratenko, et al., Phys. Lett. B 460, 236 (1999).
- Noether [1918] E. Noether, Gott. Nachr. 1918, 235 (1918).
- Witten [2018] E. Witten, Nature Physics 14, 116 (2018).
- Chu [1996] S.-Y. Chu, Mod. Phys. Lett. A 11, 2251 (1996).
- Ignatiev et al. [1979] A. Ignatiev, V. Kuzmin, and M. Shaposhnikov, Phys. Lett. B 84, 315 (1979).
- Dubovsky et al. [2000] S. L. Dubovsky, V. A. Rubakov, and P. G. Tinyakov, Journal of High Energy Physics 2000, 041 (2000).
- Agostini et al. [2015] M. Agostini, S. Appel, G. Bellini, J. Benziger, D. Bick, G. Bonfini, D. Bravo, B. Caccianiga, F. Calaprice, A. Caminata, et al., Phys. Rev. Lett. 115, 231802 (2015).
- Pauli [1925] W. Pauli, Zeitschrift für Physik 31, 765 (1925).
- Weinberg [1964] S. Weinberg, Phys. Rev. 133, B1318 (1964).
- Suzuki et al. [1993] Y. Suzuki et al., Phys. Lett. B 311, 357 (1993).
- Bernabei et al. [1997] R. Bernabei et al., Phys. Lett. B 408, 439 (1997).
- Bellini et al. [2010] G. Bellini et al. (Borexino Collaboration), Phys. Rev. C 81, 034317 (2010).
- Curceanu et al. [2017] C. Curceanu et al., Entropy 19 (2017), 10.3390/e19070300.
- Messiah and Greenberg [1964] A. Messiah and O. Greenberg, Phys. Rev. 136, B248 (1964).
- Greenberg and Mohapatra [1989] O. W. Greenberg and R. N. Mohapatra, Phys. Rev. D 39, 2032 (1989).
- Akama et al. [1992] K. Akama, H. Terazawa, and M. Yasuè, Phys. Rev. Lett. 68, 1826 (1992).
- Addazi and Marcianò [2020] A. Addazi and A. Marcianò, International Journal of Modern Physics A 35, 2042003 (2020).
- Elliott et al. [2012] S. Elliott, B. LaRoque, V. Gehman, M. Kidd, and M. Chen, Foundations of Physics 42, 1015 (2012).
- Piscicchia et al. [2020] K. Piscicchia, J. Marton, S. Bartalucci, M. Bazzi, S. Bertolucci, M. Bragadireanu, M. Cargnelli, A. Clozza, R. Del Grande, L. De Paolis, et al., Entropy 22, 1195 (2020).
- Napolitano et al. [2022] F. Napolitano, S. Bartalucci, S. Bertolucci, M. Bazzi, M. Bragadireanu, C. Capoccia, M. Cargnelli, A. Clozza, L. De Paolis, R. Del Grande, et al., Symmetry 14, 893 (2022).
- Gavrin et al. [1988] V. Gavrin, A. Y. Ignatiev, and V. Kuzmin, Phys. Lett. B 206, 343 (1988).
- Alvis et al. [2019b] S. I. Alvis et al. (Majorana Collaboration), Phys. Rev. C 100, 025501 (2019b).
- Abgrall et al. [2021] N. Abgrall et al. (LEGEND Collaboration), arXiv preprint arXiv:2107.11462 (2021).
- Abgrall et al. [2014] N. Abgrall et al. (Majorana Collaboration), Adv. High Energy P 2014, 365432 (2014).
- Abgrall et al. [2016b] N. Abgrall et al. (Majorana Collaboration), NIM A 828, 22 (2016b).
- Abgrall et al. [2017b] N. Abgrall et al. (Majorana Collaboration), NIM A 872, 16 (2017b).
- Wilks [1938] S. S. Wilks, The annals of mathematical statistics 9, 60 (1938).
- Rolke et al. [2005] W. A. Rolke, A. M. López, and J. Conrad, NIM A 551, 493 (2005).
- James [2006] F. James, Statistical methods in experimental physics (World Scientific Publishing Company, 2006).
- Wiseman [2020] C. Wiseman, Journal of Physics: Conference Series 1468, 012040 (2020).