Towards Rich, Portable, and Large-Scale Pedestrian Data Collection*
Abstract
Recently, pedestrian behavior research has shifted towards machine learning based methods and converged on the topic of modeling pedestrian interactions. For this, a large-scale dataset that contains rich information is needed. We propose a data collection system that is portable, which facilitates accessible large-scale data collection in diverse environments. We also couple the system with a semi-autonomous labeling pipeline for fast trajectory label production. We further introduce the first batch of dataset from the ongoing data collection effort – the TBD pedestrian dataset. Compared with existing pedestrian datasets, our dataset contains three components: human verified labels grounded in the metric space, a combination of top-down and perspective views, and naturalistic human behavior in the presence of a socially appropriate “robot”.
I Introduction
Pedestrian datasets are essential tools for designing socially appropriate robot behaviors, recognizing and predicting human actions, and studying pedestrian behavior. A generally accepted assumption for these datasets is that real-world pedestrians are experts in analyzing and navigating human crowds because they are proficient at behaving in accordance to social interaction norms.

Researchers may use these data to predict future pedestrian motions, including forecasting their trajectories [1, 7, 8], and/or navigation goals [9, 12]. In social navigation, datasets can also be used to model interactions. For example, a key problem researchers have tried to address is the freezing robot problem [21], in which the robot becomes stuck in dense, crowded situations while trying to be deferential to human movements for safety or end user acceptance reasons. Researchers have attributed this problem to robot’s inability to model interactions [20]. In other words, most current navigation algorithms do not consider pedestrian reactions and assume a non-cooperative environment. Some works [15] have used datasets to show that modeling the anticipation of human reactions to the robot’s actions enables the robot to deliver a better performance.
In order to better capture and model interactions to improve the performance of various pedestrian-related algorithms, considerably more data is needed across a variety of environments. To this end, we have constructed a data collection system that can achieve these two requirements: large quantity and environment diversity. First, we ensure that our equipment is completely portable and easy to set up. This allows collecting data in a variety of locations with limited lead time. Second, we address the challenge of labeling large quantities of data using a semi-autonomous labelling pipeline. We employ a state-of-the-art deep learning based [23] tracking module combined with various post-processing procedures to automatically produce high quality ground truth pedestrian trajectories in metric space.
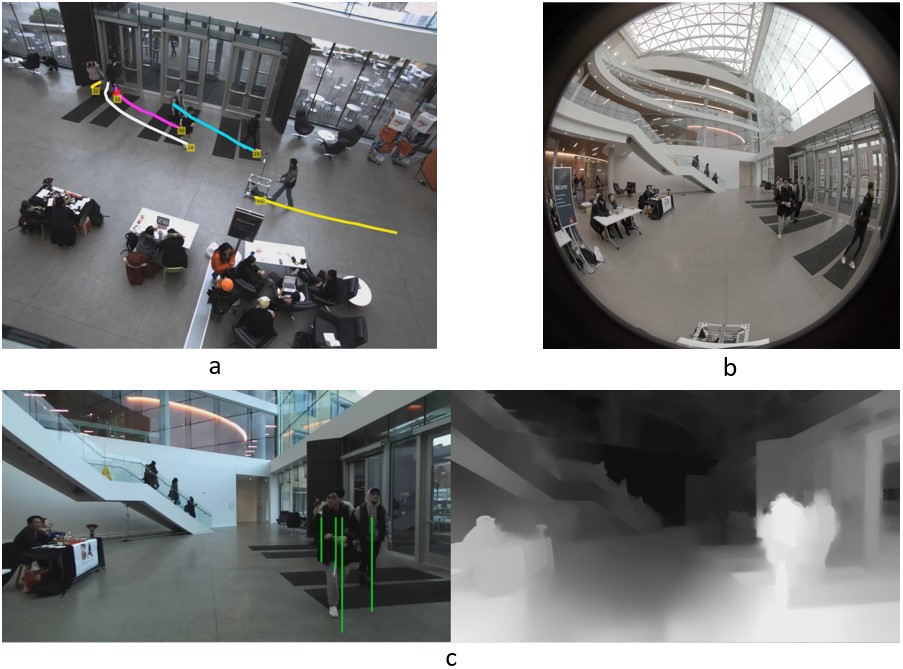
We hope our dataset approach offers various improvements and aims to accommodate a wide variety of pedestrian behavior research. Specifically, we include three important characteristics: (1) ground truth labeling in metric space, (2) perspective views from a moving agent, and (3) natural human motion. To the best of our knowledge, publicly available datasets only have at most two of these characteristics, but not all three. We demonstrate our system through a dataset collected in a large indoor space: the TBD pedestrian dataset111https://tbd.ri.cmu.edu/tbd-social-navigation-datasets. Our dataset contains scenes with a variety of crowd densities and pedestrian interactions. This dataset can be used to complement existing datasets by injecting a new data environment and more pedestrian behavior distribution into existing dataset mixtures, such as [10]. This is an ongoing effort and we have only released the first dataset batch.
II System Description
II-A Hardware Setup

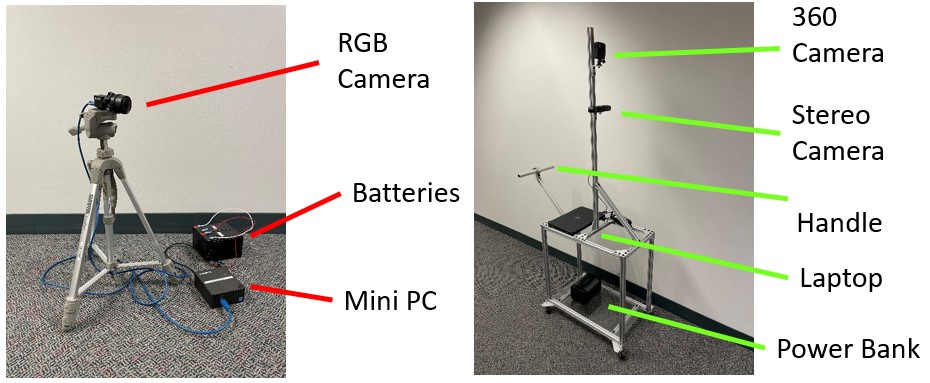
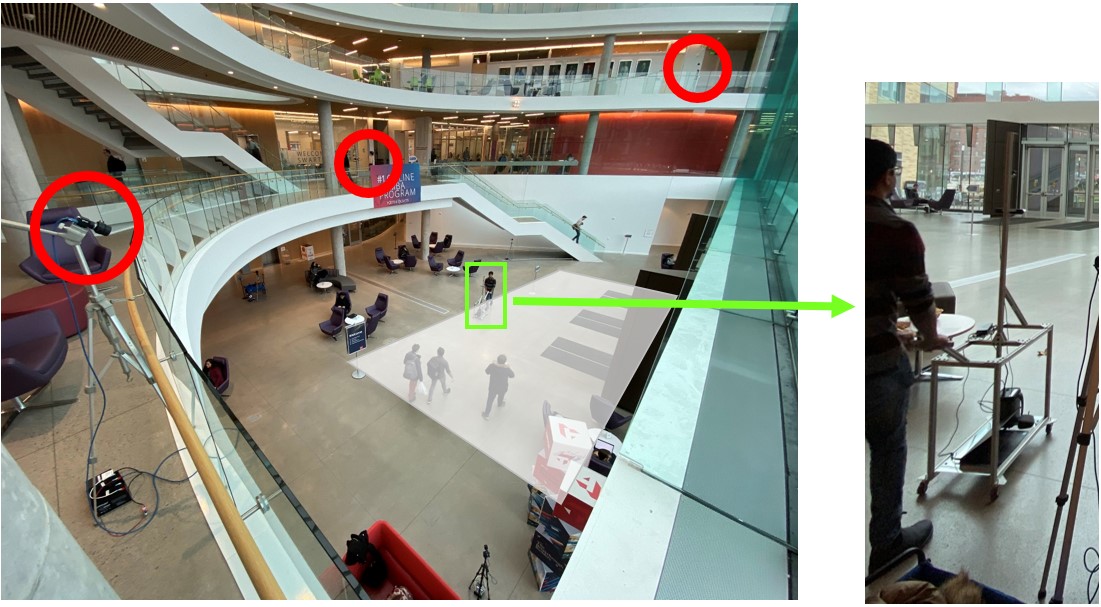
As shown in Figure 3, we positioned three FLIR Blackfly RGB cameras (Figure 2) surrounding the scene on the upper floors overlooking the ground level at roughly 90 degrees apart from each other. The RGB cameras are connected to portable computers powered by lead-acid batteries. We also positioned three more units on the ground floor, but did not use them for pedestrian labeling.
In addition to the RGB cameras, we pushed a cart through the scene (Figure 2) equipped with a ZED stereo camera to collect both perspective RGB views and depth information of the scene. A GoPro Fusion 360 camera for capturing high definition 360 videos of nearby pedestrians was mounted above the ZED. Data from the on-board cameras are useful in capturing pedestrian pose data and facial expressions. The ZED camera was powered by a laptop with a power bank. Our entire data collection hardware system is portable and does not require power outlets, thereby allowing data collection outdoors or in areas where wall power is inaccessible.
During each data collection session, we pushed the cart from one end of the scene to another end, while avoiding pedestrians and obstacles along the way in a natural motion similar to a human pushing a delivery cart. The purpose of this cart was to represent a mobile robot traversing through the human environment. However, unlike other datasets such as [22] or [14] that use a Wizard-of-Oz controlled robot, we used a manually pushed cart. This provided better trajectory control, increased safety, and reduced the novelty effect from pedestrians, as curious pedestrians may intentionally block robots or display other unnatural movements [5].
The first batch of our data collection occurred on the ground level in a large indoor atrium area (Figure 3). Half of the atrium area had fixed entry/exit points that led to corridors, elevators, stairs, and doors to the outside. The other half of the atrium was adjacent to another large open area and was unstructured with no fixed entry/exit points. We collected data around lunch and dinner times to ensure higher crowd densities. More data will be collected in the future in locations such as transit stations.

II-B Post-processing and Labeling
A summary of our post processing pipeline is summarized in Figure 4. We expand on select nodes to explain the post-processing procedures in greater detail.

II-B1 Time synchronization
To ensure time synchronization across the captured videos, we employed Precision Time Protocol over a wireless network to synchronize each of the the computers powering the cameras, which allows for sub-microsecond synchronization. For redundancy, we held an LED light at a location inside the field of view of all the cameras and switched it on and off at the beginning of each recording session. We then checked for the LED light signal during the post-processing stage to synchronize the starting frame of all the captured videos for each recording session.
II-B2 Cart localization
After the cameras were synchronized and calibrated, the next step was to localize the cart in the scene. This was achieved by first identifying the cart on the static camera videos and then applying the camera matrices to obtain the metric coordinates. We are exploring other localization methods (e.g., visual odometry and ultra wide band positioning) and will continue to track progress on large-space localization. For the first batch of data included in our dataset, we manually labeled the locations of the cart.
II-B3 Pedestrian tracking and labeling
Similar to cart localization, we first tracked the pedestrians on the static camera videos and then identified their coordinates on the ground plane . We found ByteTrack [23] to be very successful in tracking pedestrians in the image space. Upon human verification over our entire first batch of data, ByteTrack successfully aided the trajectory labeling of of the pedestrians automatically.
Once we obtained the automatically tracked labels in pixel space, we needed to convert them into metric space. With ByteTrack, each camera video contained a set of tracked trajectories in the image space where is the camera index. We estimated the 3D trajectory coordinates for each pair of 2D trajectories and the set of estimated coordinates that resulted in the lowest reprojection error were selected to be the final trajectory coordinates in the metric space.
Finally, we performed human verification over the entire tracking output, fixing any errors observed during the process. We also manually identified pedestrians that were outside our target tracking zone but had interactions with the pedestrians inside the tracking zone and included them as part of our dataset.
III Dataset Characteristics
III-A Comparison with Existing Datasets
Compared to existing datasets collected in pedestrian natural environments, our TBD pedestrian dataset contains three components that greatly enhances the dataset’s utility. These components are:
Human verified labels grounded in metric space. ETH [17] and UCY [11] datasets are often the only datasets to be included during the evaluation of various research models in many papers. This is largely because the trajectory labels in these datasets are human verified, unlike [13], [2], [24], and [4] that solely rely on automatic tracking to produce labels. These trajectory labels are also grounded in metric space rather than image space (e.g. [18] and [3] only contain labels in bounding boxes). Having labels grounded in metric space eliminates the possibility that camera poses might have an effect on the scale of the labels. It also makes the dataset useful for robot navigation related research because robots plan in the metric space rather than image space.
Combination of top-down views and perspective views. Similar to datasets with top-down views, we use top-down views to obtain ground truth trajectory labels for every pedestrian present in the scene. Similar to datasets with perspective views, we gather perspective views from a “robot” to imitate robot perception of human crowds. A dataset that contains both top-down views and perspective views will be useful for research projects that rely on perspective views. This allows perspective inputs to their models, while still having access to ground truth knowledge of the entire scene.
Naturalistic human behavior with the presence of a “robot”. Unlike datasets such as [22] or [14], the “robot” that provides perspective view data collection is a cart being pushed by human. As mentioned in section II-A, doing so reduces the novelty effects from the surrounding pedestrians. Having the “robot” being pushed by humans also ensures safety for the pedestrians and its own motion has more natural human behavior.
| Datasets | Comp. 1 | Comp. 2 | Comp. 3 |
|---|---|---|---|
| (metric labels) | (views) | (“robot”) | |
| TBD (Ours) | Yes | TD + P | Human + Cart |
| ETH [17] | Yes | TD | N/A |
| UCY [11] | Yes | TD | N/A |
| Edinburgh Forum [13] | No | TD | N/A |
| VIRAT [16] | No | TD | N/A |
| Town Centre [3] | No | TD | N/A |
| Grand Central [24] | No | TD | N/A |
| CFF [2] | No | TD | N/A |
| Stanford Drone [18] | No | TD | N/A |
| L-CAS [22] | No* | P | Robot |
| WildTrack [6] | Yes | TD | N/A |
| JackRabbot [14] | Yes | P | Robot |
| ATC [4] | No | TD | N/A |
| THÖR [19] | Yes | TD + P | Robot |
As shown in Table I, current datasets only contain at most two of the three components222*L-CAS dataset does provide human verified labels grounded in the metric space. However, its pedestrian labels do not contain trajectory data, which means this dataset has limited usage in pedestrian behavior research.. A close comparison is the THÖR dataset [19], but its perspective view data are collected by a robot. Additionally, unlike all other datasets in Table I, the THÖR dataset is collected in a controlled lab setting rather than in the wild. This injects artificial factors into human behavior, making them unnatural.
III-B Dataset Statistics
| Datasets | Time length | # of pedestrians | Label freq (Hz) |
|---|---|---|---|
| TBD (Ours) | 133 mins | 1416 | 60 |
| (51 mins) | |||
| ETH [17] | 25 mins | 650 | 15 |
| UCY [11] | 16.5 mins | 786 | 2.5 |
| WildTrack [6] | 200 sec | 313 | 2 |
| JackRabbot [14] | 62 mins | 260 | 7.5 |
| THÖR [19] | 60+ mins | 600+ | 100 |
Table II demonstrates the benefit of a semi-automatic labeling pipeline. With the aid of an autonomous tracker, humans only need to verify and make occasional corrections on the tracking outcomes instead of locating the pedestrians on every single frame. The data we have collected so far already surpassed all other datasets that provide human verified labels in the metric space in terms of total time, number of pedestrians and labeling frequency. We will continue this effort and collect more data for future works.
III-C Qualitative Pedestrian Behavior

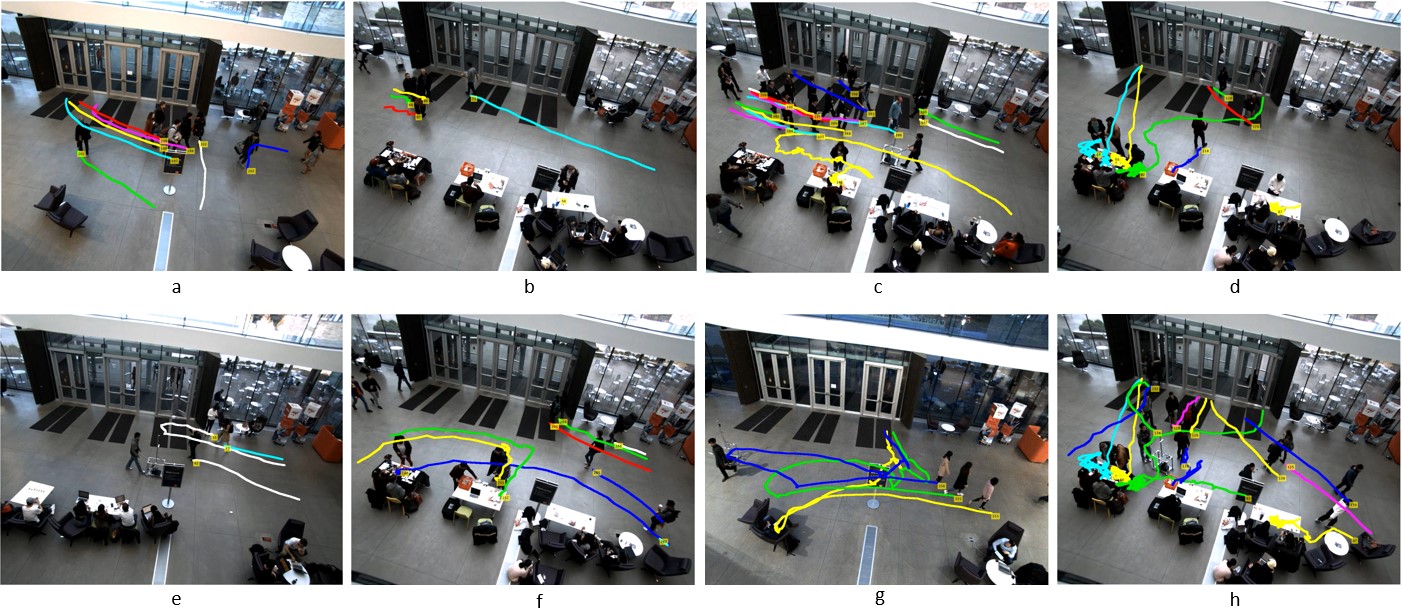
Due to the nature of the environment where we collected the data, we observe a mixture of corridor and open space pedestrian behavior, many of which are rarely seen in other datasets. As shown in Figure 5, we observe both static conversation groups and dynamic walking groups. We also observe that some pedestrians naturally change goals mid-navigation.
IV Future Work
A key concern about our current data collection setup is that our sensors consist purely of cameras. For better labeling accuracy, we are exploring adding a LiDAR to aid the autonomous tracking of pedestrians and adding an ultra wide band positioning system for better cart state estimation. We also plan to continue making improvements to our software system and underlying methods. Currently, the bottleneck to produce huge quantities of data still lies in correcting the few erroneous tracking outcomes of the automatic tracking procedures. A centralized user interface is under development to better document these tracking errors and to provide intuitive tools to fix them. As mentioned earlier, our approach enables additional data collection in a wide range of locations and constraints. Additional data collection and public updates to this initial dataset are planned.
ACKNOWLEDGMENT
This work was supported by grants (IIS-1734361 and IIS-1900821) from the National Science Foundation.
References
- [1] A. Alahi, K. Goel, V. Ramanathan, A. Robicquet, L. Fei-Fei, and S. Savarese, “Social lstm: Human trajectory prediction in crowded spaces,” in Proc. IEEE Comput. Soc. Conf. Comput. Vis. Pattern Recognit., June 2016, pp. 961–971.
- [2] A. Alahi, V. Ramanathan, and L. Fei-Fei, “Socially-aware large-scale crowd forecasting,” in Proc. IEEE Conf. on Comput. Vis. and Pattern Recognit., 2014, pp. 2203–2210.
- [3] B. Benfold and I. Reid, “Stable multi-target tracking in real-time surveillance video,” in CVPR 2011. IEEE, 2011, pp. 3457–3464.
- [4] D. Brščić, T. Kanda, T. Ikeda, and T. Miyashita, “Person tracking in large public spaces using 3-d range sensors,” IEEE Trans. on Human-Machine Syst., vol. 43, no. 6, pp. 522–534, 2013.
- [5] D. Brščić, H. Kidokoro, Y. Suehiro, and T. Kanda, “Escaping from children’s abuse of social robots,” in Proc. of the tenth annual acm/ieee international Conf. on human-robot interaction, 2015, pp. 59–66.
- [6] T. Chavdarova, P. Baqué, S. Bouquet, A. Maksai, C. Jose, T. Bagautdinov, L. Lettry, P. Fua, L. Van Gool, and F. Fleuret, “Wildtrack: A multi-camera hd dataset for dense unscripted pedestrian detection,” in Proc. IEEE Conf. on Comput. Vis. and Pattern Recognit., 2018, pp. 5030–5039.
- [7] A. Gupta, J. Johnson, L. Fei-Fei, S. Savarese, and A. Alahi, “Social gan: Socially acceptable trajectories with generative adversarial networks,” in Proc. IEEE Comput. Soc. Conf. Comput. Vis. Pattern Recognit., June 2018, pp. 2255–2264.
- [8] B. Ivanovic and M. Pavone, “The trajectron: Probabilistic multi-agent trajectory modeling with dynamic spatiotemporal graphs,” in Proc. IEEE/CVF International Conf. on Comput. Vis., 2019, pp. 2375–2384.
- [9] K. M. Kitani, B. D. Ziebart, J. A. Bagnell, and M. Hebert, “Activity forecasting,” in Comput. Vis. – ECCV 2012, 2012, pp. 201–214.
- [10] P. Kothari, S. Kreiss, and A. Alahi, “Human trajectory forecasting in crowds: A deep learning perspective,” IEEE Trans. Intell. Transp. Syst., 2021.
- [11] A. Lerner, Y. Chrysanthou, and D. Lischinski, “Crowds by example,” Comput. Graph. Forum, vol. 26, no. 3, pp. 655–664, 2007.
- [12] J. Liang, L. Jiang, K. Murphy, T. Yu, and A. Hauptmann, “The garden of forking paths: Towards multi-future trajectory prediction,” in Proc. IEEE Conf. on Comput. Vis. and Pattern Recognit., 2020.
- [13] B. Majecka, “Statistical models of pedestrian behaviour in the forum,” Master’s thesis, School of Informatics, University of Edinburgh, 2009.
- [14] R. Martin-Martin, M. Patel, H. Rezatofighi, A. Shenoi, J. Gwak, E. Frankel, A. Sadeghian, and S. Savarese, “Jrdb: A dataset and benchmark of egocentric robot visual perception of humans in built environments,” IEEE Trans. Pattern Anal. Mach. Intell., 2021.
- [15] H. Nishimura, B. Ivanovic, A. Gaidon, M. Pavone, and M. Schwager, “Risk-sensitive sequential action control with multi-modal human trajectory forecasting for safe crowd-robot interaction,” in 2020 IEEE/RSJ International Conf. on Intell. Robots and Syst. (IROS). IEEE, 2020, pp. 11 205–11 212.
- [16] S. Oh, A. Hoogs, A. Perera, N. Cuntoor, C.-C. Chen, J. T. Lee, S. Mukherjee, J. Aggarwal, H. Lee, L. Davis, et al., “A large-scale benchmark dataset for event recognit. in surveillance video,” in CVPR 2011. IEEE, 2011, pp. 3153–3160.
- [17] S. Pellegrini, A. Ess, K. Schindler, and L. van Gool, “You’ll never walk alone: Modeling social behavior for multi-target tracking,” in Proc. IEEE Int. Conf. Comput. Vis., Sept 2009, pp. 261–268.
- [18] A. Robicquet, A. Sadeghian, A. Alahi, and S. Savarese, “Learning social etiquette: Human trajectory understanding in crowded scenes,” in Comput. Vis. – ECCV 2016, B. Leibe, J. Matas, N. Sebe, and M. Welling, Eds., 2016, pp. 549–565.
- [19] A. Rudenko, T. P. Kucner, C. S. Swaminathan, R. T. Chadalavada, K. O. Arras, and A. J. Lilienthal, “Thör: Human-robot navigation data collection and accurate motion trajectories dataset,” IEEE Trans. Robot. Autom., vol. 5, no. 2, pp. 676–682, 2020.
- [20] M. Sun, F. Baldini, P. Trautman, and T. Murphey, “Move beyond trajectories: Distribution space coupling for crowd navigation,” arXiv preprint arXiv:2106.13667, 2021.
- [21] P. Trautman and A. Krause, “Unfreezing the robot: Navigation in dense, interacting crowds,” in Proc. IEEE/RSJ Int. Conf. Intell. Robot. Syst., Oct 2010, pp. 797–803.
- [22] Z. Yan, T. Duckett, and N. Bellotto, “Online learning for human classification in 3d lidar-based tracking,” in 2017 IEEE/RSJ International Conf. on Intell. Robots and Syst. (IROS). IEEE, 2017, pp. 864–871.
- [23] Y. Zhang, P. Sun, Y. Jiang, D. Yu, Z. Yuan, P. Luo, W. Liu, and X. Wang, “Bytetrack: Multi-object tracking by associating every detection box,” arXiv preprint arXiv:2110.06864, 2021.
- [24] B. Zhou, X. Wang, and X. Tang, “Understanding collective crowd behaviors: Learning a mixture model of dynamic pedestrian-agents,” in 2012 IEEE Conf. on Comput. Vis. and Pattern Recognit. IEEE, 2012, pp. 2871–2878.