Temporal Context Matters: Enhancing Single Image Prediction with Disease Progression Representations
Abstract
Clinical outcome or severity prediction from medical images has largely focused on learning representations from single-timepoint or snapshot scans. It has been shown that disease progression can be better characterized by temporal imaging. We therefore hypothesized that outcome predictions can be improved by utilizing the disease progression information from sequential images. We present a deep learning approach that leverages temporal progression information to improve clinical outcome predictions from single-timepoint images. In our method, a self-attention based Temporal Convolutional Network (TCN) is used to learn a representation that is most reflective of the disease trajectory. Meanwhile, a Vision Transformer is pretrained in a self-supervised fashion to extract features from single-timepoint images. The key contribution is to design a recalibration module that employs maximum mean discrepancy loss (MMD) to align distributions of the above two contextual representations. We train our system to predict clinical outcomes and severity grades from single-timepoint images. Experiments on chest and osteoarthritis radiography datasets demonstrate that our approach outperforms other state-of-the-art techniques.
1 Introduction
Predicting clinical outcomes from medical images is a long standing goal in the medical vision community [6, 77, 1, 39]. For the past half a decade, researchers have employed various deep neural networks (DNNs) [38, 30, 10] to improve diagnostic and prognostic performance. Previously, DNNs were trained from scratch [56] for classification and detection tasks on various medical imaging datasets. These multi-organ datasets can range from 2D radiographs (x-rays) [50] to 3D magnetic resonance imaging (MRI) [41] or computerized tomography (CT) [70] scans. More recent frameworks have employed knowledge distillation [48, 55] and self-supervision techniques [4, 64] to pretrain models which are then finetuned on limited medical imaging data. This has led to improved model performance.
However, most medical imaging datasets contain only single-timepoint or ‘snapshot’ images. Although a snapshot image plays an essential role for describing a disease, sequential scans provide a more comprehensive characterization of the evolution and prognosis of a pathology. The temporal evolution of imaging biomarkers are highly correlated with disease progression trajectory. We hypothesize that this rich underlying domain information can be leveraged by deep learning approaches to make accurate predictions about the disease trajectory even when temporal data is limited/unavailable.
In practice, temporal medical data can be very limited because patients are often lost to follow-up or suffer from chronic diseases with infrequent re-evaluations of their condition. Temporal models usually overfit on these small datasets leading to poor generalizability. Hence, they are limited in their use as a standalone source for training recurrent neural networks (RNN), Temporal ConvNets (TCN), etc. Recently there have been many deep learning–based works that aim to learn representations from sequential medical imaging data [20, 21, 63, 33]. The bottleneck of limited training samples is evident in all of them. Unlike the video vision community where the presence of large scale temporal datasets facilitates temporal modeling approaches, pursuing similar problems (for e.g., future timepoint severity prediction, object evolution) in medical imaging scenario is technically challenging.
In this work we propose to learn disease progression patterns from limited temporal imaging data, and use this auxiliary knowledge to enhance predictive performance of methods that use snapshot scans. Since the representations are obtained from two different domains - snapshot and temporal - the challenges lie in how to optimally adapt and align these feature distributions. Because each image in a temporal sequence contributes unequally, we first extract an ‘optimal’ embedding of the entire sequence. An ‘optimal’ embedding should retain maximum information focused on the key transition stages over the course of a disease. The temporal feature representation can then be aligned against a snapshot feature. Our next step involves employing an appropriate feature matching technique to re-calibrate the two different domain representations (snapshot and temporal). We build a framework that leverages partially available temporal data to re-calibrate the representations learned by the single-timepoint pipeline. A temporal network that employs multi-head self-attention at each layer is incorporated in our architecture. We eventually obtain a global attention distribution that aids in selecting an optimal representation from the whole sequence. Meanwhile, a vision transformer is pretrained in a self-supervised fashion to extract features from snapshot images. Finally, during the finetuning phase, maximum mean discrepancy (MMD) loss is proposed as a feature matching tool to minimize the distance between the two representations.
The main contributions of this work are as follows:
-
•
This is the first work that learns representations from limited temporal medical images, and eventually utilizes them to improve clinical prediction tasks from single-timepoint datasets.
-
•
We use a Temporal ConvNet that employs hierarchical attention to obtain the most optimal representation of a temporal image sequence, so that it can be compared with the features from a single image–based pipeline.
-
•
In our study, intermediate representations are available from temporal and snapshot images. We propose to use MMD loss for the first time in this domain, to align the snapshot feature space with the optimal temporal representations selected through an attention mechanism.
2 Related works
2.1 Temporal modeling of disease progression
In the current era of precision medicine, temporal modeling of disease progression is an important field of research. To learn disease trajectory from sequential imaging data, medical vision researchers have typically applied various recurrent neural networks (RNNs) widely used by the video analytics community. Recurrent convolutional models [18, 61, 73] were the first to process variable sequence inputs and exploit their long-term dynamics across timepoints. Along this direction, many recent techniques have been developed for recognizing human action in videos [66, 71]. Temporal Difference Network [66] simultaneously learns both short and long-term motion information to improve action recognition performance. Yang et. al [71] introduced a pyramid network (TPN) that utilized both slow and fast tempos through a single multi-level architecture by unifying features from different hierarchies. GESTURES [47] pretrained a spatio-temporal CNN on action recognition data to extract representations from seizure videos. Konwer et. al [33] used an architecture inspired by CorrRNN [72] for predicting disease severity at a future timepoint. To do so, a correlation module was integrated within a Gated Recurrent Unit (GRU) to exploit the disease correlation among different zonal patches. Zhang et. al [75] captured both the 3D spatial context and temporal dynamics of a growing tumor by employing a spatio-temporal ConvLSTM framework.
Temporal ConvNets (TCN) have been shown to be more effective over LSTM-based methods in tasks like action segmentation and recognition [14, 22], but are yet to be fully explored for medical imaging. Recently, TCN showed significant improvement over recurrent models in Alzheimer’s disease detection [20]. In our work, we make use of a TCN-based architecture to select the optimal representation of the entire temporal sequence. This requires incorporating attention within the temporal approach. A TCN-based architecture is more explainable than RNNs because attention can be incorporated at various levels - kernel, layer-wise or globally [28, 36]. This motivates us to use a hierarchical attention–based TCN architecture for the temporal section of our framework. Though transformers have recently shown improved performance over TCN, limited datasets restrict us to a lightweight transformer alternative like TCN.
2.2 Feature and probability distribution level losses
Distance measures that match two image distributions, are generally found to operate at two levels - 1) posterior probability and 2) feature space. KL-divergence loss [34] and Bhattacharya distance [5] are two popular measures in the former category that have been used for vision problems like visual tracking and image segmentation [16, 24, 7, 23]. However, in our case, the image representations to be compared are derived from two different contexts, i.e, temporal and snapshot. Also, the tasks performed to obtain them are not similar. It is a hard imposition to match the underlying probability distributions. Hence, we used the second category losses - MMD and CORAL loss to align the image feature distributions. [2, 69, 40, 54]. These are popular metrics for feature adaptation between two types of data. MMD is widely used to interpret tasks like neural style transfer [31], or improving unsupervised image generation [68]. These losses minimize the distance between various statistical measures (first and second moments) of image embeddings.
2.3 Self-supervised Transformers in medical imaging
The introduction of Vision transformers (ViT) [19] proved that even without using CNNs, compelling classification performance could be achieved in supervised approaches solely from a sequence of image patches. ViT exploits the long-range spatial dependencies in images, previously underutilized by CNN models. After pretraining, ViT can be finetuned on downstream medical datasets to achieve improved results in classification and segmentation tasks [74, 60, 15, 67]. This is perfectly suited for analyzing medical images, where intra-image disease manifestations can be characterized more comprehensively using ViTs. Hence, we propose to use a ViT as a feature extractor for snapshot images in our framework. A major disadvantage of ViT is that their pretraining necessitates large scale datasets.
Self-supervised learning approaches [11, 25] have made significant advances in recent years, improving the ability to learn image representations even from smaller datasets. This is achieved by training models on well-designed proxy goals that do not require manual annotations. Examples of these goals include discriminative tasks such as predicting image rotation [17], solving multimodal jigsaw puzzles [42], etc. In this work, we focus on training ViT in a self-supervised paradigm by leveraging large-scale, albeit unannotated, snapshot medical images.
3 Methodology
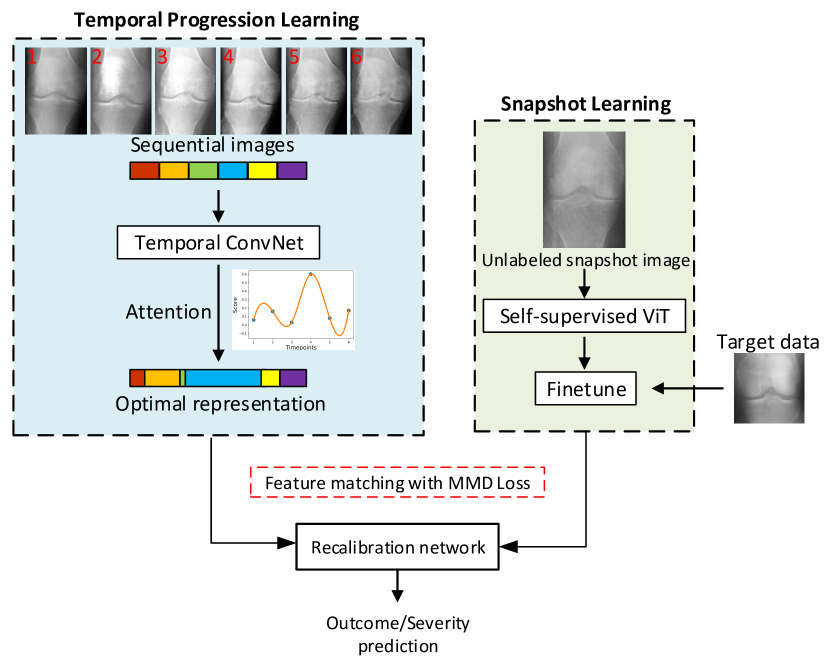
Given a snapshot image of an individual patient, we predict their clinical outcomes/disease severity by utilizing the disease progression information previously learnt from a small temporal dataset with sequential scans. An overview of our proposed framework is shown in Fig. 1. The key idea is to use the feature representations of the temporal images to recalibrate the representation of snapshot images. In the training stage, besides finetuning the snapshot representations through the standard loss (e.g., cross-entropy loss or ordinal loss, depending on the task), we also match them with the temporal representations at a distribution level, using the MMD loss. At the inference time, the recalibrated snapshot representations are used for the final prediction. This recalibration strategy, as well as the training losses, are elaborated in section 3.1. Prior to this, we use state-of-the-art methods for obtaining both the snapshot and the temporal representations. First, we extract hidden representations from temporal images using a hierarchical TCN. This step selects the best representation from each sequence. Detailed description is provided in section 3.2. As for the snapshot representations, we use a pretrained self-supervised vision transformer (see section 3.3).
3.1 Representation Recalibration network and training losses
We first introduce the key component of our method – the recalibration network. It uses representations of temporal images to recalibrate representations of snapshots. More details of how these representations are obtained will be explained in later sections. Here we assume snapshot/single-timepoint image embeddings . They are fed as input to the recalibration network, i.e., a multilayer perceptron (MLP) with 1 hidden layer. We also have temporal representations from temporal sequences. The temporal representations are only used in the training stage to recalibrate snapshot representations. To train the recalibration network, we use both the standard prediction loss, , and the MMD loss, , to match the snapshot representations to the temporal representations.
| (1) |
Given two distributions and for snapshot and temporal data, by mapping the data into a reproducing kernel Hilbert space (RKHS) using function , the MMD between the two distributions is calculated as
where denotes the expectation with regard to the distribution , and defines a set of functions in the unit ball of a RKHS, . In our setting, the problem is simplified as we assume the data are all represented in the same latent space with Euclidean metric. The MMD loss is then reduced to
in which and are the numbers of snapshot representations and temporal representations, respectively.
In the loss (Eqn. 1), the prediction loss can be different for different types of target datasets. For outcome prediction on chest radiographs, we prefer a combination of MMD and Cross-entropy loss as shown in Eqn. 2.
| (2) |
On the other hand, the severity changes in knee osteoarthritis disease is a classic application of ordinal regression [8]. We use a combination of MMD and Ordinal loss as shown in Eqn. 3.
| (3) |
Next, we explain how the temporal representation and snapshot representation are obtained before recalibration.
3.2 Temporal progression learning
Our temporal representation is obtained based on the state-of-the-art TCN. We will first provide some details of these techniques. For our problem, to match with snapshot representations, we need to find an optimal representation from the temporal sequence. To this end, we introduce a hierarchical self-attention module. The attention at different levels will be aggregated to obtain a single optimal representation for recalibration.
Background: TCN. The goal of the TCN is to gather the spatial dependencies over long ranges through causal dilated convolutions. The causal nature ensures that the computation of output at an individual timepoint depends only on the present and the past timepoints. Here, we briefly explain the temporal modeling using a TCN module.
Assume a sequence of temporal images available for each patient in the pretraining stage. This sequence of images is fed to a ResNet-18 model pretrained on ImageNet [26, 51]. A vector with 512 elements is obtained with the extracted features. Considering temporal images of a patient, a sequence of 512-element vectors is computed, which is then used as input to the TCN.
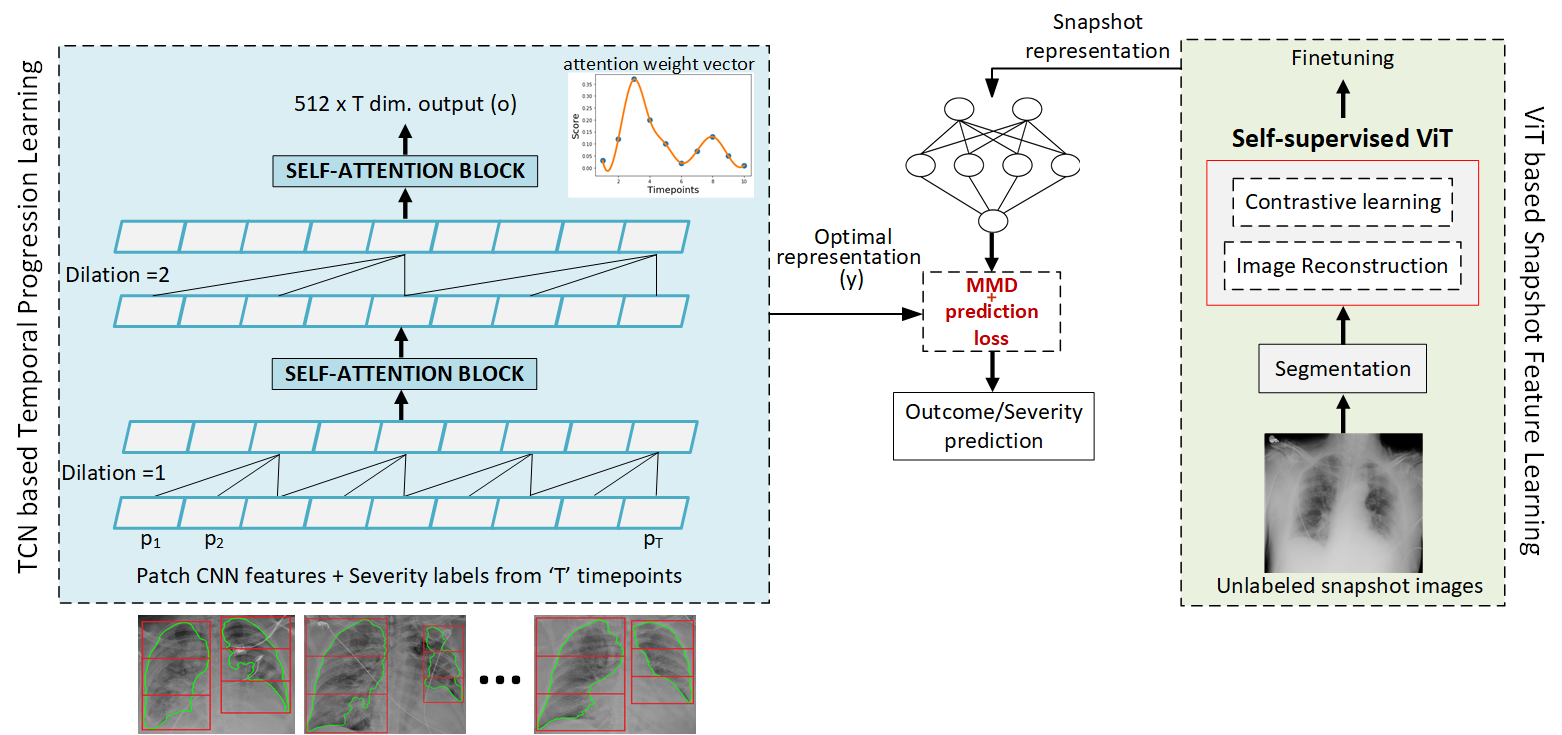
Fig. 2 shows the typical structure of a TCN with 2 dilated causal convolution layers. In our architecture we have used 3 such convolution layers. The dilation factors used for the layers are and the kernel size chosen is . Dilation is equivalent to introducing a fixed step between every adjacent filter taps. For a TCN layer, the relevant history information is obtained from past timepoints. For an input feature sequence , and a filter , the dilated convolution on an element is defined as:
| (4) |
where refers to the past direction.
Hierarchical attention. In addition to feature extraction, we also exploit the TCN structure to select the optimal representation of the entire image sequence. As shown in Fig. 2, a multi-head self attention block is inserted between every two convolutional layers of the TCN. The input features are transformed into query and key via convolutions. The attention map is then obtained from and by
| (5) |
where is the softmax activation function. These maps contain self-attention weights which essentially quantify the importance of one timepoint relative to another. Next, the weighted representations are generated, where is another set of feature transformed using convolution. Finally we add the input features , to .
| (6) |
Note this output is dimensional, consisting of representations for each of the time slices. For the final calibration, we need to use the attention to generate a 512 dimensional representation.
Recall is a matrix which is normalized for each column. We sum up each row of to get a dimensional weight vector , measuring the contribution of each time slice to all other time slices. A higher weight implies the corresponding time slice is more important. We apply softmax to this weight vector and use the output to calculate a weighted sum of the representations at all time slices. This final representation is then used in the recalibration task performed in section 3.1. Further details on obtaining the optimal representation are provided in Supplementary. The pretraining of sequential images using TCN is performed with categorical cross entropy loss.
3.3 Snapshot representation learning
For learning representations from snapshot images, we adopt the architecture of Self-supervised image Transformer (SiT) [3] without the rotation task. We employ two tokens - first, the image patch token to perform image reconstruction, and second, the contrastive token of SimCLR [11] for contrastive prediction task.
Reconstruction task. For the image reconstruction task, a transformer is trained to extract the encoded visual features. The motivation is to learn context-preserving representations from the snapshot scans. Individual image grids are intentionally corrupted by passing through various transformations like addition of random noise, blurring by filters, and random grid replacement from another image. The transformer aims to restore the original image from the corrupted image. The output tokens of the transformer are aggregated to reconstruct the input image. The -loss between the input and the reconstructed image is employed as shown in Eqn. 7:
| (7) |
where, is the norm, is the original image, is the corrupted image, returns the reconstructed image and denotes the batch size. P are the parameters of the transformer to be learned during training.
Contrastive learning task. Positive pairs are constructed with the augmented versions of the same image. Augmentation techniques like cropping and horizontal flipping are used. Negative pairs denote samples coming from different inputs. The network is trained to minimize the distance between a positive pair and maximize the distance between a negative pair. This is achieved through a contrastive loss function, , with cosine similarity as the similarity measure.
| (8) |
where denotes the image embedding coming from the contrastive head, is the dot product of the normalised inputs, which is the cosine similarity, and denotes a constant temperature parameter which we set to . are are augmentations of the same image. The contrastive loss is defined as the arithmetic mean over all positive pairs in the batch of the cross entropy of their normalized similarities. For pretraining of snapshot images, we used a weighted combination of Reconstruction loss and Contrastive loss. It is given by:
| (9) |
The pretrained representation will be used as the input for the recalibration network (Section 3.1).
| Name | Ventilation | Mortality | ||||||
| Method | AUC() | Sensitivity() | Specificity() | F1 score() | AUC() | Sensitivity() | Specificity() | F1 score() |
| COVID-Net [65] | 0.73 | 0.64 | 0.69 | 0.70 | 0.76 | 0.63 | 0.73 | 0.72 |
| Rahimzadeh et. al [49] | 0.75 | 0.62 | 0.74 | 0.68 | 0.77 | 0.58 | 0.76 | 0.74 |
| Oh et. al [44] | 0.75 | 0.69 | 0.75 | 0.75 | 0.78 | 0.61 | 0.75 | 0.72 |
| COVIDiagnosis-Net [59] | 0.71 | 0.60 | 0.71 | 0.68 | 0.78 | 0.56 | 0.74 | 0.65 |
| DarkCovidNet [45] | 0.77 | 0.71 | 0.76 | 0.74 | 0.78 | 0.65 | 0.71 | 0.76 |
| CNN + LSTM [29] | 0.74 | 0.63 | 0.66 | 0.63 | 0.76 | 0.62 | 0.69 | 0.69 |
| Azizi et. al [4] | 0.79 | 0.74 | 0.79 | 0.76 | 0.80 | 0.74 | 0.77 | 0.78 |
| Li et. al [35] | 0.79 | 0.71 | 0.75 | 0.74 | 0.81 | 0.68 | 0.76 | 0.80 |
| Ours | 0.88 | 0.76 | 0.80 | 0.79 | 0.87 | 0.74 | 0.78 | 0.84 |
| Method | F1() | BA() | AUC() | Kappa() | AUC(1,2)() | AUC(2,3)() |
|---|---|---|---|---|---|---|
| MobileNetV2 [53] | 0.5104 | 0.3532 | 0.7822 | 0.2554 | 0.6208 | 0.6191 |
| CNN + Ordinal loss [9] | 0.6865 | 0.6638 | 0.8950 | 0.5557 | 0.7298 | 0.8576 |
| SE block [27] | 0.7336 | 0.7237 | 0.9237 | 0.6237 | 0.7866 | 0.9265 |
| Ensemble [57] | 0.7405 | 0.7342 | 0.9112 | 0.6327 | 0.7896 | 0.9360 |
| DeepKnee [58] | 0.3956 | 0.5078 | 0.7456 | 0.2287 | 0.5931 | 0.7398 |
| Ours w/o temporal (TCN+MMD) | 0.7844 | 0.7850 | 0.9520 | 0.6492 | 0.8428 | 0.9165 |
| Ours w/o Attention | 0.8126 | 0.7607 | 0.9581 | 0.6842 | 0.8954 | 0.9126 |
| Ours w/o Hierarchical Att | 0.8327 | 0.7883 | 0.9727 | 0.7065 | 0.8820 | 0.9284 |
| Ours | 0.8265 | 0.8216 | 0.9773 | 0.7357 | 0.9167 | 0.9382 |
| Name | Ventilation | Mortality | ||||||
|---|---|---|---|---|---|---|---|---|
| Method | AUC | Sensitivity | Specificity | F1 score | AUC | Sensitivity | Specificity | F1 score |
| Ours w/o temporal (TCN+MMD) | 0.78 | 0.71 | 0.78 | 0.72 | 0.79 | 0.76 | 0.69 | 0.73 |
| Ours w/o Attention | 0.82 | 0.69 | 0.75 | 0.76 | 0.82 | 0.71 | 0.74 | 0.75 |
| Ours w/o Hierarchical Att | 0.86 | 0.75 | 0.84 | 0.74 | 0.85 | 0.75 | 0.71 | 0.80 |
| Ours | 0.88 | 0.76 | 0.80 | 0.79 | 0.87 | 0.74 | 0.78 | 0.84 |
| Name | Ventilation | Mortality | OAI | |||
|---|---|---|---|---|---|---|
| Method | AUC | F1 | AUC | F1 | AUC | F1 |
| KL | 0.81 | 0.67 | 0.82 | 0.77 | 0.92 | 0.76 |
| Bhattacharya | 0.77 | 0.65 | 0.75 | 0.71 | 0.89 | 0.79 |
| CORAL | 0.86 | 0.77 | 0.83 | 0.79 | 0.95 | 0.83 |
| Ours (MMD) | 0.88 | 0.79 | 0.87 | 0.84 | 0.97 | 0.82 |
4 Experiment design and results
To validate our proposed method, we perform experiments on two types of radiograph images. Chest radiographs (CXRs) are analyzed in order to predict clinical outcomes for COVID-19 patients and knee radiographs are studied to predict osteoarthritis (OA) severity.
The ability to predict clinical outcomes in COVID-19 can have significant implications on physician decision-making regarding medical resource allocation and treatment administration. This is particularly true in low-resource or surging case settings where triage must be performed. Similarly, grading of knee is clinically significant in monitoring a patient’s disease progression and determining appropriate treatment measures. Furthermore, accurate grading of OA is critical for epidemiological surveys of disease prevalence. However, current scoring systems for OA rely heavily on physician interpretation of medical images which has been reported to have a high rate of inter-observer variability [32]. This might be overcome by automated approaches.
Multiple datasets are employed for model training and validation for the two applications listed above. While most datasets have only single-timepoint images, very few contain temporal data, described in detail below.
COVID-19 radiograph dataset. For pretraining of the vision transformer, we used 28,433 images jointly from two Kaggle sources - 21,165 scans from a COVID-19-radiography-database [13] and 7268 from the SIIM-COVID19-detection challenge [62]. The temporal dataset, CovidProg, used for training TCN, included 942 images from 150 COVID patients. Evaluation was performed on the SnapCXR dataset, which had 631 snapshot images selected from TCIA [52] containing clinical outcome information.
Knee osteoarthritis dataset. We utilized two publicly available knee radiograph datasets, OAI [43] and the Kaggle knee osteoarthritis dataset [12]. OAI is a longitudinal study of 4,796 participants examined with radiographs and MRI during 9 follow-up examinations (0 to 96 months). Only the radiographs are studied in this work. Each radiograph also has an associated Kellgren-Lawrence (KL) score provided by a physician interpreter. There are 5 KL grades ranging from 0 to 4 that is a measure of the OA severity in knee joints. For pretraining the transformer we jointly used 17,230 images from 4,350 OAI studies, and 5,778 images from the training folder of the Kaggle dataset. The remaining 426 OAI cases comprising 2,474 images were used as temporal data to train the TCN. Evaluation was done on a target dataset of 2,482 images utilizing both the validation and test folders in the Kaggle data.
4.1 Implementation details
Environment. Our framework is built in Pytorch [46] and trained on an Nvidia GTX 2080Ti GPU. The self-supervised snapshot model is trained using the Adam optimizer. The learning rate and batch size are 0.0005 and 72, respectively. We used . For optimization of the TCN model, we used the following parameters: learning rate = 0.001, momentum = 0.9, and optimizer=SGD. Pre-trained ResNet-18 features were used as input; the training converged within 20 epochs.
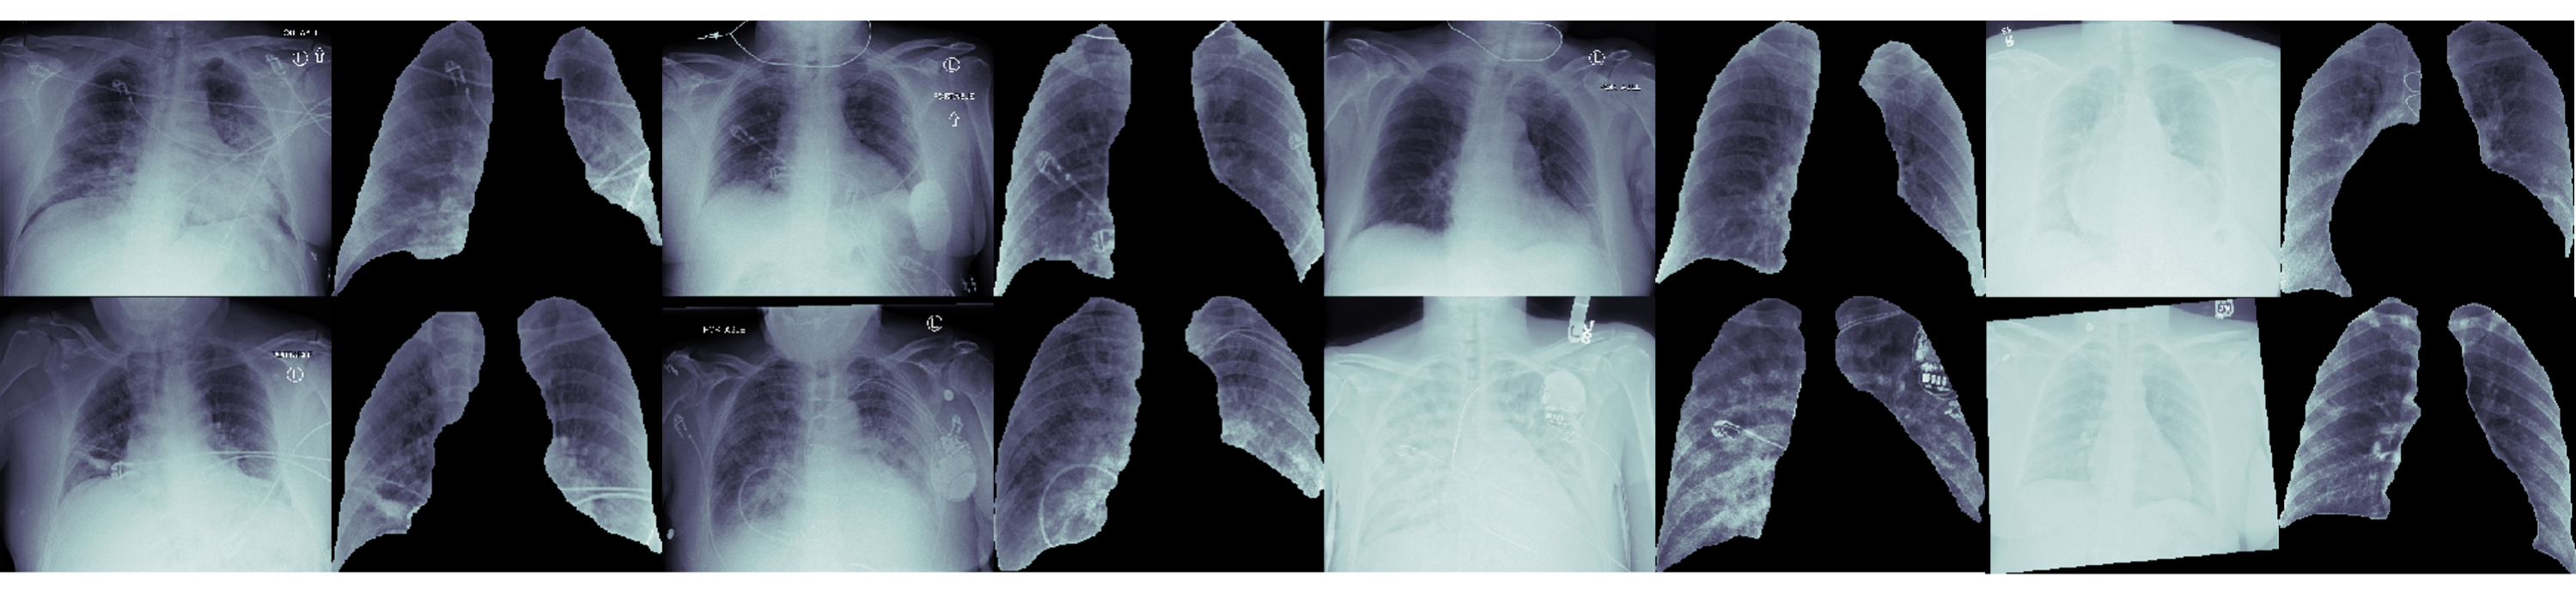
Preprocessing. For the COVID-19 chest radiograph datasets, lung region segmentation was first performed using a Residual U-Net model [76] so that features only from lung fields would be analyzed. All CXRs were aligned to the same intensity range through an average histogram matching method. For temporal data, each CXR image was divided into six grids. This was accomplished by dividing each lung into 3 equal zones. Corresponding grids of temporal images were used for separate timepoints, providing a grid-level registration across timepoints. Consequently, we obtained 6 training sequences for each patient in the temporal module. ResNet18 features were extracted from these grids and fed to TCN.
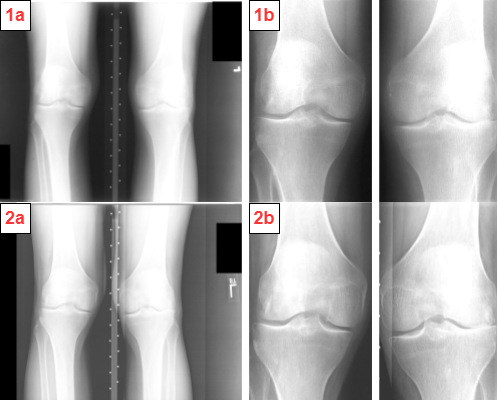
For the OAI dataset, we filtered out missing KL scoring labels and derived a training set of 19,704 knees. We utilized the BoneFinder tool [37] to localize the knee joint landmarks. Using these landmarks, the region of interest was cropped out for both knees. Following [58], histogram clipping and global contrast normalization were applied to each localized knee joint image. Finally, we rescaled all images to pixels using bilinear interpolation. The Kaggle OA dataset was used as provided. To feed the temporal data into TCN, each knee image was divided into two parts longitudinally and resized to dimension . Thus we obtained 4 training sequences for each patient in the temporal module.
Evaluation metrics. We employ AUC, sensitivity, specificity, F1 score to evaluate COVID-19 outcome prediction. t-distributed stochastic neighbor embedding (t-SNE) plots are computed for ventilation requirement prediction from features obtained after global average pooling. For knee severity multi-label classification, we used F1, balanced accuracy, AUC (one vs all), and Cohen’s Kappa score as evaluation metrics. Images with the intermediate grades , and are more difficult to differentiate from one another. Hence we also calculate AUC (one vs one) between grades 1,2 and 2,3 to measure their classification performance.
4.2 Results
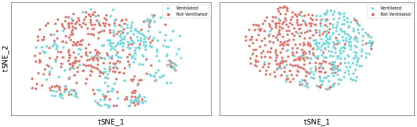
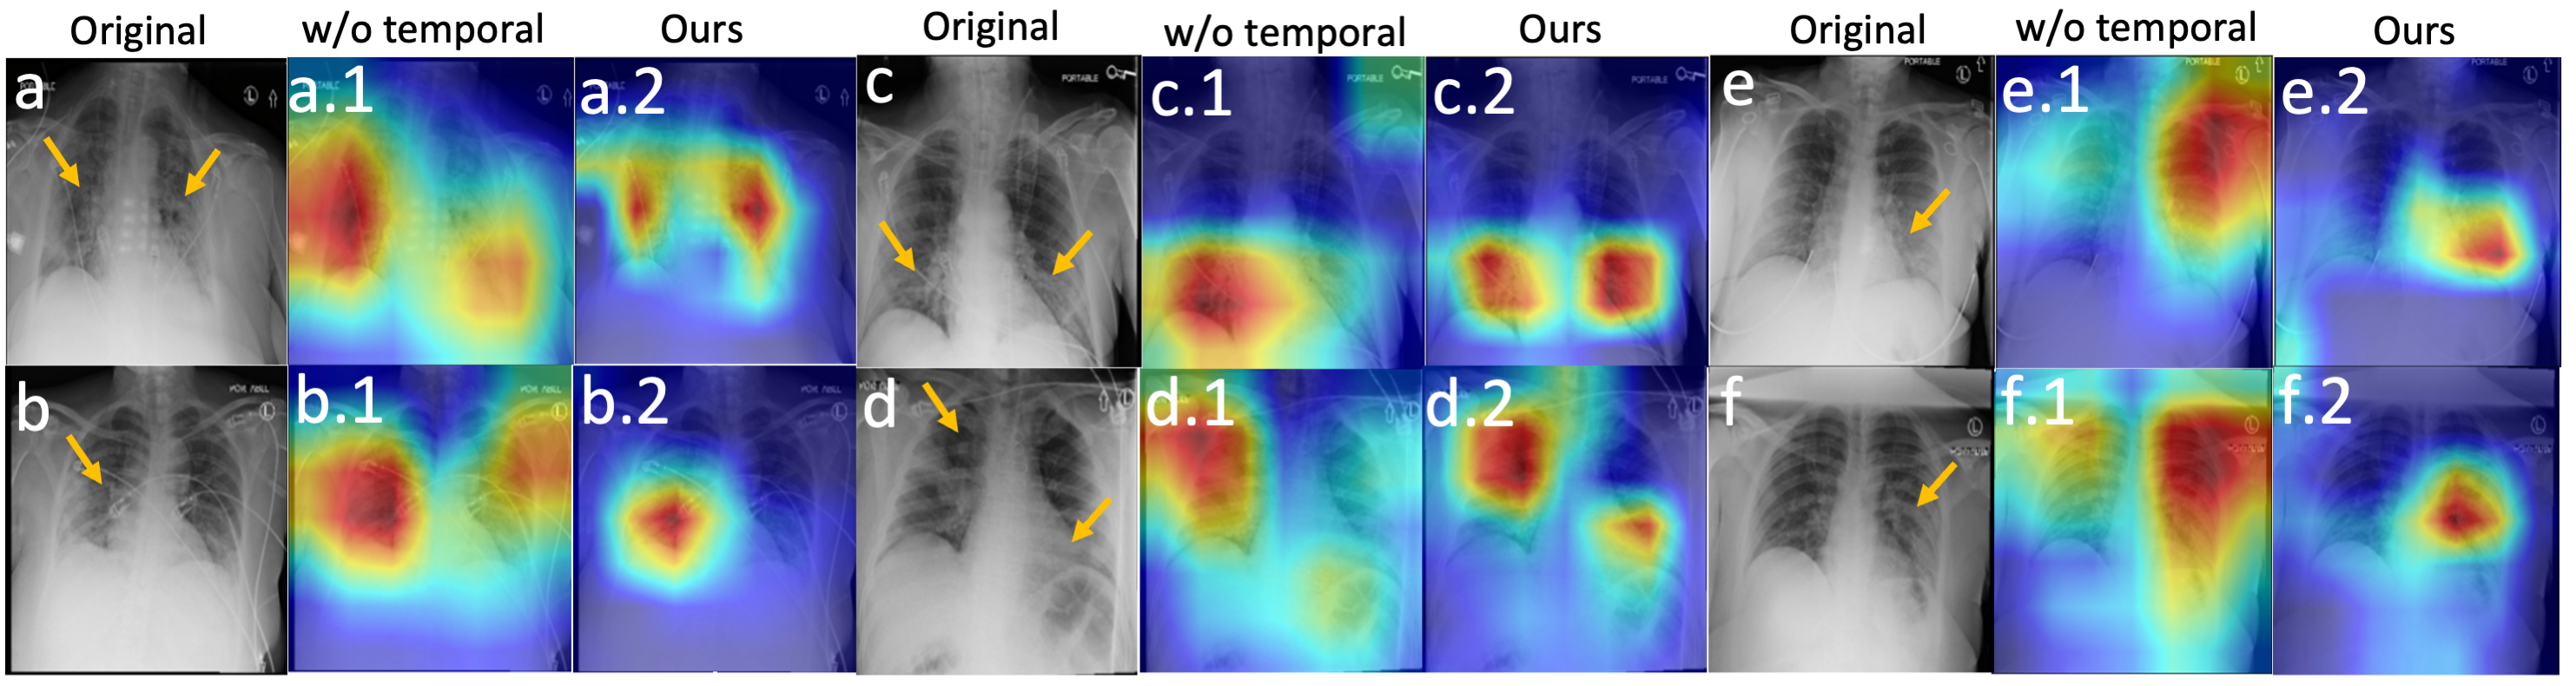
COVID-19 outcome prediction. Quantitative results: To evaluate the proposed model in predicting COVID-19 induced mortality and mechanical ventilation, we compare it with seven methods including: COVID-Net [65], Rahimzadeh et. al [49], Oh et. al [44], COVIDiagnosis-Net [59], DarkCovidNet [45], CNN + LSTM [29], Azizi et. al [4], and Li et. al [35]. Table 1 shows that our method outperforms each of these methods on the SnapCXR dataset. COVID-Net [65] uses a lightweight residual projection-expansion-projection-extension (PEPX) design pattern with convolutions at each stage. Rahimzadeh et. al [49], Oh et. al [44], and DarkCovidNet [45] use various pretrained Deep CNNs. However, these fully supervised methods fail with limited training data, and share similar predictive performance. COVIDiagnosis-Net [59] tuned a SqueezeNet architecture for COVID-19 diagnosis. Though they utilized an augmentation strategy, their lightweight backbone underperformed other state-of-art approaches. More recent methods, including Azizi et. al [4] and Li et. al [35], exploit self-supervised learning strategies resulting in a boost in prediction performance. Our pipeline uses a self-supervised vision transformer as a feature extractor but also uniquely learns features of temporal progression. This approach outperforms other methods, achieving a increase in AUC over state-of-the-art benchmarks for both ventilation and mortality prediction tasks. Qualitative results: Fig. 4 demonstrates that utilizing temporal representations in our architecture results in better defined clusters between the ventilated and non-ventilated classes on the t-SNE plot. The inter-feature spatial distance also decreases leading to a more compact visualization. Class activation maps (CAMs) were generated before and after the inclusion of our temporal approach and are shown in Fig. 6. 6.b.2 and 6.e.2 each demonstrate that our model more precisely localizes attention to pathological infiltrates when compared with baseline CAMs shown in 6.b.1 and 6.e.1. 6.c.2 demonstrates improved localization of model attention to bilateral infiltrates rather than the large unilateral attention shown in 6.c.1.
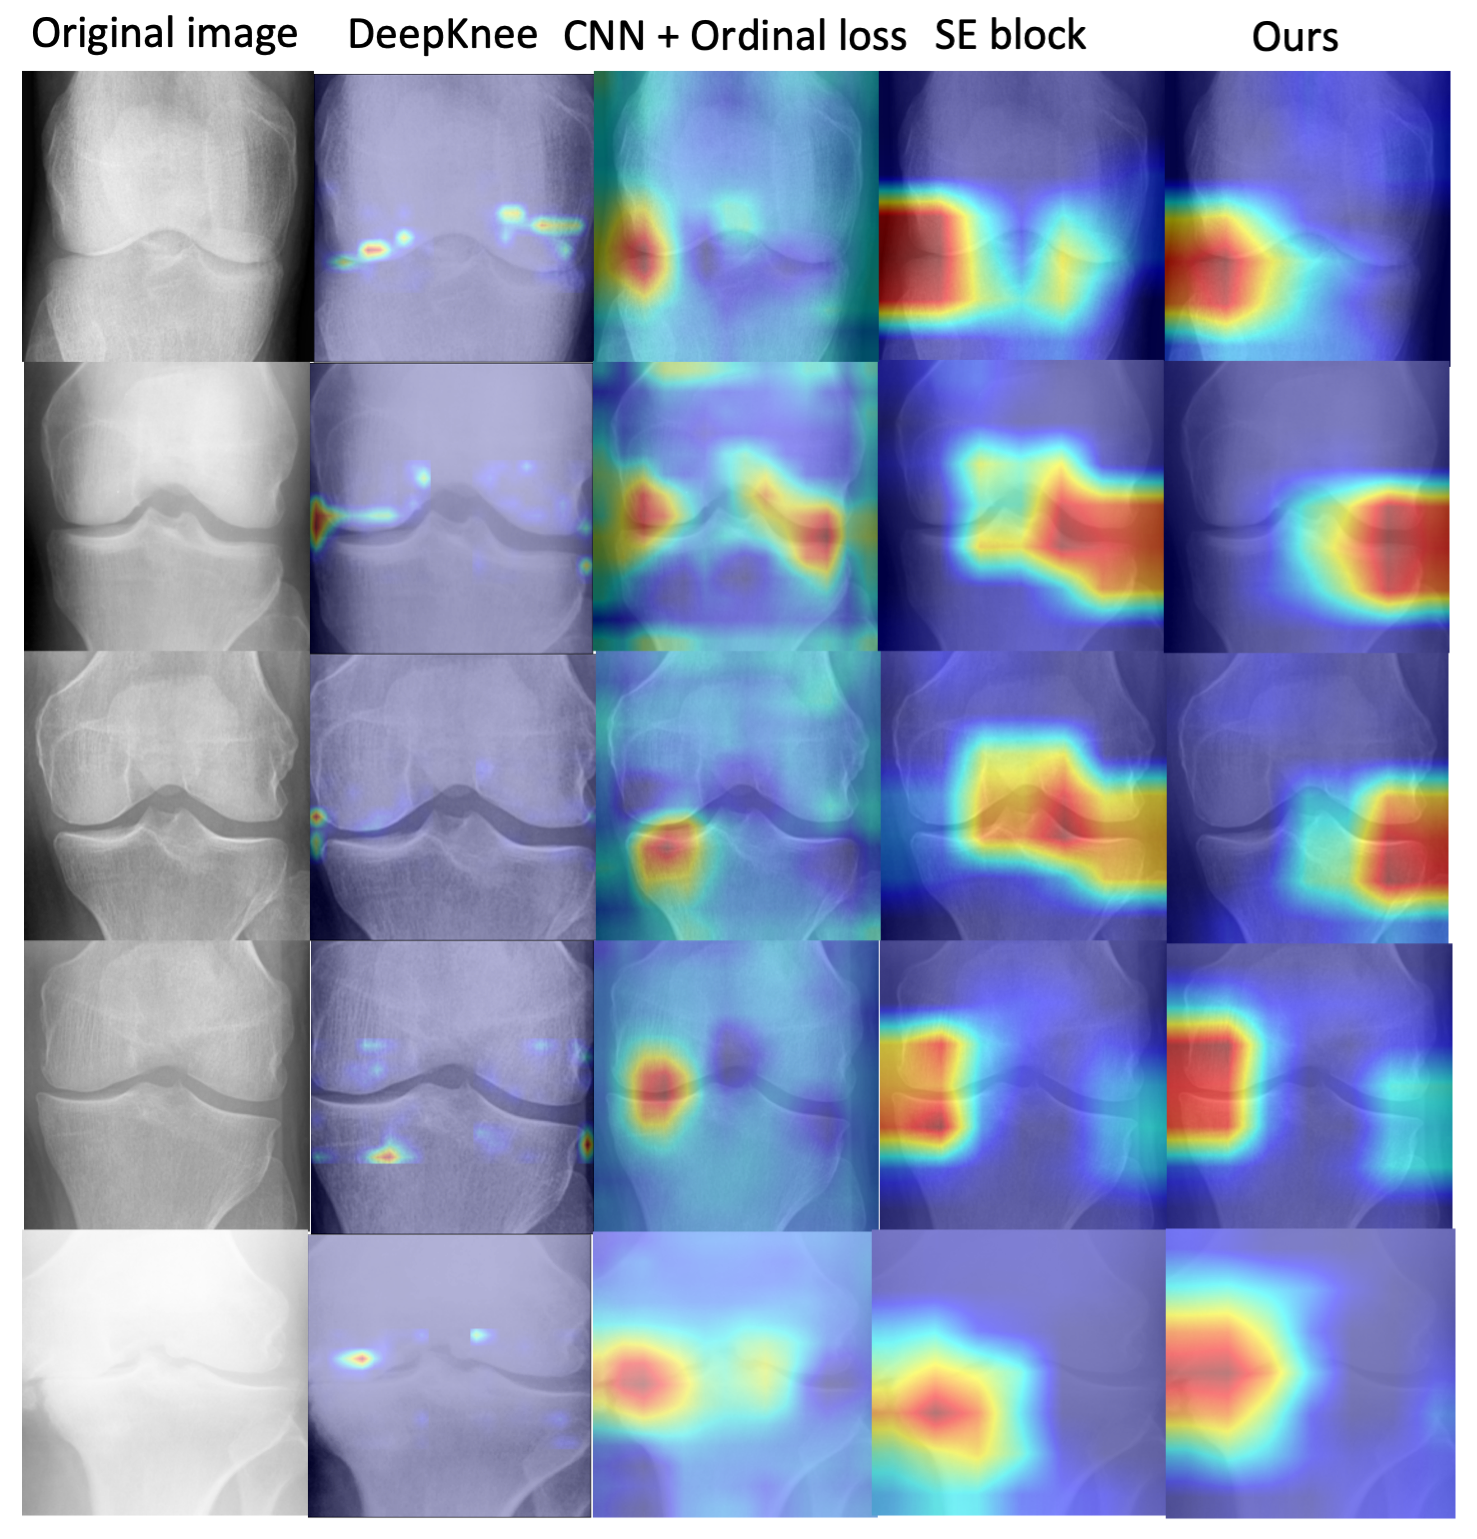
of knee CAMs depicting OA severity
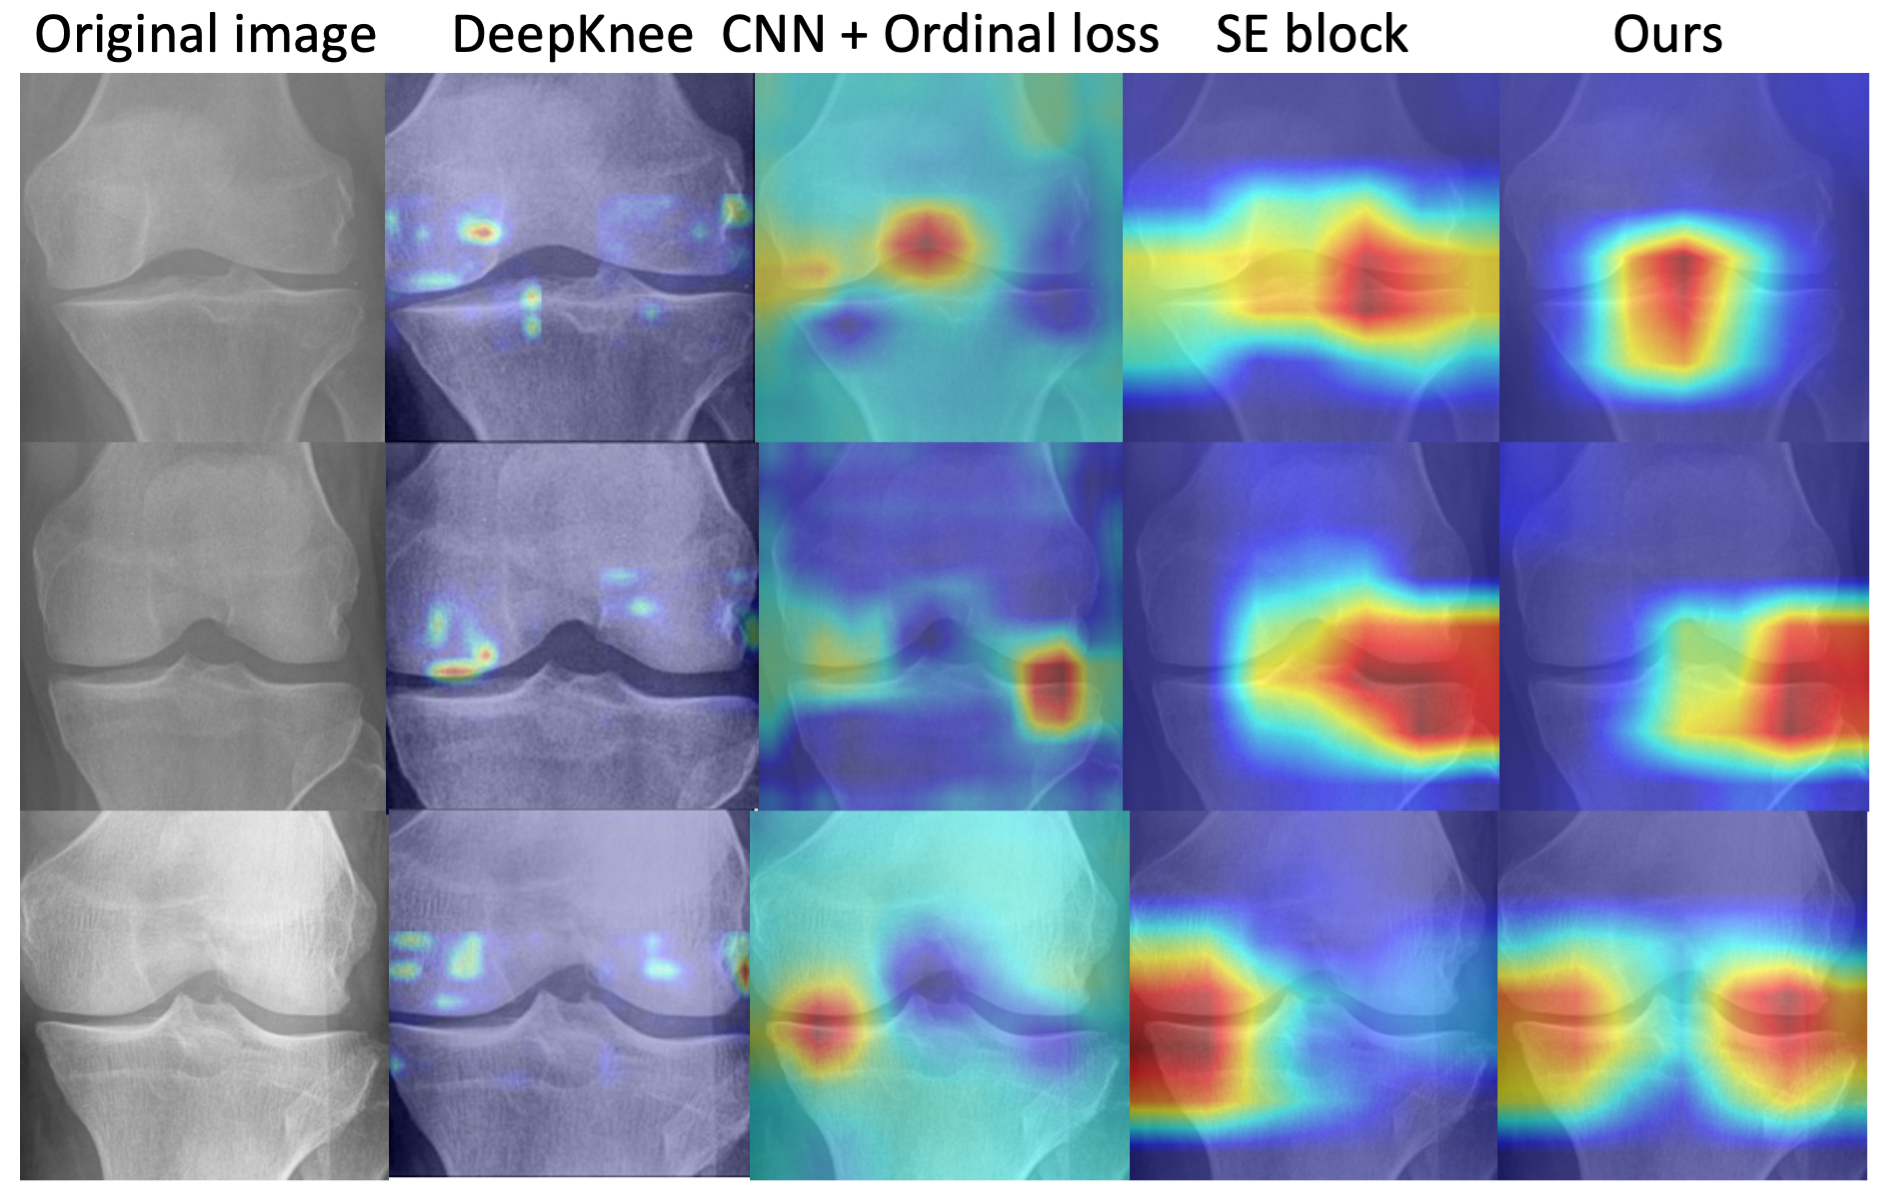
OA severity prediction. Quantitative results: We compare our method against MobileNetv2 [53], CNN + Ordinal loss [9], Squeeze-Excitation block (SE block) [27], DeepKnee [58] and, Ensemble [57] in Table 2. MobileNetv2 [53] incorporates bottleneck depth-separable convolution with residuals. CNN + Ordinal loss [9] adds an ordinal loss for grade classification. This loss significantly improves the performance motivating us to leverage it in our framework. SE blocks performed best out of all comparative models achieving a 0.92 AUC. Tiulpin et. al [58] fused predictions from multiple Siamese deep models, but did not achieve good performance results. Our model is the first to leverage the temporal scans present in this OAI dataset to improve severity grading. Learning the progression of OA vastly improved the classification results from single images. We achieved a increase in AUC over the state-of-the-art benchmark [27]. Our model also outperforms state-of-the-art approaches in the clinically difficult problem of discriminating between intermediate grades 1 vs 2 and 2 vs 3 (given by AUC(1,2) and AUC(2,3)). We also reported a Cohen’s Kappa value of 0.73 for our method which was the best among all approaches, demonstrating our model’s higher agreement with ground truth KL scores. Qualitative results: CAMs generated from the last layer of each compared model are illustrated in Fig. 4. Both our model and the SE block baseline [27] show superior localization of attention to pathological osteophyte development and joint-space narrowing when compared with other baselines. The Supplementary section contains further qualitative analyses.
4.3 Ablation Study
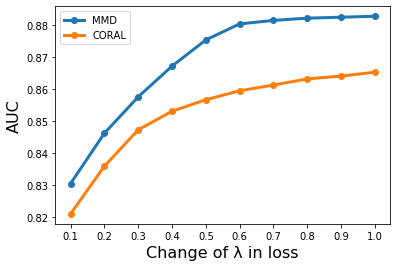
Effectiveness of Attention: Several experiments are performed on the SnapCXR and OA Kaggle datasets to verify the benefit of each component of our proposed framework. We first remove the temporal module from the framework in Fig. 2 and perform predictions from only snapshot images using the SiT [3]. This network is taken as the baseline feature extractor without TCN and Attention. Compared with this baseline, our model yields a and AUC improvement in ventilation and mortality prediction, and a improvement for OA severity prediction. We then average only the representations from the output of TCN without using attention, inhibiting the model from choosing an optimal representation from the temporal sequence. It can be seen in Table 3 that introducing the Global Attention module improves our AUCs to 0.86 and 0.85 for ventilation and mortality prediction on SnapCXR, and to 0.97 AUC for OA severity classification on the Kaggle dataset. Finally, our application of hierarchical self-attention performs slightly better than the global attention-weighted features. We attribute this improvement to the self-attention exploited after every layer, enabling better contextual understanding of the modality itself. Effectiveness of MMD loss: Table 4 presents ablation results for different loss functions. Using the MMD loss resulted in performance improvement (AUC) for SnapCXR prediction tasks and improvement in OA severity prediction in the Kaggle dataset. KL-divergence and Bhattacharya losses help in matching two posterior probability distributions and result in inferior performance. Because our distributions are derived from two different contexts (temporal vs snapshot) used for two different purposes (severity progression tracking and clinical outcome prediction), feature level losses like MMD and CORAL are more appropriate. Fig. 6 shows the AUC achieved at different stages by varying the weights of MMD and CORAL in the final loss for our method and ablation work, respectively. The MMD AUC curve achieves saturation earlier at , suggesting that even a small weight of MMD loss improved results.
5 Conclusion
This paper presents a novel framework for the augmentation of snapshot-image–based pipelines by the integration of information from multi-image sequences. Unlike existing approaches trained only on snapshot images, our architecture learns disease progression representations which are used to re-calibrate snapshot features. When evaluated on chest and knee radiograph datasets, the proposed architecture outperforms state-of-the-art approaches. This work paves the way for the inclusion of temporal data as auxiliary information for single image-based training paradigms.
6 Acknowledgements
Reported research was supported by the OVPR and IEDM seed grants at Stony Brook University, NIGMS T32GM008444, and NIH 75N92020D00021 (subcontract). The content is solely the responsibility of the authors and does not necessarily represent the official views of the National Institutes of Health.
References
- [1] Saloni Agarwal, Mohamedelfatih Eltigani Osman Abaker, and Ovidiu Daescu. Survival prediction based on histopathology imaging and clinical data: A novel, whole slide cnn approach. In International Conference on Medical Image Computing and Computer-Assisted Intervention, pages 762–771. Springer, 2021.
- [2] Dan Amir and Yair Weiss. Understanding and simplifying perceptual distances. In Proceedings of the IEEE/CVF Conference on Computer Vision and Pattern Recognition, pages 12226–12235, 2021.
- [3] Sara Atito, Muhammad Awais, and Josef Kittler. Sit: Self-supervised vision transformer. arXiv preprint arXiv:2104.03602, 2021.
- [4] Shekoofeh Azizi, Basil Mustafa, Fiona Ryan, Zachary Beaver, Jan Freyberg, Jonathan Deaton, Aaron Loh, Alan Karthikesalingam, Simon Kornblith, Ting Chen, et al. Big self-supervised models advance medical image classification. arXiv preprint arXiv:2101.05224, 2021.
- [5] Anil Bhattacharyya. On a measure of divergence between two statistical populations defined by their probability distributions. Bull. Calcutta Math. Soc., 35:99–109, 1943.
- [6] Jianan Chen, Helen Cheung, Laurent Milot, and Anne L Martel. Aminn: Autoencoder-based multiple instance neural network improves outcome prediction in multifocal liver metastases. In International Conference on Medical Image Computing and Computer-Assisted Intervention, pages 752–761. Springer, 2021.
- [7] Kan Chen, Bin Li, Lian-fang Tian, Wen-bo Zhu, and Ying-han Bao. Vessel attachment nodule segmentation using integrated active contour model based on fuzzy speed function and shape–intensity joint bhattacharya distance. Signal Processing, 103:273–284, 2014.
- [8] Pingjun Chen, Linlin Gao, Xiaoshuang Shi, Kyle Allen, and Lin Yang. Fully automatic knee osteoarthritis severity grading using deep neural networks with a novel ordinal loss. Computerized Medical Imaging and Graphics, 75:84–92, 2019.
- [9] Pingjun Chen, Linlin Gao, Xiaoshuang Shi, Kyle Allen, and Lin Yang. Fully automatic knee osteoarthritis severity grading using deep neural networks with a novel ordinal loss. Computerized Medical Imaging and Graphics, 75:84–92, 2019.
- [10] Richard J Chen, Ming Y Lu, Wei-Hung Weng, Tiffany Y Chen, Drew FK Williamson, Trevor Manz, Maha Shady, and Faisal Mahmood. Multimodal co-attention transformer for survival prediction in gigapixel whole slide images. In Proceedings of the IEEE/CVF International Conference on Computer Vision, pages 4015–4025, 2021.
- [11] Ting Chen, Simon Kornblith, Mohammad Norouzi, and Geoffrey Hinton. A simple framework for contrastive learning of visual representations. In International conference on machine learning, pages 1597–1607. PMLR, 2020.
- [12] Pingjun Chen (2018). Knee osteoarthritis severity grading dataset. Mendeley Data, V1, doi: 10.17632/56rmx5bjcr.1.
- [13] Muhammad EH Chowdhury, Tawsifur Rahman, Amith Khandakar, Rashid Mazhar, Muhammad Abdul Kadir, Zaid Bin Mahbub, Khandakar Reajul Islam, Muhammad Salman Khan, Atif Iqbal, Nasser Al Emadi, et al. Can ai help in screening viral and covid-19 pneumonia? IEEE Access, 8:132665–132676, 2020.
- [14] Rui Dai, Srijan Das, Luca Minciullo, Lorenzo Garattoni, Gianpiero Francesca, and Francois Bremond. Pdan: Pyramid dilated attention network for action detection. In Proceedings of the IEEE/CVF Winter Conference on Applications of Computer Vision, pages 2970–2979, 2021.
- [15] Yin Dai, Yifan Gao, and Fayu Liu. Transmed: Transformers advance multi-modal medical image classification. Diagnostics, 11(8):1384, 2021.
- [16] Martin Danelljan, Luc Van Gool, and Radu Timofte. Probabilistic regression for visual tracking. In Proceedings of the IEEE/CVF Conference on Computer Vision and Pattern Recognition, pages 7183–7192, 2020.
- [17] Carl Doersch, Abhinav Gupta, and Alexei A Efros. Unsupervised visual representation learning by context prediction. In Proceedings of the IEEE international conference on computer vision, pages 1422–1430, 2015.
- [18] Jeffrey Donahue, Lisa Anne Hendricks, Sergio Guadarrama, Marcus Rohrbach, Subhashini Venugopalan, Kate Saenko, and Trevor Darrell. Long-term recurrent convolutional networks for visual recognition and description. In Proceedings of the IEEE conference on computer vision and pattern recognition, pages 2625–2634, 2015.
- [19] Alexey Dosovitskiy, Lucas Beyer, Alexander Kolesnikov, Dirk Weissenborn, Xiaohua Zhai, Thomas Unterthiner, Mostafa Dehghani, Matthias Minderer, Georg Heigold, Sylvain Gelly, et al. An image is worth 16x16 words: Transformers for image recognition at scale. arXiv preprint arXiv:2010.11929, 2020.
- [20] Amir Ebrahimi, Suhuai Luo, Raymond Chiong, Alzheimer’s Disease Neuroimaging Initiative, et al. Deep sequence modelling for alzheimer’s disease detection using mri. Computers in Biology and Medicine, page 104537, 2021.
- [21] Cong Fang, Song Bai, Qianlan Chen, Yu Zhou, Liming Xia, Lixin Qin, Shi Gong, Xudong Xie, Chunhua Zhou, Dandan Tu, et al. Deep learning for predicting covid-19 malignant progression. Medical image analysis, 72:102096, 2021.
- [22] Yazan Abu Farha and Jurgen Gall. Ms-tcn: Multi-stage temporal convolutional network for action segmentation. In Proceedings of the IEEE/CVF Conference on Computer Vision and Pattern Recognition, pages 3575–3584, 2019.
- [23] Daniel Freedman and Tao Zhang. Active contours for tracking distributions. IEEE Transactions on Image Processing, 13(4):518–526, 2004.
- [24] Jacob Goldberger, Shiri Gordon, Hayit Greenspan, et al. An efficient image similarity measure based on approximations of kl-divergence between two gaussian mixtures. In ICCV, volume 3, pages 487–493, 2003.
- [25] Kaiming He, Haoqi Fan, Yuxin Wu, Saining Xie, and Ross Girshick. Momentum contrast for unsupervised visual representation learning. In Proceedings of the IEEE/CVF Conference on Computer Vision and Pattern Recognition, pages 9729–9738, 2020.
- [26] Kaiming He, Xiangyu Zhang, Shaoqing Ren, and Jian Sun. Deep residual learning for image recognition. In Proceedings of the IEEE conference on computer vision and pattern recognition, pages 770–778, 2016.
- [27] Jie Hu, Li Shen, and Gang Sun. Squeeze-and-excitation networks. In Proceedings of the IEEE conference on computer vision and pattern recognition, pages 7132–7141, 2018.
- [28] Qiang Huang and Thomas Hain. Improving audio anomalies recognition using temporal convolutional attention networks. In ICASSP 2021-2021 IEEE International Conference on Acoustics, Speech and Signal Processing (ICASSP), pages 6473–6477. IEEE, 2021.
- [29] Md Zabirul Islam, Md Milon Islam, and Amanullah Asraf. A combined deep cnn-lstm network for the detection of novel coronavirus (covid-19) using x-ray images. Informatics in medicine unlocked, 20:100412, 2020.
- [30] Golara Javadi, Samareh Samadi, Sharareh Bayat, Samira Sojoudi, Antonio Hurtado, Silvia Chang, Peter Black, Parvin Mousavi, and Purang Abolmaesumi. Training deep networks for prostate cancer diagnosis using coarse histopathological labels. In International Conference on Medical Image Computing and Computer-Assisted Intervention, pages 680–689. Springer, 2021.
- [31] Nikolai Kalischek, Jan D Wegner, and Konrad Schindler. In the light of feature distributions: moment matching for neural style transfer. In Proceedings of the IEEE/CVF Conference on Computer Vision and Pattern Recognition, pages 9382–9391, 2021.
- [32] Mark D Kohn, Adam A Sassoon, and Navin D Fernando. Classifications in brief: Kellgren-lawrence classification of osteoarthritis. Clinical Orthopaedics and Related Research®, 474(8):1886–1893, 2016.
- [33] Aishik Konwer, Joseph Bae, Gagandeep Singh, Rishabh Gattu, Syed Ali, Jeremy Green, Tej Phatak, and Prateek Prasanna. Attention-based multi-scale gated recurrent encoder with novel correlation loss for covid-19 progression prediction. In International Conference on Medical Image Computing and Computer-Assisted Intervention, pages 824–833. Springer, 2021.
- [34] Solomon Kullback and Richard A Leibler. On information and sufficiency. The annals of mathematical statistics, 22(1):79–86, 1951.
- [35] Zekun Li, Wei Zhao, Feng Shi, Lei Qi, Xingzhi Xie, Ying Wei, Zhongxiang Ding, Yang Gao, Shangjie Wu, Jun Liu, et al. A novel multiple instance learning framework for covid-19 severity assessment via data augmentation and self-supervised learning. Medical Image Analysis, 69:101978, 2021.
- [36] Lei Lin, Beilei Xu, Wencheng Wu, Trevor W Richardson, and Edgar A Bernal. Medical time series classification with hierarchical attention-based temporal convolutional networks: A case study of myotonic dystrophy diagnosis. In CVPR Workshops, pages 83–86, 2019.
- [37] Claudia Lindner, Shankhar Thiagarajah, J Mark Wilkinson, Gillian A Wallis, Timothy F Cootes, arcOGEN Consortium, et al. Fully automatic segmentation of the proximal femur using random forest regression voting. IEEE transactions on medical imaging, 32(8):1462–1472, 2013.
- [38] Chen Liu, Jinze Cui, Dailin Gan, and Guosheng Yin. Beyond covid-19 diagnosis: Prognosis with hierarchical graph representation learning. In International Conference on Medical Image Computing and Computer-Assisted Intervention, pages 283–292. Springer, 2021.
- [39] Mingzhou Liu, Fandong Zhang, Xinwei Sun, Yizhou Yu, and Yizhou Wang. Ca-net: Leveraging contextual features for lung cancer prediction. In International Conference on Medical Image Computing and Computer-Assisted Intervention, pages 23–32. Springer, 2021.
- [40] Djebril Mekhazni, Amran Bhuiyan, George Ekladious, and Eric Granger. Unsupervised domain adaptation in the dissimilarity space for person re-identification. In European Conference on Computer Vision, pages 159–174. Springer, 2020.
- [41] Bjoern H Menze, Andras Jakab, Stefan Bauer, Jayashree Kalpathy-Cramer, Keyvan Farahani, Justin Kirby, Yuliya Burren, Nicole Porz, Johannes Slotboom, Roland Wiest, et al. The multimodal brain tumor image segmentation benchmark (brats). IEEE transactions on medical imaging, 34(10):1993–2024, 2014.
- [42] Mehdi Noroozi and Paolo Favaro. Unsupervised learning of visual representations by solving jigsaw puzzles. In European conference on computer vision, pages 69–84. Springer, 2016.
- [43] OAI. Osteoarthritis initiative. https://nda.nih.gov/oai/.
- [44] Yujin Oh, Sangjoon Park, and Jong Chul Ye. Deep learning covid-19 features on cxr using limited training data sets. IEEE transactions on medical imaging, 39(8):2688–2700, 2020.
- [45] Tulin Ozturk, Muhammed Talo, Eylul Azra Yildirim, Ulas Baran Baloglu, Ozal Yildirim, and U Rajendra Acharya. Automated detection of covid-19 cases using deep neural networks with x-ray images. Computers in biology and medicine, 121:103792, 2020.
- [46] Adam Paszke, Sam Gross, Francisco Massa, Adam Lerer, James Bradbury, Gregory Chanan, Trevor Killeen, Zeming Lin, Natalia Gimelshein, Luca Antiga, Alban Desmaison, Andreas Kopf, Edward Yang, Zachary DeVito, Martin Raison, Alykhan Tejani, Sasank Chilamkurthy, Benoit Steiner, Lu Fang, Junjie Bai, and Soumith Chintala. Pytorch: An imperative style, high-performance deep learning library. In H. Wallach, H. Larochelle, A. Beygelzimer, F. d'Alché-Buc, E. Fox, and R. Garnett, editors, Advances in Neural Information Processing Systems 32, pages 8024–8035. Curran Associates, Inc., 2019.
- [47] Fernando Pérez-García, Catherine Scott, Rachel Sparks, Beate Diehl, and Sébastien Ourselin. Transfer learning of deep spatiotemporal networks to model arbitrarily long videos of seizures. In International Conference on Medical Image Computing and Computer-Assisted Intervention, pages 334–344. Springer, 2021.
- [48] Maithra Raghu, Chiyuan Zhang, Jon Kleinberg, and Samy Bengio. Transfusion: Understanding transfer learning for medical imaging. arXiv preprint arXiv:1902.07208, 2019.
- [49] Mohammad Rahimzadeh and Abolfazl Attar. A modified deep convolutional neural network for detecting covid-19 and pneumonia from chest x-ray images based on the concatenation of xception and resnet50v2. Informatics in Medicine Unlocked, 19:100360, 2020.
- [50] Pranav Rajpurkar, Jeremy Irvin, Kaylie Zhu, Brandon Yang, Hershel Mehta, Tony Duan, Daisy Ding, Aarti Bagul, Curtis Langlotz, Katie Shpanskaya, et al. Chexnet: Radiologist-level pneumonia detection on chest x-rays with deep learning. arXiv preprint arXiv:1711.05225, 2017.
- [51] Olga Russakovsky, Jia Deng, Hao Su, Jonathan Krause, Sanjeev Satheesh, Sean Ma, Zhiheng Huang, Andrej Karpathy, Aditya Khosla, Michael Bernstein, et al. Imagenet large scale visual recognition challenge. International journal of computer vision, 115(3):211–252, 2015.
- [52] Joel Saltz, Mary Saltz, Prateek Prasanna, Richard Moffitt, Janos Hajagos, Erich Bremer, Joseph Balsamo, and Tahsin Kurc. Stony brook university covid-19 positive cases [data set]. the cancer imaging archive. https://doi.org/10.7937/TCIA.BBAG-2923.
- [53] Mark Sandler, Andrew Howard, Menglong Zhu, Andrey Zhmoginov, and Liang-Chieh Chen. Mobilenetv2: Inverted residuals and linear bottlenecks. In Proceedings of the IEEE conference on computer vision and pattern recognition, pages 4510–4520, 2018.
- [54] Baochen Sun and Kate Saenko. Deep coral: Correlation alignment for deep domain adaptation. In European conference on computer vision, pages 443–450. Springer, 2016.
- [55] Jinghan Sun, Dong Wei, Kai Ma, Liansheng Wang, and Yefeng Zheng. Unsupervised representation learning meets pseudo-label supervised self-distillation: A new approach to rare disease classification. In International Conference on Medical Image Computing and Computer-Assisted Intervention, pages 519–529. Springer, 2021.
- [56] Nima Tajbakhsh, Michael B Gotway, and Jianming Liang. Computer-aided pulmonary embolism detection using a novel vessel-aligned multi-planar image representation and convolutional neural networks. In International Conference on Medical Image Computing and Computer-Assisted Intervention, pages 62–69. Springer, 2015.
- [57] Aleksei Tiulpin and Simo Saarakkala. Automatic grading of individual knee osteoarthritis features in plain radiographs using deep convolutional neural networks. Diagnostics, 10(11):932, 2020.
- [58] Aleksei Tiulpin, Jérôme Thevenot, Esa Rahtu, Petri Lehenkari, and Simo Saarakkala. Automatic knee osteoarthritis diagnosis from plain radiographs: a deep learning-based approach. Scientific reports, 8(1):1–10, 2018.
- [59] Ferhat Ucar and Deniz Korkmaz. Covidiagnosis-net: Deep bayes-squeezenet based diagnosis of the coronavirus disease 2019 (covid-19) from x-ray images. Medical hypotheses, 140:109761, 2020.
- [60] Jeya Maria Jose Valanarasu, Poojan Oza, Ilker Hacihaliloglu, and Vishal M Patel. Medical transformer: Gated axial-attention for medical image segmentation. arXiv preprint arXiv:2102.10662, 2021.
- [61] Gül Varol, Ivan Laptev, and Cordelia Schmid. Long-term temporal convolutions for action recognition. IEEE transactions on pattern analysis and machine intelligence, 40(6):1510–1517, 2017.
- [62] Maria de la Iglesia Vayá, Jose Manuel Saborit, Joaquim Angel Montell, Antonio Pertusa, Aurelia Bustos, Miguel Cazorla, Joaquin Galant, Xavier Barber, Domingo Orozco-Beltrán, Francisco García-García, et al. Bimcv covid-19+: a large annotated dataset of rx and ct images from covid-19 patients. arXiv preprint arXiv:2006.01174, 2020.
- [63] Chuang Wang, Andreas Rimner, Yu-Chi Hu, Neelam Tyagi, Jue Jiang, Ellen Yorke, Sadegh Riyahi, Gig Mageras, Joseph O Deasy, and Pengpeng Zhang. Toward predicting the evolution of lung tumors during radiotherapy observed on a longitudinal mr imaging study via a deep learning algorithm. Medical physics, 46(10):4699–4707, 2019.
- [64] Dong Wang, Yuan Zhang, Kexin Zhang, and Liwei Wang. Focalmix: Semi-supervised learning for 3d medical image detection. In Proceedings of the IEEE/CVF Conference on Computer Vision and Pattern Recognition, pages 3951–3960, 2020.
- [65] Linda Wang, Zhong Qiu Lin, and Alexander Wong. Covid-net: A tailored deep convolutional neural network design for detection of covid-19 cases from chest x-ray images. Scientific Reports, 10(1):1–12, 2020.
- [66] Limin Wang, Zhan Tong, Bin Ji, and Gangshan Wu. Tdn: Temporal difference networks for efficient action recognition. In Proceedings of the IEEE/CVF Conference on Computer Vision and Pattern Recognition, pages 1895–1904, 2021.
- [67] Wenxuan Wang, Chen Chen, Meng Ding, Hong Yu, Sen Zha, and Jiangyun Li. Transbts: Multimodal brain tumor segmentation using transformer. In International Conference on Medical Image Computing and Computer-Assisted Intervention, pages 109–119. Springer, 2021.
- [68] Wei Wang, Yuan Sun, and Saman Halgamuge. Improving mmd-gan training with repulsive loss function. arXiv preprint arXiv:1812.09916, 2018.
- [69] Hongliang Yan, Yukang Ding, Peihua Li, Qilong Wang, Yong Xu, and Wangmeng Zuo. Mind the class weight bias: Weighted maximum mean discrepancy for unsupervised domain adaptation. In Proceedings of the IEEE Conference on Computer Vision and Pattern Recognition, pages 2272–2281, 2017.
- [70] Ke Yan, Yifan Peng, Veit Sandfort, Mohammadhadi Bagheri, Zhiyong Lu, and Ronald M Summers. Holistic and comprehensive annotation of clinically significant findings on diverse ct images: learning from radiology reports and label ontology. In Proceedings of the IEEE/CVF Conference on Computer Vision and Pattern Recognition, pages 8523–8532, 2019.
- [71] Ceyuan Yang, Yinghao Xu, Jianping Shi, Bo Dai, and Bolei Zhou. Temporal pyramid network for action recognition. In Proceedings of the IEEE/CVF Conference on Computer Vision and Pattern Recognition, pages 591–600, 2020.
- [72] Xitong Yang, Palghat Ramesh, Radha Chitta, Sriganesh Madhvanath, Edgar A Bernal, and Jiebo Luo. Deep multimodal representation learning from temporal data. In Proceedings of the IEEE conference on computer vision and pattern recognition, pages 5447–5455, 2017.
- [73] Li Yao, Atousa Torabi, Kyunghyun Cho, Nicolas Ballas, Christopher Pal, Hugo Larochelle, and Aaron Courville. Describing videos by exploiting temporal structure. In Proceedings of the IEEE international conference on computer vision, pages 4507–4515, 2015.
- [74] Shuang Yu, Kai Ma, Qi Bi, Cheng Bian, Munan Ning, Nanjun He, Yuexiang Li, Hanruo Liu, and Yefeng Zheng. Mil-vt: Multiple instance learning enhanced vision transformer for fundus image classification. In International Conference on Medical Image Computing and Computer-Assisted Intervention, pages 45–54. Springer, 2021.
- [75] Ling Zhang, Le Lu, Xiaosong Wang, Robert M Zhu, Mohammadhadi Bagheri, Ronald M Summers, and Jianhua Yao. Spatio-temporal convolutional lstms for tumor growth prediction by learning 4d longitudinal patient data. IEEE transactions on medical imaging, 39(4):1114–1126, 2019.
- [76] Zhengxin Zhang, Qingjie Liu, and Yunhong Wang. Road extraction by deep residual u-net. IEEE Geoscience and Remote Sensing Letters, 15(5):749–753, 2018.
- [77] Lei Zhou, Joseph Bae, Huidong Liu, Gagandeep Singh, Jeremy Green, Dimitris Samaras, and Prateek Prasanna. Chest radiograph disentanglement for covid-19 outcome prediction. In International Conference on Medical Image Computing and Computer-Assisted Intervention, pages 345–355. Springer, 2021.
Supplementary Material
In this supplementary material, we provide additional information to further understand our proposed approach. In section 7, we provide an architectural overview of how to calculate a 512 dimension vector from last the layer of Temporal Convolutional Network (TCN). We provide dataset and preprocessing details in section 8. Finally in section 9, t-SNE plots and additional class activation maps provide insights into OA severity prediction from knee radiographs.
7 Architecture details - TCN output
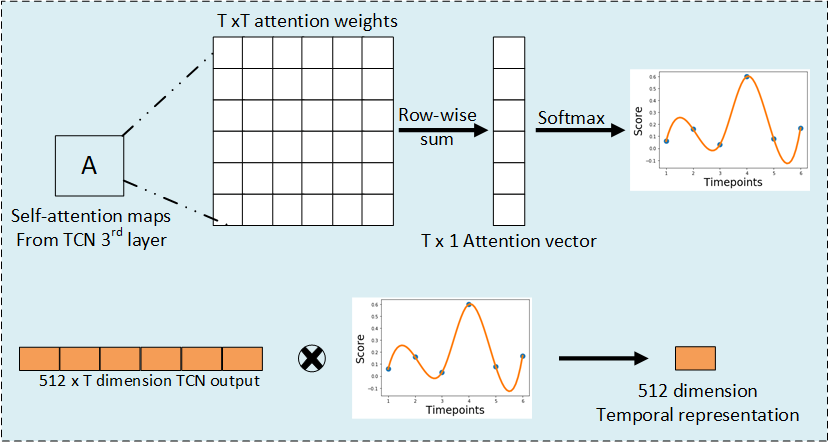
A row-wise summation operation is applied on the self-attention weights obtained from the third and final self-attention block in our TCN architecture. This results in a ‘T’ length attention vector, the softmax of which gives the attention scores. When these attention scores are multiplied with the output of TCN, they generate an optimal 512 dimension representation. The steps are illustrated in Supplementary Fig 7
8 Assets and preprocessing
Chest Radiograph dataset: For snapshot pretraining, we used 28433 chest radiographs (comprising multiple pulmonary diseases). CovidProg dataset, which contained 942 scans from 150 COVID-19 patients, comprised the temporal data. The duration between the CXR scans are variable (1-5 days). The number of timepoints per patient varies from 4 to 16. Out of the total 150 patients, 23 cases were obtained from Newark Beth Israel Medical Center, 77 from Stony Brook University Hospital, and 50 from University Hospitals Cleveland Medical Center.
OA Radiograph dataset: For snapshot pretraining, we used 23008 images. 2474 knee scans from 426 patients comprised the temporal data. The images in the ‘train’ folder of Kaggle [12] were a fraction of the snapshot cohort used in pretraining the transformer. All the images in ‘validation’ and ‘test’ folder [12] were jointly used in finetuning stage.
The experiments were performed in a 5-fold cross validation setting in the finetuning stage where the pretrained transformer model was finetuned on 4 folds and tested on the remaining fold. Details about the data used for each stage can be found in Supplementary Table 5
| Stage | COVID | OA |
|---|---|---|
| Snapshot | 21165[13] + 7268 [62] | 17230 [43] + 5778 train folder [12] |
| Temporal | 942 (CovidProg) | 2474[43] |
| Finetune | 631 (Vent.), 531 (Mort.) [52] | 2482 val + test folder[43] |
COVID-19 preprocessing: Lung region segmentation was first performed using a Residual UNet model [76]. All chest scans were aligned to the same intensity range through an average histogram matching method.
OA preprocessing: We utilized BoneFinder tool [37] to localize and crop the knee joint landmarks. Following [58], histogram clipping and global contrast normalization were applied to each localized knee joint image.
Samples of COVID and OA images after pre-processing are shown in Supplementary Fig 8 and Supplementary Fig 9, respectively.
9 Insights from OA severity prediction
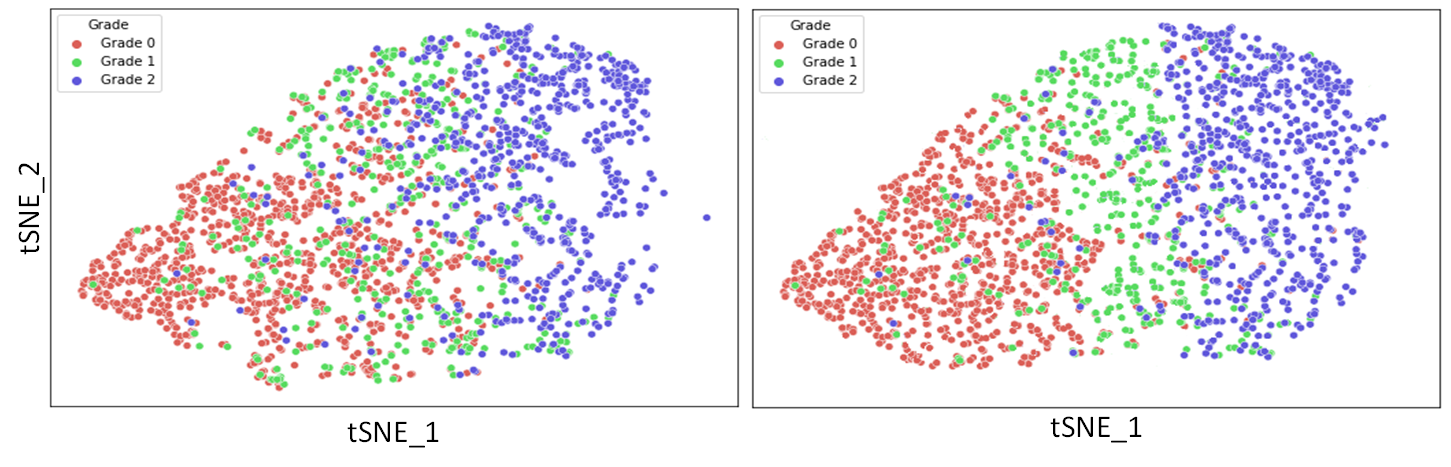
Supplementary Fig 10 demonstrates that utilizing temporal representations in our architecture results in better defined clusters for the three severity grades on the t-SNE plot. It may be observed that intermediate grades, such as 1 vs 2, which are more difficult to predict (left) can benefit from the proposed temporal approach (right). Additional CAMs of OA affected knees are compared in Supplementary Fig 11. Each row corresponds to knee radiographs from different severity grades, from 0 to 4. As may be observed, the attention maps from DeepKnee [58] , CNN + Ordinal loss [9] and SE block [27] are very sparse and sometimes react to unnecessary areas (bone texture, joint centre). On the contrary, our method provides more focused attention on the osteophytes and joint narrowing - the two important indicators of osteoarthritis.
10 Recalibration using matching data
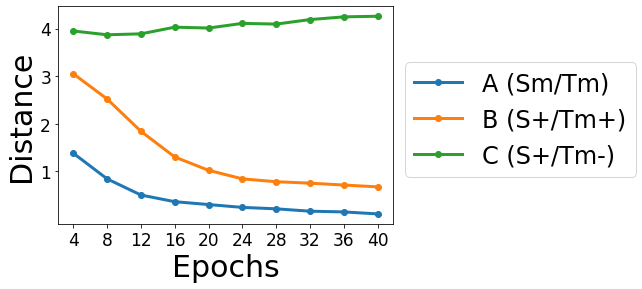
In the COVID-19 cohort, we included some matched data. 100 of 150 patients in the CovidProg temporal dataset also have their ventilation status known. We use the 100 patients, take the baseline scans (the first image) of their temporal sequences as matched snapshot images. We evaluated the distance between these matched temporal/snapshot data in the representation space through training. In Supplementary Fig 12, Curve A (blue) shows the average distance () between the matched pair of snapshot and temporal representation. is reduced to only 0.10 after 40 epochs. For reference, we also show between any snapshot of positive ventilation status (S+) and any temporal sequence of positive ventilation status (Tm+). The result is Curve B (orange). Meanwhile, we also report between S+ and any temporal sequence with negative ventilation status (Tm-) as in Curve C (green). After 40 epochs, in A,B,C are 0.10, 0.67 and 4.26, respectively. CBA shows that (1) the matched snapshots and temporal sequences are automatically aligned very well during training, thanks to the MMD loss; (2) generally a positive temporal sequence is aligned much closer to a positive snapshot than a negative snapshot, although not as close as the matched pairs.
11 Longitudinal comparison
We also compared our method with other temporal models, namely CNN+LSTM, CNN+biLSTM and CNN+biLSTM+Attention. It may be observed from Supplementary Table 6 that our approach outperforms all these longitudinal models.
| Name | Ventilation |
|---|---|
| Method | AUC |
| CNN+LSTM | 0.82 |
| CNN+biLSTM | 0.83 |
| CNN+biLSTM+Attention | 0.85 |
| Ours | 0.88 |
12 Limitations
In our temporal analysis, the images are not registered. Registration might result in learning better representations. We aim to address this in the future by using a spatial transformer network as a pre-processing stage before extracting temporal features. Also, due to lack of sufficient temporal data, we did not use transformer architectures to learn disease progression. This research direction can be pursued with the availability of more temporal cases in future.