Spitzer and Herschel studies of dust in supernova remnants in the Small Magellanic Cloud
Abstract
With the entire Small Magellanic Cloud (SMC) mapped by the Spitzer Space Telescope and Herschel Space Observatory, we were able to search 8–250 m images in order to identify infrared (IR) emission associated with SMC supernova remnants (SNRs). A valid detection had to correspond with known X-ray, H and radio emission from the SNRs. From the 24 known SNRs, we made 5 positive detections with another 5 possible detections. Two detections are associated with pulsars or pulsar wind nebula, and another three detections are part of the extended nebulous emission from the SNRs. We modelled dust emission where fast moving electrons are predicted to collide and heat dust grains which then radiate in IR. With known distance (62.44 0.47kpc), measured SNR sizes, electron densities, temperatures from X-ray emission as well as hydrogen densities, the modelling of SMC SNRs is straightforward.
If the higher range of hydrogen and electron densities were to be accepted, we would expect almost all SMC SNRs to be detected in the IR, at least at 24 m, but the actual detection rate is only 25 %. One possible and common explanation for this discrepancy is that small grains have been destroyed by the SNRs shockwave. However, within the uncertainties of hydrogen and electron densities, we find that infrared dust emission can be explained reasonably well, without invoking dust destruction. There is no conclusive evidence that SNRs destroy swept-up ISM dust.
keywords:
ISM: supernova remnants – shock waves – (ISM:) dust, extinction, – ISM: individual objects: DEM S103, NGC 346, ITK 25 — galaxies: individual objects: Small Magellanic Cloud1 Introduction
Dust grains are small particles made of minerals, and are typically composed of silicon or carbon, together with other metals, such as magnesium, oxygen and iron. The detection of a vast amount of dust grains ( ) in the interstellar medium (ISM) of galaxies within the Local Universe and out to high redshifts (e.g. Bertoldi et al., 2003; Watson et al., 2015; Laporte et al., 2017) triggered a debate over how these dust grains could have been acquired in cosmic time. In the Local Universe, asymptotic giant branch (AGB) stars, the late phase of low- and intermediate-mass stars may be able to account for a substantial amount of this dust mass (Gehrz, 1989; Dwek, 1998; Matsuura et al., 2009, 2013), with a possible contribution from ISM grain growth (Tielens, 2010; Galliano et al., 2018). However, the evolutionary timescale for low- and intermediate-mass stars (Morgan & Edmunds, 2003) and the ISM grain growth (Ferrara & Peroux, 2021) might be too slow to achieve the large amounts of dust seen in high redshift galaxies. Supernovae (SNe) have been suggested as an alternative and additional source of dust in the ISM of galaxies (e.g. Morgan & Edmunds, 2003; Maiolino et al., 2004; Matsuura et al., 2009; Cherchneff & Dwek, 2010; Hjorth et al., 2013).
Although SNe eject newly synthesised heavy elements into the ISM, questions remain over the proportion of the metals that condense into dust grains, and how much of the SN and ambient ISM dust can survive SN shocks (e.g. Nozawa et al., 2003; Schneider et al., 2004; Cherchneff & Dwek, 2010; Sarangi & Cherchneff, 2015). Chemical modelling predicts that a SN may produce approximately 0.1–1 of dust (Dwek & Cherchneff, 2011; Sarangi & Cherchneff, 2015), however, their survival rate after encountering reverse shocks is currently predicted as anywhere between 1% and 90% (e.g. Micelotta et al., 2016, 2018; Kirchschlager et al., 2019), a large uncertainty. Moreover, while SNRs expand at speeds ranging between a few hundred and a few thousand km s-1, the forward shock can destroy existing ambient ISM dust (McKee & Hollenbach, 1980; Jones et al., 1996; Bocchio et al., 2014; Micelotta et al., 2018). Even though dust grains may be produced by AGB stars and SN ejecta, the destruction of dust by forward shocks can be so efficient as to lower or eliminate the total ISM dust budget. This has led some to conclude that the ISM of galaxies might not be able to maintain a large amount of dust grains (e.g. Jones et al., 1996; Michałowski et al., 2010).
While modelling predicts both production and destruction of dust by SNe and SNRs, recent observations reveal that indeed SNe can produce a substantial mass of dust in their ejecta. Amongst remnants of core-collapsed SNe, a large amount (0.1–1 ) of dust has been detected, including SN 1987A (Matsuura et al., 2011, 2015; Wesson et al., 2015), Cassiopeia A (Rho et al., 2008; Barlow et al., 2010; De Looze et al., 2017; Niculescu-Duvaz et al., 2021), Crab Nebula (Gomez et al., 2012b; Temim & Dwek, 2013; De Looze et al., 2019). Additionally, there are reports of significant quantities of dust in SMC 1E 01027219 (SNR J0104.07202) (Stanimirović et al., 2005; Sandstrom et al., 2009). However, challenges remain regarding how to measure the amount of dust that can survive passage through the reverse shock, its wake and the follow-up radiation from the SN. These SNRs with dust measurements are relatively young, estimated at 30–1000 years only. In order to evaluate the true impact of SN shocks on dust destruction, the ageing effects on dust should be examined using older SNRs. Somehow among older SNRs, those with pulsar wind nebulae (PWNe), whose ejecta are heated by radiation from the neutron stars (Chevalier, 1977; Chevalier & Fransson, 1992; Hester, 2008) have been frequently reported to have a substantial quantity of dust, including G54.1+0.3 (Temim et al., 2017; Rho et al., 2018), G11.20.3, G21.50.9, G29.70.3 (Chawner et al., 2019), SNR 054069.3 (Lundqvist et al., 2020). It is still yet unknown why the detection rate of ejecta dust in PWNe appears to be higher than in general SNRs. It might be because the presence of a heating source, pulsars, warm the ejecta, thereby allowing the PWN dust to stand out against the cooler ISM dust (Chawner et al., 2019).
The dust destruction rate by forward shocks is even more difficult to estimate. Lakicevic et al. (2015) estimated infrared emission towards Large Magellanic Cloud (LMC) SNRs and surrounding ISM, suggesting ISM dust density is lower towards SNRs. However, the reduced ISM dust density towards the SNRs could be artificially caused by hotter SNR dust emission that can hide a larger amount of colder ISM dust emission along the line of sight (Micelotta et al., 2018). The method used by Lakicevic et al. (2015) gives inconclusive results for the SNR dust destruction rate. Temim et al. (2015) estimated the dust destruction rate in the LMC, however, the actual destruction rate still relies on the theoretical dust destruction rate. Therefore, measuring the dust destruction rate is very challenging. One of the better methods to estimate the dust destruction rate is to consider the energy balance between collisional heated dust grains (by electrons) and radiation (Dwek & Arendt, 1992). Since heating by electron collision and infrared radiation depends on the dust properties, including dust mass and grain size, this method can potentially inform the dust destruction rate, if mass and size of ISM dust grains prior to the shocks can be estimated or assumed. Williams et al. (2006) suggested that infrared dust emissions observed in three SNRs are consistent with collisionally heated dust, and that the estimated dust mass is smaller than the expected SNR swept-up dust mass, hence, dust destruction is occurring. Unfortunately, there was little description of the uncertainties in the estimated dust mass, and it is unclear how accurate the dust destruction rate is. A more recent survey of Galactic and LMC SNRs found that infrared dust emission is overwhelmingly fainter than what the collisionally heated dust model predicts (Seok et al., 2013, 2015; Koo et al., 2016). This discrepancy might either be due to a lack of small dust grains, which have already been destroyed (Dwek et al., 2008), or due to dust grains that are heated by radiation, rather than by collisions (Koo et al., 2016).
To date, studies of dust in SNRs have been limited by small sample sizes. In order to increase the sample size and improve the evaluation of SNR dust emission, we conducted this search in SMC, a dwarf irregular galaxy at a distance of approximately 60 kpc (Van den Bergh, 2007; Graczyk et al., 2020). Due to our viewing angle within the Galactic plane, the evaluation of infrared emission from SNRs often suffers from severe confusion with general ISM emission (Chawner et al., 2019; Chawner, 2020), but viewed away from the Galactic plane, the SMC is much less prone to the ISM confusion problem. A second advantage of studying SMC SNRs is that together with the general known distance, the SMC has an estimated depth of only 4–10 kpc (Hatzidimitriou et al., 1993; Subramanian & Subramaniam, 2009; Graczyk et al., 2020), translating to distance uncertainties of only about 15–20% for the SNRs. This is in contrast to Galactic SNR distances, where uncertainties often amount to a few factors. Distance uncertainties propagate into the sizes and inferred dust masses of SNRs, so the distance uncertainties are an important factor in dust analysis. Thirdly, the local star-formation history has been analysed, so that the ages of SNRs may be more estimated (Lopez et al., 2014; Auchettl et al., 2019). Fourthly, there is a complete X-ray image of the SMC, which can inform the electron temperature and electron density measurements (Auchettl et al., 2019; Maggi et al., 2019). The electron temperature and density are crucial parameters for a collisionally heated dust model.
The SMC has the disadvantage of being more distant than the Milky Way, so that SNRs tend to be fainter, and have fewer expansion velocity measurements available. Above all, there are only about 25 SNRs or SNR candidates known in the SMC (Maggi et al., 2019), compared with over 250 SNRs and candidates in the Milky Way (Green, 2009). Nevertheless, with electron density and temperature measurements, important in estimating the dust destruction rate, plus infrared images, we were able to conduct the following analysis of SMC SNRs.
Note that the SMC is known to have a much lower metallicity than the Milky Way or the LMC, and it has been estimated that the dust-to-gas ratio in the SMC ISM is much lower (Gordon et al., 2014).
2 Source catalogue
We assembled a list of known SNRs in the SMC from several references, mainly radio and X-ray surveys.
The optical H and [N II] emission line surveys were originally used to find large nebulous objects in the SMC (Davies et al., 1976), but their classification as SNRs had to await the application of early radio detections. Radio surveys are effective at detecting the synchrotron radiation produced by SNRs, clearly separating them from other large nebulous objects such as HII regions. Since the year 2000, a new generation of radio surveys at the Australia Telescope Compact Array (ATCA) has led to the identification of nearly 30 SNRs and SNR candidates (e.g. Filipovic et al., 2002; Filipovic et al., 2008; Payne et al., 2007). In each case the radio brightness and spectral index were used to determine the synchrotron component.
Most SNRs stand out in the X-ray wavelength (Borkowski et al., 2006; Bozzetto et al., 2017), providing an extra means of identification. One of the first X-ray surveys of the SMC resulted in the Chandra Catalogue of Magellanic Cloud Supernova Remnants which listed 14 in the SMC 111https://hea-www.harvard.edu/ChandraSNR/snrcat-lmc.html. A further catalogue from Badenes et al. (2010) listed 23 remnants with X-ray and radio band detections using existing catalogues such as Filipovic et al. (2005). Most of the remnants listed by the Chandra Catalogue appeared in Badenes et al. (2010), apart from SNR B004473.4, N19, HFPK-285 and SXP-1062. The XMM-Newton study by Haberl et al. (2012) included the remnants catalogued by Badenes et al. (2010), while adding SXP-1062, and three new candidates, bringing the total to 30 SMC remnants. Finally, Auchettl et al. (2019) derived elemental abundances and SN types, describing whether SNRs are the result of core collapse or not. Based on elemental abundances, they eliminated some SNR candidates, leading to a total of 25 SNRs and SNR candidates. It was important that the catalogue contained celestial coordinates and sizes, so the location of the infrared-counterpart could be localised. The catalogue also contained X-ray brightness, as the plasma detected in X-rays is thought to be responsible for infrared dust emission from SNRs with shock heated gas (Dwek et al., 2008; Koo et al., 2016).
More recently, a catalogue of SMC SNRs was used to investigate SNR populations, the star-formation history, and dust destruction rates (Badenes et al., 2010; Temim et al., 2015), as well as SNR morphologies and the impact they make to their environments (Lopez et al., 2014). These catalogues laid the foundations for multi-wavelength studies of SMC SNRs spanning X-ray to radio wavelengths, leading to measurements of metallicities and estimates of progenitor star masses (Maggi et al., 2019). Maggi et al.. listed XMM, optical and radio images of SMC SNRs, which we include as reference images to compare with Spitzer and Herschel images.
[tabular= l l c c cc ll l c l l l c l,
table head=Name RA Dec D D. Wav. S. Wav. Type Ref Comment
, table foot=]
list3.csv
\csvcoli \csvcolii \csvcoliii \csvcoliv \csvcolv \csvcolvi \csvcolvii \csvcolviii \csvcolix \csvcolx \csvcolxi \csvcolxii
Some SNRs (J0046.67307, J0047.57307 and J0052.97237) are listed with slightly different coordinates arising from observations made at different wavelengths, so both of them are listed after ‘=’.
D: Diameter is in arcmin. D.Wav.: Wavelength used for measuring the diameter (R: radio and X: X-ray). S. Wav.: Studied wavelengths in the literature.
References:
A: Auchettl
et al. (2019), B: Badenes
et al. (2010), C: Chandra Catalogue, F: Filipovic
et al. (2005), f: Filipovic
et al. (2008), H: Haberl
et al. (2012), M: Maggi
et al. (2019) and N: Nota et al. (2006).
XB: X-ray binary. HXB: high-mass X-ray binary
[tabular= l l lll cc rr ll ll l c l l l c l, table head=Name IR Det kT EM Age Mass () Ref Mass possibilities (%)
, table foot=] list3.csv \csvcoli \csvcolxiii \csvcolxxii \csvcolxxv \csvcolxxviii \csvcolxxi \csvcolxxix \csvcolxxx \csvcolxxxi \csvcolxxxii \csvcolxiv \csvcolxv \csvcolxvi \csvcolxvii
Infrared (IR) detection (either Spitzer or Herschel, or both). kT (keV): electron temperature estimated from X-ray spectra (Maggi et al., 2019), EM: emission measure (Maggi et al., 2019), : hydrogen density estimated from EM. : average hydrogen density in the line of sight, estimated from HI line (Temim et al., 2015). and : predicted surface brightnesses (MJy sterad-1) of a SNR at 24 and 70 m, using (Sect. 5.1). and : the same as and , but using . Age: estimated age in years; Mass: estimated progenitor mass in ; Ref: reference; Mass possibilities: estimated progenitor mass () from star-formation history at the SNR location and the probabilities (%) of the given mass (Auchettl et al., 2019). a: There is a dispute as to whether SNR J0106.27205 is of core collapse or type Ia origin. The estimated mass here is based on the core collapse case. References: B: Blair et al. (2000) H: Hendrick et al. (2005), L: Lopez et al. (2014), K: Katsuda et al. (2018), P: Park et al. (2003), X: Xi et al. (2019),
3 Spitzer, Herschel and Ancillary data
The Spitzer Space Telescope (Werner et al., 2004) and Herschel Space Observatory (Pilbratt et al., 2010) surveyed the SMC at mid- and far-infrared wavelengths. The Spitzer imaging survey of the SMC project, SAGE-SMC (Gordon et al., 2011), used in total 7 bands, IRAC 3.6, 4.5, 5.8 and 8.0 m (Fazio et al., 2004) and MIPS 24, 70 and 160 m (Rieke et al., 2004). The HERITAGE is the Herschel Magellanic Cloud survey (Meixner et al., 2010, 2013) at 100, 160 m from PACS (Poglitsch et al., 2010), and 250, 350 and 500 m from SPIRE (Griffin et al., 2010). The HERITAGE surveyed the Magellanic Clouds with PACS and SPIRE Parallel mode, which has a choice of only two PACS filters (100, 160 m) out of three available filters, and whose fast scan speed limits its PACS spatial sampling rate and sensitivities. For some SMC SNRs, dedicated Herschel pointed observations are available (Proposal IDs: OT1-jsimon01-1 and OT2-ksandstr-3), and these observations have better spatial sampling and better sensitivities. HERITAGE included these pointed observations in the data reduction. In the case of SNR J0104.07202 (or 1E102.27219) from Proposal ID of OT2-ksandstr-3, an additional PACS 70 m image had been taken (Ludwig et al., 2018). The PACS 70 m image has higher angular resolution (FHWM of the point spread function is 5.46"5.76" at medium scan rate according to the PACS Observer Manual) than the Spitzer MIPS 18" resolution at 70 m, so that we used PACS 70 m images. Filter bands and sensitivities are summarised in Table 3.
From all available Spitzer/IRAC bands, we give more weight to IRAC 8.0 m, as SNRs tend to stand out most at 8.0 m compared to other IRAC bands (Reach et al., 2006). IRAC 8.0 m represents [Ar II], H2 lines and synchrotron emission, with a possible contribution of dust emission. The SNR emission at MIPS 24 m band is usually dominated by dust emission (Pinheiro Gonçalves et al., 2011), however, lines such as 26 m [Fe II] and [O IV] (Bouchet et al., 2006; Rho et al., 2008; Sandstrom et al., 2009) might contribute to the brightness.
Although both filters are called ‘70 m band’, the MIPS 70 m band covers 61 to 80 m, while the PACS 70 m band covers a slightly different 60–85 m. The PACS 100 m band ranges from 85 to 125 m. Flux from SNRs at these bands are dominated by dust emission in general, as found in grey body profiles in the far-infrared regime (Gomez et al., 2012b; Chawner et al., 2019). Contaminations of lines (63 m [O I] and 88 m [O III]) are mostly negligible: for example, the fraction of line contaminations are estimated at 5 % and 6 %–13 % at PACS 70 and 100 m bands respectively for the Crab Nebula (Gomez et al., 2012b), and only 6 % and 2 % for Galactic SNR Kes 75 (Temim et al., 2019).
X-ray images are taken from the Chandra Catalogue of Magellanic Cloud Supernova Remnants, if available, otherwise the XMM-Newton survey of the Magellanic Clouds (Haberl et al., 2012) is used. Unless otherwise stated in Figure captions, X-ray images shown are from XMM-Newton 0.2–1.0 keV, a band that indicates the thermal spectrum SNRs, with some contributions from lines, such as oxygen and Fe (Maggi et al., 2019). We use these XMM-Newton images of SNRs, having previously been studied by Haberl et al. (2012) and Maggi et al. (2019), to guide our astrometry for related emission in infrared wavelengths.
Optical H, [O III] 5007 Å and [SII] 6716 and 6731 Å images from the Magellanic Cloud Emission Line Survey (MCELS) (Smith et al., 2000) are also used to identify the structure of SNRs when combined with the infrared images. MCELS surveyed the Magellanic Clouds, with sampling of 2.4 arcsec pixels and 3–4 arcsec resolution (Smith et al., 2000) and has already been used to identity emission from SNRs, planetary nebula, and HII regions (e.g. Reid, 2014). The MCELS images have also been used to identify optical counterparts of SNRs detected in X-ray and radio bands (Maggi et al., 2019). Importantly, these images can also reveal the locations of HII regions, thereby helping to distinguish SNRs from HII regions in our infrared images.
Radio continuum images of the SMC that we used are from the Australian Square Kilometre Array Pathfinder (ASKAP) (Joseph et al., 2019), that covered at two bands at 960 MHz and 1320 MHz. The bean sizes are 30"30" and 16.3"15.1", and the sensitivities are 186 and 165 Jy per beam and respectively. We used a 1320 MHz image to trace the synchrotron radiation from SNRs.
[tabular= l l c c cc ll l c l l l c l, table head=Project Band Res (") Sensitivity Ref
, table foot=] filters.csv \csvcoli \csvcolii \csvcolv \csvcolvi \csvcolvii
Note: 1: PACS angular resolutions depend on mapping scan speed, which varies. 2: PACS 70 m was not used by the HERITAGE project, but used for localised imaging for some dedicated area. Sensitivity varies on the projects. 3: HERITAGE sensitivities. Dedicated local mapping might have better sensitivities. References: B: Bolatto et al. (2007) Smith et al. (2000) G: Gordon et al. (2011) J: Joseph et al. (2019) M: Meixner et al. (2013) S: Smith et al. (2000)
4 Detections of infrared emission from supernova remnants
Following the classification of detection levels from Reach et al. (2006), Pinheiro Gonçalves et al. (2011) and Chawner et al. (2019, 2020), we classified Infrared (IR) detection (either Spitzer or both Spitzer and Herschel) from SNRs into four levels, described in Table. 4. The detection levels of individual SNRs are summarised in Table 2. This should refer to Table 2.
| Level | Description |
|---|---|
| Detection | IR emission is clearly correlated with radio |
| or X-ray structure of a SNR and can be | |
| distinguished from ISM emission | |
| Possible detection | IR emission in the region of the |
| SNR, potentially related to radio or X-ray | |
| structure but confused with ISM emission | |
| Unlikely detection | Detection of IR emission which is |
| probably unrelated to the SNR | |
| No detection |
4.1 Descriptions of Individual SNRs
We present Spitzer and Herschel images of SNRs and their surroundings, with comparison X-ray, optical and radio images. The default X-ray images are XMM Newton 0.2–1.0 keV images, but occasionally other bands (1.0–2.0 or 2.0–4.5 keV) or Chandra images are used. The optical images are mostly H but an [O III] image is used for SNR J0104.07202, as this oxygen-rich SNR allows more detail to be seen in [O III]. The default radio images are 1320 MHz but some figures display at 960 MHz. All alternations of the selected bands are mentioned in the figure captions.
In this Section, only detections and possible detections (Table 2) are included, while unlikely, non-detections and SNR candidates/non-SNRs are included in on-line material (Sections A.1 and A.2).
4.1.1 SNR J004097337, B003972.53, DEM S5: detection
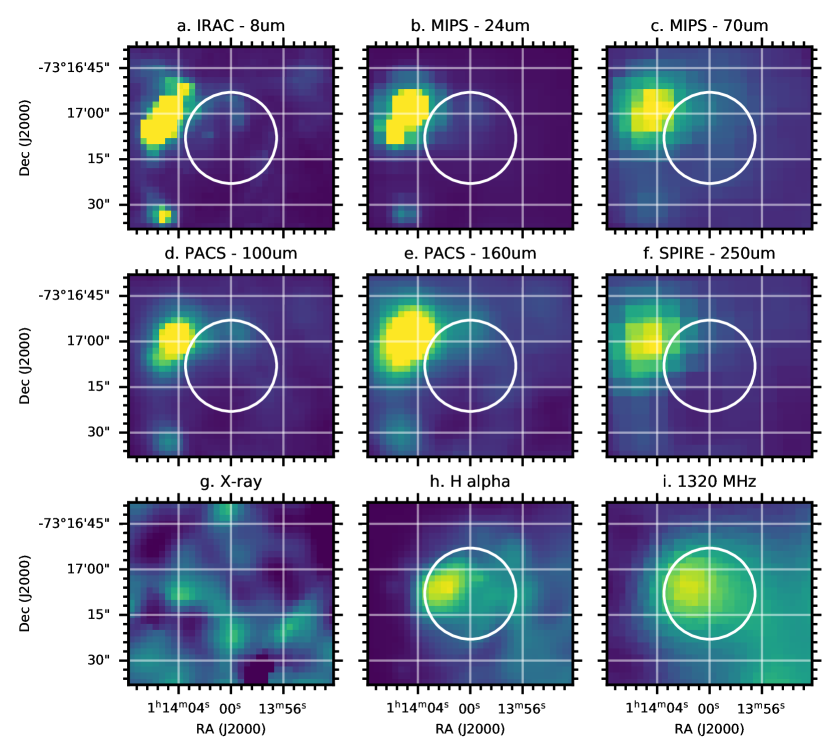
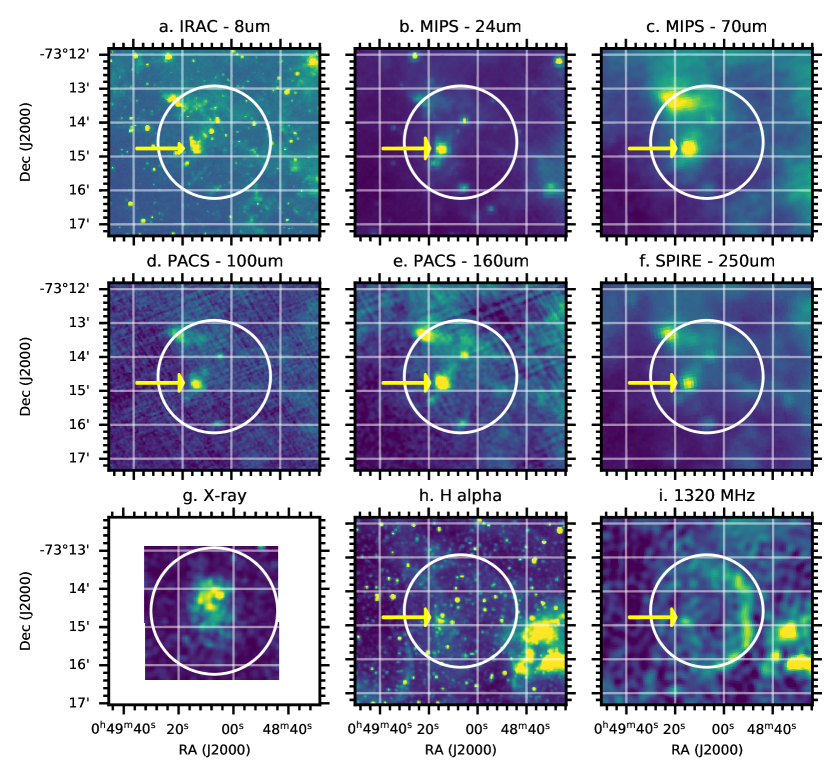
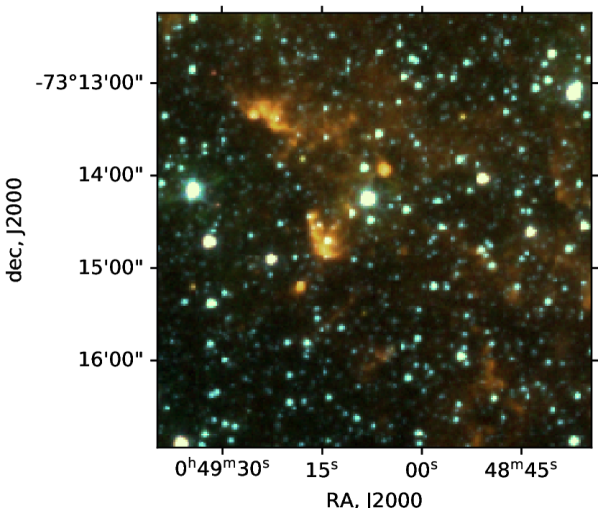
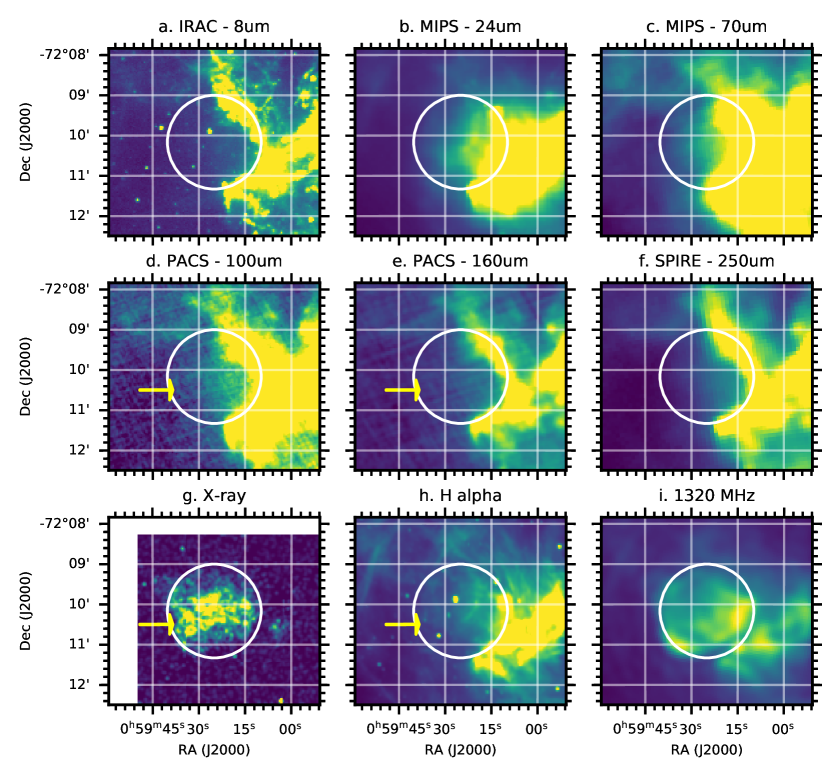
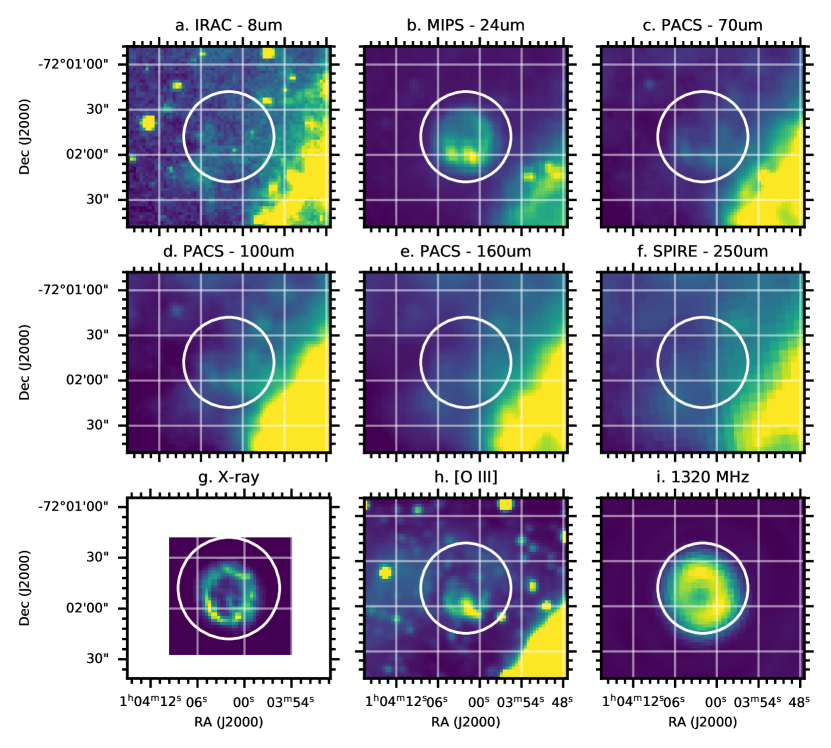
A pulsar-powered bow shock was discovered in SNR J004097337 (Alsaberi et al., 2019), using the Australia Telescope Compact Array (ATAC) at 2048 MHz and IRAC 8 m. This pulsar is a bright point source in the 1320 MHz image (Fig. 1.i). The bow shock was detected as faint filaments both north and south of the pulsar in H and IRAC 8 m images, as reported by Alsaberi et al. (2019). Based on the IRAC mid-IR emission diagnostic, this bow shock is thought to trace shock-excited molecular hydrogen lines (Alsaberi et al., 2019).
The brightest discrete region of the bow shock in H (Fig. 1.h) is also the brightest region in the 8 m image, however, it is not particularly strong at 24 and 70 m. The detection of a strong X-ray point source at this same position and the presence of the pulsar or PWN was suggested from X-ray spectra Alsaberi et al. (2019). Presently the source of this IR emission is unclear, either pulsar/PWN or part of the bow shock.
The most prominent feature of the SNR is the filamentary arc extending north/south and curving around at each end. This can clearly be seen to correlate between the H and IRAC 8 m images. Emission possibly associated with this arc is also found at 70 m but less so at 160 m.
4.1.2 SNR J0046.67307, B0044-73.4, DEM S32: possible detection
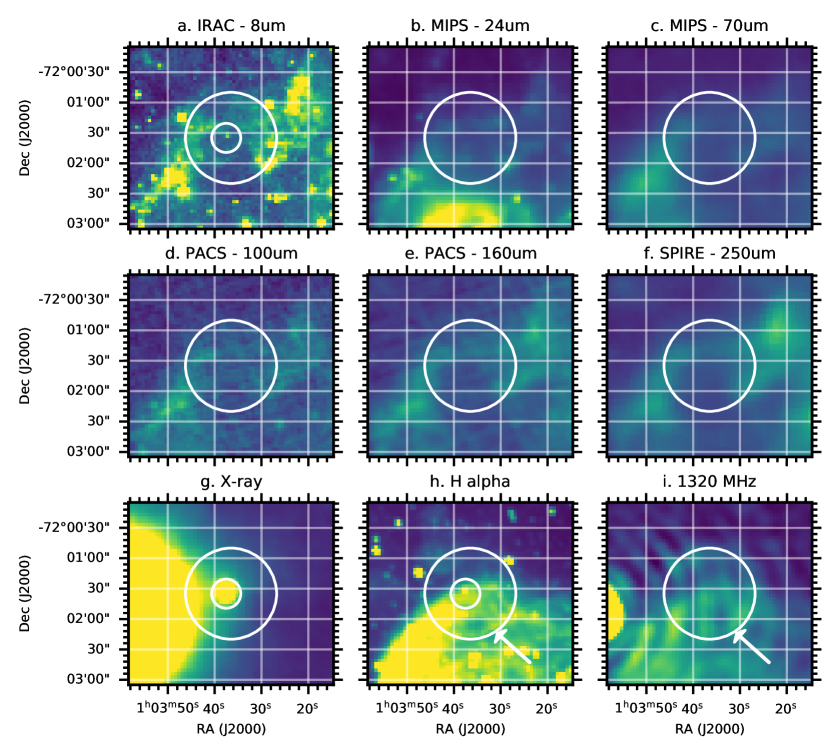
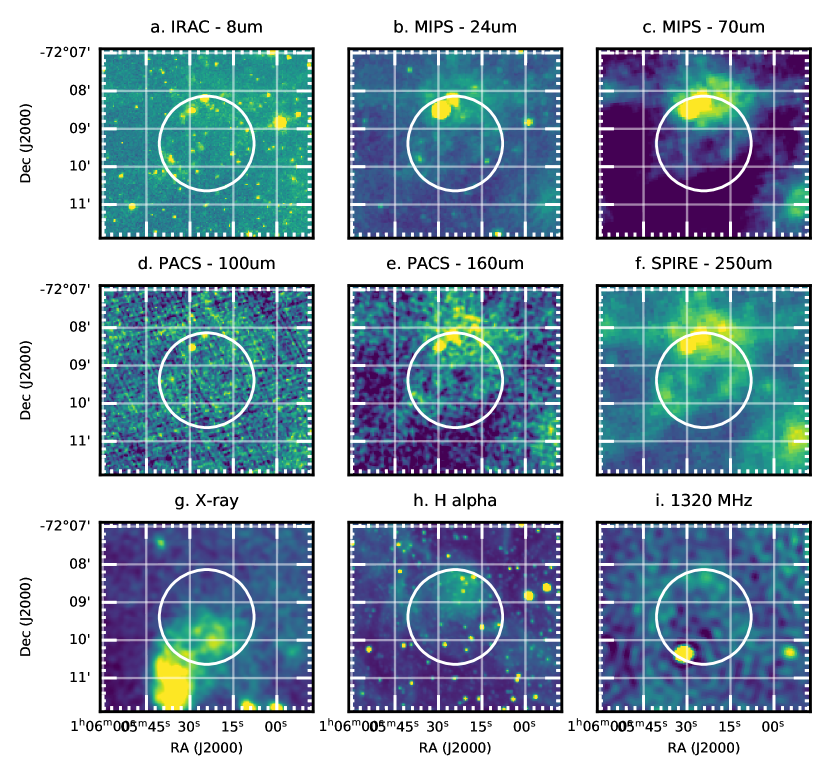
SNR J0046.67307 was initially found in an XMM-Newton image (Van der Heyden et al., 2004) and is a candidate core-collapse SNR (Van der Heyden et al., 2004). Together with SNR J0047.27308 (IKT 2) and SNR J0047.57306, it is one of the three SNRs located in a large complex HII region N19 (Davies et al., 1976; Maggi et al., 2019). SNR J0046.67307 is a shell shaped SNR, as seen in H and the 1320 MHz radio image (Fig. 2) and is surrounded by at least eight molecular clouds (Sano et al., 2019). The bright emission found to the north of the SNR is the HII region NGC 261.
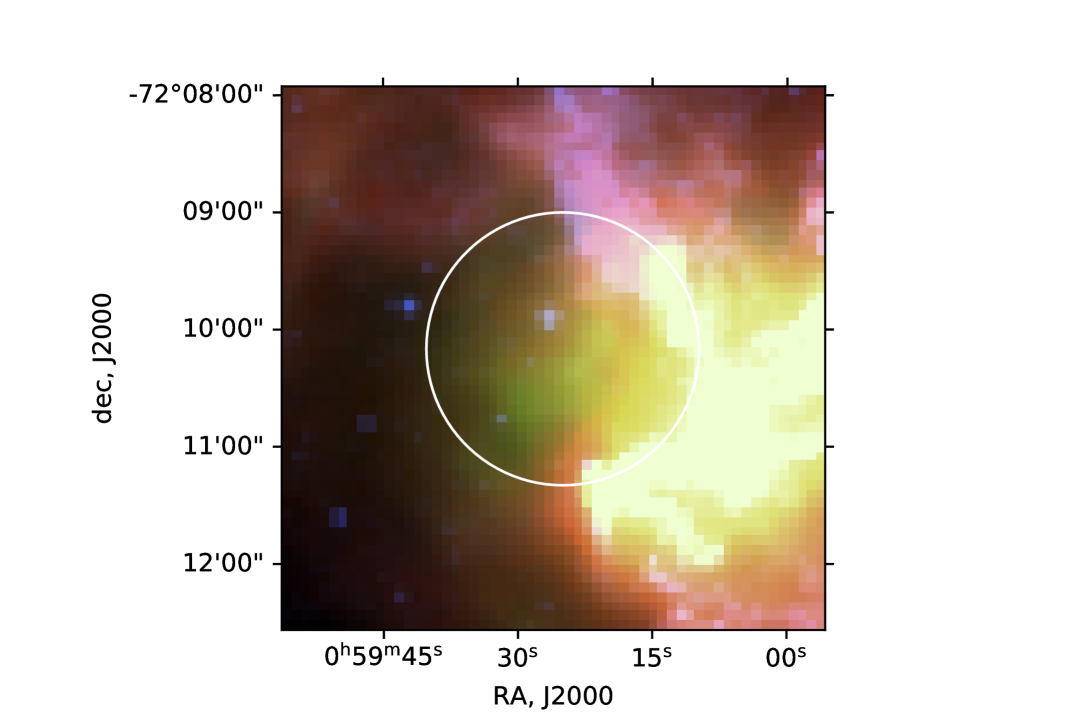
In Spitzer and Herschel images, part of the shell may be detected. The brightest part of the shell in the radio image is south-west, a position where faint emission can also be seen in the infrared images. At a minimum it is clearly detected at 8 and 24 m with associated emission probably detected at longer wavelengths. Since the majority of the arc comprising the shell in H is slightly offset and a different shape to that found in 8 m, we prefer to label this as a “possible” detection. Fig. 3 shows an 8, 24, 70 m 3-color image of SNR J0046.67307, allowing the 8 m emission in south-west part of the shell to show prominently in blue, indicating relatively hotter dust than in the surrounding ISM. In Galactic studies, swept up dust in SNRs tends to be warmer than unrelated ISM dust (Chawner et al., 2019), so it is still highly likely that this arc may be SNR related dust. However, since the potential of this feature being a be part of ISM filaments can not be totally excluded, it is classified as a “possible detection".
Additionally, there is a diffuse cloud found crossing the centre of this SNR from north-east to south-west in all infrared images. This cloud is redder than the south-west shell (Fig. 3), hence, it is probably not associated with the SNR but rather the ISM. Indeed, no emission corresponding to this cloud is found in X-ray nor radio.
The south-east part of the shell contains point sources, and at least one of them is a star detected in the H image. Since it is much brighter at 24 m than 8 m, compared with other stars within the field, it may be either a red star or a dust-enshrouded star. If these point sources are part of molecular cloud D, according to Sano et al. (2019), which surrounds the SNR, they could be recently formed stars, triggered by the compression of the gas from the SNR.
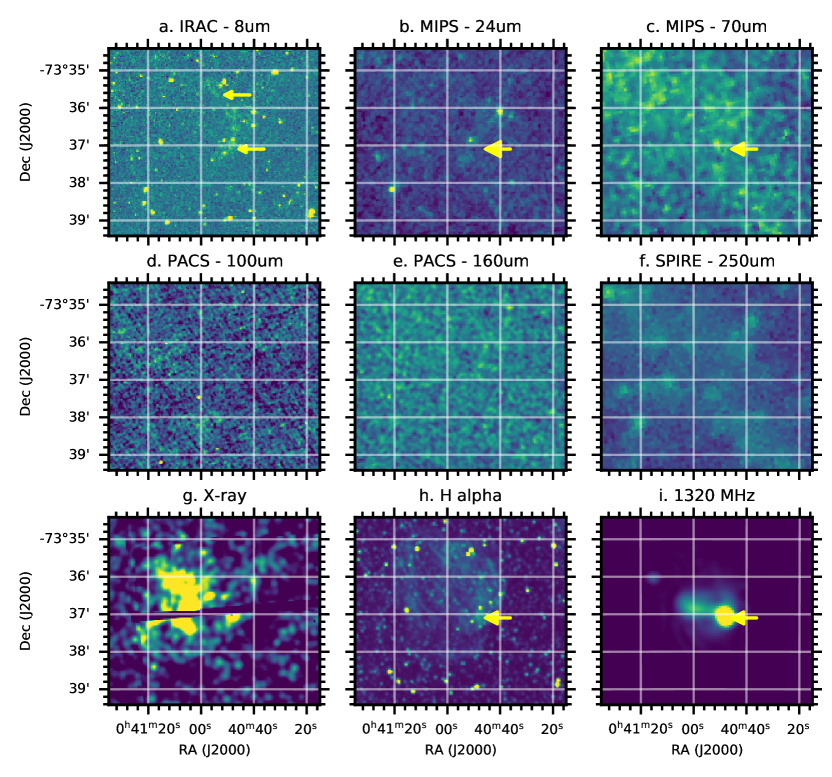
4.1.3 SNR J0049.17314, B0047-73.5, DEM S49, IKT 5: unlikely detection but bow shock detected within a field
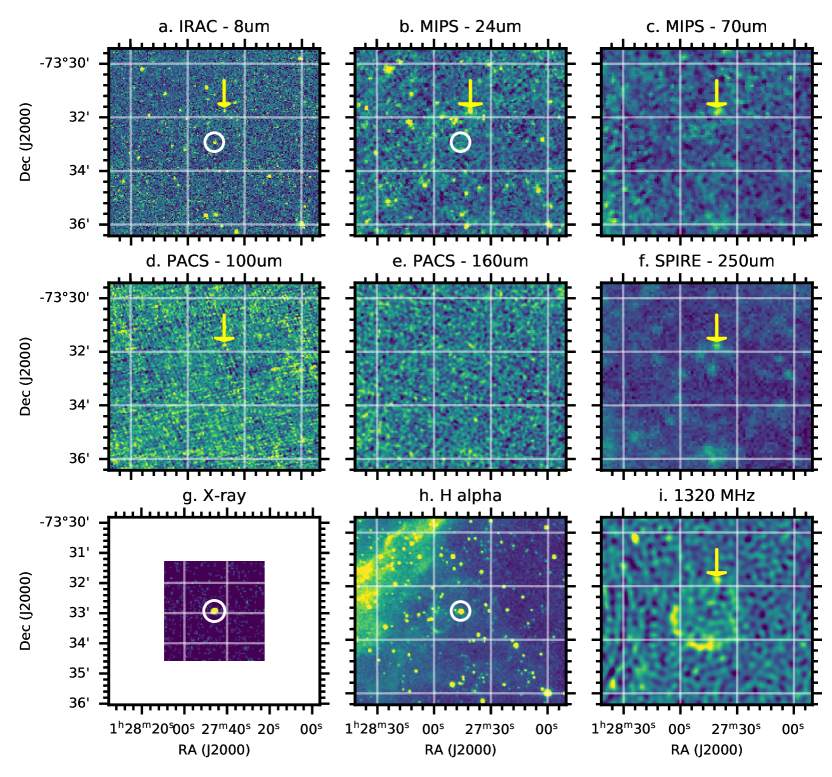
Although we list this SNR as an unlikely detection, a notable detection of a bow shock allows it to be included in this section.
This SNR shows its shell type structure in the radio image, but emission from iron-rich ejecta is found in the centre in the X-ray image, suggesting type Ia origin (Maggi et al., 2019). There is no detection of this shell in the infrared images (Fig.4).
A crescent-shaped emission arc next to a point source is detected on the east side of the white circle in the H and 8 m images (Fig.4 h). This is a bow shock with the crescent and point source also found in the radio image. The crescent is not spatially resolved at longer wavelengths but still detected across all infrared images. Fig. 5 shows a three-colour image of the region, composed of 3.6, 5.8 and 8.0 m. This image clearly indicates the bow shock, as well as some nebulosity extending towards the north-east.
The source of this bow shock is most likely the outflow from the young stellar object (YSO) candidate S3MC J004905.49731356.31 or possibly another YSO candidate S3MC J004914.84731448.37 (Bolatto et al., 2007), both of which sit inside the bow shock. Alternatively, another possible source is a red supergiant candidate SSTISAGEMA J004908.72731355.0 (Seale et al., 2014). The bow shock itself is recorded as YSO candidate S3MC J004914.84731448.37 by Bolatto et al. (2007).
The YSO candidate, S3MC J004905.49731356.31 (Bolatto et al., 2007) appears to be a bright red point source in Fig. 5 and is detected across all Spitzer and Herschel bands (Fig.4). This source is located in a favourable position for causing both the bow shock and the nebulosity located to the north-east of that area (Fig. 5). High-mass YSOs can cause bow shocks associated with their jets, however, in the LMC at 50 kpc, the scale of the jets are recorded as less than 1 arcsec (McLeod et al., 2018). In contrast, the detected bow shock in the SMC is more than 60 arcsec away from the source, i.e. a much larger distance. It could be associated with a high-mass star, but it needs to be confirmed if such a large jet is possible. An alternative possibility is the red supergiant candidate SSTISAGEMA J004908.72731355.0 (Seale et al., 2014), which is seen as a faint green point source to the east of S3MC J004905.49731356.31 in Fig. 5. Similar to S3MC J004905.49731356.31, its location favours it as a source of the bow shock given that mass loss from red-supergiants can trigger bow shocks, as observed in Ori (Ueta et al., 2008; Decin et al., 2012). The bow shock in Ori was about 7 arcmin away from the star at a distance of 197 pc (Decin et al., 2012), corresponding to only about 1.4 arcsec at SMC distance. Therefore the scale of this SMC bow shock seems to be too large to result from mass lost from a red-supergiant. The final possibility is the YSO candidate, S3MC J004914.84731448.37, which is immediately behind the bow shock. It appears however that the star is too close to the bow shock, and the opening angle of the bow does not favour this star as a source. At this point the source of this bow shock remains unclear.
4.1.4 SNR J0052.67238, B0050-728, DEM S68SE: detection
SNR J0052.67238 the radio and H images show several crescent-shaped emission features. An intersecting double crescent feature can be clearly seen in the H and 24 m images. The two crescents in the north are indicated with an arrow in Fig. 6 b. Interestingly, in H the north-west crescent is brighter than the one just south of it, whereas at 24 m, the north-west crescent is much fainter than the one south of it. Diffuse ISM emission is detected around the crescents at 8, and 70–250 m, but the crescent is not distinct at 8 m.
Additionally, a multitude of crescents lay out in the south of the SNR, indicated by an arrow in the H and radio images of Fig. 6. These crescents are probably detected as a diffuse cloud at 24 m.
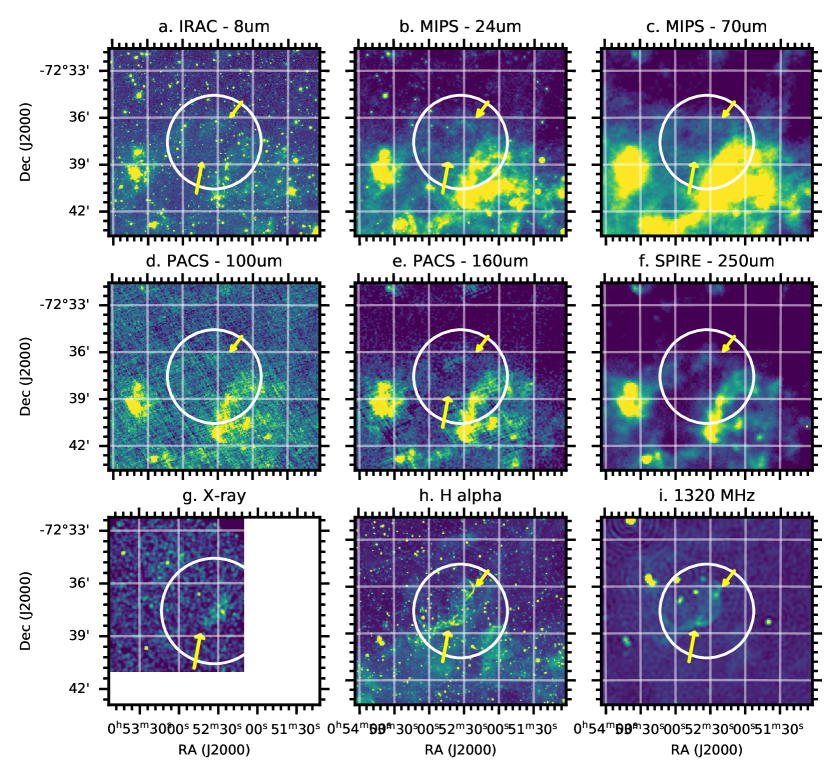
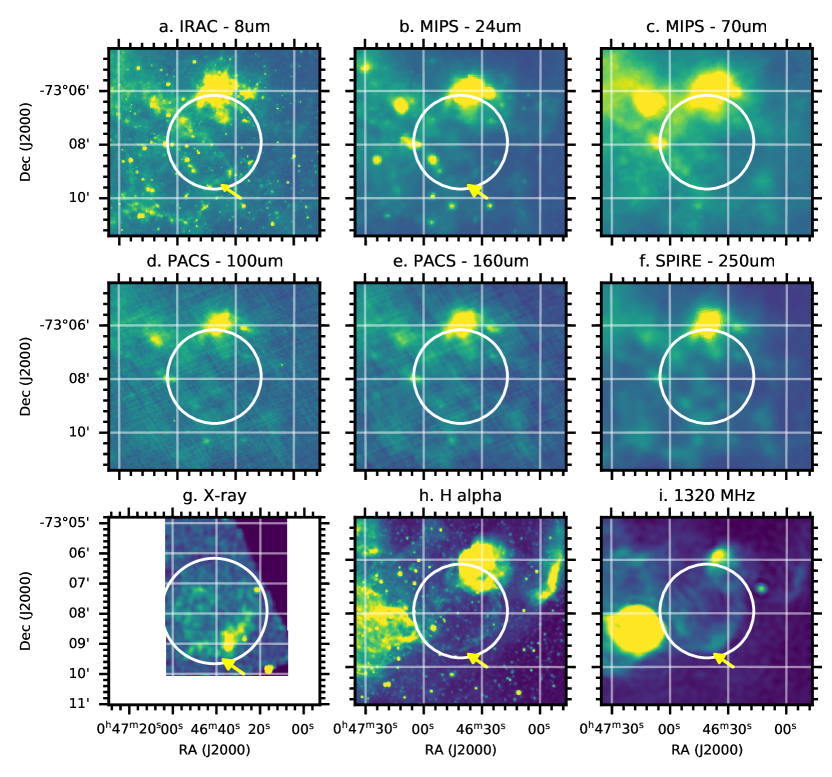
4.1.5 SNR J0059.47210, B0057-72.2, DEM S103, IKT 18: possible detection
This SNR is closely located in N66 HII region. Although it is challenging to separate SNR emission from the intervening HII region at optical wavelengths, the SNR is clearly isolated in X-ray and radio images (Ye et al., 1991; Maggi et al., 2019). Since the HII region is overwhelmingly bright in H and infrared, it is not easy to separate the SNR using these wavelengths. It is possible, however, to remove thermal emission estimated from the H flux from the radio-continuum images (Reid et al., 2006). The remaining non-thermal emission allows the identification of the SNR embedded in the dense N66 region.
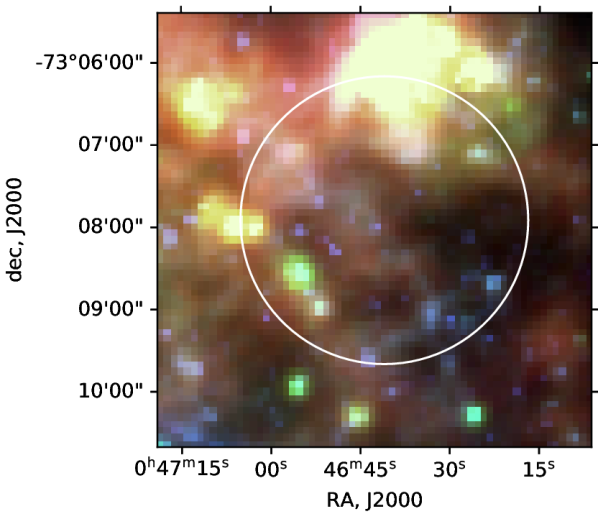
An arc, detected inside the white circle in the H image (Fig. 8), could be associated with SNR J0059.47210 (Danforth et al., 2003; Rubio et al., 2000). The dynamical age is estimated to be about years (Danforth et al., 2003; Nota et al., 2006), using expansion velocities measured in the UV spectrum. Alternatively, this arc could potentially be a bubble formed by a mass-loss wind from Wolf-Rayet star, HD 5980 (Heydari-Malayeri & Selier, 2010), which is seen as a bright point source in the H image (Fig. 8 h). This arc is enlarged in Fig 9, to emphasise the emission in 24 m which has been assigned a green colour. It can be seen that the 24 m emission forms a near-circle, following inside the white circular line until it extends away to south east. Because this arc is visible, we categorise the SNR as a possible infrared detection, however, the arc could be associated with a Wolf-Rayet star rather than the SNR.
The IR image gives the impression that as the SNR expands, it is compressing the surrounding ISM gas, creating a void where only infrared emission between 24 and 100m appears survive. That compression has resulted in a ‘gas deficiency’ in the north-east of N66, whereas in the western side of N66, the HII region is gradually transiting towards a PDR (photon dominated region) (Rubio et al., 2000). Detailed analysis of this region is presented in Sect 6.
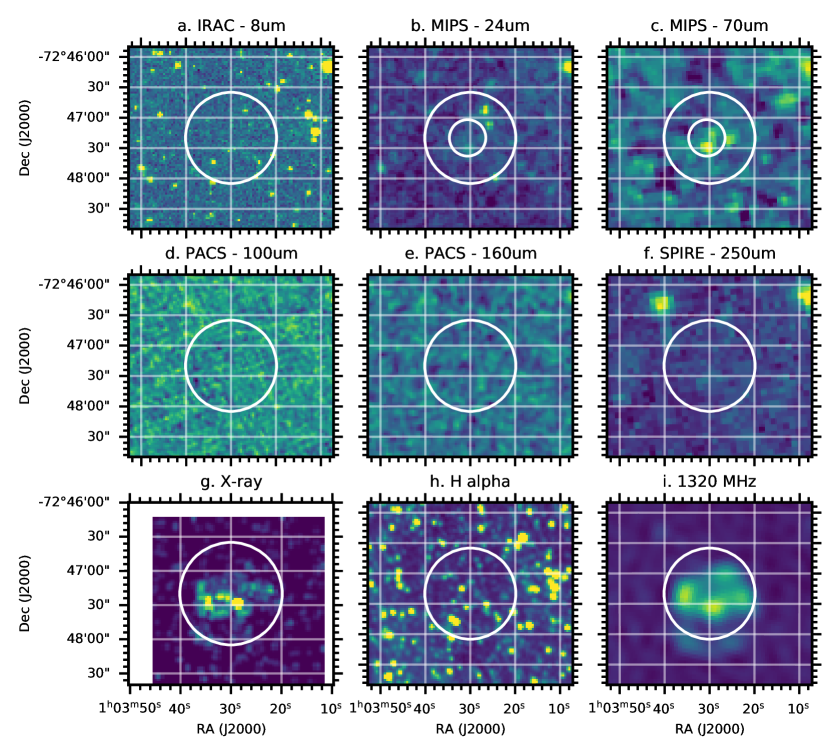
4.1.6 SNR J0103.57247, HFPK 334: possible detection
SNR J0103.57247 contains a bright point source seen in X-ray and radio images, though it is largely disputed whether this source is associated with the SNR or not (Crawford et al., 2014). If the point source is associated with the SNR, it could be a compact source or pulsar wind nebula. This point source is detected at 8, 24, 70 and 250 m (Fig. 10), though it is very faint at 8 and 250 m. This SNR is classified as a possible detection.
4.1.7 SNR J0103.67201: possible detection
SNR J0103.67201 is a relatively new SNR reported by XMM (Maggi et al., 2019) and H (Gvaramadze et al., 2019). There is a point source detected in the 8 m image, and it may be a counterpart to the Be X-ray binary (Gvaramadze et al., 2019). This Be X-ray binary has been associated with the neutron star of SXP 1323 that could have formed at the SN explosion about 40,000 years ago.
Gvaramadze et al. (2019) and Maggi et al. (2019) reported a very thin shell around SXP 1323, next to the HII region N 76, which is very bright in the H image (Nazé et al., 2003a). The south-west part of this shell is pointed out with an arrow in the H image in Fig.11. In the infrared, the emission is dominated by unrelated ISM emission, with some contribution from N 76 at IRAC 8 m and 24 m. No evidence of an SNR shell is found in the infrared.
4.1.8 SNR J0104.07202, B0102-72.3, DEM S124, IKT 22: detection
SNR J0104.07202, or commonly known as 1E 0102.27291, is one of the best studied SNRs in the SMC. Its dust emission was detected by Spitzer (Stanimirović et al., 2005), initially as a part of the SMC survey (Bolatto et al., 2007), later followed by dedicated spectral mapping observations using Spitzer IRS (Sandstrom et al., 2009; Rho et al., 2009). From X-ray spectra, it is known to be oxygen-rich, suggesting that this SNR is a high-mass, core-collapse SN in origin (Dopita et al., 1981). A candidate of the compact object has been reported by Vogt et al. (2018), though it has not been established whether this is really a compact object or not (Hebbar et al., 2020; Long et al., 2020). The estimated age of this SNR is from 1000 up to 3500 yrs (Tuohy et al., 1983; Alan et al., 2019), and the progenitor is potentially of high-mass stellar origin (40 ; Alan et al., 2019). The infrared emission is associated with the X-ray and radio ejecta with the brightest positions or clumps in 24 m closely resembling the brightest positions in [O III]. The estimated ejecta dust mass from Spitzer IRS is about (Sandstrom et al., 2009) to 0.01 (Rho et al., 2009).
As reported by Stanimirović et al. (2005) and Sandstrom et al. (2009), the SNR is clearly visible at 24 m. Herschel SNR dedicated observations (Proposal ID: 2011hers.prop.1802S) took images at 70 and 100 m, resulting in a clear detection at these wavelengths (Fig. 12). At 8 m, two very faint points are detected, the southerly one corresponds to 24 m bright clump, and the other in the east has a counterpart with an X-ray clump. This SNR is located very close to the HII region LHA 115-N76C, which can be seen southwest of SNR J0104.07202 (Fig. 12). This HII region is brighter than the SNR at infrared wavelengths. At 8 m, the SNR is faint but probably buried within unrelated ISM clouds, presumably with polycyclic aromatic hydrocarbons (PAHs) from the HII region and surroundings. The cold dust emission from this HII region and surroundings dominates at 250 m, and contributes some emission at 160 m. In Fig. 12, panel h shows [O III] image, instead of H, as this O-rich SNR stands out better at [O III] than H.
4.1.9 SNR J0105.67204, DEM S128: possible detection
There is a confusion of source names and coordinates for SNR J0105.67204 and SNR J0105.67209. Davies et al. (1976) listed SNR J0105.67204 (DEM S128) and SNR J0105.67209 (DEM S130) in their H+[N II] photographic plates, however, the coordinates in the table and the location on the photographic plates have been mixed up: coordinates read from photographic plates for DEM S128 correspond to the coordinates for DEM S130 listed in their Table 4. Filipovic et al. (2005) and Filipovic et al. (2008) listed J010524720923 as a SNR DEM S128, and J010539720341 as a SNR candidate DEM S 130. Maggi et al. (2019) concluded J010539720341 is probably not an SNR. Therefore, we investigate only SNR J0105.67204 as the SNR DEM S128. The coordinates and the size of this SNR are taken from XMM analysis (Haberl et al., 2012).
In the optical and radio, the north shell extends beyond the X-ray shell (Fig. 13), as pointed out by Maggi et al. (2019). That shell is also noticeable in infrared images, at least at 8 and 24 m, and potentially at 160 and 250 m (Fig. 13). This SNR has been suggested to be type Ia origin (Roper et al., 2015). As it is bright at 250 m, the north shell might be tracing the place where the SNR interacts the most with nearby ISM, as found in Galactic type Ia, Tycho (Gomez et al., 2012a)
4.1.10 SNR J0106.27205, B0104-72.3, IKT 25: detection
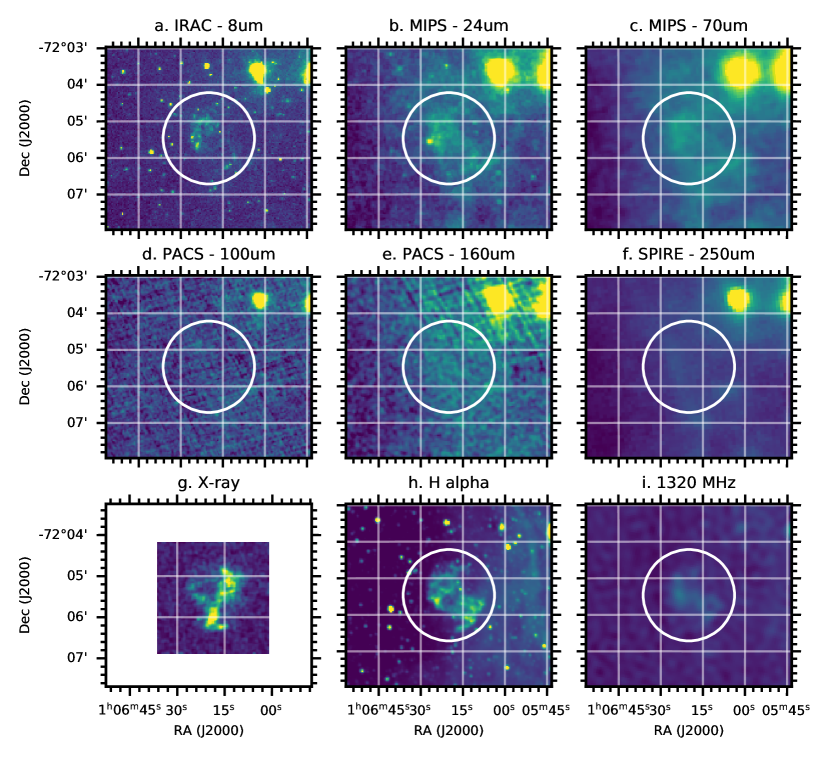
There is a debate as to whether SNR J0106.27205 is of core-collapse or type Ia SN origin. Lee et al. (2011) and Roper et al. (2015) suggested it is a type Ia candidate, due to the high Fe abundance based on XMM and Chandra spectra. Lopez et al. (2014) and Maggi et al. (2019) found that the previous abundance analysis contains an error, and suggests core-collapse origin. If it is a core-collapse SNR, the estimated age is 18,000 yrs old, with a progenitor mass of 18 (Katsuda et al., 2018)
Lee et al. (2011) reported a detection using both IRAC 8 m and AKARI (Koo et al., 2007). We detect this SNR across Spitzer and Herschel images, though it is very faint at 100 m (Fig. 14). There is a difference in morphology between X-ray and H+radio+IR, with the shapes and locations of IR resembling those of H more closely.
4.1.11 SNR J0127.77332, SXP 1062: detection
SNR J0127.77332 shows shell-type structure, with the brightest rim at the south in the radio, while the northern shell is brighter in the optical image (Fig. 15; Maggi et al., 2019). The central source is associated with a Be/X-ray binary, containing a pulsar SXP 1062 (Maggi et al., 2019) and is detected here at 8 m. Additionally, a small blob, which might be a part of north shell, is detected across infrared images (Fig. 15).
5 Analysis of dust emission
From the 24 SMC SNRs, we make a positive section from only 5. Two detections are associated with pulsars or pulsar wind nebulae, and only 3 detections are associated with expanding forward-shocked regions of the SNRs. Another 5 have possible detections. The remaining 14 SNRs turned out to be non-detections both in Spitzer and Herschel bands. The number of the detections of forward-shocked regions in the infrared is relatively small. In order to understand this low detection rate, we make a simple calculation of the expected brightness of dust emission from SNRs under forward shocks, and compare it with the measured brightness.
5.1 Predicted emission from collisionally heated dust grains
As a SNR expands, the gas plunges into the ISM, sweeping up the ambient ISM gas and dust and causing a shock at the expanding boundary. In shocked regions, dust grains are heated up by the collision of fast moving electrons, and destroyed by the collision of high velocity ions and atoms, as well as dust grains (Jones et al., 1994). These forward shocks are considered to be one of the main dust destruction processes in the ISM, and determine the lifetime of the ISM dust grains (e.g. Jones et al., 1996; Micelotta et al., 2018). There are several processes involved in dust destruction. Fast moving particles sputter atoms from the surface of the dust grains, and in high velocity shocks, this sputtering process is very efficient (Dwek & Arendt, 1992). Grain-grain collisions can destroy dust grains at much lower speeds, though more recent simulations demonstrate that coupling sputtering and grain-grain collisions may cause much more damage than a simply adding these two processes (Kirchschlager et al., 2019).
In shocked regions, fast moving electrons play a role in heating dust via collisions. Dwek & Arendt (1992) described the collisional heating rate of dust grains, as
| (1) |
where is the electron temperature, is electron mass, is the electron density, and is the grain size. The equation is based on a combination of the cross section of a grain, average Boltzmann velocity, and the kinetic energy of an electron. Whether an electron goes through a dust grain or not depends on the grain size and the electron temperature, which represents. Dwek & Smith (1996) and Dwek et al. (2008) demonstrated that at a grain size of 0.01 and 0.1 m, the majority of electrons can be stopped., i.e. =1. If grain size is smaller than that range, it is likely to get slightly smaller than 1, however, it has only minor impact, and at a moment, for simplicity, we adopt =1 across. This heating rate is in equilibrium with the radiation from dust grains (), where is the dust emissivity at wavelength . For simplicity, is replaced with the Planck averaged dust emissivity
| (2) |
Although Dwek & Arendt (1992) adopted
| (3) |
following Draine & Lee (1984) and Draine (2011), this is a valid approximation up to 60 K. Unfortunately, small grains may exceed this temperature range, so we therefore calculated , using the for silicates (Ossenkopf et al., 1992). The equilibrium temperature of the dust grains is then obtained by assimilating , whereby the total luminosity becomes (Chawner, 2020)
| (4) |
We calculate the spectrum of the dust emission, using the grey body, i.e., , and as calculated for silicates (Ossenkopf et al., 1992). We tested a mixture of silicates and amorhous carbon (Zubko et al., 1996), adopting dust-to-gas mass ratios of the Milky Way for silicates () and amorphous carbon () (Tielens, 2010), and the fact that elemental abundance ratios for the Milky Way and Magellanic Clouds are similar (Gordon et al., 2014). However, the mid-infrared emission is dominated by silicate emission, and for simplicity, we only used silicates for the rest of our discussions.
The total emission from all grains is calculated by integrating across grain sizes . We start with the smallest grain size () of 0.005 m and the largest grain size () is 0.25 m, following the SMC ISM value (Weingartner & Draine, 2001). The smallest grain size is much smaller than the value of 0.023 m adopted by Dwek et al. (2008) for SN 1987A’s circumstellar ring, but the largest grain size is the same as that given by Dwek et al. (2008). The power law index of is used for the number distribution of dust grains (Mathis et al., 1977).
We estimated the electron density and electron temperature from X-ray observations of SNRs. Maggi et al. (2019) listed and emission measure of SMC SNRs, and is estimated from , where is the filling factor, and is the volume of the SNR. The filling factor is assumed to be 1 (Maggi et al., 2019), initially, and is calculated from the diameters in Table 2. Maggi et al. (2019) also used to estimate hydrogen density as , where a factor of 1.2 represents the difference between hydrogen and electron numbers for a fully ionised gas. The diameters in this table have been measured in radio even though radio and X-ray diameters might be different. Maggi et al. (2019) showed that the majority of SMC SNRs have a hydrogen density of about 0.03–0.06 cm-3 (Table 2).
Finally, we estimate the dust mass swept up by SNRs, assuming all swept up dust grains survive the shocks. That is calculated from the volume of the SNR, ISM hydrogen density or and the gas-to-dust mass ratio in the ISM. Temim et al. (2015) estimated the local ISM hydrogen density, using the HI emission line, and estimated the line of sight depth of the SMC, the values of which we used for . All SMC SNRs have an range of 0.5–1.9 cm-3. As found in Table 2, the values of are about 10–20 times higher than those of , estimated from SNR EM by Maggi et al. (2019). Subsequently, this also affects the estimated swept up dust mass by the same factor. We will discuss this discrepancy later in Sect. 5.2. Finally the gas-to-dust mass is assumed to be 500 (Gordon et al., 2014). This is the smallest value within the range (500–1300), expected from the elemental abundance (Gordon et al., 2014).
5.2 Dust emission from a SNR
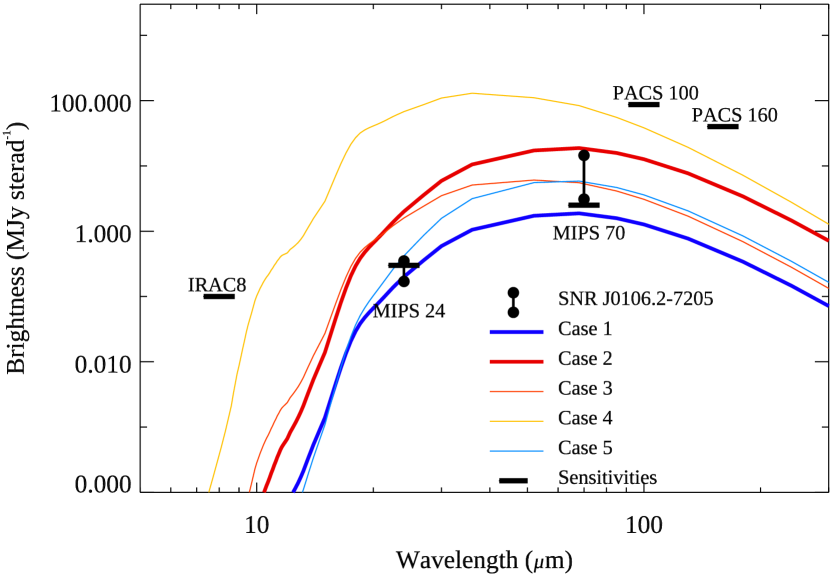
We take SNR J0106.27205 (ITK 25) as an example of the predicted emission from dust grains, swept-up by an SNR.
Case 1 (blue line) in Figure 16 shows the predicted dust emission from SNR J0106.27205 (ITK 25), assuming that all swept up dust can survive SNR-ISM shocks. The swept-up dust mass is estimated, using the hydrogen density from the X-ray emission measure (Maggi et al., 2019). Case 2 (red line) shows the predicted dust emission, using the hydrogen density from the HI emission line (Temim et al., 2015). Fig. 16 includes approximate average brightnesses of SNR J0106.27205 at MIPS 24 and MIPS 70 m bands, indicated by circles. The large uncertainties in the surface brightnesses are caused by uncertainties in estimating ‘background’ levels, as they are inconsistent across the span of the SNR. The total surface brightness of the background and SNR in MIPS 24 m is above the sensitivity limit however MIPS 24 brightness range goes below the sensitivity limit (5 ) after ‘background’ subtraction. The predicted emission of case 1 is much closer to the approximate surface brightness of SNR J0106.27205 (ITK 25). This one assumes that all swept-up dust grains survive shocks, i.e. no dust destruction. However, there is a caveat to this interpretation.
As mentioned in Sect. 5.1, there is a factor of 10–20 discrepancy in two different methods of estimating hydrogen densities. The one from X-ray EM is =0.04 cm-3, while HI along the line of sight gives =0.9cm-3. The obvious cause of this difference is the assumed size of the SNR, hence, its volume used for converting EM to . As seen in Fig. 14, this SNR has an irregular shape, and the size we applied is the largest radius, assuming symmetric shape, so that reducing the radius is reasonable. Increasing the radius by a factor 2 can increase to 0.3 cm-3. Naturally, by reducing the estimated radius, and hence the volume, the total dust mass also reduces. On the other hand, by reducing the volume, the electron density, goes up by a factor of , increasing the total heating. Therefore, reducing the size by a factor of 2 causes the emission to look like case 3 in Fig. 16, where dust is warmer than case 1 and overall emission is increased. The temperature of the smallest grain is 60 K for case 1, and 71 K for case 3. In this case, the 24 m surface brightness is over-predicted by a factor of 5–10.
We can make a further experiment by matching the and by decreasing the filling factor from 1 to 0.1 for , as . The radius is kept at the initial size. In this case, goes up by a factor of 10, i.e. an increase in the heating source, and the total dust mass increases by a factor of 10 over and above case 1 (but the dust mass remains the same as case 2), resulting in a much hotter and brighter dust emission (case 4 in Fig. 16). The smallest grain has an equilibrium temperature of 86 K in case 4, much hotter than 60 K for case 1. Case 4 is very unlikely, because it over-predicts 24 m flux by a factor of 200–400.
One possible way to accept the low filling factor described in case 4, but to match the observed brightness would be to remove the small dust grains from the equation. Because smaller grains tend to reach higher equilibrium temperature, removing small grains can result in reducing emission at shorter wavelengths, thereby also reducing overall emission. Case 5 demonstrates dust emission only limited from grains between 0.18–0.25 m, instead of default 0.005–0.25 m as in case 4. The total dust mass is reduced to only 18 % of case 4, i.e. equivalent to a scenario where smaller dust grains have been destroyed by SN shocks, and only larger dust grains survived. Since large grains tend to have lower dust temperatures than small grains, the model can reproduce the measured surface brightness reasonably well.
Note that very small grains might not reach equilibrium temperature, but instead they can reach higher temperatures. Once small grains absorb the energy from photons, their temperature spikes up, instantly. However, this makes the overall emission much hotter and much brighter, so that the discrepancies between the measured brightness and predicted brightness in case 2 or 3 would worsen.
There is about 10 % numerical error in the model brightness, so that the difference between and does not linearly reflected in / or / in Table 2.
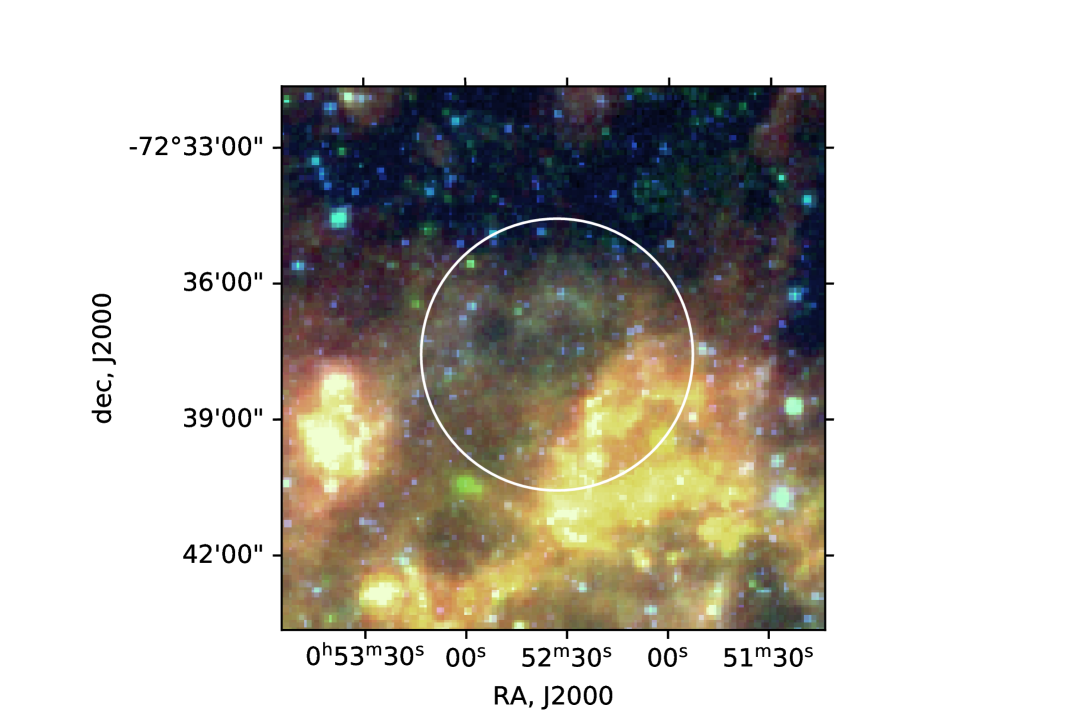
6 Dust temperature and density analysis of SNR J0059.47210 (DEM S103)
As the SNR J0059.47210 (DSM S103) looks as if it collides with the star-forming region NGC 346, we investigate its effect on dust, using Spitzer and Herschel images.
6.1 Analysis
We used Spitzer MIPS 24 and 70 m, Herschel PACS 100 and 160 m and SPIRE 250 m images.
Only for this analysis, we used residual images from SAGE-SMC for MIPS 24 and 70 m bands. The residual images are the images after point sources were subtracted. These removed point sources include bright clusters in the star-forming regions 0f NGC 346. All images were smoothed to have a 6 arcsec pixel pitch, matching to the coarsest angular resolution of the Herschel SPIRE 250 m band. Spitzer and Herschel uncertainty maps were used as a for fitting a grey body. As found in the images, the PACS 100 m image has much larger uncertainties, due to its lower spatial sampling rate. The Herschel uncertainty maps reflect this issue, and the weight of 100 m intensities is much lower than the rest of the Spitzer and Herschel images. We also removed S/N10 regions in the final fitted results.
The Spitzer and Herschel images were fitted pixel to pixel, using the grey body of the dust emission. The surface brightness of the dust is associated with the temperature as , where is the Planck function. We used an equation from Gordon et al. (2014), , where the dust surface mass density is in pc-2, the dust emissivity in cm2 g-1 and and in MJy sr-1. The , was calculated by dust emissivity law = from Hildebrand (1983). We adopted the power law index of from Planck Galactic plane studies (Collaboration et al., 2014), which is consistent with the estimated at SNR-ISM interacting regions in the Galactic plane (Chawner et al., 2019). Grain density of 0.27 m2 kg-1 at 450 m is adopted from Gomez et al. (2010). These properties are overall consistent with the estimated the ranges of dust properties, reported in the SMC ISM (Gordon et al., 2014).
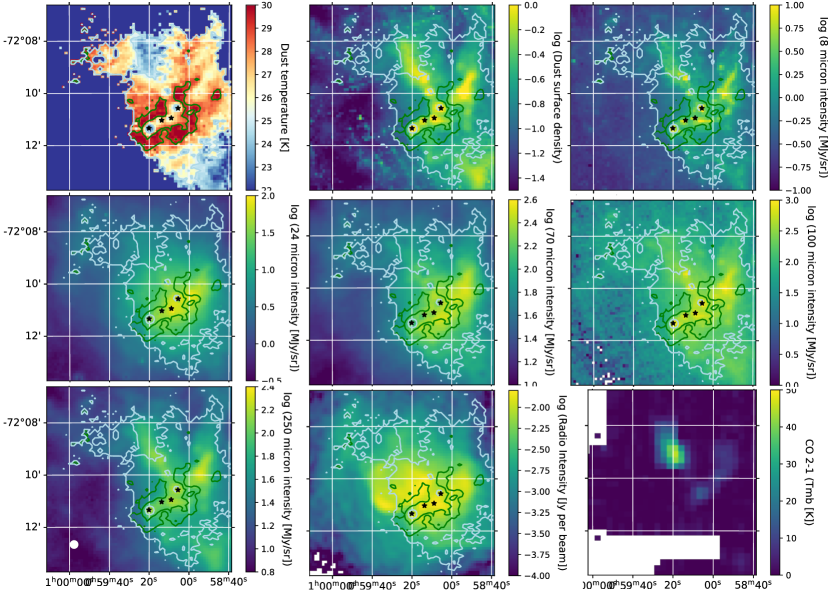
CO =2–1 observations of SNR DEM S103 were obtained, using the Atacama Pathfinder Experiment (APEX) with Heterodyne SIS detector, nFLASH. The data were acquired intermittently from 9th to 14th of December 2020, in OTF mapping mode, and its map is plotted in right bottom panel of Fig. 17.
6.2 Results
Fig. 17 shows the resultant dust temperature and the dust surface mass density in SNR DEM S103 and the neighbouring star-forming region NGC 346. The top panel shows (left) and (right). The contour of is overlaid in Spitzer 8, 24, Herschel 70, 100, 250 and radio images in the top right, the middle, the bottom left and central panels.
In the south-east region of, NGC 346, the is lower (22 K) at the locations of stellar clusters, marked by stars in Fig. 17. These stellar clusters are surrounded by higher (about 30 K) dust temperature regions. We carefully examined these low temperature regions in the Spitzer and Herschel images as they contain stellar clusters which could have potentially been removed as point sources in the Spitzer residual images, thereby artificially lowering the inferred dust temperature. However, the low temperature is mainly determined through the Herschel images, and these images show little contribution from the stars, hence, we can be confident that the cold dust at these stellar cluster locations is real. Surprisingly, these low regions have bright radio emission. In contrast, the surrounding higher region has fainter radio emission. Between DEM S103 and NGC 346, there is a higher region, and this region corresponds to the gap in radio emission between DEM S103 and NGC 346.
The stellar cluster regions, marked with stars in Fig. 17, have colder , with the highest . Although the dust mass has dependence, because the fitting procedure involves , the difference in dust mass is much larger than what can be explained by at 22 K and 30 K: the difference is 0.49 and 0.33 dex at 160 and 250 m, so that bright infrared emission from these cluster regions is explained by more dust mass towards these regions. There is negligible contribution () of synchrotron radiation at 24–250 m wavelengths, estimated from radio 960 MHz and 1320 MHz images (Joseph et al., 2019). Very low levels of synchrotron and free-free agree with the analysis of SMC molecular clouds by Takekoshi et al. (2017). Further, the 250 m emission, which picks up colder dust, is brighter within this region. Hence, indeed, this area has a higher dust mass, as confirmed in the dust mass map. Some of the dust emission corresponds to filaments being extinguished against the HII region, seen by the optical HST image (Nota et al., 2006). Although not clearly detected in our nFLASH CO image, CO emission was detected in this region in previous mapping (Rubio et al., 2000; Hony et al., 2015).
In the north-west of NGC 346, the dust temperature is low (22–23 K). The low temperature region is not localised at the stellar clusters only, but throughout the entire region, covering multiple stellar clusters and their surrounding regions. That is in contrast to the southern part of NGC 346, where the low dust temperature is localised at stellar clusters only. Also in the north-western region, there is little radio continuum emission detected, but CO is brightest.
On the west, outside of the green contour line, infrared emission is bright, but it is caused by combination of both moderately high temperature (26 K) and high dust mass.
Note that if the S/N is below 10 at 100 m intensity, the temperature has been masked. In the figure, this masked region was assigned a 20 K colour, but this is not a true reflection of the actual temperature. Low temperature regions tend to have less far-infrared emission, hence, fainter and lower S/N in Herschel 100 m images. Therefore, we are unable to measure the dust temperature below 20 K. Gordon et al. (2014) analysed the overall dust in the SMC ISM, and estimated the mean SMC dust temperature of below 20 K, hence it is obvious that we cannot analyse such low temperature regions with insufficient S/N.
6.3 Discussion of the dust temperature map for DEMS103 and NGC 346
The combination of high-surface density and low dust temperatures at the location of the stellar clusters bears a striking resemblance to the G 316.7500.00 ridge in the Milky Way, as seen by Watkins et al. (2019). In the case of G316.75, a high-column density and low-dust temperature filament, containing four embedded O-type stars, is located at the centre of a bipolar HII region, powered by those stars. The photoionising UV radiation from these embedded high-mass stars is inefficient at heating and disrupting gas along the axis of the filament, but can much more easily escape in the perpendicular direction, ionising the surrounding lower-density gas that is exposed to the radiation.
A similar scenario could explain many of the features in the west of NGC 346, such as the presence of the cold, high-density dust ridge surrounded by the ring of warmer and more diffuse dust. The warm dust is associated with the HII region, and has probably been heated by massive stars contained within the clusters embedded within the ridge. This ridge could well be the natal ridge from which the stellar clusters formed, and may itself be the result of compression by the SNR on the north-east side (Sect. 4.1.5). Because the ionised gas mass (and therefore heated dust grains) within it probably accounts for only a small fraction of the total mass, the cold dust dominates the temperature map. The HII region on the south-western side of the ridge explains the free-free radiation seen within the radio and H data, while on the north-western side of the ridge, the SNR is responsible for the synchrotron radiation. The HII region and the SNR may partially overlap, and the lower gas density on the south-western compared to the south-eastern side may explain the relatively low level of H emission there.
7 Discussions
7.1 SNR detection rate
After examining all 24 SMC SNRs, we report 5 detections and 5 possible detections of associated dust. The MIPS 24 m is the most effective way to identify the SNRs, produced by various combinations of the dust continuum and lines (Pinheiro Gonçalves et al., 2011). The next most useful band is IRAC 8 m. This band is composed of contributions from synchrotron radiation, [ArII] and [ArIII] lines, with possible H2 lines, as well as dust emission (Ennis et al., 2006; Reach et al., 2006). MIPS 70 m is not effective, because of its lower sensitivity and lower angular resolution compared to the 24- and 8-m bands. In the Galactic survey, the PACS 70 m was effective at identifying SNRs together with the other Herschel bands (Chawner et al., 2019, 2020), however, this band is not available for most of the SMC SNRs.
Amongst five detections, two (SNR J0040.97337 and SNR J0127.77332) are associated with pulsars/point sources, and only three have detections of a nebulous component associated with SNRs. That leads to a low 13 % detection rate for extended emission in SMC SNRs. Even including possible detections, in total only 6 SNRs have shown extended emission in the infrared.
Far-infrared surveys of SNRs in the Milky Way show that younger (less than 5 000 years) SNRs tend to be more likely to be detected (Chawner et al., 2020). Amongst 5 detected and 5 possible detected sources, only one (SNR J0104.07202) has a relatively well determined age (2050 years), so it is very difficult to verify this. With limited number, it is difficult to evaluate if the detection rate has the progenitor mass dependence (Table 2). Either lower (8–12.5 ) and relatively higher ( ) progenitor origins may have a higher detection rate, with little detection in between. However, this is a general tendency of the progenitor mass distribution in the SMC SNRs from Auchettl et al. (2019) rather than dust specific results.
Dokara et al. (2021) reported a spatial anti-correlation between mid-infrared emission and radio emission, however, with a limited sample we did not see such a tendency.
7.2 Dust destruction or something else?
It has been pointed out that the collisionally heated dust model over-predicts dust emission from SNRs (Seok et al., 2013, 2015; Chawner, 2020; Priestley et al., 2021). Indeed, our analysis in Sect. 5 may offer this as a possibility: if the , hydrogen density estimated from the HI line is used, the model indeed predicts a much higher brightness than found from those that were measured (case 4). In order to reduce mid-infrared emission, the simplest way is to remove the small grains, leaving only large (0.18 m) grains, thus reducing the dust mass by a factor of 20 %. That might replicate the situation that small dust grains have been destroyed by SN shocks, while large dust grains survive. Since the mass of dust grains is dominated by large grains, only a small reduction in dust mass can substantially reduce the IR emission. In contrast, when case 1, , hydrogen from X-ray EM, is used, the mode predicts a reasonable brightness. Uncertainty of the hydrogen density makes it even more challenging to determine if dust grains have been destroyed or not.
An over-prediction of dust emission by the collisionally heated model does exist in all SMC SNRs in general, not limited to SNR J0106.27205 (ITK 25) demonstrated in Sect. 5. Table 2 shows the model predicts of 0.4–7.2 MJy sterad-1, based on (equivalent to case 2 for SNR J0106.27205), meaning that all SNRs could have been detected at 24 m, as the sensitivity limit is 0.3 MJy sterad-1 (5 ), if there is no ISM confusion. In reality, there are only two detections with two more possible detections out of 8 sources. The detection rates seem to be lower, compared to the prediction from the collisionally heated dust model. One possible explanation is that small dust grains have been destroyed, so the 24 m emission is much lower than predicted. However, we need to be very cautious about this interpretation, as tends to be a factor of 10 or more higher than . It could be possible that the adopted thickness of the SMC for given by Temim et al. (2015) may be a few factors too small, while the adopted radius is a few factors too large. In such a scenario a combination of the two adjustments, even with some ISM confusion, could potential resolve the issue of low detection rate. Therefore, at the present time and from our data, there is no conclusive impartial evidence that dust destruction is commonly occurring in SNR shocks.
One concern is that X-ray and dust emission do not always correspond, spatially. Such an example is found in SNR J0052.67238 (Fig. 6), which shows dust emission in the north, corresponding to H, whereas X-ray emission originates in the south with low detections of dust emission. In this case it is probable that the main SNR ejecta and the densest regions of ISM matter do not spatially correspond. Hot plasma emitting from X-ray emission would be missing the dust grains needed to produce collisional heated dust infrared emissions. If hot plasma is not responsible for dust emission in SNRs, the past dust destruction rate through SNR might have been overestimated.
Slavin et al. (2015) demonstrated that the dust destruction rate reduces substantially, once the shocks change from collisional shocks to radiative shocks. Although there is a dispute over the type of SN involved, the age of SNR J0106.27205 is estimated to be 17,600 years (Lopez et al., 2014). At this age it is in general considered to be in the Sedov phase, typically between a few hundred years old to years old, and the shock is still expected to be collisional. Slavin et al. (2015) argues that at about years old, the radiative cooling is becoming more significant, but SNR J0106.27205 has not yet reached that age. The formal distinction of radiative or non-radiative shocks should be made according to shock velocity (McKee & Hollenbach, 1980). Unfortunately, in this case there is no shock velocity estimate present. We therefore assume that this SNR still experiences collisional (and non-radiative) shocks.
In SNR J0106.27205 the X-ray and IR emitting regions do not always correspond, while IR emitting regions tend to correspond with H. That link may be caused by the effect of the density. From eqs. (1) and (3), the dust luminosity approximately follows . The infrared emission has a dependence, and is proportional to , where is the shock velocity. On the other hand, . Assuming that the electron density in the shocks is linearly related to the upstream ISM gas density , the ISM gas density, hence, may vary by an order of magnitudes in the ISM, while the shock velocity variation within a SNR can be only by a factor of a few, so that ISM gas density could be the major driving factor of infrared brightness. A higher ISM density with a reasonably high velocity shock would therefere cause higher IR emission. X-ray brightness has even stronger dependence on . Assuming that the SPIRE 250-m image represents ISM density along our line of the sight, the ambient ISM density might be higher to the north. Reasonably high ISM density might drive a detectable level of dust emission in the north of the SNR. Also H emission is seen in the north of the SNR, and shocks in this region may be radiative shocks, i.e. shocks with H-recombination lines, weak forbidden lines of low ionised metals and non-thermal X-ray emission (Chevalier & Raymond, 1978; Chevalier et al., 1980; Heng, 2010). This demonstrates that the hydrogen density is crucial for evaluating infrared brightness, hence, whether dust grains being destroyed or not.
In conclusion, within the given uncertainties, we find no conclusive evidence that SNRs have destroyed local swept-up ISM dust. It has previously been suggested that collisional heating of dust grains may over-predict infrared emission in some SNRs (e.g. Williams et al., 2006; Seok et al., 2015), and indeed, this scenario may be accepted if we assume that small dust grains have been destroyed as in the case of SNR J0052.67238. However, we advise caution here when interpreting emission levels. First, electron densities measured from X-ray emission do not necessarily spatially correspond to infrared dust emission. Second, there are uncertainties involved in the size of the SNRs and hydrogen density, even though SMC SNRs have very good distance estimates to date. Considering the uncertainties involved in estimating hydrogen and electron densities, IR emission can be explained without the need to invoke dust destruction.
Acknowledgements
We thank Dr. Piere Maggi for very useful input about X-ray emission. Herschel is an ESA space observatory with science instruments provided by European-led Principal Investigator consortia and with important participation from NASA. This work is based in part on observations made with the Spitzer Space Telescope, which was operated by the Jet Propulsion Laboratory, California Institute of Technology under a contract with NASA. Support for this work was provided by NASA. This publication is based on data acquired with the Atacama Pathfinder Experiment (APEX). APEX is a collaboration between the Max-Planck-Institut fur Radioastronomie, the European Southern Observatory, and the Onsala Space Observatory. The ESO program no is 106.218. MM acknowledges support from STFC Ernest Rutherford fellowship (ST/L003597/1), MJB, AB, and RW acknowledge support from European Research Council (ERC) Advanced Grant SNDUST 694520, and HLG acknowledges support from the European Research Council (ERC) in the form of Consolidator Grant COSMICDUST (ERC-2014-CoG-647939). FDP acknowledges support from STFC Consolidated grant.
Data Availability
Spitzer and Herschel survey data are available at Spitzer Heritage Archive (SHA) (https://sha.ipac.caltech.edu/applications/Spitzer/SHA/) and Herschel Science Archive (http://archives.esac.esa.int/hsa/whsa/)
References
- Alan et al. (2019) Alan N., Park S., Bilir S., 2019, ApJ, 873, 53
- Alsaberi et al. (2019) Alsaberi R. Z. E., et al., 2019, MNRAS, 486, 2507
- Auchettl et al. (2019) Auchettl K., Lopez L. A., Badenes C., et al. 2019, ApJ, 871, 64
- Badenes et al. (2010) Badenes C., Maoz D., Draine B. T., 2010, MNRAS, 407, 1301
- Barlow et al. (2010) Barlow M. J., et al., 2010, A&A, 518, L138
- Bertoldi et al. (2003) Bertoldi F., Carilli C. L., Cox P., Fan X., Strauss M. A., Beelen A., Omont A., Zylka R., 2003, A&A, 406, L55
- Bica & Schmitt (1995) Bica E. L. D., Schmitt H. R., 1995, ApJS, 101, 41
- Blair et al. (2000) Blair W. P., et al., 2000, ApJ, 537, 667
- Bocchio et al. (2014) Bocchio M., Jones A. P., Slavin J. D., 2014, A&A, 570, A32
- Bolatto et al. (2007) Bolatto A. D., et al., 2007, ApJ, 655, 212
- Borkowski et al. (2006) Borkowski K. J., et al., 2006, ApJ, 642, L141
- Bouchet et al. (2006) Bouchet P., et al., 2006, The Astrophysical Journal, 650, 212
- Bozzetto et al. (2017) Bozzetto L. M., et al., 2017, ApJS, 230, 2
- Chawner (2020) Chawner H., 2020, PhD thesis, School of Physics and Astronomy, http://orca.cf.ac.uk/138610/
- Chawner et al. (2019) Chawner H., et al., 2019, MNRAS, 483, 70
- Chawner et al. (2020) Chawner H., et al., 2020, MNRAS, 493, 2706
- Cherchneff & Dwek (2010) Cherchneff I., Dwek E., 2010, ApJ, 713, 1
- Chevalier (1977) Chevalier R. A., 1977, ARA&A, 15, 175
- Chevalier & Fransson (1992) Chevalier R. A., Fransson C., 1992, ApJ, 395, 540
- Chevalier & Raymond (1978) Chevalier R. A., Raymond J. C., 1978, Astrophysical Journal, 225, L27
- Chevalier et al. (1980) Chevalier R. A., Kirshner R. P., Raymond J. C., 1980, Astrophysical Journal, 235, 186
- Coe & Kirk (2015) Coe M. J., Kirk J., 2015, MNRAS, 452, 969
- Collaboration et al. (2014) Collaboration P., et al., 2014, A&A, 564, A45
- Crawford et al. (2014) Crawford E. J., Filipovic M. D., McEntaffer R. L., Brantseg T., Heitritter K., Roper Q., Haberl F., Urošević D., 2014, AJ, 148, 99
- Danforth et al. (2003) Danforth C. W., Sankrit R., Blair W. P., Howk J. C., Chu Y.-H., 2003, ApJ, 586, 1179
- Davies et al. (1976) Davies R. D., Elliott K. H., Meaburn J., 1976, Memoirs of the Royal Astronomical Society, 81, 89
- De Looze et al. (2017) De Looze I., Barlow M. J., Swinyard B. M., Rho J., Gomez H. L., Matsuura M., Wesson R., 2017, MNRAS, 465, 3309
- De Looze et al. (2019) De Looze I., et al., 2019, MNRAS, 488, 164
- Decin et al. (2012) Decin L., et al., 2012, A&A, 548, A113
- Dokara et al. (2021) Dokara R., et al., 2021, A&A
- Dopita et al. (1981) Dopita M. A., Tuohy I. R., Mathewson D. S., 1981, ApJ, 248, L105
- Draine (2011) Draine B. T., 2011, Physics of the Interstellar and Intergalactic Medium. Princeton
- Draine & Lee (1984) Draine B. T., Lee H. M., 1984, ApJ, 285, 89
- Dwek (1998) Dwek E., 1998, ApJ, 501, 643
- Dwek & Arendt (1992) Dwek E., Arendt R. G., 1992, ARA&A, 30, 11
- Dwek & Cherchneff (2011) Dwek E., Cherchneff I., 2011, ApJ, 727, 63
- Dwek & Smith (1996) Dwek E., Smith R. K., 1996, ApJ, 459, 686
- Dwek et al. (2008) Dwek E., et al., 2008, ApJ, 676, 1029
- Ennis et al. (2006) Ennis J. A., Rudnick L., Reach W. T., Smith J. D., Rho J., DeLaney T. A., Gomez H. L., Kozasa T., 2006, ApJ, 652, 376
- Fazio et al. (2004) Fazio G. G., et al., 2004, ApJS, 154, 10
- Ferrara & Peroux (2021) Ferrara A., Peroux C., 2021, astro-ph
- Filipovic et al. (2002) Filipovic M. D., Bohlsen T., Reid W., Staveley-Smith L., Jones P. A., Nohejl K., Goldstein G., 2002, MNRAS, 335, 1085
- Filipovic et al. (2005) Filipovic M. D., Payne J. L., Reid W., Danforth C. W., Staveley-Smith L., Jones P. A., White G. L., 2005, MNRAS, 364, 217
- Filipovic et al. (2008) Filipovic M. D., et al., 2008, A&A, 485, 63
- Galliano et al. (2018) Galliano F., Galametz M., Jones A. P., 2018, ARA&A, 56, 673
- Gehrz (1989) Gehrz R. D., 1989, in Allamandola L. J., Tielens A. G. G. M., eds, Interstellar Dust: Proceedings of the 135th Symposium of the International Astronomical Union. Kluwer Academic Publishers, Dordrecht, pp 445–
- Gomez et al. (2010) Gomez H. L., Vlahakis C., Stretch C. M., Dunne L., Eales S. A., Beelen A., Gomez E. L., Edmunds M. G., 2010, MNRAS: Letters, 401, L48
- Gomez et al. (2012a) Gomez H. L., et al., 2012a, MNRAS, 420, 3557
- Gomez et al. (2012b) Gomez H. L., et al., 2012b, ApJ, 760, 96
- Gordon et al. (2011) Gordon K. D., et al., 2011, AJ, 142, 102
- Gordon et al. (2014) Gordon K. D., et al., 2014, ApJ, 797, 85
- Graczyk et al. (2020) Graczyk D., et al., 2020, ApJ, 904, 13
- Green (2009) Green D. A., 2009, Bulletin of the Astronomical Society of India, 37, 45
- Griffin et al. (2010) Griffin M. J., et al., 2010, A&A, 518, L3
- Gvaramadze et al. (2019) Gvaramadze V. V., Kniazev A. Y., Oskinova L. M., 2019, MNRAS, 485, L6
- Haberl et al. (2012) Haberl F., Sturm R., Ballet J., et al. 2012, A&A, 545, A128
- Hatzidimitriou et al. (1993) Hatzidimitriou Cannon D. ., Hawkins R. D. ., 1993, MNRAS, 261, 873
- Hebbar et al. (2020) Hebbar P. R., Heinke C. O., Ho W. C. G., 2020, MNRAS, 491, 1585
- Hendrick et al. (2005) Hendrick S. P., Reynolds S. P., Borkowski K. J., 2005, ApJ, 622, L117
- Heng (2010) Heng K., 2010, Publications of the Astronomical Society of Australia, 27, 23
- Hester (2008) Hester J. J., 2008, ARA&A, 46, 127
- Heydari-Malayeri & Selier (2010) Heydari-Malayeri M., Selier R., 2010, A&A, 517, A39
- Hildebrand (1983) Hildebrand R. H., 1983, Quarterly Journal of the Royal Astronomical Society, 24, 267
- Hjorth et al. (2013) Hjorth J., Vreeswijk P. M., Gall C., Watson D., 2013, ApJ, 768, 173
- Hony et al. (2015) Hony S., Gouliermis D. A., of F. G. M. N., 2015 2015, MNRAS
- Inoue et al. (1983) Inoue H., Koyama K., Tanaka Y., 1983, IAUS, 101, 535
- Jones et al. (1994) Jones A. P., Tielens A. G. G. M., Hollenbach D. J., McKee C. F., 1994, Astrophysical Journal, 433, 797
- Jones et al. (1996) Jones A. P., Tielens A. G. G. M., Hollenbach D. J., 1996, ApJ, 469, 740
- Joseph et al. (2019) Joseph T. D., Filipovic M. D., Crawford E. J., Bojicic I., 2019, MNRAS, 490, 1202
- Katsuda et al. (2018) Katsuda S., Takiwaki T., Tominaga N., Moriya T. J., Nakamura K., 2018, ApJ, 863, 127
- Kirchschlager et al. (2019) Kirchschlager F., Schmidt F. D., Barlow M. J., Fogerty E. L., Bevan A., Priestley F. D., 2019, MNRAS, 489, 4465
- Koo et al. (2007) Koo B.-C. C., Lee H. G., Moon D. S., the J. L., 2007, APSJ, 59, S455
- Koo et al. (2016) Koo B.-C. C., Lee J.-J., Jeong I.-G., Seok J. Y., Kim H.-J., 2016, ApJ, 821, 1
- Lakicevic et al. (2015) Lakicevic M., et al., 2015, ApJ, 799, 50
- Laporte et al. (2017) Laporte N., et al., 2017, ApJApJ, 837, L21
- Lee et al. (2011) Lee J.-J., Park S., Hughes J. P., Slane P. O., Burrows D. N., 2011, ApJ, 731, L8
- Lin et al. (2012) Lin D., Webb N. A., Barret D., 2012, ApJ, 756, 27
- Long et al. (2020) Long X., Gaetz T. J., Plucinsky P. P., 2020, ApJ, 904, 70
- Lopez et al. (2014) Lopez L. A., Castro D., Slane P. O., Ramirez-Ruiz E., Badenes C., 2014, ApJ, 788, 5
- Ludwig et al. (2018) Ludwig B., Sandstrom K., Bolatto A., 2018, in American Astronomical Society Meeting Abstracts #231. p. 241.08
- Lundqvist et al. (2020) Lundqvist P., et al., 2020, MNRAS, 496, 1834
- Maggi et al. (2019) Maggi P., et al., 2019, MNRAS
- Maiolino et al. (2004) Maiolino R., Schneider R., Oliva E., Bianchi S., Ferrara A., Mannucci F., Pedani M., Roca Sogorb M., 2004, Nature, 431, 533
- Maitra et al. (2015) Maitra C., Ballet J., Filipovic M. D., Haberl F., Tiengo A., Grieve K., Roper Q., 2015, A&A, 584, A41
- Mathewson et al. (1984) Mathewson D. S., Ford V. L., Dopita M. A., Tuohy I. R., Mills B. Y., Turtle A. J., 1984, ApJS, 55, 189
- Mathis et al. (1977) Mathis J. S., Rumpl W., Nordsieck K. H., 1977, ApJ, 217, 425
- Matsuura et al. (2009) Matsuura M., et al., 2009, MNRAS, 396, 918
- Matsuura et al. (2011) Matsuura M., et al., 2011, Science, 333, 1258
- Matsuura et al. (2013) Matsuura M., Woods P. M., Owen P. J., 2013, MNRAS, 429, 2527
- Matsuura et al. (2015) Matsuura M., et al., 2015, ApJ, 800, 50
- McKee & Hollenbach (1980) McKee C. F., Hollenbach D. J., 1980, ARA&A, 18, 219
- McLeod et al. (2018) McLeod A. F., Reiter M., Kuiper R., Klaassen P. D., Evans C. J., 2018, Nature, pp 334–336
- Meixner et al. (2010) Meixner M., et al., 2010, A&A, 518, L71
- Meixner et al. (2013) Meixner M., et al., 2013, AJ, 146, 62
- Micelotta et al. (2016) Micelotta E. R., Dwek E., Slavin J. D., 2016, A&A, 590, A65
- Micelotta et al. (2018) Micelotta E. R., Matsuura M., Sarangi A., 2018, Space Science Reviews, 214, 53
- Michałowski et al. (2010) Michałowski M. J., Watson D., Hjorth J., 2010, ApJ, 712, 942
- Morgan & Edmunds (2003) Morgan H. L., Edmunds M., 2003, MNRAS, 343, 427
- Nazé et al. (2002) Nazé Y., Hartwell J. M., IR S., et al. 2002, ApJ
- Nazé et al. (2003a) Nazé Y., Rauw G., Manfroid J., Chu Y.-H., Vreux J. M., 2003a, A&A, 408, 171
- Nazé et al. (2003b) Nazé Y., Hartwell J. M., Stevens I. R., Manfroid J., Marchenko S., Corcoran M. F., Moffat A. F. J., Skalkowski G., 2003b, ApJ, 586, 983
- Niculescu-Duvaz et al. (2021) Niculescu-Duvaz M., Barlow M. J., Bevan A., Milisavljevic D., De Looze I., 2021, MNRAS, 504, 2133
- Nota et al. (2006) Nota A., et al., 2006, ApJ, 640, L29
- Nozawa et al. (2003) Nozawa T., Kozasa T., Umeda H., Maeda K., Nomoto K., 2003, ApJ, 598, 785
- Ossenkopf et al. (1992) Ossenkopf V., Henning T., Mathis J. S., 1992, A&A, 261, 567
- Owen et al. (2011) Owen R. A., et al., 2011, A&A, 530, A132
- Park et al. (2003) Park S., Hughes J. P., Burrows D. N., Slane P. O., Nousek J. A., Garmire G. P., 2003, ApJ, 598, L95
- Payne et al. (2007) Payne J. L., White G. L., Filipović M. D., Pannuti T. G., 2007, MNRAS, 376, 1793
- Pellegrini et al. (2012) Pellegrini E. W., Oey M. S., Winkler P. F., Points S. D., Smith R. C., Jaskot A. E., Zastrow J., 2012, ApJ, 755, 40
- Pilbratt et al. (2010) Pilbratt G. L., et al., 2010, A&A, 518, L1
- Pinheiro Gonçalves et al. (2011) Pinheiro Gonçalves D., Noriega-Crespo A., Paladini R., Martin P. G., Carey S. J., 2011, AJ, 142, 47
- Poglitsch et al. (2010) Poglitsch A., et al., 2010, A&A, 518, L2
- Priestley et al. (2021) Priestley F. D., Chawner H., Matsuura M., De Looze I., Barlow M. J., Gomez H. L., 2021, MNRAS, 500, 2543
- Reach et al. (2006) Reach W. T., et al., 2006, AJ, 131, 1479
- Reid (2014) Reid W., 2014, MNRAS, 438, 2642
- Reid et al. (2006) Reid W. A., Payne J. L., Filipović M. D., Danforth C. W., Jones P. A., White G. L., Staveley-Smith L., 2006, MNRAS, 367, 1379
- Rho et al. (2008) Rho J., et al., 2008, ApJ, 673, 271
- Rho et al. (2009) Rho J., Reach W. T., Tappe A., Hwang U., Slavin J. D., Kozasa T., Dunne L., 2009, ApJ, 700, 579
- Rho et al. (2018) Rho J., et al., 2018, MNRAS, 479, 5101
- Rieke et al. (2004) Rieke G. H., et al., 2004, ApJS, 154, 25
- Roper et al. (2015) Roper Q., McEntaffer R. L., DeRoo C., Filipovic M., Wong G. F., Crawford E. J., 2015, ApJ, 803, 106
- Rubio et al. (2000) Rubio M., Contursi A., Lequeux J., Probst R., Barbá R., Boulanger F., Cesarsky D., Maoli R., 2000, A&A, 359, 1139
- Sandstrom et al. (2009) Sandstrom K. M., Bolatto A. D., Stanimirović S., van Loon J. T., Smith J. D. T., 2009, ApJ, 696, 2138
- Sano et al. (2019) Sano H., et al., 2019, ApJ, 881, 85
- Sarangi & Cherchneff (2015) Sarangi A., Cherchneff I., 2015, A&A, 575, A95
- Schneider et al. (2004) Schneider R., Ferrara A., Salvaterra R., 2004, MNRAS, 351, 1379
- Seale et al. (2014) Seale J. P., et al., 2014, AJ, 148, 124
- Seok et al. (2013) Seok J. Y., Koo B.-C. C., Onaka T., 2013, ApJ, 779, 134
- Seok et al. (2015) Seok J. Y., Koo B.-C. C., Hirashita H., 2015, ApJ, 807, 100
- Slavin et al. (2015) Slavin J. D., Dwek E., Jones A. P., 2015, ApJ, 803, 7
- Smith et al. (2000) Smith C., Leiton R., Pizarro S., 2000, in Alloin Olsen Galaz eds, ASP Conf Vol. 221, Stars, Gas and Dust in Galaxies: Exploring the Links. p. 83
- Stanimirović et al. (2005) Stanimirović S., Bolatto A. D., Sandstrom K. M., Leroy A. K., Simon J. D., Gaensler B. M., Shah R. Y., Jackson J. M., 2005, ApJ, 632, L103
- Sturm et al. (2013) Sturm R., et al., 2013, A&A, 558, A3
- Subramanian & Subramaniam (2009) Subramanian S., Subramaniam A., 2009, A&A, 496, 399
- Takekoshi et al. (2017) Takekoshi T., et al., 2017, ApJ, 835, 55
- Takeuchi et al. (2016) Takeuchi Y., Yamaguchi H., Tamagawa T., 2016, PASJ, 68, S9
- Temim & Dwek (2013) Temim t., Dwek E., 2013, ApJ, 774, 8
- Temim et al. (2015) Temim t., Dwek E., Tchernyshyov K., Boyer M. L., Meixner M., Gall C., Roman-Duval J., 2015, ApJ, 799, 158
- Temim et al. (2017) Temim t., Dwek E., Arendt R. G., Borkowski K. J., Reynolds S. P., slane p., Gelfand J. D., Raymond J. C., 2017, ApJ, 836, 129
- Temim et al. (2019) Temim t., Slane P., Sukhbold T., et al. B. K., 2019, ApJ, 878, L19
- Tielens (2010) Tielens A. G. G. M., 2010, The Physics and Chemistry of the Interstellar Medium. Cambridge University Press
- Tuohy et al. (1983) Tuohy I. R., Dopita M. A., Mathewson D. S., Long K. S., Helfand D. J., 1983, in Danziger J., Gorenstein P., eds, IAUS Vol. 101, Supernova remnants and their X-ray emission. p. 559
- Ueta et al. (2008) Ueta T., et al., 2008, PASJ, 60, 407
- Van den Bergh (2007) Van den Bergh S., 2007, The Galaxies of the Local Group. Cambridge University Press
- Van der Heyden et al. (2004) Van der Heyden K. J., Bleeker J. A. M., Kaastra J. S., 2004, A&A, 421, 1031
- Vogt et al. (2018) Vogt F. P. A., Bartlett E. S., Seitenzahl I. R., Dopita M. A., Ghavamian P., Ruiter A. J., Terry J. P., 2018, Nature Astronomy, 2, 465
- Watkins et al. (2019) Watkins E. J., Peretto N., Marsh K. A., Fuller G. A., 2019, A&A, 628, A21
- Watson et al. (2015) Watson D., Christensen L., Knudsen K. K., Richard J., Gallazzi A., Michałowski M. J., 2015, Nature, 519, 327
- Weingartner & Draine (2001) Weingartner J. C., Draine B. T., 2001, ApJ, 548, 296
- Werner et al. (2004) Werner M. W., et al., 2004, ApJS, 154, 1
- Wesson et al. (2015) Wesson R., Barlow M. J., Matsuura M., Ercolano B., 2015, MNRAS, 446, 2089
- Williams et al. (2006) Williams B. J., et al., 2006, ApJApJ, 652, L33
- Xi et al. (2019) Xi L., Gaetz T. J., Plucinsky P. P., Hughes J. P., Patnaude D. J., 2019, ApJ, 874, 14
- Ye et al. (1991) Ye T., Turtle A. J., Kennicutt R. C. J., 1991, MNRAS, 249, 722
- Zubko et al. (1996) Zubko V. G., Mennella V., Colangeli L., Bussoletti E., 1996, MNRAS, 282, 1321
Appendix A Description of infrared emission from SNRs – non detections and SNR candidates
A.1 Non detections
A.1.1 SNR J0047.27308, B0045-73.4, IKT 2: unlikely detection
This SNR is radio bright (panel i of Fig 18), and there are associated circular regions found in H to the north-west and south-west. There is a filamentary structure in the south-west of the SNR which can be seen in H. Similar structure is found all of the infrared images, however, it is most likely part of a larger ISM structure, as the location of infrared filament is slightly off from H emitting region. Also, this filament does not stand out in the 3-colour image shown in Fig.19 – if the filament was part of the SNR, it would tend to stand out in a blue colour against ISM.
There are bright infrared clouds in north-west of the shell, just inside the white circle in Fig 18, however, these clouds are probably not part of the SNR, but associated with molecular clouds or an HII region, as there is no associated emission found in either X-ray or radio images.
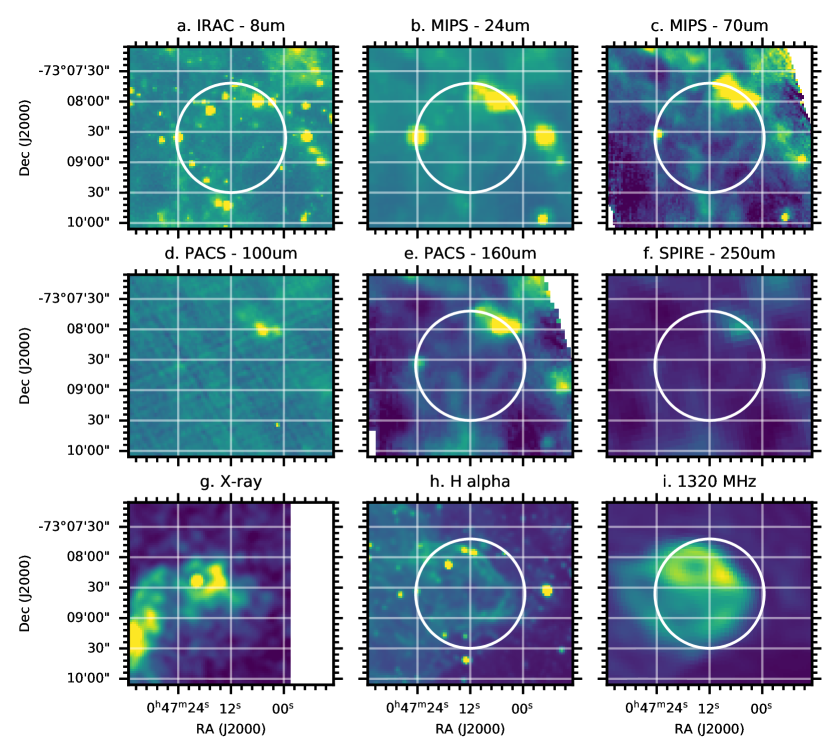
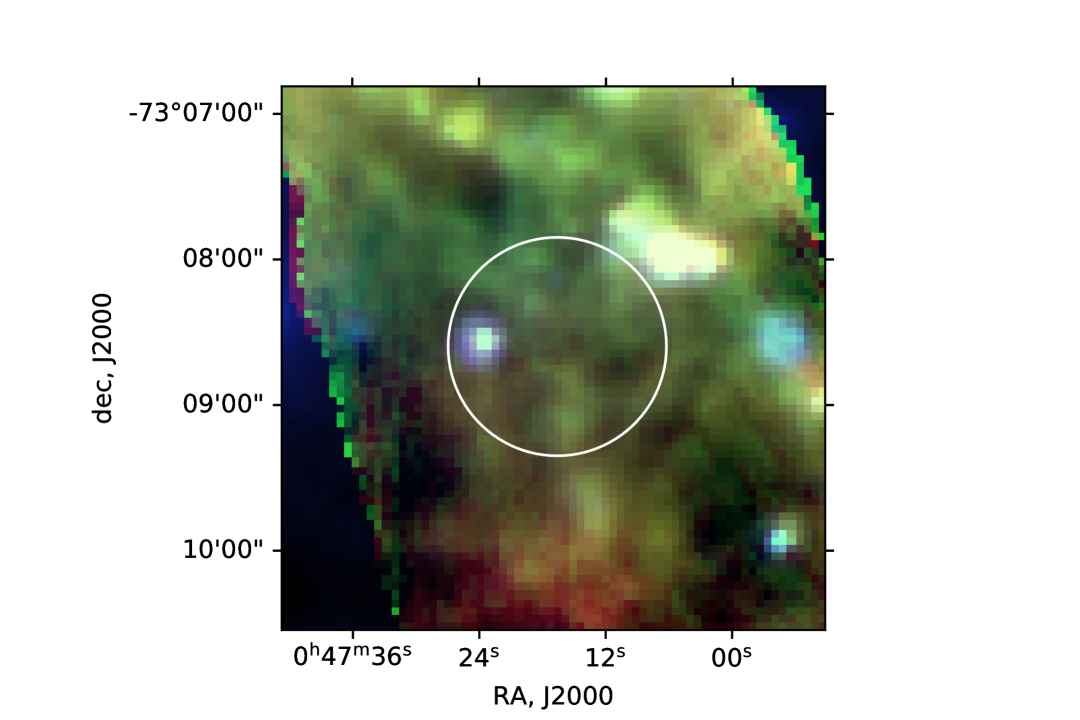
A.1.2 SNR J0047.57306, B004573.3: non detection
This SNR was reported in ROSAT and XMM-Newton X-ray images, with Filipovic et al. (2005) identifying the corresponding radio emission at J004728730601. Maggi et al. (2019) showed that there are two SNRs in very close proximity (SNR J0047.57306 and SNR J0047.27308), separated by slightly different X-ray abundance patterns.
In Fig. 20, the H image (panel h) shows that there are at least two separate nebulae which somewhat overlap. The feature also found in the radio image (panel i). The circle indicates the coordinates and size of the SNR from Filipovic et al. (2005). Filamentary structure is found across the circle in H, and some the structure may extend outside the circle.
Although there is some infrared emission within the white circle of Fig. 20, none of the structure resembles H ones, leading to its listing as a non-detection. The IR emission is most likely of ISM origin.
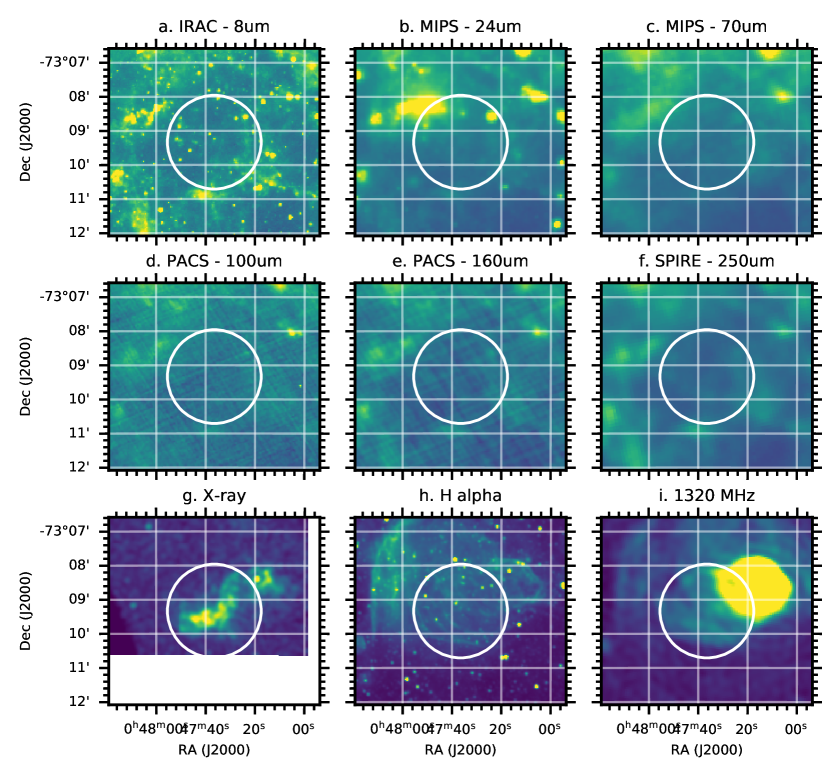
A.1.3 SNR J0048.47319, B0046-73.5, DEM S42E, IKT 4: unlikely detection
In radio, this SNR shows a shell structure, and the corresponding shell is also found in the H image (Fig. 21). In H, a dense and bright emission nebula is seen to the west. Although this bright nebula dominates the west of the SNR, a combination of MCELS [SII] and H images shows that the strong sulphur throughout the SNR is not present in the nebula, hence, we deem this bright H source unlikely to be part of the SNR. The rim of this emission is found in all of the infrared images, some of which have a necklace-like appearance. One of the blobs is the young stellar object candidate S3MC J004815.34-731935.61 (Bolatto et al., 2007). It may be possible that the infrared and H emission are associated with the young stellar object and HII region.
There is a discrete patch of emission found in north-east of the circle, not only at 8 m but faintly across the other mid-infrared images. This emission is located between SNR J0048.47319 and a cluster of stars Bruck 47 (Bica & Schmitt, 1995), both of which are clearly seen in the H image. It is unclear whether the detected filaments with two blobs inside at 8 m belong to SNR, the cluster, or unrelated ISM, even though they are quite strong in sulpuur.
There is no clear SNR associated emission detected in the infrared, so this SNR is classified as ‘unlikely detection’.
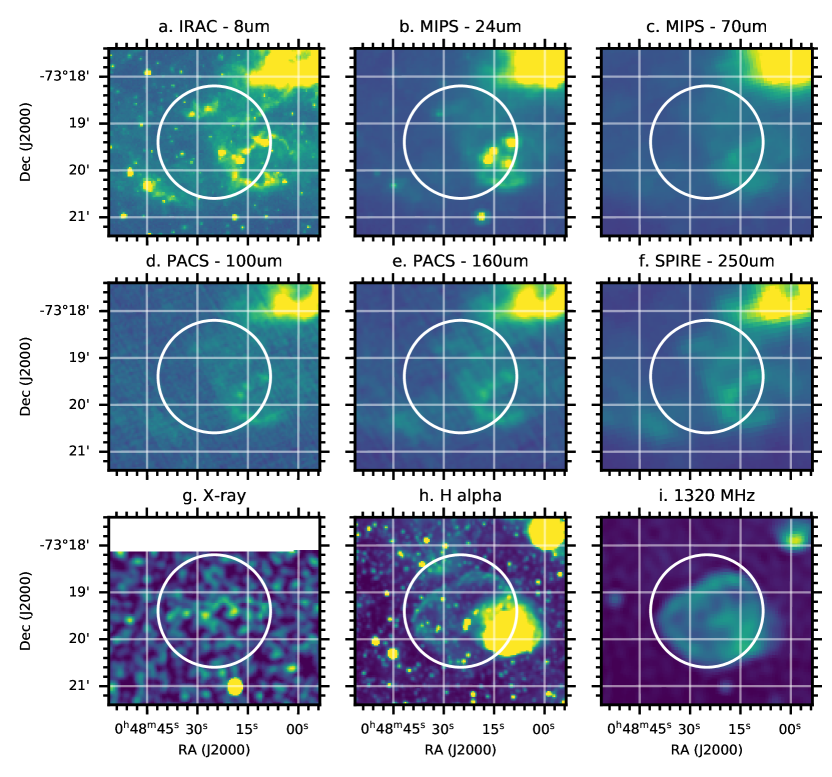
A.1.4 SNR J0049.07306: unlikely detection
Hendrick et al. (2005) reported an analysis of Chandra spectra, and concluded this to be a core-collapse SNR with O and Ne-rich gas. The Fe/Ne abundance ratio might suggest a progenitor mass in the range of 20–40 (Takeuchi et al., 2016). Haberl et al. (2012) listed it as an SNR candidate with faint emission in XMM-Newton images, but has not been detected in radio. In optical (Fig. 22 h), there are four point sources, surrounded by some nebulocity. It is difficult to evalute if this nebulocity is associated with SNR. There is some diffuse emission in the infrared images at 8 and 24 m but it is not clear if emission is related to the SNR, thus, the SNR is unlikely detected at infrared.
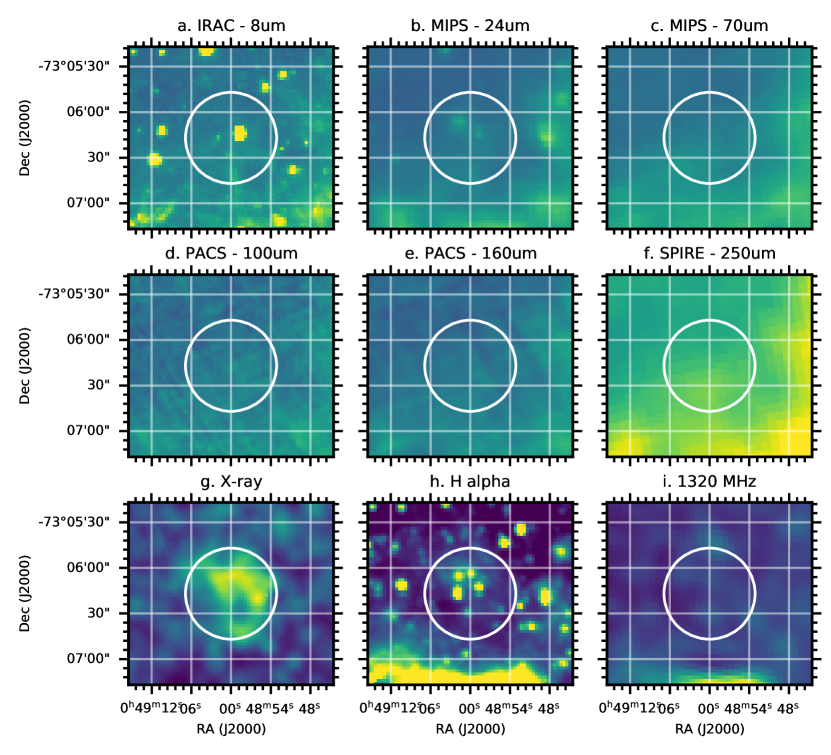
A.1.5 SNR J0051.17321, DEM S53, B0049-73.6, IKT 6: unlikely detection
This SNR has an estimated age of 14,000 years with a progenitor mass of 13–15 (Hendrick et al., 2005; Katsuda et al., 2018). So far, 170 has been swept up already (Hendrick et al., 2005). Although this SNR has a clear circular shell with an X-ray detection of ejecta inside (Fig. 23), there is little emission corresponding to this feature in the infrared images. Although the 8 m image shows some faint shell emission on the south-east of the white circle, that part of the shell is relatively faint in the radio image. Since it would be unlikely that only this part of the SNR shell would be detected, we conclude that this must be recorded as an ‘unliklely detection’.
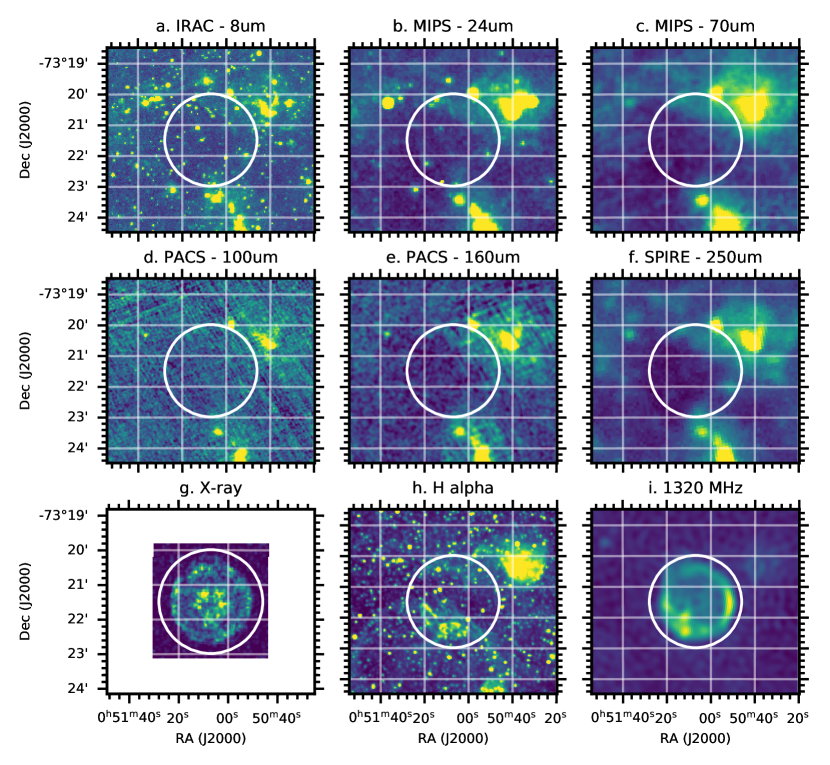
A.1.6 SNR J005657208: non detection
From XMM-Newton observations, Haberl et al. (2012) listed SNR J005657208 as an SNR candidate. This SNR has a low-surface brightness in X-ray (Haberl et al., 2012) images. Fig. 24 shows that this SNR candidate is very faint in radio and H. The lack of a clear shape in these reference images makes it difficult to identify the SNR candidate in infrared images.
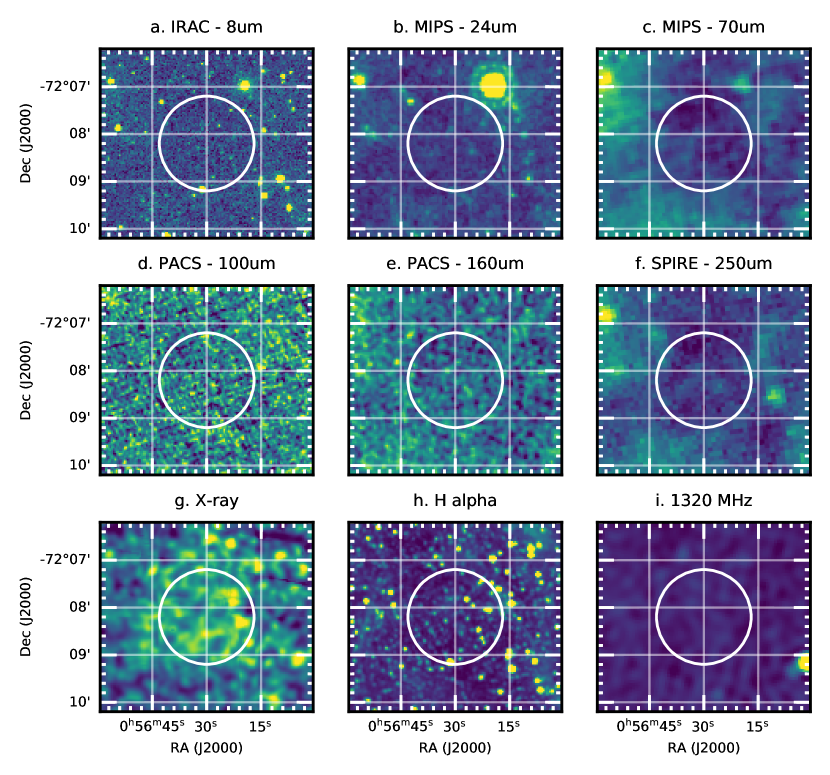
A.1.7 SNR J0057.77213: non detection
SNR J0057.77213 is listed as an SNR candidate by Haberl et al. (2012), based on the XMM-Newton survey of SMC SNRs. Radio emission found next to the X-ray emission (Fig.25) belongs to SNR J0058.37218 (Filipovic et al., 2005), which is displayed in Fig.26. It is unclear if these are two individual SNRs or if they are linked regions of one single SNR (Haberl et al., 2012). There is no infrared detection, made worse by the bright ISM emission that is overwhelming the region.
There is a bright point source detected in X-ray and radio, as well as at 8, 24, and 160 m. This is 2MASS J005732727213022, also known as [NHS 2003] 4 from Nazé et al. (2003b). It was initially proposed to be an X-ray binary, due to 40 % variabilities in X-ray fluxes (Nazé et al., 2002), but it was later classified as a candidate non-nuclear extragalactic source (Lin et al., 2012). This bright X-ray and infrared source is unlikely to be related to the SNR.
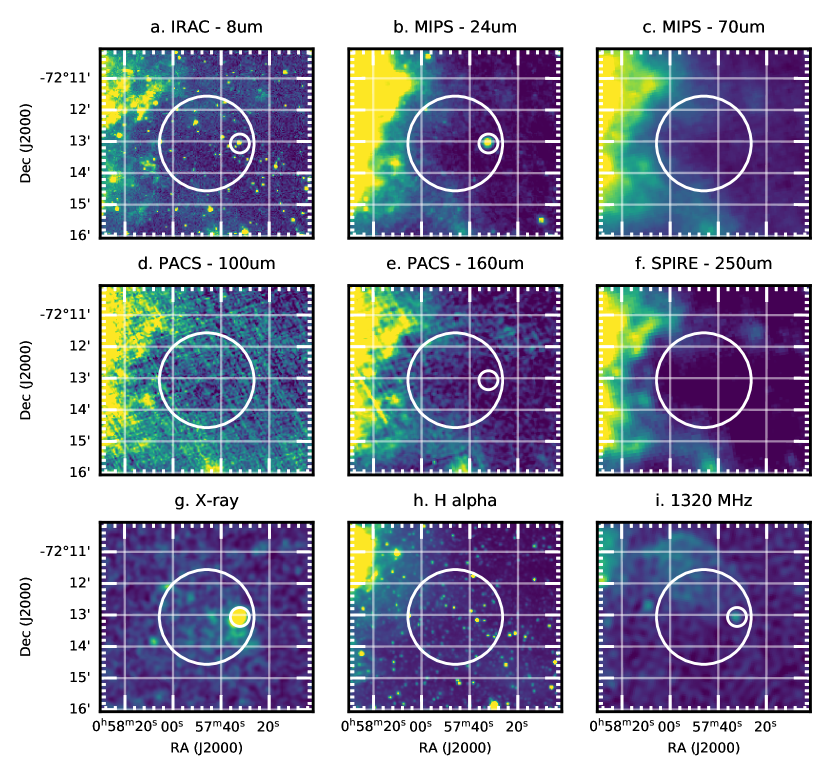
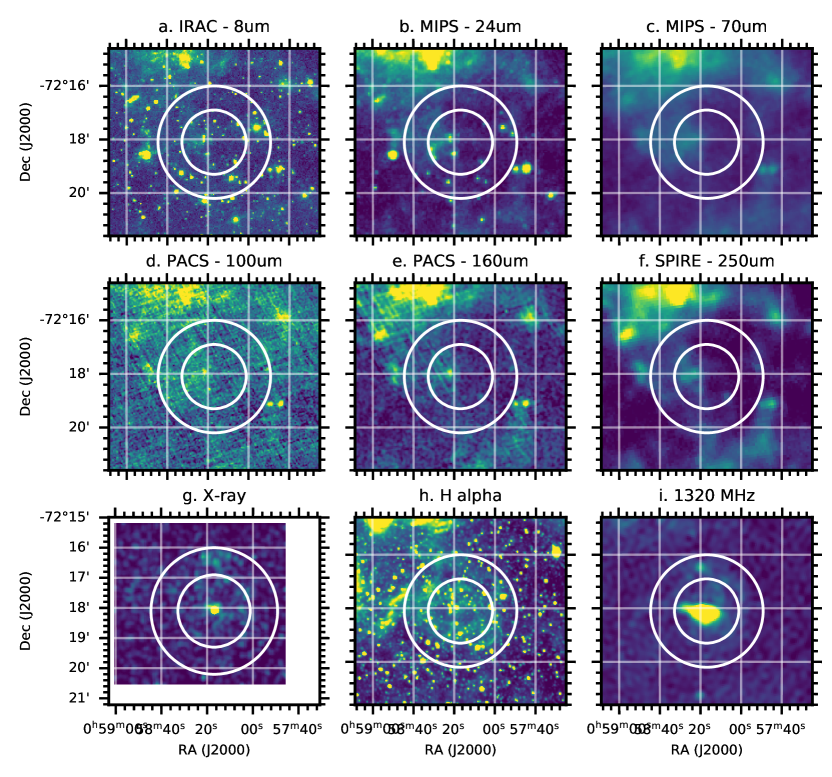
A.1.8 SNR J0058.37218, B0056-72.5, IKT 16: unlikely detection
SNR J0058.37218 is the only pulsar wind nebula known in the SMC (Alsaberi et al., 2019), with an estimated SNR age of 14,700 yrs (Owen et al., 2011). There is a bright point source found in X-ray, which has been identified as emission from the neutron star (Owen et al., 2011; Maitra et al., 2015). It has also been suggested as a possible AGN (Sturm et al., 2013), however, (Alsaberi et al., 2019) determined it to be a pulsar.
There are two point sources found in H (Fig.26) near the centre: XMMU J005822.1721759 and XMMU J005820.7721754. Both of them were listed as AGN candidates before (Sturm et al., 2013) but XMMU J005822.1721759 was later revised as a pulsar. The source in the east, XMMU J005820.7721754, is bright in the infrared and it is elongated, but it is probably not associated with the SNR, if it is an AGN candidate.
The H image shows bright nebular inside the 1.2 arcmin radius circle (smaller circle in Fig.26). Although there is some emission on the east side of the inner circle seen in all the infrared images with a point source within, this emission is probably not associated with the SNR, as its morphology does not resemble that of H.
A.1.9 SNR J0100.37134, B0058-71.8, DEM S108: non-detection
The radio emission of SNR J0100.37134 is bright in the north, while in H, emission in the southern part, tracing a shell structure, is brighter. Although there is some infrared emission within and surrounding this SNR, the morphology does not resemble radio or H (Fig.27), so this SNR is listed as a non detection.
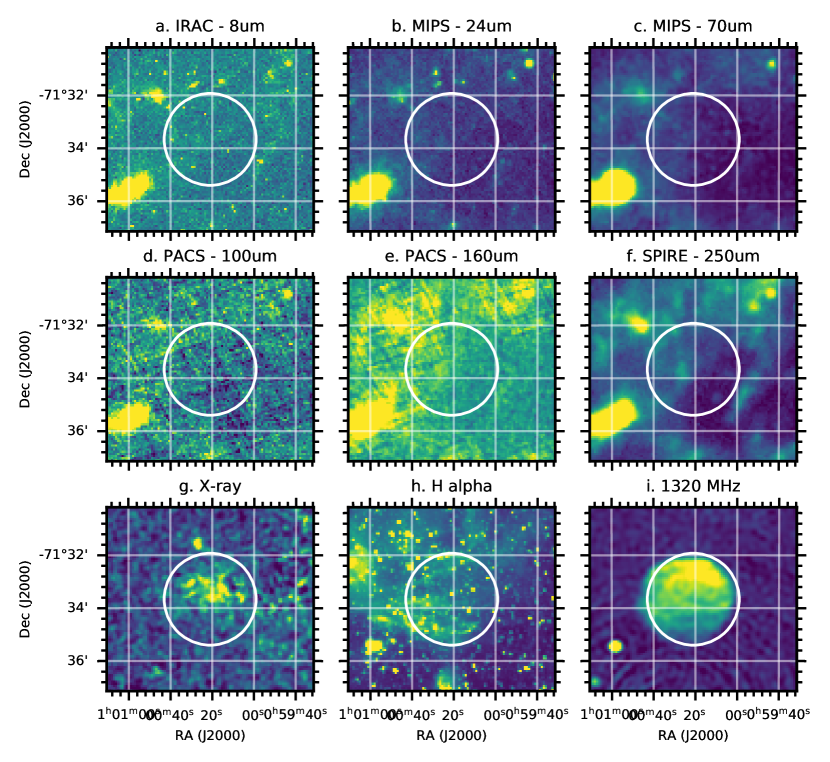
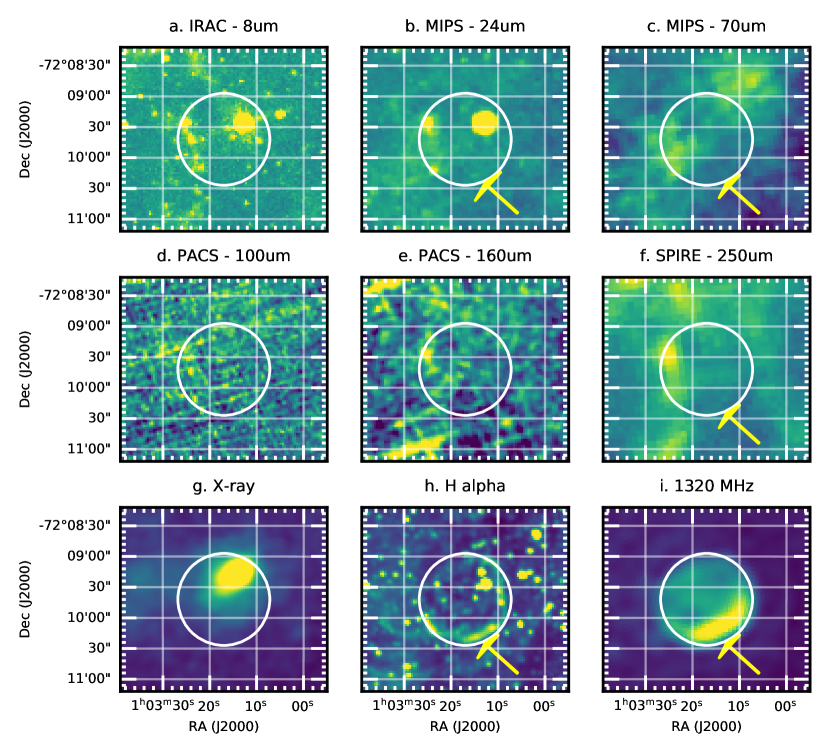
A.1.10 SNR J0103.27209, B0101-72.6, IKT 21: unlikely detection
SNR J0103.27209 has a well-defined shell structure in radio and H (Fig. 28). Observations in [SII] were used to determine a diameter of about 90 arcsec (Mathewson et al., 1984; Maggi et al., 2019). In X-ray, the reported size is much larger at 270 arcsec (Maggi et al., 2019).
H and radio images both show the brightest part of the rim is in the south-west (Fig. 28). This rim may correlate with emission seen in 24 m and 250 m, however, due to the limited sensitivity, it is not clearly defined. This SNR is therefore classified as an unlikely detection in infrared.
A.1.11 SNR J0105.17223, DEM S128, ITK 23: non detection
SNR J0105.17223 is the second X-ray brightest SNR in the SMC, and has a core-collapse origin (Van der Heyden et al., 2004; Maggi et al., 2019). Any optical and infrared emission from the SNR, if it exists, is buried within unrelated ISM, which includes the bright region in the south (Fig. 29). This SNR is categorised as a non detection in the infrared.
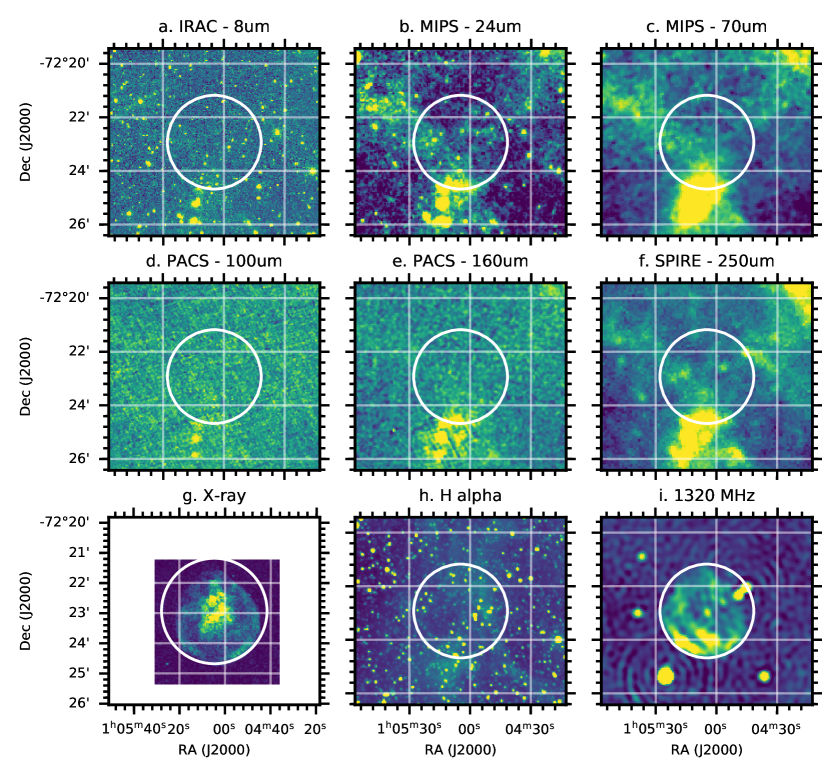
A.1.12 SNR candidate J010657242: non detection
This object was relatively recently nominated as a candidate SNR, after detecting radio continuum emission from the ASKAP survey. However, it is yet to be confirmed with an X-ray spectrum (Maggi et al., 2019). Indeed, although the radio image shows a clear spherical shell (Fig 30 i), it is not clearly found in X-ray or H and there is no sign of infrared emission associated with this SNR.
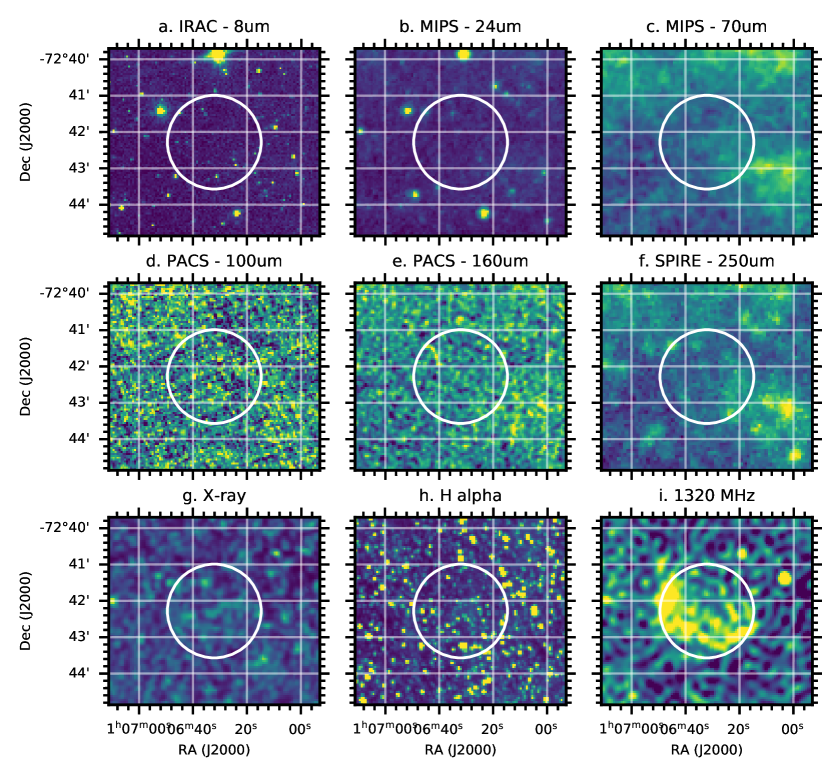
A.1.13 SNR candidate J010977318: non detection
SNR candidate J010977318 was recognised by a shell-type optical structure, and its high [S II]/H ratio in the MCELS survey (Maggi et al., 2019). It has a clearly defined sphere in the optical (Fig. 31 h). Maggi et al. (2019) stated some issue with the X-ray image, which is also included in this paper (Fig. 31 g). Unfortunately, we don’t see any corresponding infrared emission in Fig. 31.
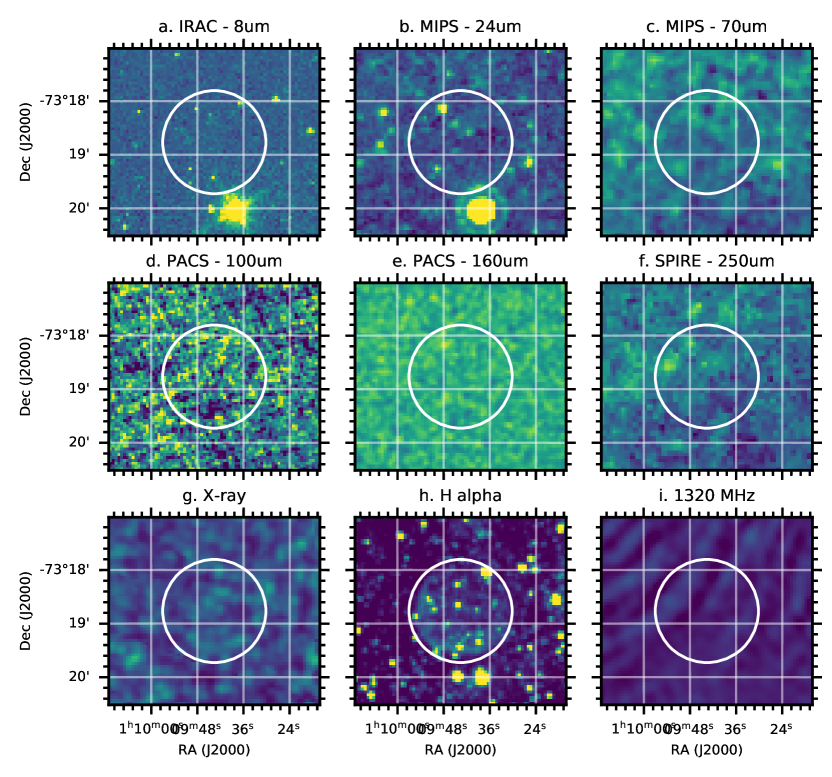
A.2 SNR candidates/Non-SNRs?
In this section, we present SNR J0047.87317 which had been thought to be SNR, but recent study by Maggi et al. (2019) classified as non SNRs. We display infrared images with possible detection.
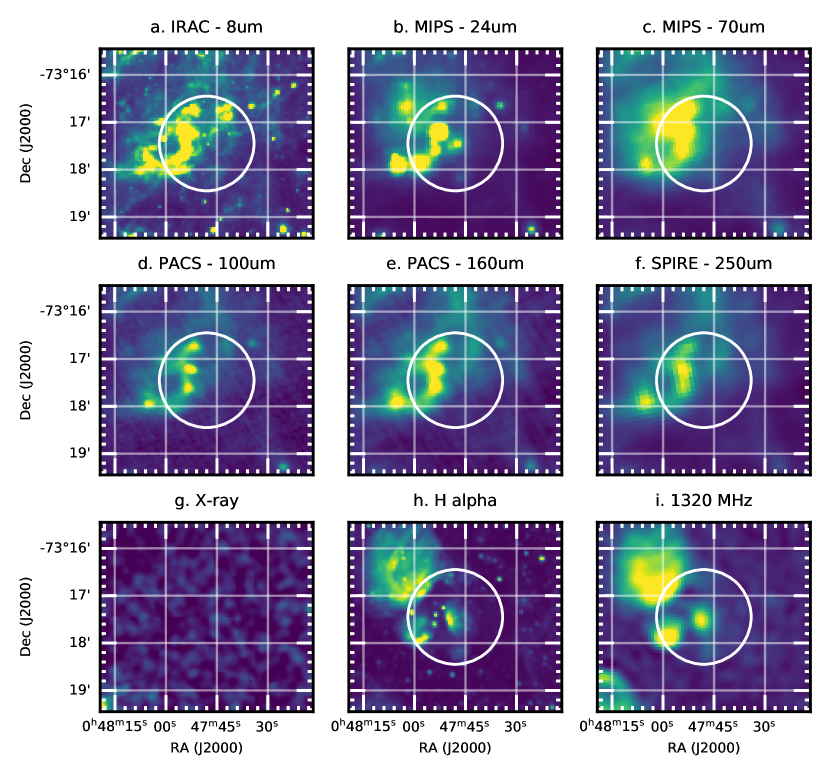
A.2.1 SNR J0047.87317, NS21: possible detection
This source was initially listed as a SNR candidate from radio emission (Filipovic et al., 2002; Filipovic et al., 2005), with X-ray detections later (Haberl et al., 2012). However, Pellegrini et al. (2012) identified this object (LHA 115-N21) as an HII region, from optical [SII] and [OIII] ratio. Recent radio images by ASKAP did not resolve a shell, hence, considered to be a part of HII region N19 (Maggi et al., 2019).
A point source, corresponding to the radio source, is detected at the centre of this nebula at 24 m only (Fig. 32). Because it is only one band detection, its identification is undetermined.
An HII region/molecular cloud NGC 267 is located north-east of this SNR, as traced by H emission, and molecular cloud [RLB 93] SMC-B2 1 (RA 00 47 47.4, Dec 73 16 48) and several young stellar objects are found in between the location of the SNR and NGC 267. These young stellar objects are bright in 8–250 m.
A.2.2 SNR J0051.97310, IKT 7: unlikely detection
SNR J0051.97310 is a candidate of SNR, reported by Einstein X-ray detection (Inoue et al., 1983), however, its identification is still disputed. It could be associated with X-ray Binary, SXP 172 (Coe & Kirk, 2015), but could be still core-collapse SNR (Auchettl et al., 2019) It has listed as 97” diameter in X-ray Badenes et al. (2010) based on on-line source MCSNR, which is no longer available, however, Auchettl et al. (2019) state it as a point source. There is a contradicting information about this potential SNR.
There is no infrared emission associated to this point source Fig.33. H image contains so many point sources, so that it is extremely difficult to identify extended emission, if any from SNR. There is also diffuse emission in infrared within the white circle, however, it is difficult to claim that this is associated with possible SNR, so that this SNR is classified as unlikely detection.
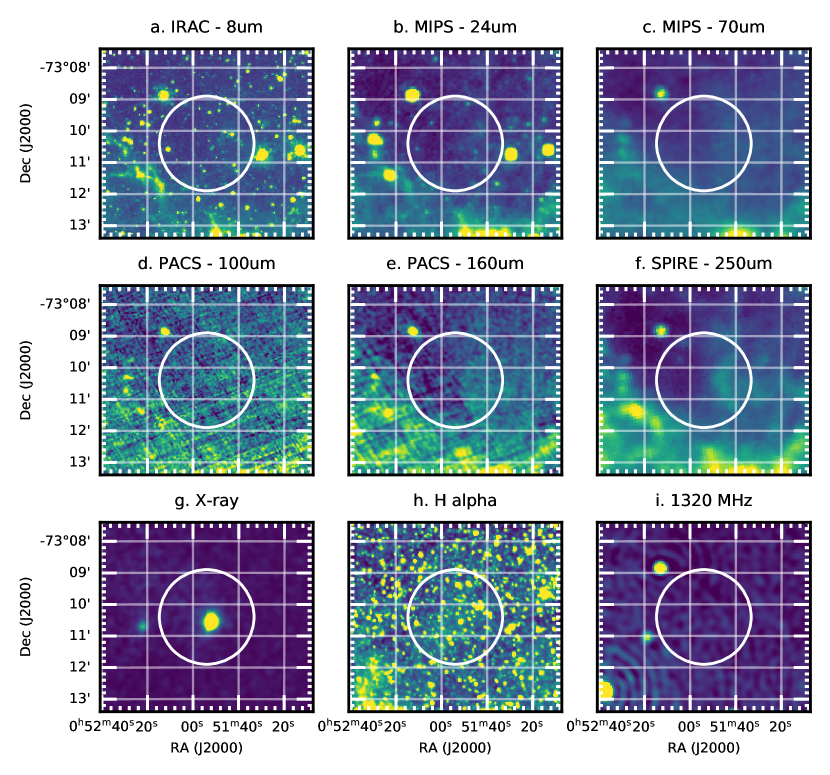
A.2.3 SNR J0114.07317, LHA 115-N 83C: non detection
SNR J0114.07317 is listed as SNR candidate by Payne et al. (2007). However, no X-ray emission was detected, and it is likely to be a compact HII region (Maggi et al., 2019).
The infrared image is overwhelmed with nearby star forming region, and can not find any emission from this possible SNR, if any.