’Guided’ Fractures in Graphene Mechanical Diode-like Structures
Abstract
The concept of diode is usually applied to electronic and thermal devices but very rarely for mechanical ones. A recent proposed fracture rectification effect in polymer-based structures with triangular voids defects has motivated us to test these ideas at the nanoscale using graphene membranes. Using fully-atomistic reactive molecular dynamics simulations we showed that a robust rectification-like effects exists. The fracture can be ’guided’ to easier propagate along one specific direction than its opposite. We also observed that there is an optimal value for the spacing between each void for rectification effect.
Keywords Fracture Diode Graphene Molecular Dynamics.
1 Introduction
Graphene has received great attention from the scientific community due to its unique electronic properties Novoselov et al. (2004); Geim and Novoselov (2007); Zhang et al. (2005); Young and Kim (2009); Castro Neto et al. (2009). However, graphene is also interesting due to its excellent mechanical properties Lee et al. (2008); Zhang et al. (2005); Bizao et al. (2017, 2018); Fonseca and Galvao (2021). It is believed to be one of the toughest materials (natural and synthesized), with Young’s modulus of TPa Lee et al. (2008, 2012), resulting from its strong bonds originating from the sp2 carbon hybridization. It also presents nonlinear elastic behavior Lee et al. (2008); Branicio et al. (2016) that leads to a maximum stress value that characterizes its intrinsic strength. Besides the elastic properties, the fracture dynamics of graphene have been also experimentally investigated Zhang et al. (2014) through nanoindentation. An important property that characterizes fracture in materials is the fracture toughness (), which describes the resistance to fracture of a material containing a crack tip. For graphene, a value of MPa m1/2 was measured. Typical values of are 62-280 MPa m1/2 for stainless steels, 22-35 MPa m1/2 for aluminum alloys and 1.19-4.30 MPa m1/2 for ABS polymers Ashby (2011). Although, for graphene is not as high as the values just mentioned, its specific mass is much lower than the materials previously mentioned. Thus, graphene is an outstanding candidate for applications in composite structures that require simultaneously lightweight and high strength materials Young et al. (2012); Kim et al. (2013a); Yang et al. (2013). Since mechanical failure is sometimes unavoidable, fracture properties should be taken into account when designing new materials for mechanical and structural applications Ashby (2011).
Many composite structures, such as fiber-reinforced ones, possess anisotropic properties. Their stiffness and fracture toughness values along the direction of the fibers are very distinct from the transverse ones Callister Jr. and Rethwisch (2018). Some nanomaterials, like 2D black phosphorus, also possess anisotropic mechanical behavior in their two distinct in-plane directions: armchair and zigzag Sha et al. (2015); Liu et al. (2019). However, the centrosymmetry of these systems does not allow any property to change with a reversal of direction. There are systems that do possess properties that are dependent on the direction and also on the propagation pathways, but they rely on the presence of interfacial effects Daniel et al. (2004); Malvadkar et al. (2010); Hancock et al. (2012); Zambrano et al. (2018); Xia et al. (2012). Recent works have demonstrated rectification effects and deflection of fractures by modifying only the microstructure with the creation of structural voids Hossain et al. (2014); Brodnik et al. (2021); Conway et al. (2021) without any introduction of a different material. These strategies serve as a way to mitigate the damage of critical components when a fracture is unavoidable Brodnik et al. (2021).
The concept of diode is usually applied to electronic and thermal devices but very rarely for mechanical ones. Recently, Brodnik et al Brodnik et al. (2021) reported fracture diode-like structures by creating structural voids arrangements in millimeter-sized metamaterials. A natural question is whether this behavior still holds at the nanoscale and for the reasons discussed above, graphene membranes would be a good choice. In this work, we further explored these ideas by creating triangular voids into a graphene sheet (see Figure 1) in order to test the possibility of having asymmetrical fracture behavior. First, we considered a structure with two notches at the left and right ends to determine the preferential crack propagation direction. Once determined this direction, we tested the diode-like behavior considering just only one notch to determine which direction the fractures experience less resistance (tensile strength in the stress-strain curve). Although there are several works on electronic Dragoman et al. (2010); Di Bartolomeo (2016); Wang et al. (2021); Kim et al. (2013b); Li et al. (2016) and thermal Wang et al. (2017); Liu et al. (2021); Chen et al. (2020); Melis et al. (2015); Wang et al. (2014) graphene-based diodes, to our knowledge mechanical graphene-based diode based on ideas proposed by Brodnik et al Brodnik et al. (2021) has not been investigated and it is one of the goals of the present study.
2 Methodology
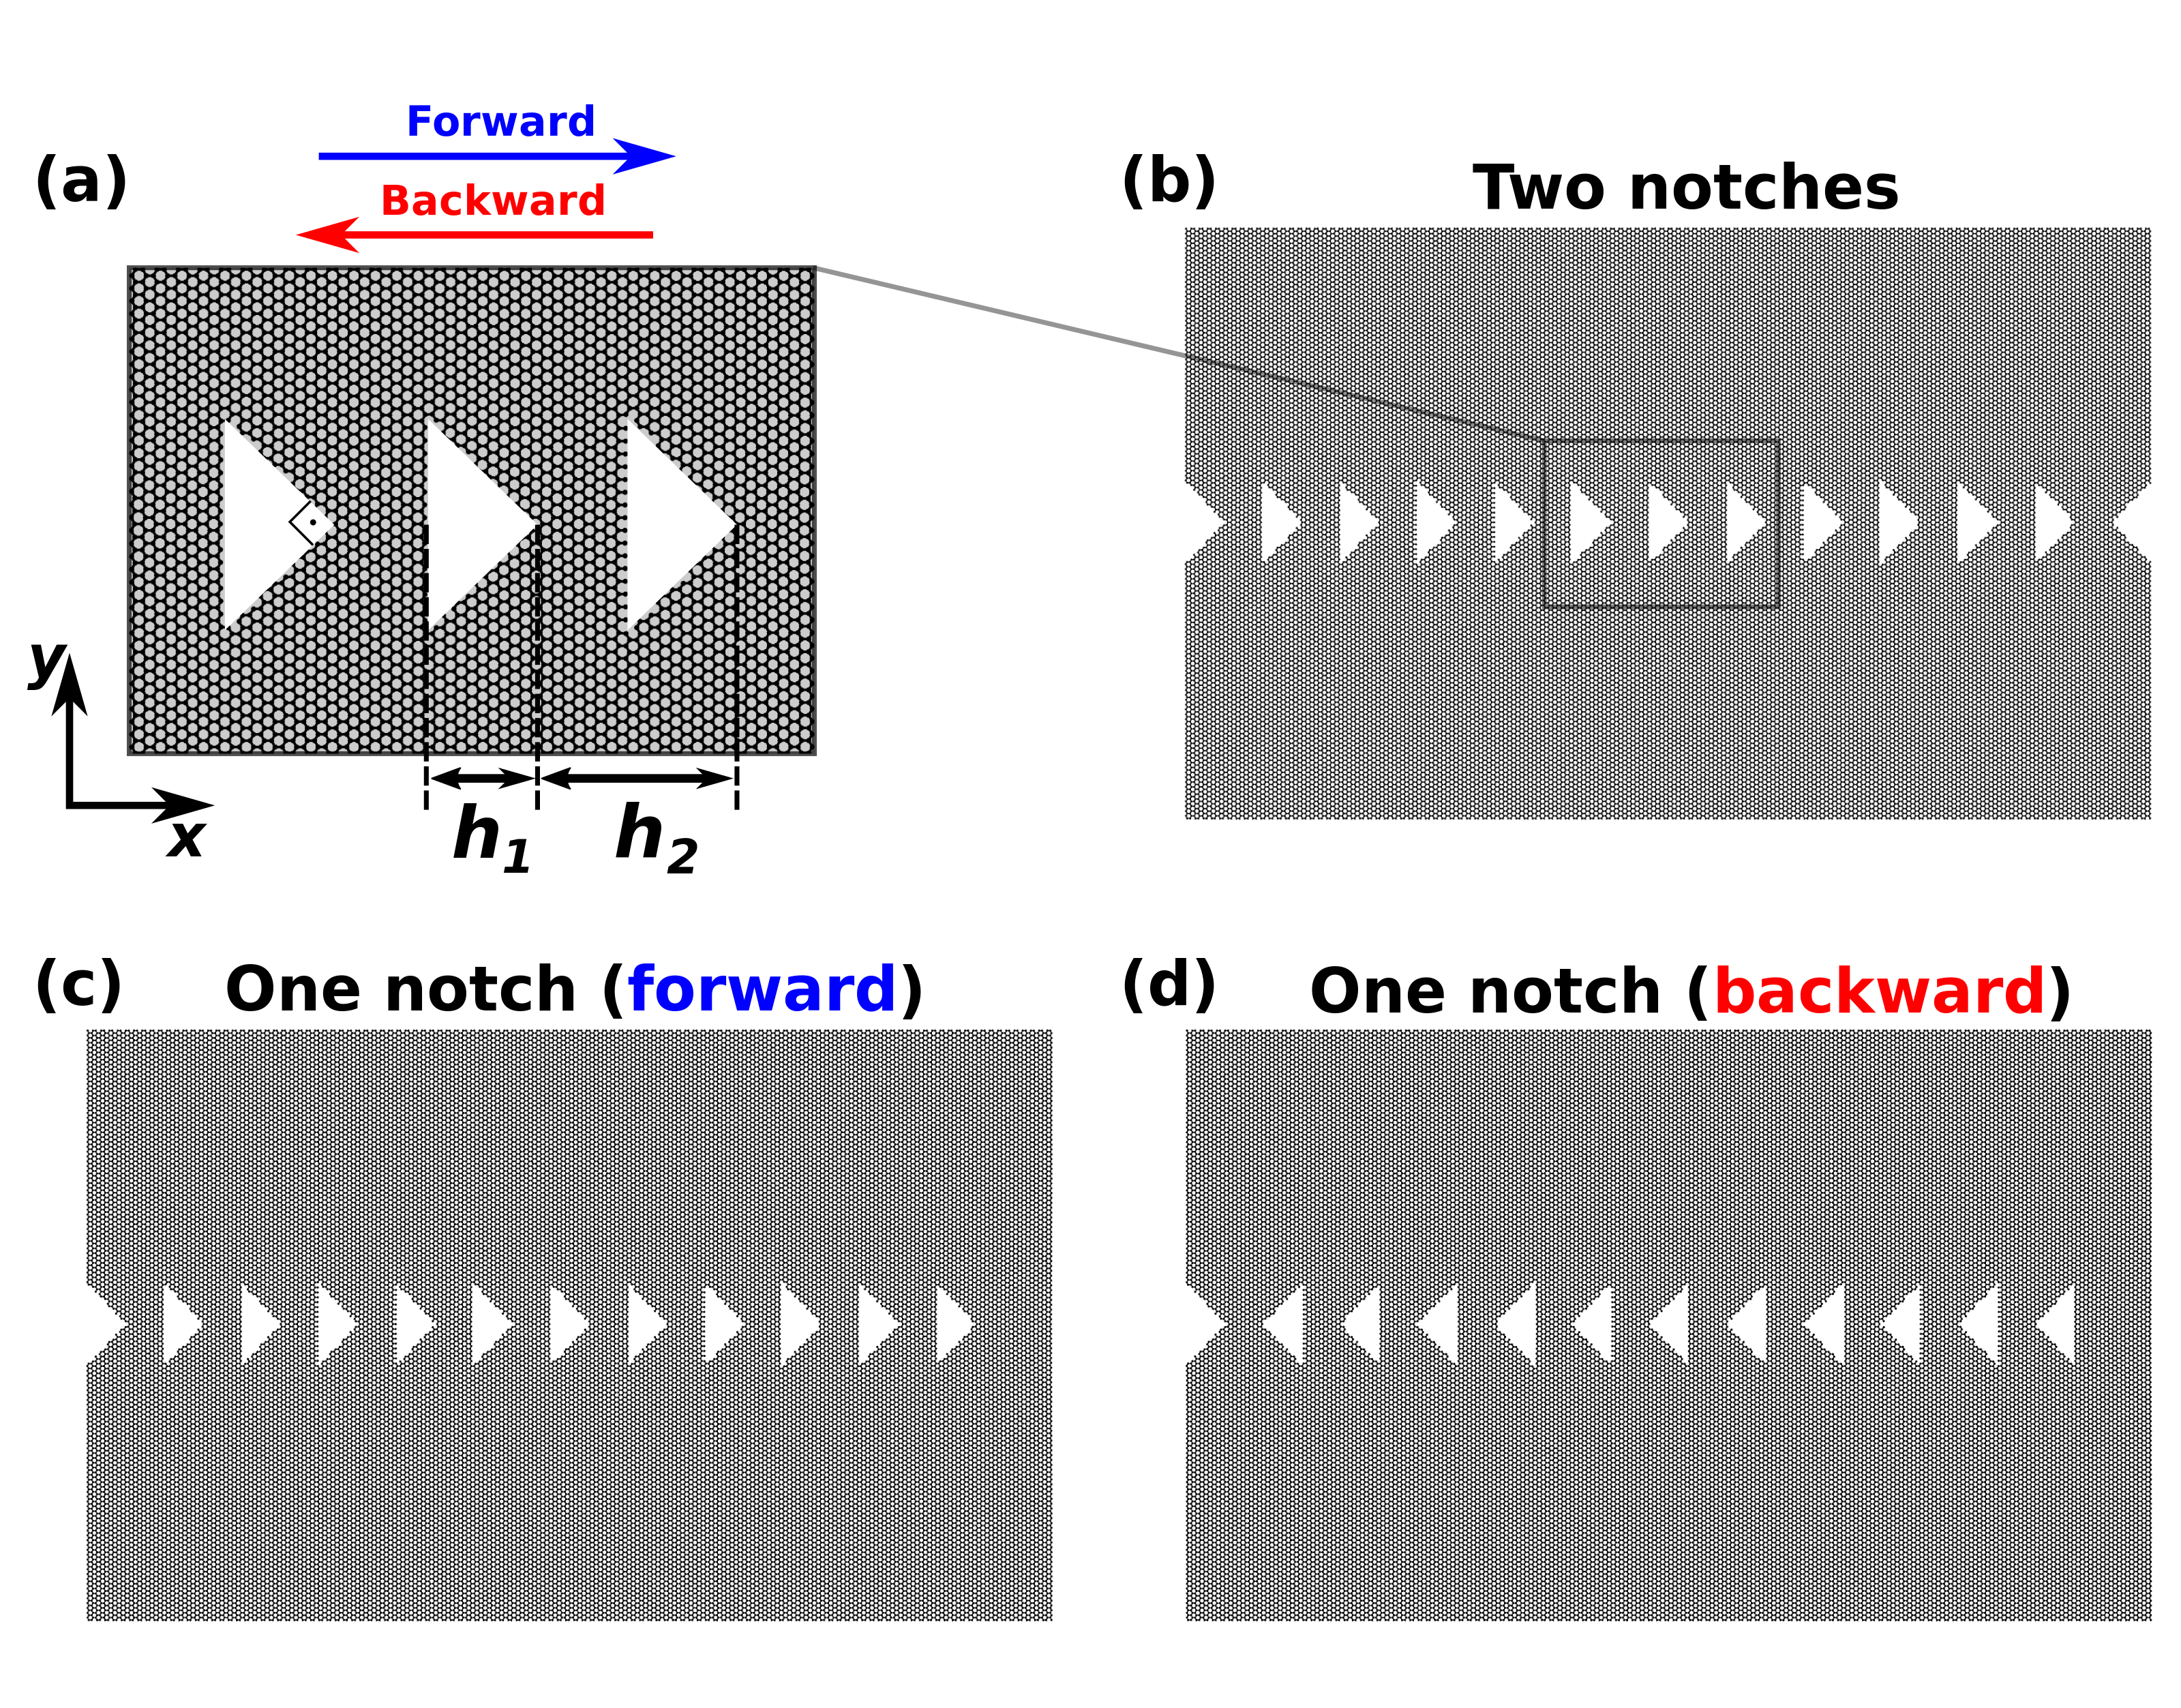
From a pristine graphene sheet with dimensions of nm and nm, we created holes along its middle line. These holes are isosceles triangles with nm of height and are equally translated along the direction by (see Figure 1 (a)). We considered two cases where (i) two triangular notches at the left and right edges are present as crack tips to start the fracture propagation as shown in Figure 1 (b) and (ii) with only one notch to induce a fracture to propagate along the direction where the triangles are pointing (here denoted as forward direction, as shown in Figure 1 (a)) and through the opposite direction (backward, as also illustrated in Figure 1 (a)), as illustrated in Figure 1 (c) and (d). The latter two configurations were considered to determine the preferential fracture propagation direction (which one offers lesser resistance to crack propagation), here estimated by their tensile strength. Additionally, we also compared the cases with different translations. The stretching direction was chosen to be along the axis and, thus, a periodic boundary condition was applied to this direction. A vacuum region of 3 nm is introduced along and directions to mimic a finite nanoribbon. The tensile deformations were investigated through fully atomistic Molecular Dynamics (MD) simulations using the open-source code LAMMPS Plimpton (1995). The interatomic interaction among the carbon atoms was modeled with the reactive AIREBO potential Stuart et al. (2000). To better describe the mechanical behavior at large strain values, we modified the minimum cutoff radius of the force field to 2 Å as described by Shenderova et al Shenderova et al. (2000). Before stretching, an NPT equilibration MD runs, at a temperature of K, was performed during ps to eliminate any residual stresses in the structures. During NPT MD runs, only the dimension was allowed to vary, since it is the only periodic one. The structural stretching process is implemented by increasing the length of the simulation box along the direction with a constant engineering strain rate of fs-1 and an MD timestep of fs. In this way, the dimension of the simulation box vary as . The deformation level of all structures studied here is quantified by the engineering strain .
To obtain the stress-strain response, we calculated the total stress, given by
| (1) |
where the indices correspond to the Cartesian directions, is the number of atoms in the system, is the atomic mass of the -th atom, () is the atomic position (velocity) of the -th along the direction, is the corresponding force on the -th atom due to its neighbors. The volume of the structure is given by , where a thickness of Å is adopted for graphene.
To obtain further insights on the local stress accumulation and fracture dynamics, we also computed the virial stress per atom , defined by
| (2) |
where runs over the neighbors of atom , is the pairwise interaction force component on atom , take into consideration all pair atoms in the three-body force terms on the -th atom, runs over all LAMMPS fixes that apply internal constraint forces to atom , and is the corresponding force due to -th fix. Due to the von Mises failure criteria, it is more effective to analyze the local distribution of stress with the atomic von Mises stress Mises (1913) given by the relation
| (3) |
To better visualize stress accumulations, the values of for each atom are taken as the average between its corresponding neighbors within a cutoff distance of Å using OVITO Stukowski (2010).
3 Results
The forward and backward directions are defined in Figure 1 (a). We first performed the stretching simulations on the two-notch structures with different void spacing in order to determine the preferential fracture propagation direction (left or right).
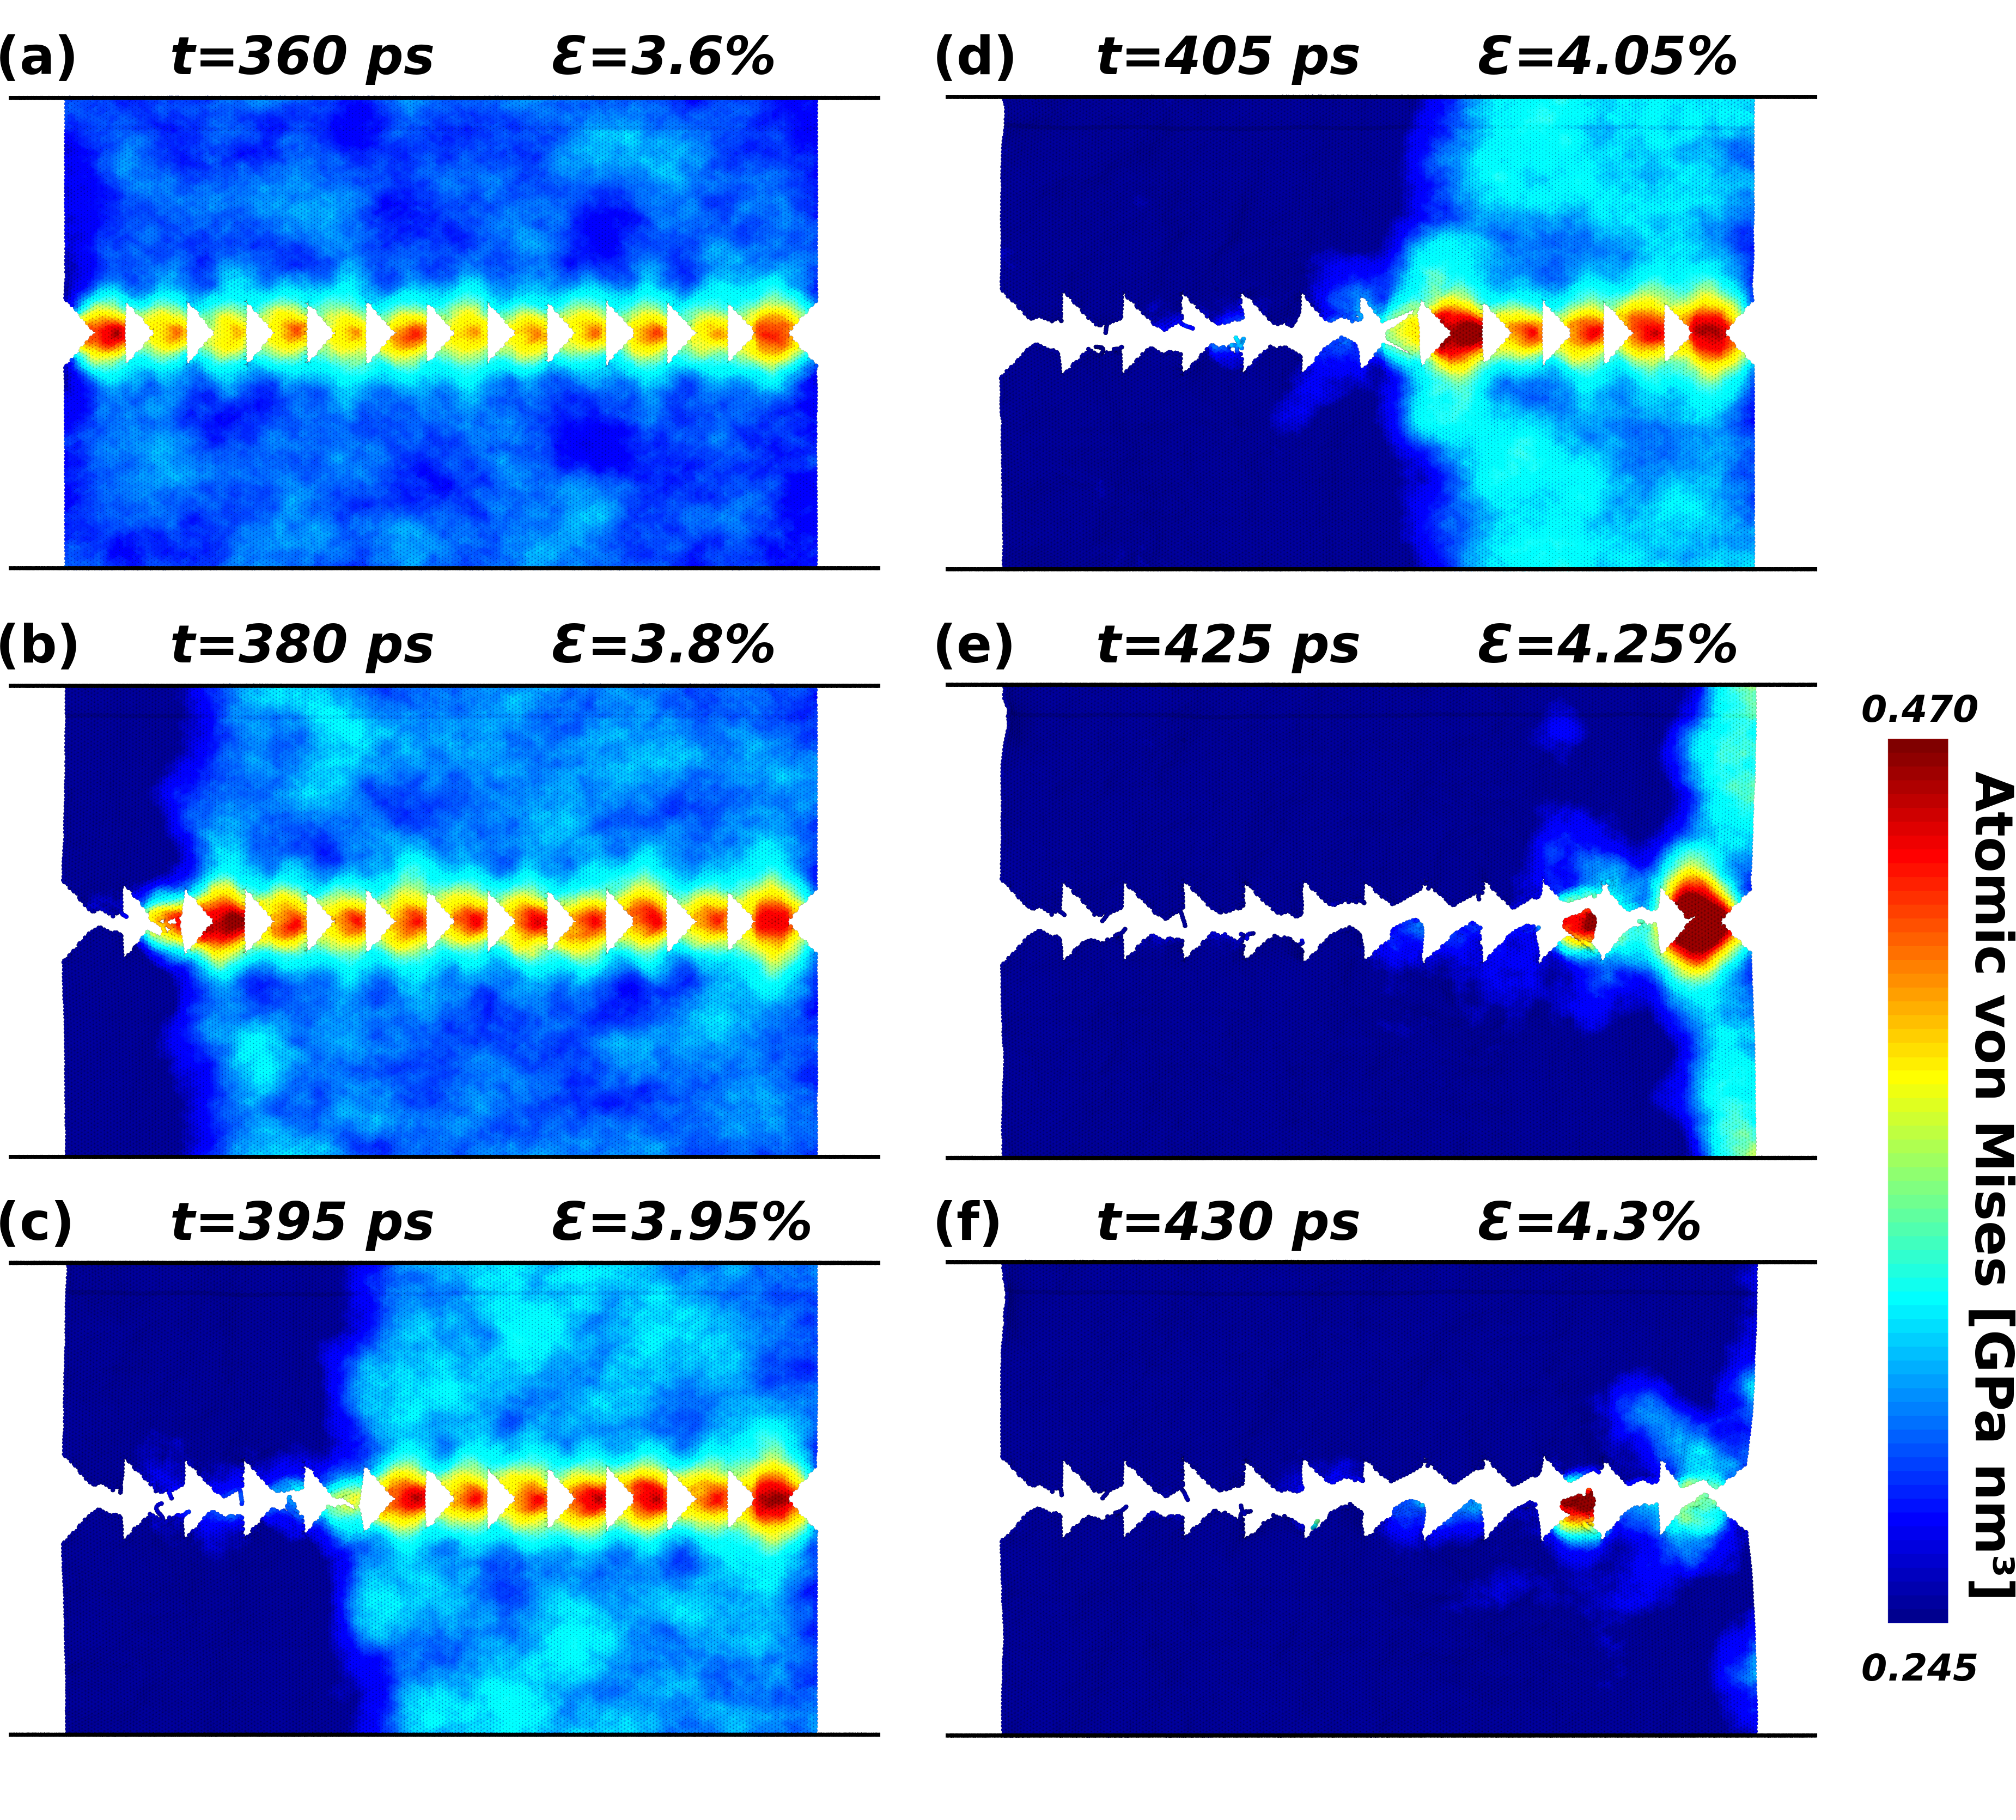
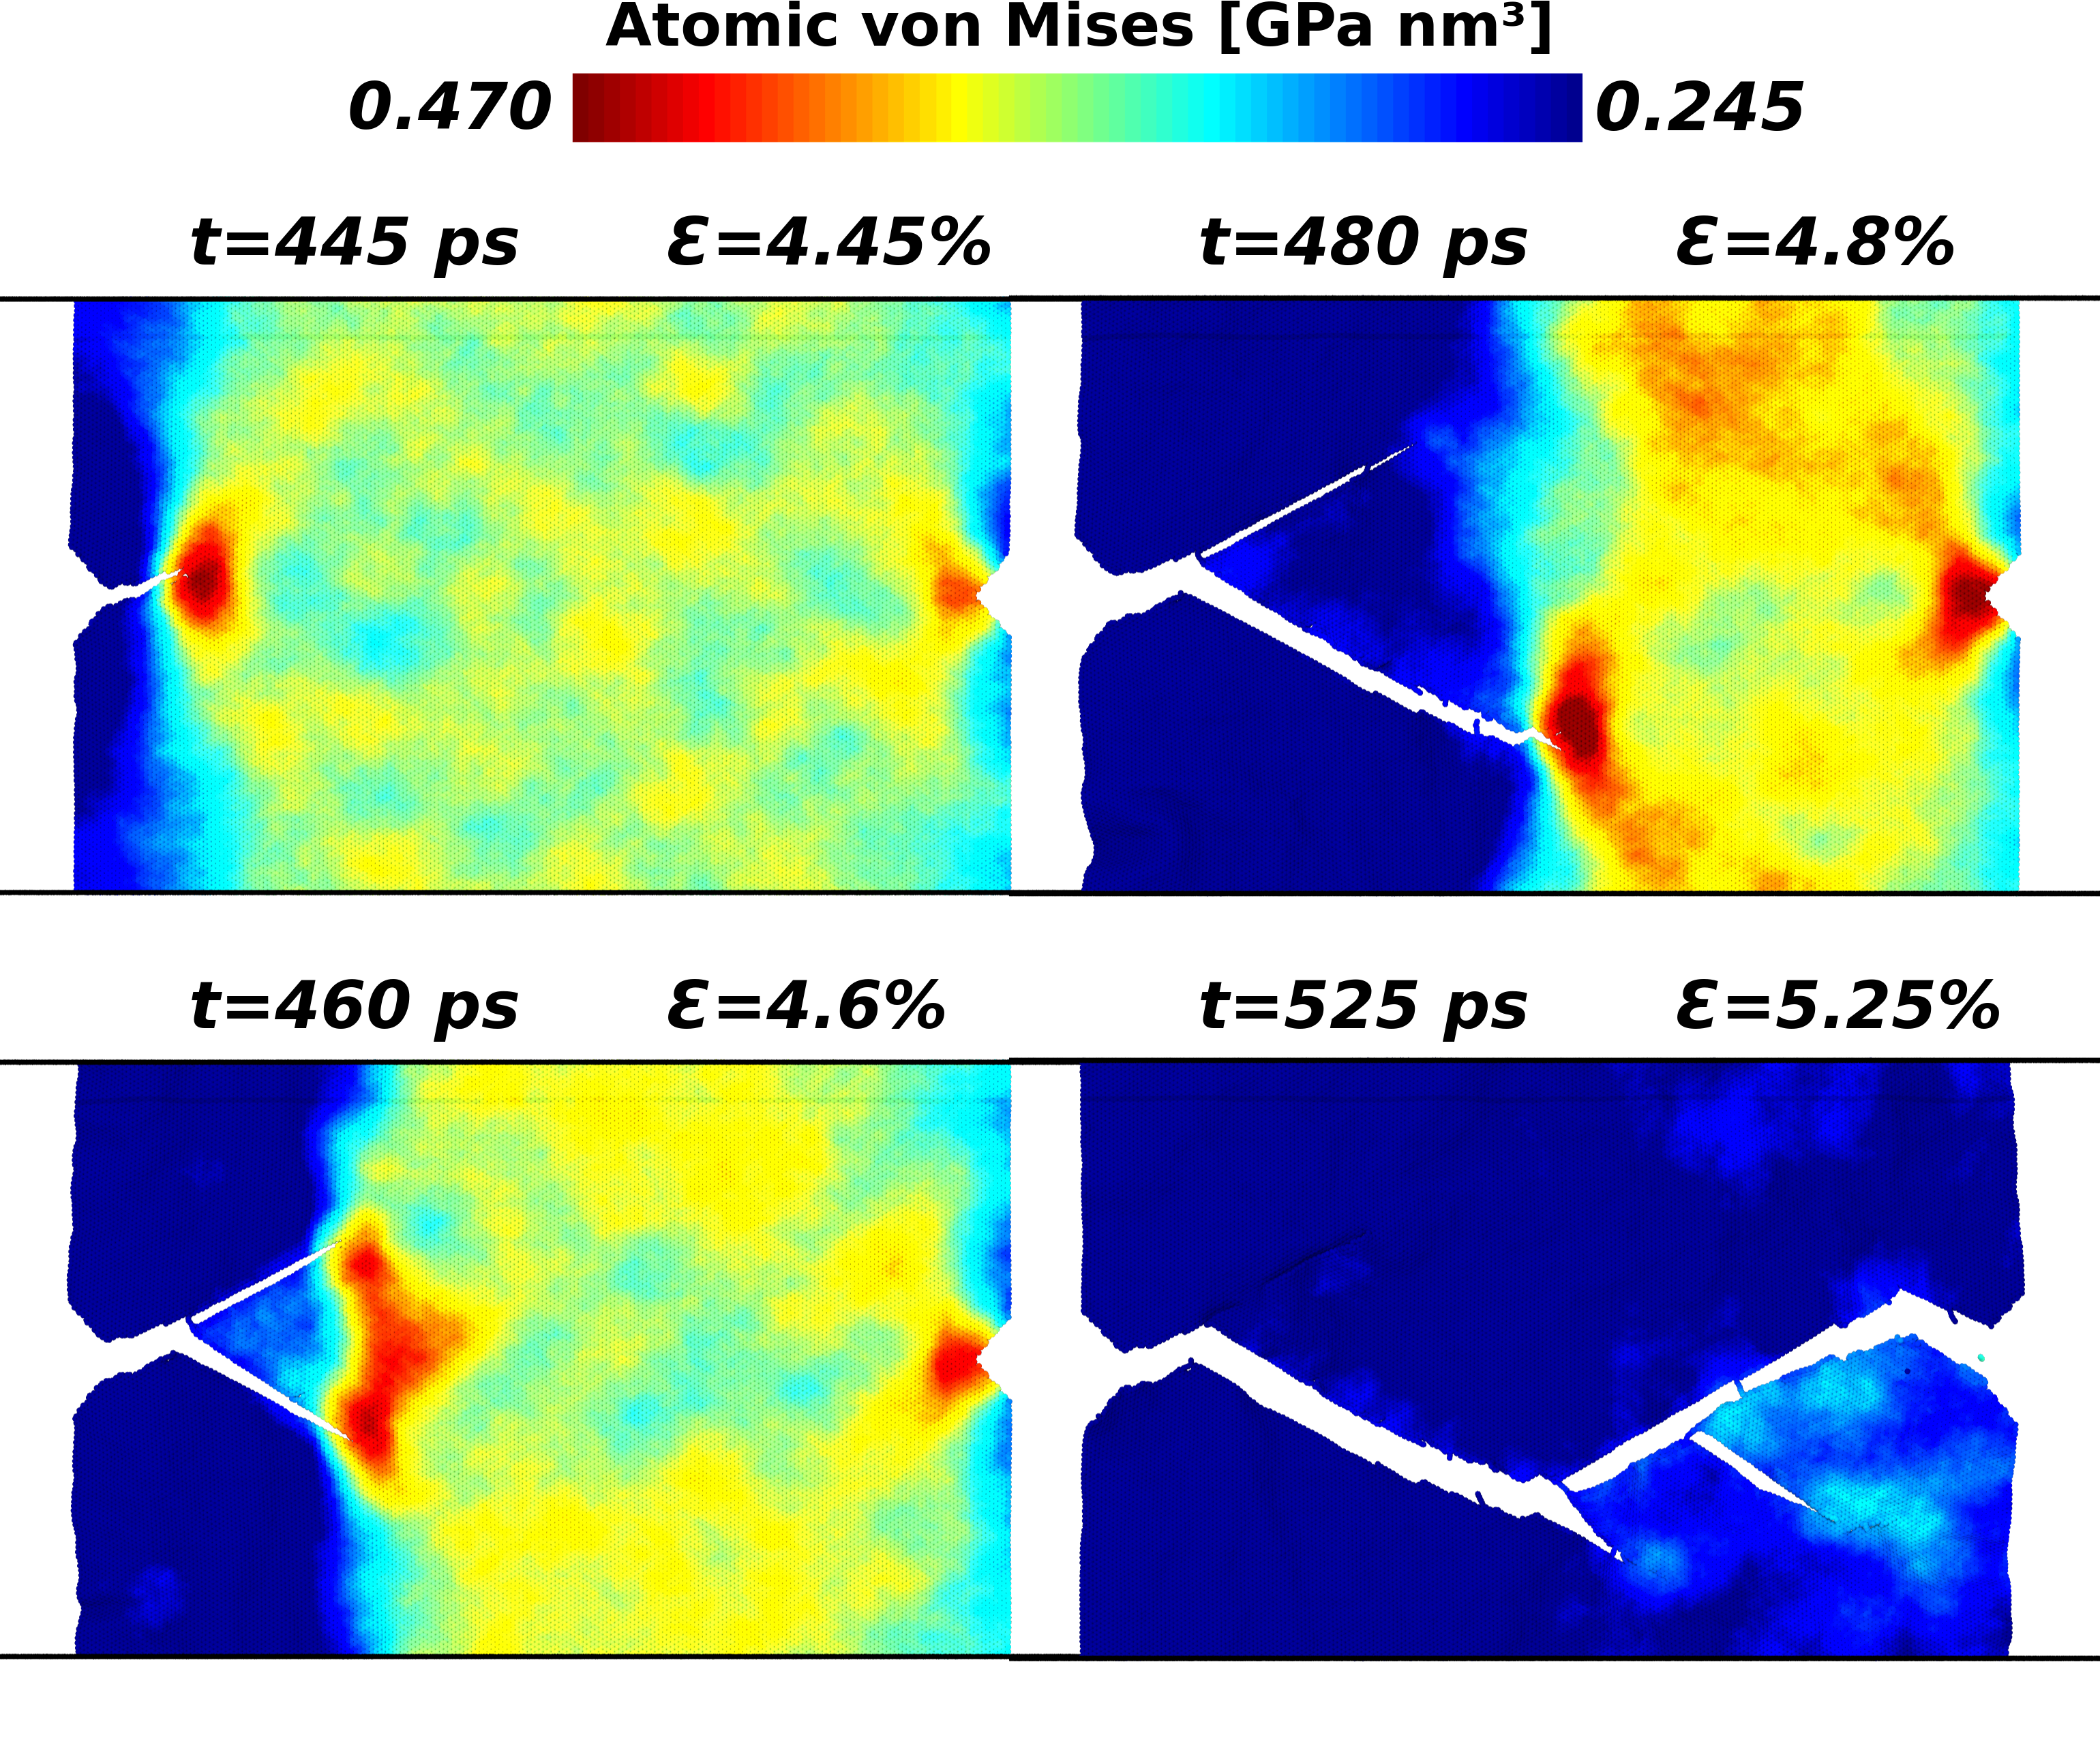
In Figure 2, we present representative MD snapshots at different simulation times and their corresponding spatial stress distribution. It is clear that once started the fracture propagates preferentially from left to right corresponding to the forward direction. From the von Mises distribution, we can also see that, as expected, the stress is released with the fracture, which can be seen by the blue region that follows the crack as the structure breaks. The stress peaks, shown in Figure 2 as red spots between voids, are very spatially localized where the larger spots on the beginning are situated on the left and right ends due to the presence of the crack tips. The detailed fracture propagation is shown in the supplementary video S1.
From Figure 2 we observed that the fracture propagated along the array of triangular voids in the middle line of the structure. In order to determine whether this happens due to the presence of the defects, we run a similar MD simulation with two notches but without the internal triangular voids. As we can see in Figure 3, the crack starts and propagates from the left by it rapidly deviates from the middle line following specific angles. These angles (the so-called ’petal’ angles) are characteristic of fractured hexagonal lattices Bizao et al. (2017). Therefore, the array of triangular voids serves as a structural mechanism to ’guide’ the fracture to a specific region of the structure, in our case the middle line.
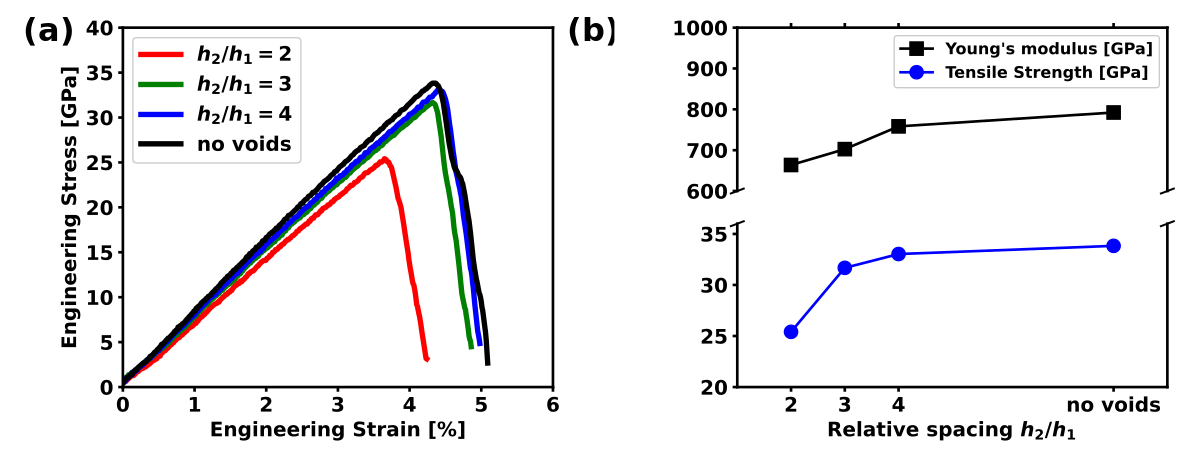
We also carried out stretching simulations for the cases of void spacing with and . The corresponding stress-strain curves are shown in Figure 4 (a). A common behavior is observed for all cases: (i) a linear regime at low strain values (up to ) characteristic of an elastic behavior; (ii) a slight increase of the slope corresponding to the propagation of fracture from one void to another, where more pronounced stress peaks appear near the crack tip, and; (iii) a maximum peak indicating the tensile strength of a given structure that is subsequently followed by an abrupt drop of stress values, which indicates total fracture. As the relative spacing increases, both tensile strength and Young’s modulus (here estimated as the slope of the linear regime) also increases. This behavior is expected since the stiffness of graphene decreases with increased defect density. These trends are clearly shown in Figure 4 (b).
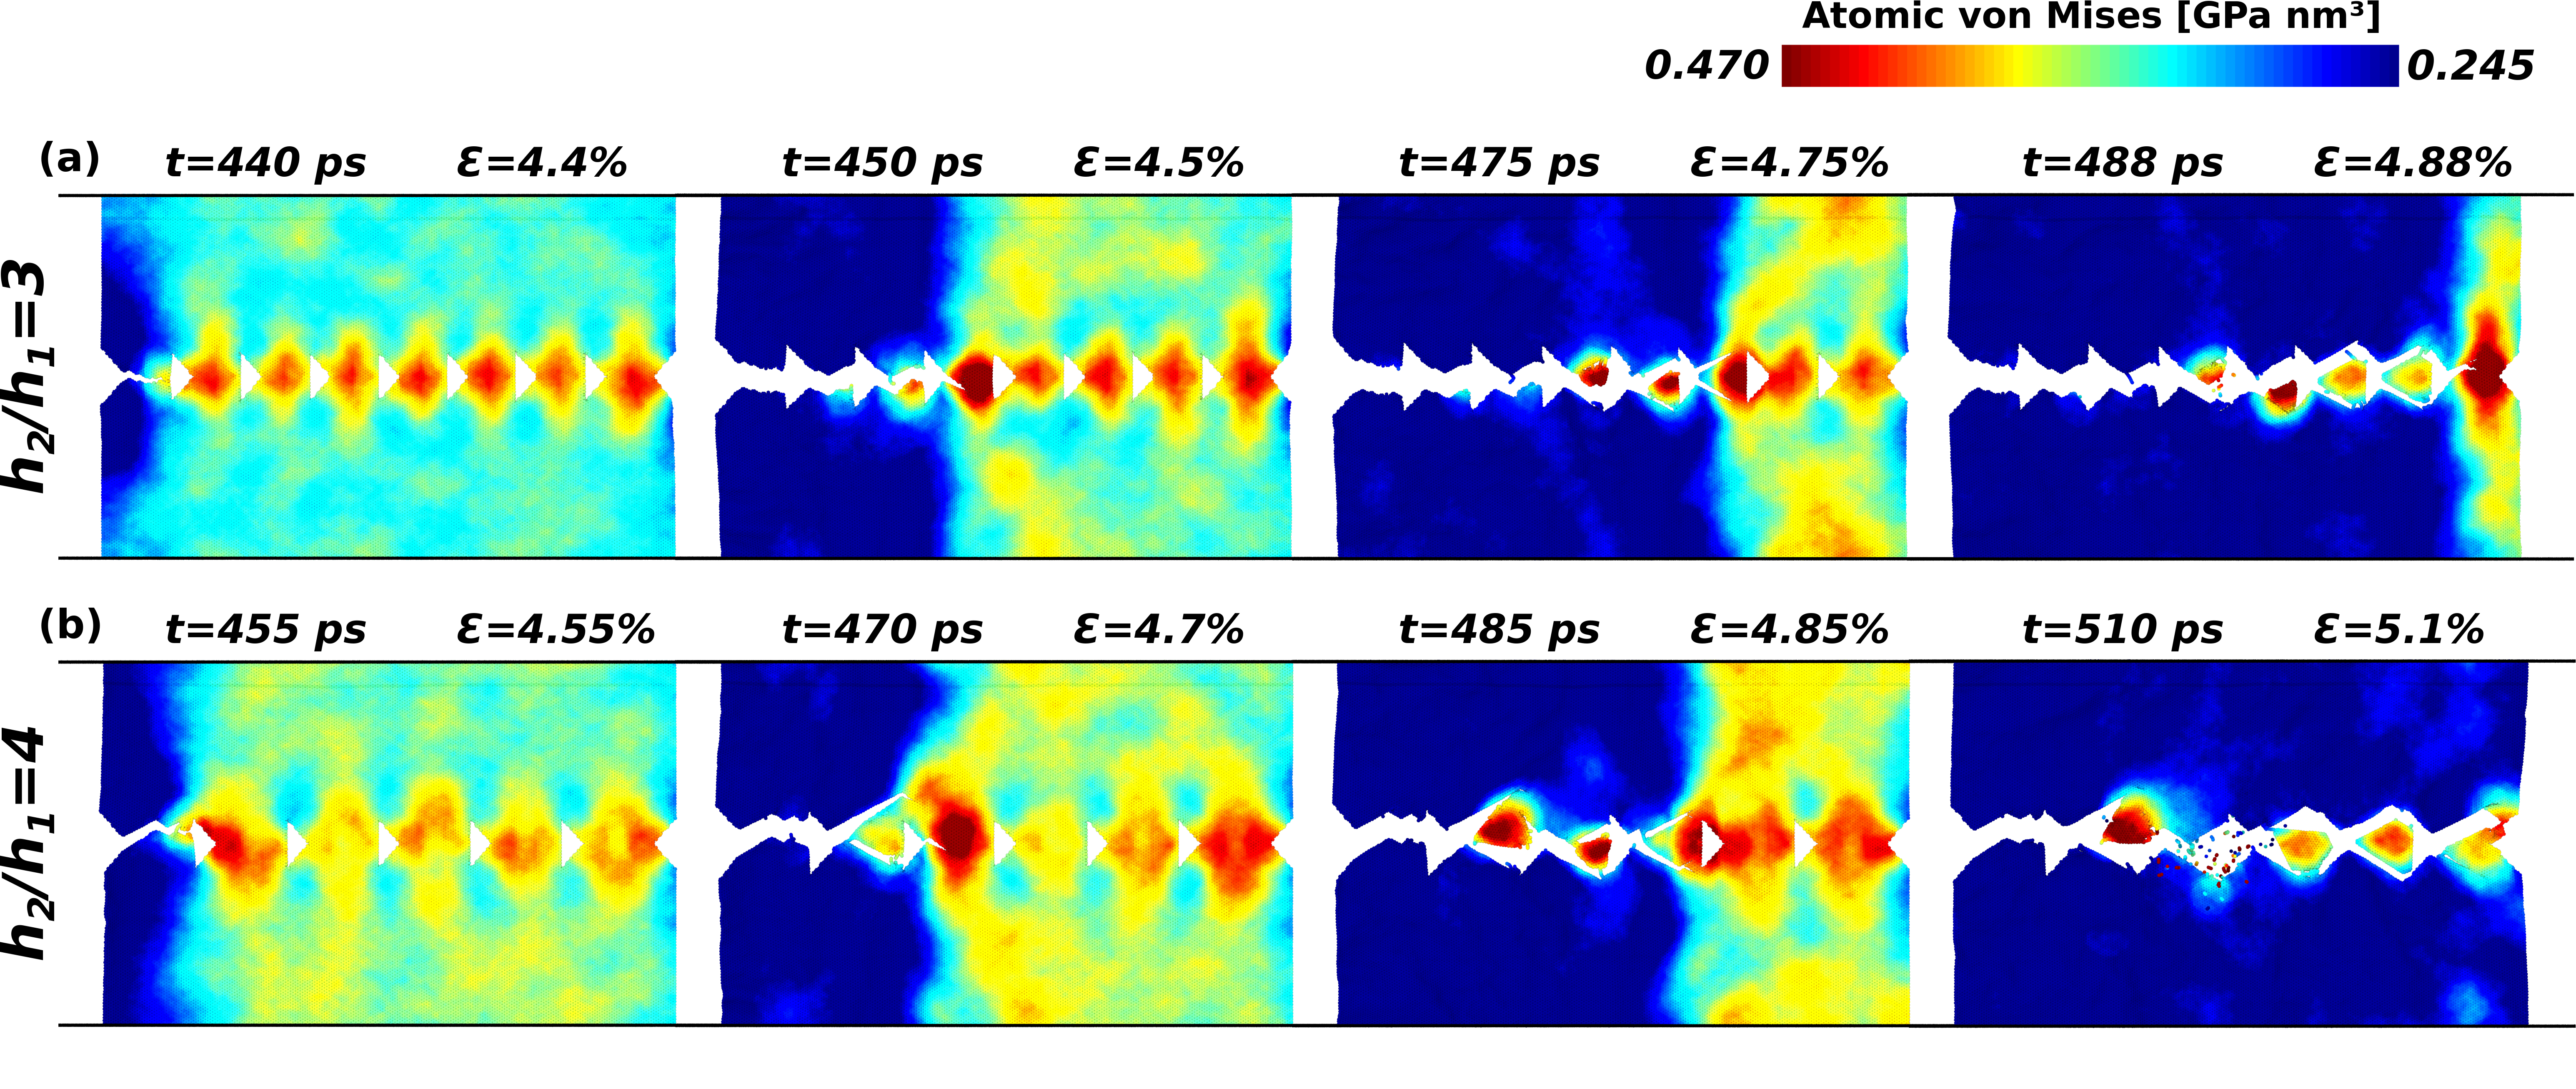
The ’guided’ fracture effect is also present in cases where and , as shown in Figure 5 (a) and (b), respectively. From the time evolution indicated above each snapshot, fracture propagates slower for higher values. This occurs because each void accelerates the process where there is nothing opposing to crack propagation, whereas in high- structures there is more material to break, which delays the total fracture.
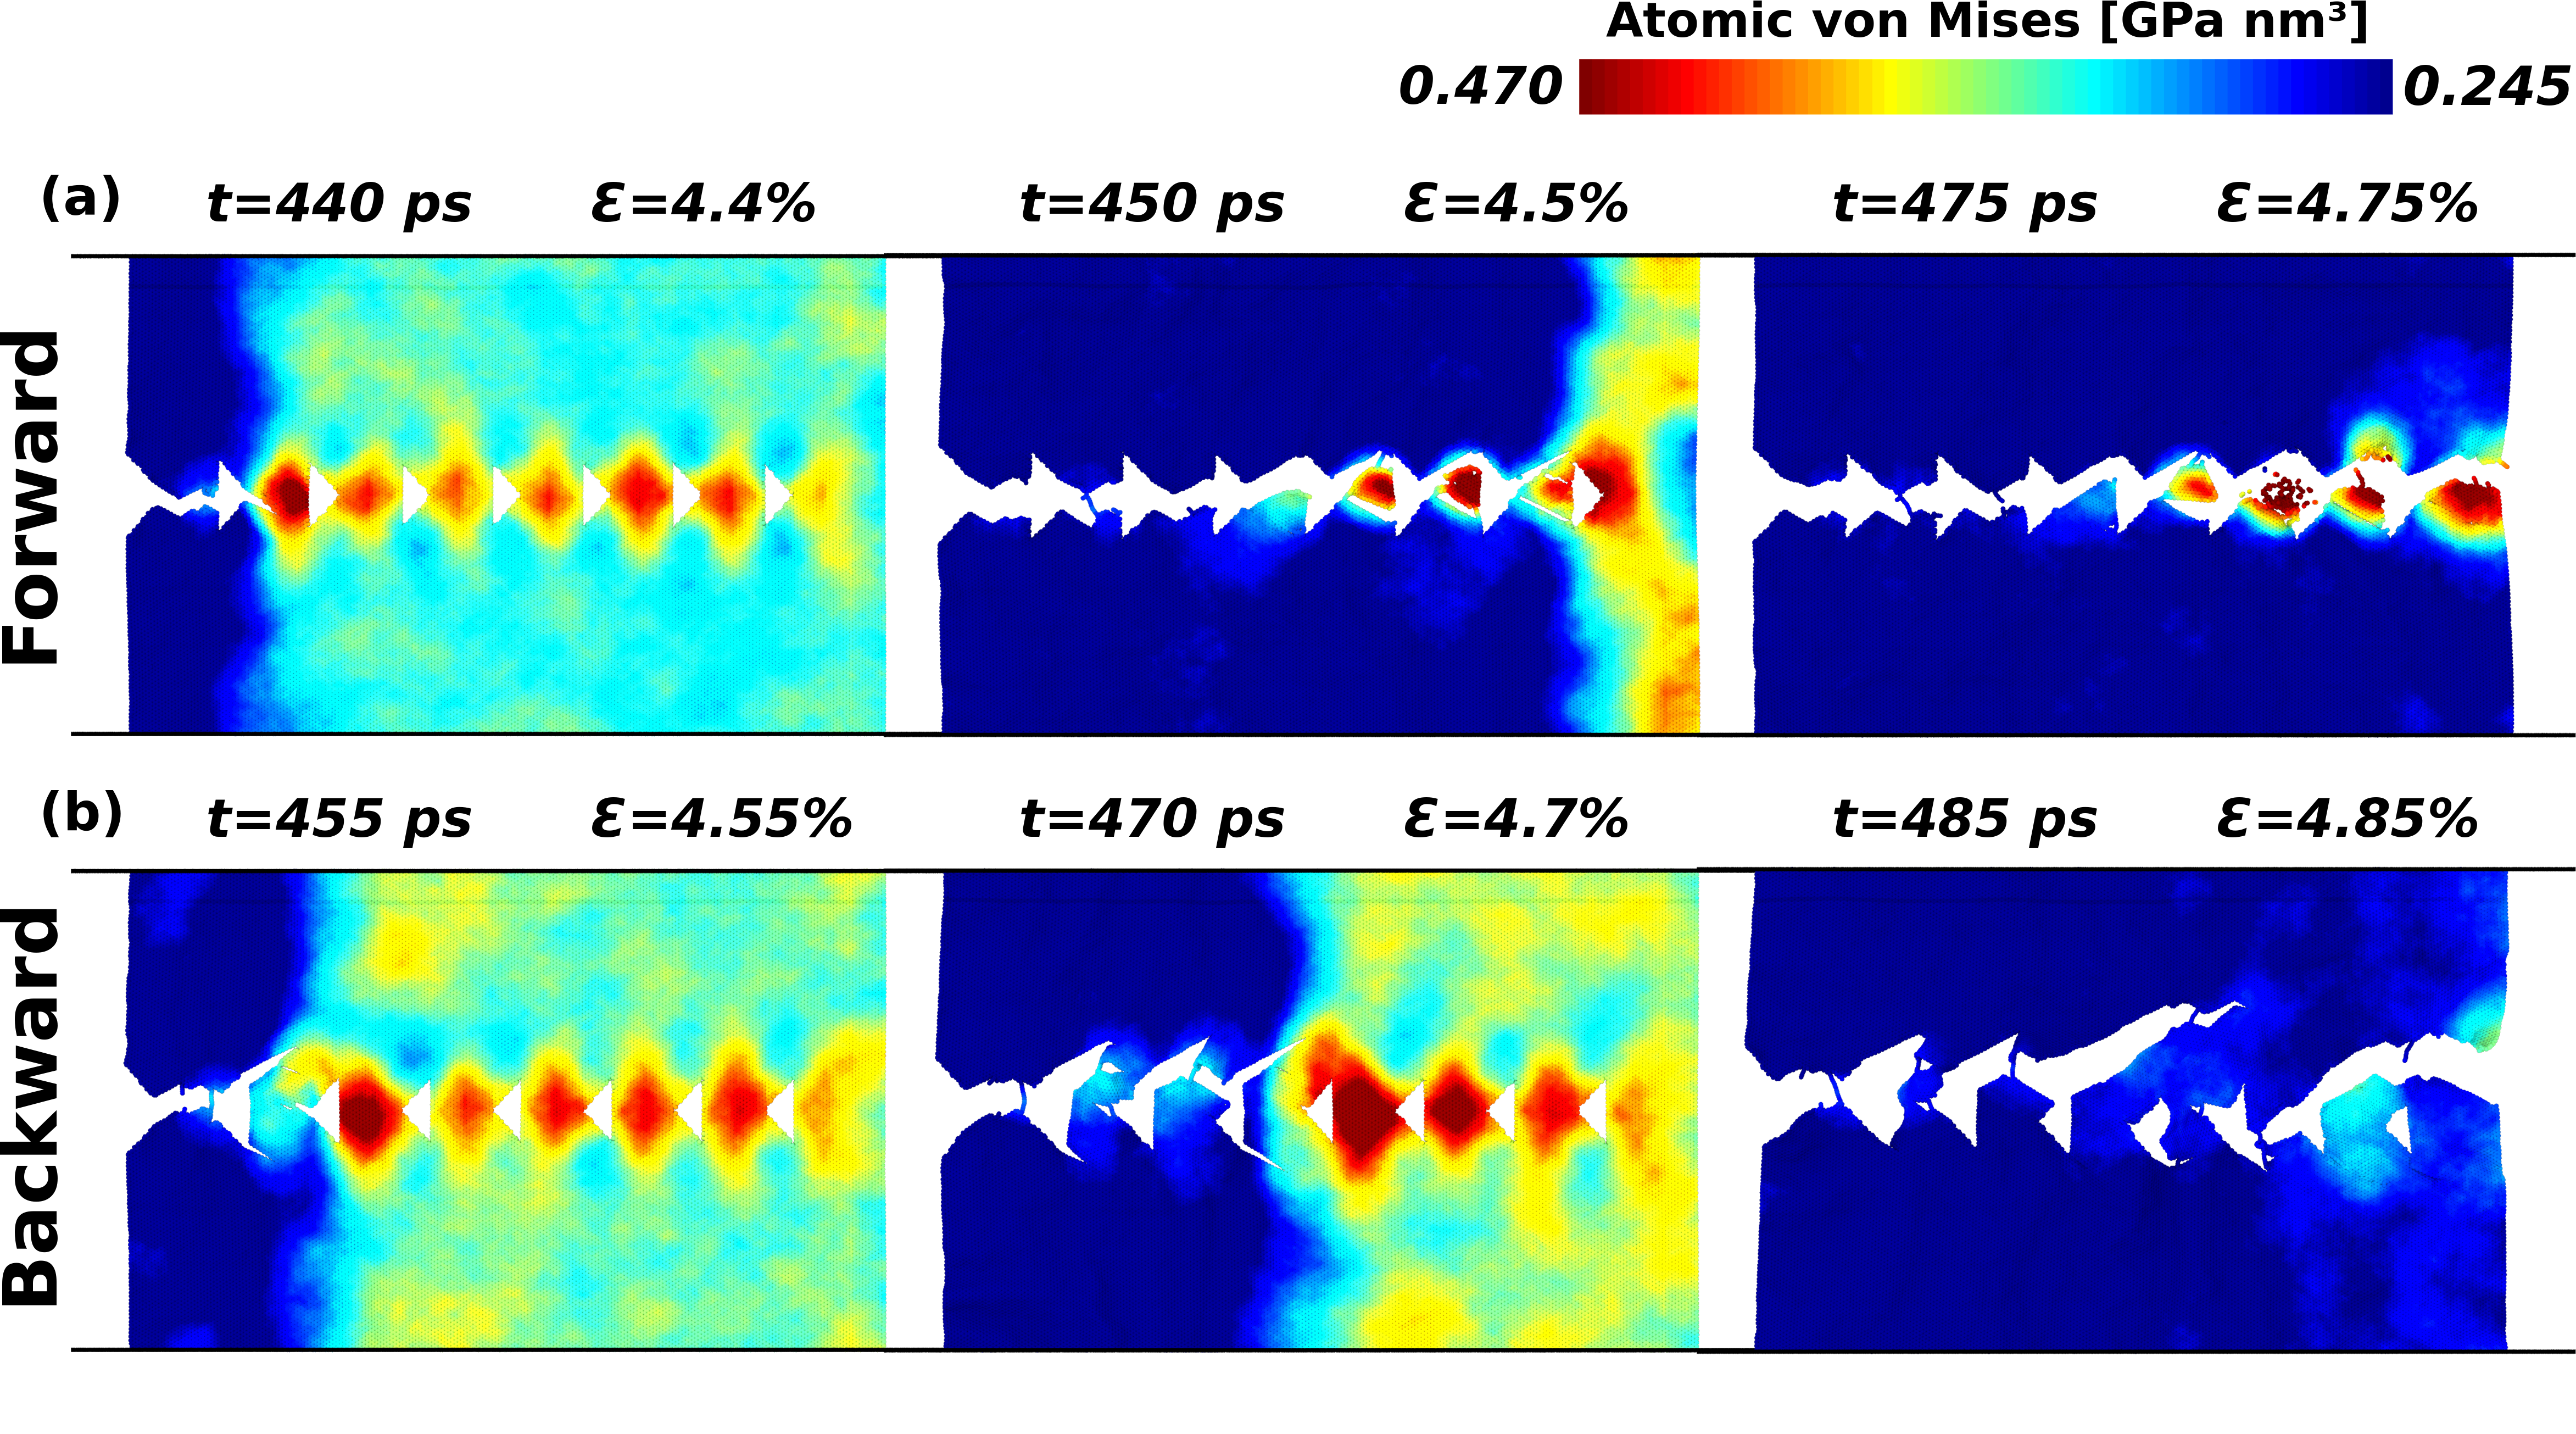
Once determined the preferential fracture direction propagation, we proceed to test the diode-like behavior using the same configurations of triangular voids with a spacing of but just with only one notch at the left. This favors the fracture to propagate along a specific direction, as discussed above. The temporal evolution of the crack propagation along the forward and backward directions are presented in Figure6 (a) and (b), respectively. Along the forward direction, the fracture is guided by the array of voids as in the two-notch structure (Figure 5 (a)), where only carbon bonds near the middle line are broken in the fracture process. By constraining the crack to propagate along the backward direction (inverting the triangular voids orientation), the fracture also occurs but propagating away from the voids and, therefore, the ’guided’ fracture effect is no longer present. This indicates that such an array of triangular voids creates a mechanical diode-like effect for the graphene fracture at the nanoscale, similarly to tailored voids in polymeric materials at the macroscale Brodnik et al. (2021), thus confirming that the effect still holds at the nanoscale. The detailed fracture propagation of the forward and backward cases are shown in the supplementary videos S2 and S3, respectively.
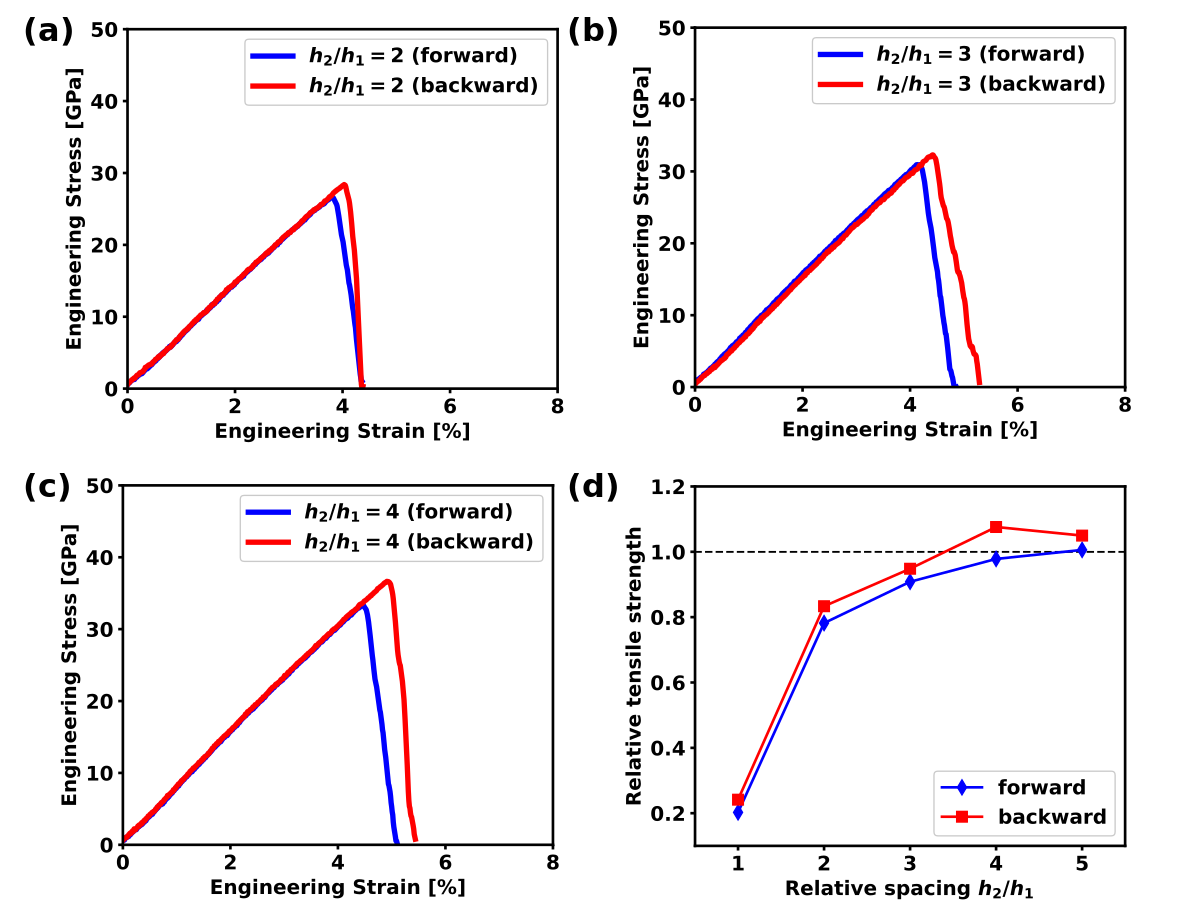
The robustness of fracture ’rectification’ provided by such an array of defects is quantified in Figure 7. For a given void spacing, Young’s modulus values are not considerably affected by the change in the crack propagation direction, since the stress values are essentially the same for low strain values as can be seen in Figure 7 (a)-(c). From this Figure, we can also see that the rectification effect increases with up to . This trend can be explained based on that more bonds far from the middle line are broken in the propagation of fracture where larger distances between successive voids mean more energy needed for the fracture to propagate from one void to another. However, this trend in relative tensile strength should have an upper limit because the increase of values reaches a limit where two neighbor triangles are very apart and the system as a whole resembles the case without any voids or, in other words, becomes symmetrical.
4 Conclusions
We have investigated the effect of fracture rectification in graphene membranes with an array of defects of triangular shape (with different spacing) through fully atomistic reactive molecular dynamics simulations. We considered two structural models (Figure 2), one with two-notches tips, to determine the preferential fracture direction propagation and once determined, with a single notch to test the fracture-like behavior.
Our results show that a robust diode-like behavior exists, thus validating that the phenomenon observed at the macroscale by Brodnik et al Brodnik et al. (2021) still holds at the nanoscale for graphene membranes. Other topologies and/or defects can be also exploited to guide the fracture along engineering directions. The experimental realization of the structures shown in (Figure 2) is feasible today. In fact, more complex graphene kirigami structures have been already reported Blees et al. (2015).
Acknowledgments
This work was financed by Sao Paulo State Research Support Foundation (FAPESP). We also thank the Center for Computing in Engineering and Sciences at Unicamp for financial support through the FAPESP/CEPID Grants #2013/08293-7 and #2018/11352-7.
References
- Novoselov et al. [2004] K S Novoselov, A K Geim, S V Morozov, D Jiang, Y Zhang, S V Dubonos, I V Grigorieva, and A A Firsov. Electric field effect in atomically thin carbon films. Science, 306(5696):666–669, oct 2004. doi:10.1126/science.1102896. URL http://dx.doi.org/10.1126/science.1102896.
- Geim and Novoselov [2007] A K Geim and K S Novoselov. The rise of graphene. Nature Materials, 6(3):183–191, mar 2007. doi:10.1038/nmat1849. URL http://dx.doi.org/10.1038/nmat1849.
- Zhang et al. [2005] Yuanbo Zhang, Yan-Wen Tan, Horst L Stormer, and Philip Kim. Experimental observation of the quantum hall effect and berry’s phase in graphene. Nature, 438(7065):201–204, nov 2005. doi:10.1038/nature04235. URL http://dx.doi.org/10.1038/nature04235.
- Young and Kim [2009] Andrea F. Young and Philip Kim. Quantum interference and klein tunnelling in graphene heterojunctions. Nature physics, 5(3):222–226, mar 2009. ISSN 1745-2473. doi:10.1038/nphys1198. URL http://www.nature.com/articles/nphys1198.
- Castro Neto et al. [2009] A. H. Castro Neto, F. Guinea, N. M. R. Peres, K. S. Novoselov, and A. K. Geim. The electronic properties of graphene. Reviews of Modern Physics, 81(1):109–162, jan 2009. ISSN 0034-6861. doi:10.1103/RevModPhys.81.109. URL http://link.aps.org/doi/10.1103/{RevModPhys}.81.109.
- Lee et al. [2008] Changgu Lee, Xiaoding Wei, Jeffrey W Kysar, and James Hone. Measurement of the elastic properties and intrinsic strength of monolayer graphene. Science, 321(5887):385–388, jul 2008. doi:10.1126/science.1157996. URL http://dx.doi.org/10.1126/science.1157996.
- Bizao et al. [2017] R.A. Bizao, T. Botari, E. Perim, Nicola M. Pugno, and D.S. Galvao. Mechanical properties and fracture patterns of graphene (graphitic) nanowiggles. Carbon, 119:431–437, aug 2017. ISSN 00086223. doi:10.1016/j.carbon.2017.04.018. URL http://linkinghub.elsevier.com/retrieve/pii/S0008622317303743.
- Bizao et al. [2018] Rafael A Bizao, Leonardo D Machado, Jose M de Sousa, Nicola M Pugno, and Douglas S Galvao. Scale effects on the ballistic penetration of graphene sheets. Scientific Reports, 8(1):6750, apr 2018. doi:10.1038/s41598-018-25050-2. URL http://dx.doi.org/10.1038/s41598-018-25050-2.
- Fonseca and Galvao [2021] Alexandre F. Fonseca and Douglas S. Galvao. Graphene-based nanoscale version of da vinci’s reciprocal structures. Computational Materials Science, 187:110105, feb 2021. ISSN 09270256. doi:10.1016/j.commatsci.2020.110105. URL https://linkinghub.elsevier.com/retrieve/pii/S0927025620305966.
- Lee et al. [2012] Jae-Ung Lee, Duhee Yoon, and Hyeonsik Cheong. Estimation of young’s modulus of graphene by raman spectroscopy. Nano Letters, 12(9):4444–4448, sep 2012. doi:10.1021/nl301073q. URL http://dx.doi.org/10.1021/nl301073q.
- Branicio et al. [2016] Paulo S. Branicio, Guglielmo Vastola, Mark H. Jhon, Michael B. Sullivan, Vivek B. Shenoy, and David J. Srolovitz. Elastic interaction of hydrogen atoms on graphene: A multiscale approach from first principles to continuum elasticity. Physical Review B, 94(16):165420, oct 2016. ISSN 2469-9950. doi:10.1103/PhysRevB.94.165420. URL https://link.aps.org/doi/10.1103/{PhysRevB}.94.165420.
- Zhang et al. [2014] Peng Zhang, Lulu Ma, Feifei Fan, Zhi Zeng, Cheng Peng, Phillip E Loya, Zheng Liu, Yongji Gong, Jiangnan Zhang, Xingxiang Zhang, Pulickel M Ajayan, Ting Zhu, and Jun Lou. Fracture toughness of graphene. Nature Communications, 5:3782, apr 2014. doi:10.1038/ncomms4782. URL http://dx.doi.org/10.1038/ncomms4782.
- Ashby [2011] Michael F. Ashby. Materials selection in mechanical design. Butterworth-Heinemann, 4th edition, 2011. ISBN 9781856176637. doi:10.1016/C2009-0-25539-5. URL https://linkinghub.elsevier.com/retrieve/pii/C20090255395.
- Young et al. [2012] Robert J. Young, Ian A. Kinloch, Lei Gong, and Kostya S. Novoselov. The mechanics of graphene nanocomposites: A review. Composites science and technology, 72(12):1459–1476, jul 2012. ISSN 02663538. doi:10.1016/j.compscitech.2012.05.005. URL http://linkinghub.elsevier.com/retrieve/pii/S0266353812001789.
- Kim et al. [2013a] Youbin Kim, Jinsup Lee, Min Sun Yeom, Jae Won Shin, Hyungjun Kim, Yi Cui, Jeffrey W Kysar, James Hone, Yousung Jung, Seokwoo Jeon, and Seung Min Han. Strengthening effect of single-atomic-layer graphene in metal-graphene nanolayered composites. Nature Communications, 4:2114, 2013a. doi:10.1038/ncomms3114. URL http://dx.doi.org/10.1038/ncomms3114.
- Yang et al. [2013] Yingchao Yang, William Rigdon, Xinyu Huang, and Xiaodong Li. Enhancing graphene reinforcing potential in composites by hydrogen passivation induced dispersion. Scientific Reports, 3:2086, 2013. doi:10.1038/srep02086. URL http://dx.doi.org/10.1038/srep02086.
- Callister Jr. and Rethwisch [2018] William D. Callister Jr. and David G. Rethwisch. Materials Science and Engineering: An Introduction. Wiley, 10th edition, 2018. URL https://www.wiley.com/en-us/Materials+Science+and+Engineering%{3A}+An+Introduction%{2C}+10th+Edition-p-9781119405498.
- Sha et al. [2015] Zhen-Dong Sha, Qing-Xiang Pei, Zhiwei Ding, Jin-Wu Jiang, and Yong-Wei Zhang. Mechanical properties and fracture behavior of single-layer phosphorene at finite temperatures. Journal of physics D: Applied physics, 48(39):395303, oct 2015. ISSN 0022-3727. doi:10.1088/0022-3727/48/39/395303. URL http://stacks.iop.org/0022-3727/48/i=39/a=395303?key=crossref.757a2fb537d1a95003ef80988e7ac620.
- Liu et al. [2019] Ning Liu, Matthew Becton, Liuyang Zhang, Heng Chen, Xiaowei Zeng, Ramana Pidaparti, and Xianqiao Wang. A coarse-grained model for mechanical behavior of phosphorene sheets. Physical Chemistry Chemical Physics, 21(4):1884–1894, jan 2019. doi:10.1039/c8cp06918b. URL http://dx.doi.org/10.1039/c8cp06918b.
- Daniel et al. [2004] Susan Daniel, Sanjoy Sircar, Jill Gliem, and Manoj K Chaudhury. Ratcheting motion of liquid drops on gradient surfaces. Langmuir: the ACS Journal of Surfaces and Colloids, 20(10):4085–4092, may 2004. doi:10.1021/la036221a. URL http://dx.doi.org/10.1021/la036221a.
- Malvadkar et al. [2010] Niranjan A Malvadkar, Matthew J Hancock, Koray Sekeroglu, Walter J Dressick, and Melik C Demirel. An engineered anisotropic nanofilm with unidirectional wetting properties. Nature Materials, 9(12):1023–1028, dec 2010. doi:10.1038/nmat2864. URL http://dx.doi.org/10.1038/nmat2864.
- Hancock et al. [2012] Matthew J Hancock, Koray Sekeroglu, and Melik C Demirel. Bioinspired directional surfaces for adhesion, wetting and transport. Advanced functional materials, 22(11):2223–2234, jun 2012. doi:10.1002/adfm.201103017. URL http://dx.doi.org/10.1002/adfm.201103017.
- Zambrano et al. [2018] O. A. Zambrano, K. F. Gallardo, D. M. Polania, S. A. Rodríguez, and J. J. Coronado. The role of the counterbody’s oxide on the wear behavior of HSS and hi-cr. Tribology letters, 66(1):1, mar 2018. ISSN 1023-8883. doi:10.1007/s11249-017-0954-1. URL http://link.springer.com/10.1007/s11249-017-0954-1.
- Xia et al. [2012] S Xia, L Ponson, G Ravichandran, and K Bhattacharya. Toughening and asymmetry in peeling of heterogeneous adhesives. Physical Review Letters, 108(19):196101, may 2012. doi:10.1103/PhysRevLett.108.196101. URL http://dx.doi.org/10.1103/{PhysRevLett}.108.196101.
- Hossain et al. [2014] M.Z. Hossain, C.-J. Hsueh, B. Bourdin, and K. Bhattacharya. Effective toughness of heterogeneous media. Journal of the mechanics and physics of solids, 71:15–32, nov 2014. ISSN 00225096. doi:10.1016/j.jmps.2014.06.002. URL https://linkinghub.elsevier.com/retrieve/pii/S0022509614001215.
- Brodnik et al. [2021] N R Brodnik, S Brach, C M Long, G Ravichandran, B Bourdin, K T Faber, and K Bhattacharya. Fracture diodes: directional asymmetry of fracture toughness. Physical Review Letters, 126(2):025503, jan 2021. doi:10.1103/PhysRevLett.126.025503. URL http://dx.doi.org/10.1103/{PhysRevLett}.126.025503.
- Conway et al. [2021] Kaitlynn M. Conway, Cody Kunka, Benjamin C. White, Garrett J. Pataky, and Brad L. Boyce. Increasing fracture toughness via architected porosity. Materials & Design, 205:109696, jul 2021. ISSN 02641275. doi:10.1016/j.matdes.2021.109696. URL https://linkinghub.elsevier.com/retrieve/pii/S0264127521002483.
- Dragoman et al. [2010] D. Dragoman, M. Dragoman, and R. Plana. Graphene-based ultrafast diode. Journal of applied physics, 108(8):084316, oct 2010. ISSN 0021-8979. doi:10.1063/1.3501051. URL http://aip.scitation.org/doi/10.1063/1.3501051.
- Di Bartolomeo [2016] Antonio Di Bartolomeo. Graphene schottky diodes: An experimental review of the rectifying graphene/semiconductor heterojunction. Physics Reports, 606:1–58, jan 2016. ISSN 03701573. doi:10.1016/j.physrep.2015.10.003. URL http://linkinghub.elsevier.com/retrieve/pii/S0370157315004354.
- Wang et al. [2021] Zhenxing Wang, Andreas Hemmetter, Burkay Uzlu, Mohamed Saeed, Ahmed Hamed, Satender Kataria, Renato Negra, Daniel Neumaier, and Max C. Lemme. Graphene in 2D/3D heterostructure diodes for high performance electronics and optoelectronics. Advanced Electronic Materials, 7(7):2001210, jul 2021. ISSN 2199-160X. doi:10.1002/aelm.202001210. URL https://onlinelibrary.wiley.com/doi/10.1002/aelm.202001210.
- Kim et al. [2013b] Hye-Young Kim, Kangho Lee, Niall McEvoy, Chanyoung Yim, and Georg S Duesberg. Chemically modulated graphene diodes. Nano Letters, 13(5):2182–2188, may 2013b. doi:10.1021/nl400674k. URL http://dx.doi.org/10.1021/nl400674k.
- Li et al. [2016] Xiaoqiang Li, Shisheng Lin, Xing Lin, Zhijuan Xu, Peng Wang, Shengjiao Zhang, Huikai Zhong, Wenli Xu, Zhiqian Wu, and Wei Fang. Graphene/h-BN/GaAs sandwich diode as solar cell and photodetector. Optics Express, 24(1):134–145, jan 2016. doi:10.1364/OE.24.000134. URL http://dx.doi.org/10.1364/{OE}.24.000134.
- Wang et al. [2017] Haidong Wang, Shiqian Hu, Koji Takahashi, Xing Zhang, Hiroshi Takamatsu, and Jie Chen. Experimental study of thermal rectification in suspended monolayer graphene. Nature Communications, 8:15843, jun 2017. doi:10.1038/ncomms15843. URL http://dx.doi.org/10.1038/ncomms15843.
- Liu et al. [2021] Fayong Liu, Manoharan Muruganathan, Yu Feng, Shinichi Ogawa, Yukinori Morita, Chunmeng Liu, Jiayu Guo, Marek Schmidt, and Hiroshi Mizuta. Thermal rectification on asymmetric suspended graphene nanomesh devices. Nano Futures, 5(4):045002, dec 2021. ISSN 2399-1984. doi:10.1088/2399-1984/ac36b5. URL https://iopscience.iop.org/article/10.1088/2399-1984/ac36b5.
- Chen et al. [2020] Xue-Kun Chen, Min Pang, Tong Chen, Dan Du, and Ke-Qiu Chen. Thermal rectification in asymmetric graphene/hexagonal boron nitride van der waals heterostructures. ACS Applied Materials & Interfaces, 12(13):15517–15526, apr 2020. doi:10.1021/acsami.9b22498. URL http://dx.doi.org/10.1021/acsami.9b22498.
- Melis et al. [2015] Claudio Melis, Giuliana Barbarino, and Luciano Colombo. Exploiting hydrogenation for thermal rectification in graphene nanoribbons. Physical Review B, 92(24):245408, dec 2015. ISSN 1098-0121. doi:10.1103/PhysRevB.92.245408. URL https://link.aps.org/doi/10.1103/{PhysRevB}.92.245408.
- Wang et al. [2014] Yan Wang, Ajit Vallabhaneni, Jiuning Hu, Bo Qiu, Yong P Chen, and Xiulin Ruan. Phonon lateral confinement enables thermal rectification in asymmetric single-material nanostructures. Nano Letters, 14(2):592–596, feb 2014. doi:10.1021/nl403773f. URL http://dx.doi.org/10.1021/nl403773f.
- Plimpton [1995] Steve Plimpton. Fast parallel algorithms for short-range molecular dynamics. Journal of Computational Physics, 117(1):1–19, mar 1995. ISSN 00219991. doi:10.1006/jcph.1995.1039. URL http://linkinghub.elsevier.com/retrieve/pii/{S002199918571039X}.
- Stuart et al. [2000] Steven J. Stuart, Alan B. Tutein, and Judith A. Harrison. A reactive potential for hydrocarbons with intermolecular interactions. The Journal of Chemical Physics, 112(14):6472–6486, apr 2000. ISSN 0021-9606. doi:10.1063/1.481208. URL http://aip.scitation.org/doi/10.1063/1.481208.
- Shenderova et al. [2000] O. A. Shenderova, D. W. Brenner, A. Omeltchenko, X. Su, and L. H. Yang. Atomistic modeling of the fracture of polycrystalline diamond. Physical Review B, 61(6):3877–3888, feb 2000. ISSN 0163-1829. doi:10.1103/PhysRevB.61.3877. URL https://link.aps.org/doi/10.1103/{PhysRevB}.61.3877.
- Mises [1913] R. v. Mises. Mechanik der festen körper in plastisch-deformablen zustand. Math.-phys. Klasse, 4:582–592, 1913. URL https://eudml.org/doc/58894.
- Stukowski [2010] Alexander Stukowski. Visualization and analysis of atomistic simulation data with OVITO–the open visualization tool. Modelling and Simulation in Materials Science and Engineering, 18(1):015012, jan 2010. ISSN 0965-0393. doi:10.1088/0965-0393/18/1/015012. URL http://stacks.iop.org/0965-0393/18/i=1/a=015012?key=crossref.6895e2c3bb522d1563fb2e2fe9f22789.
- Blees et al. [2015] Melina K Blees, Arthur W Barnard, Peter A Rose, Samantha P Roberts, Kathryn L McGill, Pinshane Y Huang, Alexander R Ruyack, Joshua W Kevek, Bryce Kobrin, David A Muller, and Paul L McEuen. Graphene kirigami. Nature, 524(7564):204–207, aug 2015. doi:10.1038/nature14588. URL http://dx.doi.org/10.1038/nature14588.