Big Three Dragons: Molecular Gas in a Bright Lyman-Break Galaxy at
Abstract
We report ALMA Band 3 observations of CO(6-5), CO(7-6), and [Ci](2-1) in B14-65666 (“Big Three Dragons”), one of the brightest Lyman-Break Galaxies at in the rest-frame ultraviolet continuum, far-infrared continuum, and emission lines of [Oiii] 88 µm and [Cii] 158 µm. CO(6-5), CO(7-6), and [Ci](2-1), whose upper limits on the luminosities are approximately 40 times fainter than the [Cii] luminosity, are all not detected. The / and / ratios are higher than the typical ratios obtained in dusty star-forming galaxies or quasar host galaxies at similar redshifts, and they may suggest a lower gas density in the photodissociated region in B14-65666. By using the (1) [Cii] luminosity, (2) dust mass-to-gas mass ratio, and (3) a dynamical mass estimate, we find that the molecular gas mass () is . This value is consistent with the upper limit inferred from the nondetection of mid- CO and [Ci](2-1). Despite the large uncertauinty in , we estimate a molecular gas-to-stellar mass ratio () of and a gas depletion time () of Myr; these values are broadly consistent with those of other high-redshift galaxies. B14-65666 could be an ancestor of a passive galaxy at if no gas is fueled from outside the galaxy.
1 Introduction
Understanding the properties of molecular gas through cosmic time is an important topic in galaxy formation and evolution, as molecular gas is the fuel for star formation. The molecular gas mass, , is often determined from the luminosity of carbon monoxide (12C16O; hereafter written as simply “CO”; e.g. Bolatto et al. 2013), dust mass (e.g. Magdis et al. 2012), and radiation from cold dust sensitive to dust mass (e.g. Scoville et al. 2016). Based on estimates, previous studies have shown that high-redshift () star-forming galaxies (SFGs) have (1) higher molecular gas-to-stellar mass ratios () and (2) shorter molecular gas depletion times () than local galaxies (e.g. Tacconi et al. 2020).
Low- CO transitions probe the cold and diffuse molecular gas, whereas mid- transitions111Hereafter, we refer to CO() and CO() as the mid- transitions. probe the warm and dense regions of the molecular gas. Based on zoom-in cosmological hydrodynamical simulations implementing radiative transfer calculations, Vallini et al. (2019) have shown that galaxies in the epoch of reionization (EoR; ) have high gas excitation conditions with CO luminosity peaks at an upper rotational level () as a result of their high star-formation surface density and the resulting higher temperature of the giant molecular clouds. These authors show that the sensitivity of the Atacama Large Millimeter/Submillimeter Array (ALMA) telescope is sufficient to detect these mid- CO transitions in a reasonable amount of integration time.
Observations of the low- CO transitions in galaxies in the EoR are challenging because these transitions are redshifted to longer radio wavelengths, where instruments are less sensitive. Furthermore, at high redshift, the cosmic microwave background (CMB) has a significant impact upon the CO line emission (e.g. Sakamoto 1999; Combes et al. 1999; Papadopoulos et al. 2000; Obreschkow et al. 2009; da Cunha et al. 2013; Zhang et al. 2016; Tunnard & Greve 2016). Firstly, the increased CMB heating leads to a greater population of high rotational levels, thereby boosting higher- CO luminosities. Secondly, the CMB serves as a stronger background, particularly at the wavelength of the lower- transitions. As a result, it becomes challenging to observe low- CO compared to the mid- transitions at high redshift. Hence, to efficiently detect the molecular gas component, we target the brighter mid- transitions, which can be observed far more efficiently with sub-/mm facilities.
The [Ci] and [Ci] lines could be more reliable tracers of the bulk of cold gas than mid- and even low- transitions, particularly under certain conditions (e.g. high cosmic ray flux, low metallicity). For example, Weiß et al. (2005); Offner et al. (2014), and Glover et al. (2015) show that [Ci] is optically thin and traces the surfaces of molecular clouds in a range of environments (e.g. Papadopoulos et al. 2018; Shimajiri et al. 2013; Jiao et al. 2019).
To date, CO line observations in the EoR were mainly focused on dusty star-forming galaxies (DSFGs) and quasar host galaxies that both have high IR luminosities ( ) and large SFRs yr-1. Among the DSFGs at , seven sources were detected in the low- CO line ( 1, 2) (Combes et al. 2012; Rawle et al. 2014; Pavesi et al. 2018; Riechers et al. 2013, 2020, 2021; Zavala et al. 2022), and more than 11 sources were detected in the mid- CO line () (Combes et al. 2012; Rawle et al. 2014; Vieira et al. 2013; Riechers et al. 2013, 2017, 2020; Strandet et al. 2016, 2017; Apostolovski et al. 2019; Zavala et al. 2018; Casey et al. 2019; Jin et al. 2019; Jarugula et al. 2021; Vieira et al. 2022; Asboth et al. 2016). Among the quasar host galaxies at , at least eight sources were detected in the low- CO line (Venemans et al. 2017a; Wang et al. 2010, 2011a, 2016; Stefan et al. 2015; Shao et al. 2019), and more than 25 sources were detected in the mid- CO line (e.g. Novak et al. 2019; Venemans et al. 2017a, b; Decarli et al. 2022; Yang et al. 2019; Riechers et al. 2009; Wang et al. 2019; Li et al. 2020; Walter et al. 2003; Carilli & Walter 2013; Wang et al. 2016, 2011b). In contrast, among “normal” SFGs at , only one source was detected in the low- CO line (Pavesi et al. 2019), and two sources were detected in the CO() line (D’Odorico et al. 2018; Vieira et al. 2022).
It is therefore of interest to investigate the nature of the molecular gas in B14-65666 (“Big Three Dragons”222“Big Three Dragons” is a hand in a Mahjong game with triplets or quads of all three dragons.) at . This galaxy shows no clear signs of active galactic nucleus (AGN) activity; nonetheless, it is one of the brightest LBGs at in the rest-frame ultraviolet (UV) continuum, far-infrared (FIR) continuum, and FIR emission lines of [Oiii] 88 µm and [Cii] 158 µm (Bowler et al. 2014; Furusawa et al. 2016; Hashimoto et al. 2019; Sugahara et al. 2021). The large IR and [Cii] luminosities imply the presence of a significant amount of dust and neutral gas, respectively, effectively shielding CO from the UV radiation. Previous studies have also shown that B14-65666 is an example of the highest- starburst galaxies owing to a major merger event (Bowler et al. 2017; Hashimoto et al. 2019). Thus, a detailed study of the molecular gas in B14-65666 may provide information on the connection between mergers, starbursts, the emergence of quasars, and quenching of star formation at high redshift (e.g. Hopkins et al. 2008).
Herein, we present new ALMA Band 3 observations of B14-65666. Our observational setup efficiently covers CO(), CO(), and [Ci] . [Ci] is highly complementary to mid- CO; it could trace the bulk of the cold molecular gas component without the need for low- CO observations.
The rest of this paper is structured as follows. In §2, we introduce the target galaxy, B14-65666. In §3, we describe our ALMA Band 3 data. In §4, we calculate the line luminosities and estimate the molecular gas mass in the galaxy. In §5, we compare B14-65666 with other high- objects in terms of the luminosity ratios and interstellar medium (ISM) properties. §6 presents discussions in the context of and . Finally, §7 presents our conclusions. Throughout this paper, magnitudes are given in the AB system (Oke & Gunn, 1983), and we assume a CDM cosmology with , , , and km s-1 Mpc-1 (Komatsu et al. 2011). The solar luminosity, , is erg s-1. Hereafter, we denote CO(), CO(), and [Ci] as CO(6-5), CO(7-6), and [Ci](2-1), respectively.
2 Our Target: “Big Three Dragons”
| Parameters | Measurements | Ref. |
|---|---|---|
| [] | B17 | |
| [] | H19 | |
| [] | H19 | |
| ( 40 K, ) [] | S21 | |
| ( 80 K, ) [] | S21 | |
| ( 40 K, ) [] | - | |
| ( 80 K, ) [] | - |
Note. — The upper limit is . The total-infrared luminosity, , and FIR luminosity, , are estimated by integrating the modified blackbody radiation at and µm, respectively. Following Sugahara et al. (2021), we consider two combinations of (, ) = (40 K, 2.0) and (80 K, 1.0). B17, H19, and S21 refer to the studies by Bowler et al. 2017, Hashimoto et al. 2019, and Sugahara et al. 2021, respectively.
Table 1 summarizes previous observations of the target. The galaxy was discovered by Bowler et al. (2014) based on wide-field imaging data of the UltraVISTA survey (e.g. McCracken et al. 2012). The galaxy has a UV absolute magnitude of , which is times brighter than the characteristic UV magnitude at , (e.g. Bouwens et al. 2021). Subsequently, a high-angular-resolution image taken with the Hubble Space Telescope (HST) revealed that B14-65666 comprises two spatially distinct clumps in the rest-frame UV, indicating that the target is experiencing a merger event (Bowler et al. 2017).
The spectroscopic redshift of B14-65666 was obtained with the Faint Object Camera and Spectrograph (FOCAS) on Subaru at with Ly (Furusawa et al. 2016). We performed ALMA spectroscopy of [Oiii] 88 µm and [Cii] 158 µm and determined its spectroscopic redshift at (Hashimoto et al. 2019). Notably, Hashimoto et al. (2019) supported the merger interpretation by showing that [Oiii] and [Cii] can be spatially decomposed into two components associated with the two UV clumps that are kinematically separated by km s-1. Furthermore, our team (Hashimoto et al. 2019; Sugahara et al. 2021) and Bowler et al. (2018, 2022) used ALMA to detect the dust continuum emission at 90, 120, and 160 µm with ALMA Band 8, 7, and 6, respectively.
With this large set of multiwavelength line and continuum measurements, B14-65666 has a well-sampled dust spectral energy distribution (SED). With modified blackbody radiation models for the dust continuum radiation, Sugahara et al. (2021) constrained the total-infrared luminosity (; integrated at µm) to be 4.0 and 12.6 with a parameter set of (, ) = (40 K, 2.0) and (80 K, 1.0), respectively, where and are the dust temperature and emissivity index, respectively. In the calculation of , the effect of the CMB is corrected following da Cunha et al. (2013).
3 ALMA Observations and Data Reduction
We performed ALMA Band 3 observations during Sep , 2019, as a Cycle 6 program (ID: 2018.1.01673.S, PI: T. Hashimoto). We used antennas with baseline lengths of m, resulting in a maximum recoverable scale of 6. Four spectral windows were set at central frequencies of 85.00, 86.88, 97.15, and 98.95 GHz, referred to as SPW1, SPW2, SPW3, and SPW4, respectively. The CO(6-5) line was observed in SPW1, and the CO(7-6) and [Ci](2-1) lines were observed in SPW3. Continuum emission was observed in SPW2 and SPW4. The total on-source exposure time was 3.75 hrs. The quasar J1008+0029 was used for complex gain calibration. Two quasars, J0854+2006 and J1037-2934, were used for bandpass calibration. The flux was scaled using J0854+2006 and J1037-2934, yielding an absolute accuracy below 5% in ALMA Band 3.
| Data | Sensitivity | Beam FWHM | BPA |
|---|---|---|---|
| (Jy beam-1) | () | (∘) | |
| without uv-taper | |||
| Continuum | 4.6 | 0.46 0.41 | 61 |
| CO(6-5) | 96 | 0.52 0.43 | 66 |
| CO(7-6) and [Ci](2-1) | 78 | 0.43 0.37 | 66 |
| uv-tapered | |||
| Continuum | 5.3 | 0.82 0.72 | 82 |
| CO(6-5) | 107 | 0.78 0.68 | 78 |
| CO(7-6) and [Ci](2-1) | 93 | 0.78 0.68 | 78 |
Note. — In uv-tapered data, we adopt taper values of , , and for the continuum map, CO(6-5) cube, and CO(7-6) cube, respectively. The cube sensitivity is per 50 km s-1.
The data were reduced and calibrated with the Common Astronomy Software Application (CASA; McMullin et al. 2007) pipeline version 5.6.1-8. By using the tclean task, we produced maps and cubes with a natural weighting to optimize the point-source sensitivity. Table 2 summarizes the resulting resolution and sensitivity of the data.
Continuum maps were created using all channels that were expected to be line-free. The synthesized beam has a size of in the full-width at half-maximum (FWHM) and a positional angle (BPA) of 61∘ with a rms value of 4.6 Jy beam-1. The beam size is smaller than the beam-deconvolved size of the target for the dust continuum and [Cii] emitting region ( in FWHM, see Hashimoto et al. 2019). Therefore, we also created dust continuum maps using a Gaussian taper with a width ranging from to . We adopted a taper value of because the resultant beam size () fully covers the dust continuum emitting region.
The data probe the dust continuum emission at µm. The left panel of Fig. 1 shows the nondetection, and by using the uv-tapered image, we place a upper limit of 15.9 Jy on the continuum flux density. The current data is not deep enough to obtain a meaningful constraint on the dust emissivity index.
As the dust continuum was undetected in ALMA Band 3, we created line cubes without performing continuum subtraction. The cubes were rebinned to a velocity resolution of 50 km s-1. For SPW1 (SPW3) targeting CO(6-5) [CO(7-6) and [Ci](2-1)], we also created a uv-tapered data cube by using a Gaussian taper with a width of (). This cube has a synthesized beam size of () and a typical sensitivity of 107 (93) Jy beam-1. Hereafter, we use the uv-tapered maps and cubes unless otherwise specified.
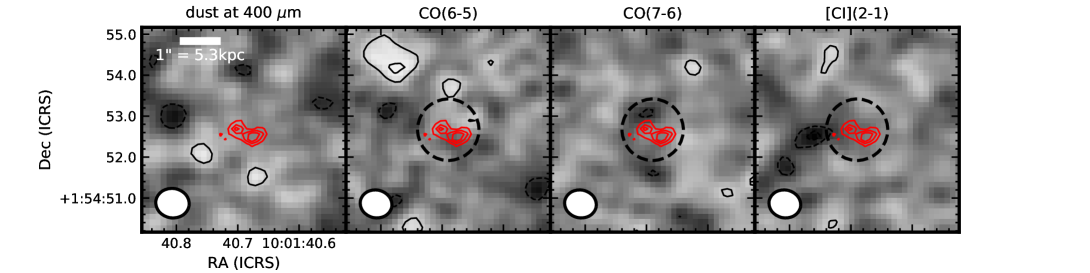
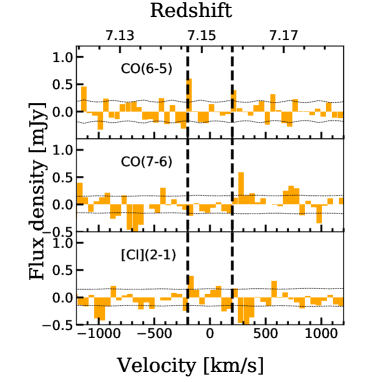
We have searched for the presence of emission lines in the cubes at the position of the target. At , the CO(6-5), CO(7-6), and [Ci](2-1) emission lines are expected to be at observed frequencies of 84.82, 98.95, and 99.28 GHz, respectively. Figure 1 also shows the integrated intensity maps (i.e., moment 0 maps) of CO(6-5), CO(7-6), and [Ci](2-1). In these maps, we integrate the velocity range from to km s-1 with the CASA task immoments, which is comparable to the FWHM of [Oiii] and [Cii] (Hashimoto et al. 2019)333Several studies show that CO(6-5) and [Cii] have similar FWHMs (e.g. Wang et al. 2013, 2016; Strandet et al. 2017; Venemans et al. 2017b; Zavala et al. 2018). . Figure 2 shows the spectra obtained in a -diameter aperture centered on the target, where the large aperture size is adopted to capture possible spatially extended CO emission (Cicone et al. 2021). We conclude that the CO(6-5), CO(7-6), and [Ci](2-1) lines are undetected.
4 Derived Properties
4.1 CO and [Ci] line fluxes
From the integrated intensity maps, we obtain the upper limits on the velocity-integrated flux, , as 0.0581, 0.0546, and 0.0542 Jy km s-1 for CO(6-5), CO(7-6), and [Ci](2-1), respectively. Here we assumed that the size of the CO emitting region should not exceed that of the [Cii] emission, which is a better tracer of more extended and multi-phase gas. To obtain the intrinsic line fluxes, we correct for the impact of the CMB. Following Eq. (32) of da Cunha et al. (2013), the fraction of the intrinsic line flux observed against the CMB is written as
| (1) |
where and represent the intrinsic and observed flux density of the transition of , respectively. K is the CMB temperature at , and is the excitation temperature in units of K. (T) is the Planck function. can be estimated under the assumptions of the local thermal equilibrium (LTE) of molecular clouds and the thermal equilibrium of dust and gas (Goldsmith 2001). In this case, we can assume , where is the gas kinetic temperature. We estimate to be using the dust temperature, K, in the target (Sugahara et al. 2021). In the non-LTE case, depends on a variety of parameters such as ; number density of H2 molecules, ; and number density of CO molecules (da Cunha et al. 2013). Because the number of CO collisions with H2 becomes small at low , the mid- to high- CO transitions with higher critical densities depart from the LTE case. This leads to , and it could lead to as small as 0.1 in the case of K (see Fig. 8 in Combes et al. 1999). In summary, is highly uncertain, ranging from at K.
| Parameters | CO(6-5) | CO(7-6) | [Ci](2-1) |
|---|---|---|---|
| 0.0581 | 0.0546 | 0.0542 | |
| (corr.) | |||
| 2.70 | 2.96 | 2.95 | |
| (corr.) | |||
| 2.55 | 1.77 | 1.74 | |
| (corr.) | |||
| / | 125 | 115 | 115 |
| /(corr.) | |||
| / | 41 | 37 | 37 |
| /(corr.) |
Note. — The limits correspond to . is the line flux in units of Jy km s-1. and are the line luminosities in units of and K km s-1 pc2, respectively. The CMB-corrected values are shown with “(corr.)”, where ranges from 0.1 to 0.9 (see the main text).
4.2 Upper limits on CO and [Ci] line luminosities
We obtain the upper limits on two types of line luminosities (Solomon et al. 1992; Carilli & Walter 2013), which are summarized in Table 3. The first one, in units of , is written as
| (2) |
where is the velocity-integrated flux in units of Jy km s-1, is the luminosity distance in Mpc, and is the observed frequency in GHz. The second one, , corresponds to the area-integrated brightness in units of K km s-1 pc2, and it is written as
| (3) |
With (Table 3), the upper limits on () are , , and (, , and K km s-1 pc2) for CO(6-5), CO(7-6), and [Ci](2-1), respectively.
4.3 Molecular gas mass estimates
We estimate the molecular gas mass of B14-65666. In light of the rich dataset, we adopt five techniques as summarized in Table 4.
4.3.1 Estimates with CO(6-5) and CO(7-6)
The molecular gas mass is estimated with CO lines as
| (4) |
where is the CO-to-H2 conversion factor in units of (K km s-1)-1, and is the excitation correction factor defined as
| (5) |
We use Eq. (19) of Narayanan & Krumholz (2014), who have shown that the CO excitation ladders can be parametrized with based on simulations of disc galaxies combined with CO line radiative transfer calculations. With yr-1 kpc-2 obtained for the target444The target has SFR yr-1 and the [Oiii] beam-deconvolved size of kpc2 in FWHM (Hashimoto et al. 2019). The value is calculated as , where is the half-light radius., and . With the upper limit on the CO(7-6) luminosity (Table 3), we obtain K km s-1 pc2 ().
Previous observational studies (e.g. Leroy et al. 2011; Shi et al. 2016) as well as theoretical ones (e.g. Wolfire et al. 2010; Narayanan et al. 2012) show that increases at lower gas-phase metallicity as a result of increased CO photodissociation. In this study, we adopt the conversion factor of Tacconi et al. (2018) (their Eq. (2)) that is a function of the gas-phase metallicity. The gas-phase metallicity of B14-65666 is estimated to be based on SED fits by taking into account the multiwavelength data ranging from rest-frame UV to FIR (Hashimoto et al. 2019). With a broad range of (i.e., 12+log(O/H) = ), (K km s-1 pc2)-1.
With (K km s-1 pc2)-1 and the upper limit on , we estimate the molecular gas mass to be (). With , the upper limit becomes . Similarly, we obtain the upper limit of from CO(6-5).
4.3.2 Estimate with [Ci](2-1)
The neutral carbon mass, , can be obtained from the [Ci] luminosity and . We estimate following Weiß et al. (2003) as
| (6) |
where is the [Ci] partition function, and 23.6 K and 62.5 K is the temperature of each transition from the ground state. By using at K and the CMB-corrected luminosity of [Ci](2-1), we obtain (). Assuming the abundance ratio of [Ci]/[H2] as obtained in main-sequence galaxies (Valentino et al. 2018), the [Ci](2-1)-based molecular gas mass is (), where the contribution of helium is included. Heintz & Watson (2020) have revealed that the mass conversion factor of the [Ci](1-0) transition, , depends on the metallicity based on observations of [Ci]()555 refers to the total angular momentum quantum number for this transition. absorption lines in the rest-frame UV toward a sample of gamma-ray burst (GRB) and quasar absorption systems at . becomes approximately 10 times higher at than at . If we assume that the mass conversion factor of [Ci](2-1) similarly changes with metallicity, our upper limits can be higher by a factor of 10, () (Table 4).
4.3.3 Estimate with [Cii] 158 µm
The [Cii] 158 µm line can also be used to probe the molecular gas mass (Zanella et al. 2018; Madden et al. 2020; Dessauges-Zavadsky et al. 2020 and references therein). We use the conversion factor of Madden et al. (2020) (see their Eq. (5)) that is appropriate for metal-poor galaxies.
We apply two corrections to the [Cii] luminosity. First, we remove the [Cii] contribution originating from the Hii region, although it becomes negligible in galaxies with, for example, low- (e.g. Croxall et al. 2017). From the metallicity of the target and Fig. 9 of Cormier et al. (2019), we estimate the contribution from the Hii region to be %. Second, we correct for the CMB impact to [Cii]. Based on semi-analytical model of galaxy formation combined with photoionization modelling, Lagache et al. (2018) have shown that the [Cii] luminosity can be reduced by 0.3 dex () at (see their Figure 4) in the case of a photodissociated region (PDR) with the hydrogen nuclei density of log((H)) irradiated by the incident FUV radiation field of , where is the Habing Field in unit, erg cm-2 s-1 (Habing 1968). These PDR parameters are similar to those obtained in DSFGs (e.g. Wardlow et al. 2017), and are not improbable for B14-65666. Similarly, based on the cosmological hydrodynamic simulations combined with radiative transfer calculations, Vallini et al. (2015) have also modeled the [Cii] emission at taking the CMB effect into account. These authors find that the [Cii] emission from the PDR is not severely impacted by the CMB effect, only up to 20% (see similar results in Kohandel et al. 2019). Given the uncertainty, we assume in B14-65666. The intrinsic [Cii] luminosity from the molecular gas is . We thus obtain , where we include the helium contribution and take into account a standard deviation of 0.14 dex in the relation.
4.3.4 Estimate with dust continuum
We estimate the gas mass based on and the metallicity-dependent dust-to-gas ratio (DGR; Rémy-Ruyer et al. 2014; Li et al. 2019). With the prescription of Li et al. (2019) derived from cosmological hydrodynamical simulations implementing the process of dust production, growth, and destruction (see their Eq. (9)), we obtain DGR at the metallicity of the target. Combined with the dust mass of the target, log() (Sugahara et al. 2021), we estimate the (molecular + atomic) gas mass to be . If we assume that gas is predominantly in the molecular phase (Riechers et al. 2013), this can be regarded as the molecular gas mass.
4.3.5 Upper limit with dynamical mass
We calculate an upper limit on from the dynamical mass, , subtracted by the stellar mass contribution. Hashimoto et al. (2019) obtained of two individual clumps of B14-65666 based on the line width and beam-deconvolved size of [Cii] 158 µm under the assumption of the virial theorem. The dynamical mass of the whole system is estimated to be , where the error only considers the measurement uncertainties. With a stellar mass obtained from SED fitting ( ; Hashimoto et al. 2019), we obtain a conservative upper limit on to be .
To summarize, by combining the estimates from the [Cii] luminosity, dust mass, and dynamical mass, we obtain , which is consistent with the upper limits on inferred from the nondetections of mid- CO and [Ci](2-1). Although the Band 3 observations were conducted to constrain in B14-65666, we note that the tightest constraint on comes from the previous observations of dust and [Cii] 158 µm, not from mid- CO or [Ci](2-1), due to the insufficient sensitivity of the Band 3 observations. Future deeper Band 3 observations are crucial to better constrain with mid- CO or [Ci](2-1).
| Method | |
|---|---|
| CO(6-5) | |
| CO(7-6) | |
| [Ci](2-1) | |
| [Cii] 158 µm | |
| dust | |
| dynamical mass |
Note. — The estimates based on mid- CO and [Ci](2-1) are upper limits, where the values in the parenthesis reflect the uncertainty in the CMB correction. The estimate based on the dynamical mass () provides the upper limit.
5 Results
5.1 Luminosity comparisons
5.1.1 mid- CO and [Ci] vs. far-infrared luminosity
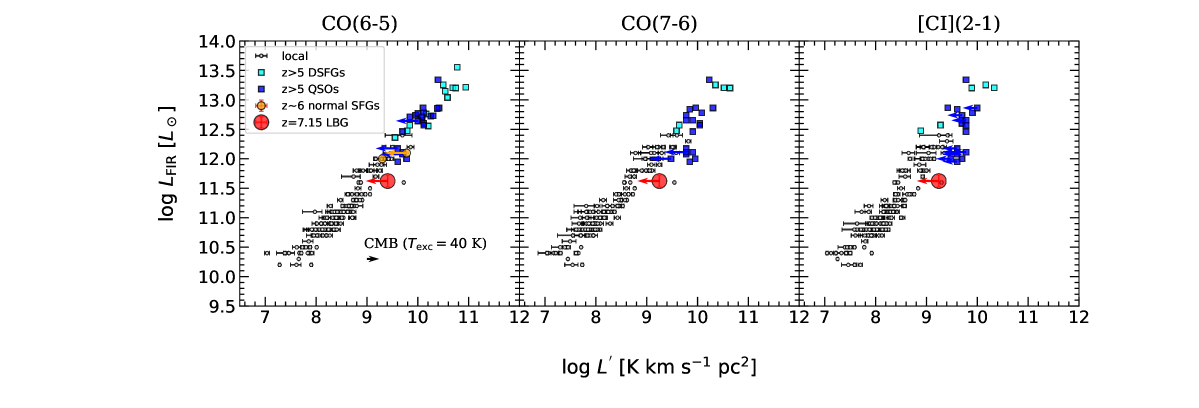
In the local universe, a compiled sample of SFGs, AGNs, and U/LIRGs observed by Herschel/SPIRE shows a positive correlation between the mid- CO and the [Ci](2-1) line luminosities and FIR luminosity, (e.g. Kamenetzky et al. 2016). Figure 3 shows a comparison of B14-65666 with the local objects (Kamenetzky et al. 2016). The FIR luminosity of B14-65666 is calculated by integrating the modified blackbody radiation at µm, where the CMB effect is corrected following da Cunha et al. (2013) (Table 1). DSFGs (Jarugula et al. 2021; Riechers et al. 2013; Zavala et al. 2018; Casey et al. 2019; Vieira et al. 2022; Apostolovski et al. 2019; Riechers et al. 2017, 2020; Combes et al. 2012), quasar host galaxies (Novak et al. 2019; Venemans et al. 2017a, b; Decarli et al. 2022; Yang et al. 2019; Riechers et al. 2009; Wang et al. 2019), as well as normal SFGs (D’Odorico et al. 2018; Vieira et al. 2022) are also plotted, where the lensing magnification is corrected when necessary. Note that the number of data points differs in each transition. Although we show the line luminosities not corrected for the impact of the CMB, it shifts the line luminosities toward higher values by 0.2 dex at K at , as indicated by a black arrow in the left panel. Figure 3 shows that high- sources also seem to follow the correlations. This might imply that the CMB effect may not be severe even at high redshift, although this could be due to a bias towards bright DSFGs and quasar host galaxies with higher .
The data points of B14-65666 for the first time place constraints on the line luminosities at log(/) at . Nevertheless, the upper limits are loose at a given , especially when the CMB impact is taken into account. This indicates that the nondetection of the lines can be explained by the insufficient sensitivity of the observations.
5.1.2 mid- CO and [Ci] vs. [Cii] 158 µm luminosity
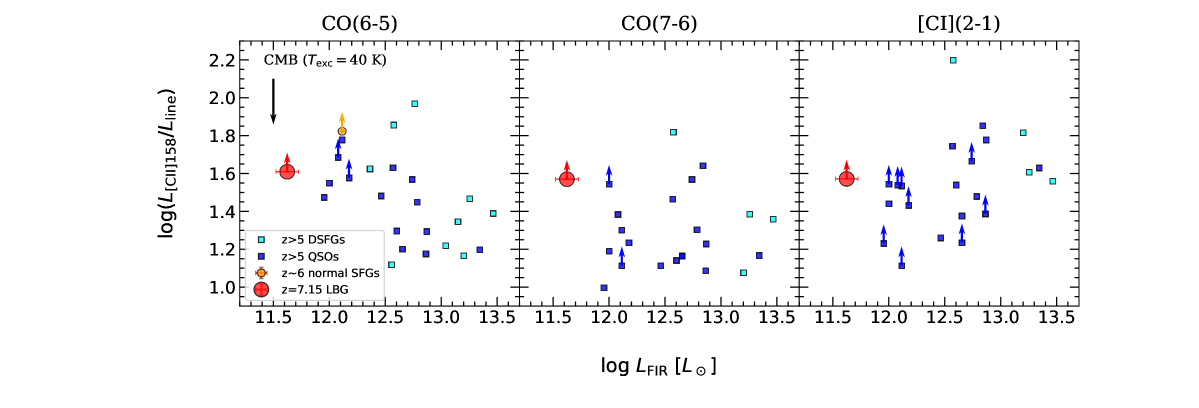
Figure 4 shows plots of /, /, and / against . It also shows plots of DSFGs, quasar host galaxies, and normal SFGs at , with the luminosity measurements as in Fig. 3. The luminosities are before the CMB correction.
B14-65666 has line luminosity ratios (). If we focus on /, the lower limit is three times higher than the predicted value of for a simulated galaxy at in Vallini et al. (2019), namely, “Althæa,” for which , SFR yr-1, and . B14-65666 has similar SFR and metallicity values; however, its stellar mass is approximately one order of magnitude lower than that of Althæa. Although only five (three) objects have / (/) measurements higher than B14-65666, its interpretation is complicated owing to the large uncertainty in . If B14-65666 has low and/or gas temperature compared with those of DSFGs or quasar host galaxies at similar redshifts, in B14-65666 becomes small, making the lower limits of B14-65666 more consistent with the typical values in high- DSFGs and quasar host galaxies. Because a large fraction of the data points in Figure 4 comes from quasar host galaxies, the difficulty in measuring their stellar mass, size, and SFR surface densities also prevents us to further examine the physical origins of the higher luminosity ratios in B14-65666 than other EoR sources. The situation will be improved by the James Webb Space Telescope that provides these measurements in quasar host galaxies.
In summary, the current data is insufficient to examine the difference in the CMB-corrected in B14-65666 and other high- objects. The results also imply that care must be taken when comparing the luminosity ratios of galaxies in the EoR.
5.2 PDR modelling
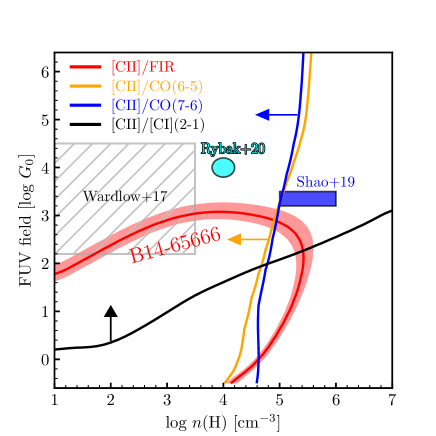
The luminosity ratios are useful to examine properties of the interstellar medium (ISM: e.g. Kaufman et al. 2006; Pound & Wolfire 2008), although the impact of the CMB makes the interpretation complicated, as stated in §5.1.2. The / luminosity ratio is sensitive to the heating source of the ISM (Meijerink et al. 2007). The high ratio, , excludes the possibility that the lines are heated by the X-ray dominated regions, where / is expected. We thus compare the line ratios of B14-65666 to the model predictions of PDR Toolbox (version wk2020) to place constraints on the physical properties of the PDRs. The model assumes a geometry of infinite plane slabs of hydrogen characterized by the hydrogen nuclei density, (H), and the strength of the incident FUV radiation field, , normalized to the Habing Field in units of erg cm-2 s-1. In a more realistic geometry of spherical clouds, the optically thin emission would be detected from both the front and back sides of the cloud, whereas the optically thick emission would be detected only from the front side (Yang et al. 2019). We therefore divide the luminosities of optically thin emission by a factor of two. We also assume that the [Cii] contribution from the PDR is 70% (§4.3.3). We adopt the line ratios before the correction of the CMB and discuss its impact later.
In Figure 5, the overlapped region of the four luminosity ratios is log((H)/cm-3) with a moderate FUV radiation field . The high / and / ratios exclude the possibility of log((H)/cm-3). The strength of the incident FUV radiation field in B14-65666 is comparable to those in local (U)LIRGs and high- DSFGs that have , as indicated by the grey box in Fig. 5 (Hughes et al. 2017; Wardlow et al. 2017), but lower than that of a DSFG, G09.83808, with a FUV radiation field (cyan ellipse, Rybak et al. 2020). The gas density in B14-65666 is barely constrained, although is lower than that obtained in some quasar host galaxies (blue square: Shao et al. 2019).
The CMB effect makes the intrinsic /, /, and / ratios lower because [Cii] is less affected by the CMB compared to CO(6-5), CO(7-6), and [Ci]. The net effect is that the constraints on (H) and become weaker. The high luminosity ratios () (Fig. 4) may imply that the nondetection of the lines in B14-65666 could be partly due to its low (H) compared to that of other high- objects; however, the CMB effect prevents us from obtaining a conclusion.
5.3 Gas fractions and depletion timescales
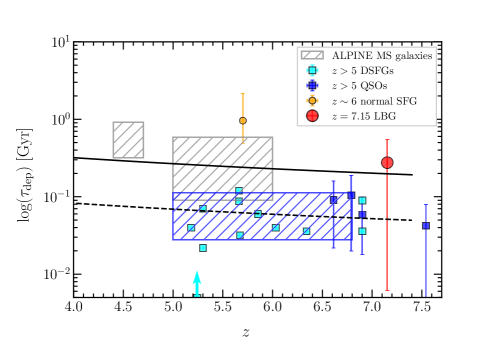
Despite the large uncertainty in (§4.3), we examine two physical quantities related with the molecular gas. The first one is the gas depletion time, . With and SFR yr-1 from SED fitting (Hashimoto et al. 2019), we obtain Myr. The second one is the molecular gas-to-stellar mass ratio, . With and the stellar mass obtained from SED fitting (Hashimoto et al. 2019), , we obtain .
The left panel in Fig. 6 shows a comparison of of B14-65666 with other high- objects shown in Fig. 3 when the quantities are available. For the 12 data points of DSFGs, we adopt in the literatures if available. If not, we compute them from and SFRs. For the 10 quasar host galaxies in Decarli et al. (2022), the width of the box plot corresponds to their redshift range, whereas the height corresponds to the 84 percentile of . We also individually plot the quasar (Novak et al. 2019) and three quasars (Venemans et al. 2017b), where values are computed based on the combinations of CO-based and SFR. We also plot normal SFGs on the main-sequence at (Dessauges-Zavadsky et al. 2020) and an individual value of the LBG, HZ10 (Pavesi et al. 2019). From the figure, we find that B14-65666 is consistent with other high- sources and the extrapolations of the scaling relation in Tacconi et al. (2020) (black lines).
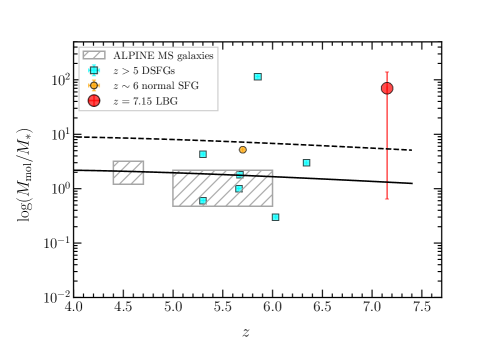
The right panel in Fig. 6 shows a comparison of . In DSFGs, the values are taken from the literatures if available. If not, we compute them from the stellar and gas mass estimates. We do not include quasar host galaxies because their stellar masses are not well constrained. Again, B14-65666 is consistent with other high- sources and the extrapolations of the scaling relation in Tacconi et al. (2020).
6 Discussion
We obtain of 2.5 and 550 Myr in the case of 0.05 and 11 , respectively. In the case of 550 (2.5) Myr, the galaxy will consume the molecular gas as early as 4.5 (7), if the galaxy is not fueled by further accretion, whose final stellar mass is approximately () . This implies that B14-65666 can evolve into a passive galaxy at . To further examine this hypothesis, we compare the volume number density of galaxies like B14-65666 with that of passive galaxies. The number density of galaxies like B14-65666 () is Mpc-3 based on the bright-end of the UV luminosity function at (Bowler et al. 2017; Harikane et al. 2022). The observed number density of passive galaxies was recently compiled by Valentino et al. (2020); it is Mpc-3 at . These authors have also derived the number density by analyzing the Illustris TNG cosmological simulation public release data (e.g. Springel et al. 2018). In the simulation, the volume number density of passive galaxies is estimated to be Mpc-3 at . A broad agreement in the number densities may support the idea that moderate starburst galaxies at , such as B14-65666 could be ancestors of passive galaxies (c.f., Valentino et al. 2020).
7 Conclusion
We have presented results of ALMA Band 3 observations of CO(6-5), CO(7-6), and [Ci](2-1) in B14-65666 (“Big Three Dragons”). The target was previously detected in Ly, [Oiii] 88 µm, [Cii] 158 µm, and the dust continuum in the EoR (Hashimoto et al. 2019), and it is one of the brightest LBGs at without gravitational lensing (Table 1).
- •
-
•
By comparing the line luminosity upper limits with sources such as DSFGs and quasar host galaxies, we find that the nondetections are likely due to (1) the insufficient sensitivity of the observations (Fig. 3) or (2) possibly low hydrogen gas density in the PDR (Fig. 4), although the uncertainty in the CMB impact makes the interpretation complicated.
-
•
We have estimated the molecular gas mass, , of B14-65666 based on five techniques: (1) mid- CO luminosity, (2) [Ci](2-1) luminosity, (3) [Cii] 158 µm luminosity, (4) dust mass and a DGR, and (5) dynamical mass. From three methods, namely, [Cii], dust mass, and dynamical mass, we obtain , which is consistent with its upper limit inferred from the nondetection of mid- CO and [Ci](2-1) (Table 4).
-
•
By comparing the observed luminosities to the model predictions of the PDR, we find that B14-65666 has log((H)/cm-3) with a moderate FUV radiation field of . These values are broadly consistent with those obtained in local (U)LIRGs and high- DSFGs/quasar host galaxies, although the constraints on (H) and can be weaker if the CMB effect is significant (Fig. 5).
-
•
We estimate a molecular gas-to-stellar mass ratio () of and a gas depletion time () of Myr; these values are consistent with those of other high- objects and the extrapolations of the scaling relations to (Fig. 6).
-
•
If the galaxy is not fueled by further accretion, we conjecture that B14-65666 could be an ancestor of passive galaxies; this is supported by the broad agreement of the number volume density of galaxies like B14-65666 and passive galaxies.
References
- Apostolovski et al. (2019) Apostolovski, Y., Aravena, M., Anguita, T., et al. 2019, A&A, 628, A23, doi: 10.1051/0004-6361/201935308
- Asboth et al. (2016) Asboth, V., Conley, A., Sayers, J., et al. 2016, MNRAS, 462, 1989, doi: 10.1093/mnras/stw1769
- Bolatto et al. (2013) Bolatto, A. D., Wolfire, M., & Leroy, A. K. 2013, ARA&A, 51, 207, doi: 10.1146/annurev-astro-082812-140944
- Bouwens et al. (2021) Bouwens, R. J., Oesch, P. A., Stefanon, M., et al. 2021, AJ, 162, 47, doi: 10.3847/1538-3881/abf83e
- Bowler et al. (2018) Bowler, R. A. A., Bourne, N., Dunlop, J. S., McLure, R. M., & McLeod, D. J. 2018, ArXiv e-prints. https://arxiv.org/abs/1802.05720
- Bowler et al. (2022) Bowler, R. A. A., Cullen, F., McLure, R. J., Dunlop, J. S., & Avison, A. 2022, MNRAS, 510, 5088, doi: 10.1093/mnras/stab3744
- Bowler et al. (2017) Bowler, R. A. A., Dunlop, J. S., McLure, R. J., & McLeod, D. J. 2017, MNRAS, 466, 3612, doi: 10.1093/mnras/stw3296
- Bowler et al. (2014) Bowler, R. A. A., Dunlop, J. S., McLure, R. J., et al. 2014, MNRAS, 440, 2810, doi: 10.1093/mnras/stu449
- Carilli & Walter (2013) Carilli, C. L., & Walter, F. 2013, ARA&A, 51, 105, doi: 10.1146/annurev-astro-082812-140953
- Casey et al. (2019) Casey, C. M., Zavala, J. A., Aravena, M., et al. 2019, ApJ, 887, 55, doi: 10.3847/1538-4357/ab52ff
- Cicone et al. (2021) Cicone, C., Mainieri, V., Circosta, C., et al. 2021, A&A, 654, L8, doi: 10.1051/0004-6361/202141611
- Combes et al. (1999) Combes, F., Maoli, R., & Omont, A. 1999, A&A, 345, 369. https://arxiv.org/abs/astro-ph/9902286
- Combes et al. (2012) Combes, F., Rex, M., Rawle, T. D., et al. 2012, A&A, 538, L4, doi: 10.1051/0004-6361/201118750
- Cormier et al. (2019) Cormier, D., Abel, N. P., Hony, S., et al. 2019, A&A, 626, A23, doi: 10.1051/0004-6361/201834457
- Croxall et al. (2017) Croxall, K. V., Smith, J. D., Pellegrini, E., et al. 2017, ApJ, 845, 96, doi: 10.3847/1538-4357/aa8035
- da Cunha et al. (2013) da Cunha, E., Groves, B., Walter, F., et al. 2013, ApJ, 766, 13, doi: 10.1088/0004-637X/766/1/13
- Decarli et al. (2022) Decarli, R., Pensabene, A., Venemans, B., et al. 2022, A&A, 662, A60, doi: 10.1051/0004-6361/202142871
- Dessauges-Zavadsky et al. (2020) Dessauges-Zavadsky, M., Ginolfi, M., Pozzi, F., et al. 2020, A&A, 643, A5, doi: 10.1051/0004-6361/202038231
- D’Odorico et al. (2018) D’Odorico, V., Feruglio, C., Ferrara, A., et al. 2018, ApJ, 863, L29, doi: 10.3847/2041-8213/aad7b7
- Furusawa et al. (2016) Furusawa, H., Kashikawa, N., Kobayashi, M. A. R., et al. 2016, ApJ, 822, 46, doi: 10.3847/0004-637X/822/1/46
- Glover et al. (2015) Glover, S. C. O., Clark, P. C., Micic, M., & Molina, F. 2015, MNRAS, 448, 1607, doi: 10.1093/mnras/stu2699
- Goldsmith (2001) Goldsmith, P. F. 2001, ApJ, 557, 736, doi: 10.1086/322255
- Habing (1968) Habing, H. J. 1968, Bull. Astron. Inst. Netherlands, 19, 421
- Harikane et al. (2022) Harikane, Y., Ono, Y., Ouchi, M., et al. 2022, ApJS, 259, 20, doi: 10.3847/1538-4365/ac3dfc
- Hashimoto et al. (2019) Hashimoto, T., Inoue, A. K., Mawatari, K., et al. 2019, PASJ, 71, 71, doi: 10.1093/pasj/psz049
- Heintz & Watson (2020) Heintz, K. E., & Watson, D. 2020, ApJ, 889, L7, doi: 10.3847/2041-8213/ab6733
- Hopkins et al. (2008) Hopkins, P. F., Hernquist, L., Cox, T. J., & Kereš, D. 2008, ApJS, 175, 356, doi: 10.1086/524362
- Hughes et al. (2017) Hughes, T. M., Ibar, E., Villanueva, V., et al. 2017, A&A, 602, A49, doi: 10.1051/0004-6361/201629588
- Jarugula et al. (2021) Jarugula, S., Vieira, J. D., Weiss, A., et al. 2021, ApJ, 921, 97, doi: 10.3847/1538-4357/ac21db
- Jiao et al. (2019) Jiao, Q., Zhao, Y., Lu, N., et al. 2019, ApJ, 880, 133, doi: 10.3847/1538-4357/ab29ed
- Jin et al. (2019) Jin, S., Daddi, E., Magdis, G. E., et al. 2019, ApJ, 887, 144, doi: 10.3847/1538-4357/ab55d6
- Kaasinen et al. (2020) Kaasinen, M., Walter, F., Novak, M., et al. 2020, ApJ, 899, 37, doi: 10.3847/1538-4357/aba438
- Kamenetzky et al. (2016) Kamenetzky, J., Rangwala, N., Glenn, J., Maloney, P. R., & Conley, A. 2016, ApJ, 829, 93, doi: 10.3847/0004-637X/829/2/93
- Kaufman et al. (2006) Kaufman, M. J., Wolfire, M. G., & Hollenbach, D. J. 2006, ApJ, 644, 283, doi: 10.1086/503596
- Kohandel et al. (2019) Kohandel, M., Pallottini, A., Ferrara, A., et al. 2019, MNRAS, 487, 3007, doi: 10.1093/mnras/stz1486
- Komatsu et al. (2011) Komatsu, E., Smith, K. M., Dunkley, J., et al. 2011, ApJS, 192, 18, doi: 10.1088/0067-0049/192/2/18
- Lagache et al. (2018) Lagache, G., Cousin, M., & Chatzikos, M. 2018, A&A, 609, A130, doi: 10.1051/0004-6361/201732019
- Leroy et al. (2011) Leroy, A. K., Bolatto, A., Gordon, K., et al. 2011, ApJ, 737, 12, doi: 10.1088/0004-637X/737/1/12
- Li et al. (2020) Li, J., Wang, R., Riechers, D., et al. 2020, ApJ, 889, 162, doi: 10.3847/1538-4357/ab65fa
- Li et al. (2019) Li, Q., Narayanan, D., & Davé, R. 2019, MNRAS, 490, 1425, doi: 10.1093/mnras/stz2684
- Madden et al. (2020) Madden, S. C., Cormier, D., Hony, S., et al. 2020, A&A, 643, A141, doi: 10.1051/0004-6361/202038860
- Magdis et al. (2012) Magdis, G. E., Daddi, E., Béthermin, M., et al. 2012, ApJ, 760, 6, doi: 10.1088/0004-637X/760/1/6
- McCracken et al. (2012) McCracken, H. J., Milvang-Jensen, B., Dunlop, J., et al. 2012, A&A, 544, A156, doi: 10.1051/0004-6361/201219507
- McMullin et al. (2007) McMullin, J. P., Waters, B., Schiebel, D., Young, W., & Golap, K. 2007, in Astronomical Society of the Pacific Conference Series, Vol. 376, Astronomical Data Analysis Software and Systems XVI, ed. R. A. Shaw, F. Hill, & D. J. Bell, 127
- Meijerink et al. (2007) Meijerink, R., Spaans, M., & Israel, F. P. 2007, A&A, 461, 793, doi: 10.1051/0004-6361:20066130
- Narayanan & Krumholz (2014) Narayanan, D., & Krumholz, M. R. 2014, MNRAS, 442, 1411, doi: 10.1093/mnras/stu834
- Narayanan et al. (2012) Narayanan, D., Krumholz, M. R., Ostriker, E. C., & Hernquist, L. 2012, MNRAS, 421, 3127, doi: 10.1111/j.1365-2966.2012.20536.x
- Novak et al. (2019) Novak, M., Bañados, E., Decarli, R., et al. 2019, ApJ, 881, 63, doi: 10.3847/1538-4357/ab2beb
- Obreschkow et al. (2009) Obreschkow, D., Heywood, I., Klöckner, H. R., & Rawlings, S. 2009, ApJ, 702, 1321, doi: 10.1088/0004-637X/702/2/1321
- Offner et al. (2014) Offner, S. S. R., Bisbas, T. G., Bell, T. A., & Viti, S. 2014, MNRAS, 440, L81, doi: 10.1093/mnrasl/slu013
- Oke & Gunn (1983) Oke, J. B., & Gunn, J. E. 1983, ApJ, 266, 713, doi: 10.1086/160817
- Papadopoulos et al. (2018) Papadopoulos, P. P., Bisbas, T. G., & Zhang, Z.-Y. 2018, MNRAS, 478, 1716, doi: 10.1093/mnras/sty1077
- Papadopoulos et al. (2000) Papadopoulos, P. P., Röttgering, H. J. A., van der Werf, P. P., et al. 2000, ApJ, 528, 626, doi: 10.1086/308215
- Pavesi et al. (2019) Pavesi, R., Riechers, D. A., Faisst, A. L., Stacey, G. J., & Capak, P. L. 2019, ApJ, 882, 168, doi: 10.3847/1538-4357/ab3a46
- Pavesi et al. (2018) Pavesi, R., Sharon, C. E., Riechers, D. A., et al. 2018, ApJ, 864, 49, doi: 10.3847/1538-4357/aacb79
- Pound & Wolfire (2008) Pound, M. W., & Wolfire, M. G. 2008, in Astronomical Society of the Pacific Conference Series, Vol. 394, Astronomical Data Analysis Software and Systems XVII, ed. R. W. Argyle, P. S. Bunclark, & J. R. Lewis, 654
- Rawle et al. (2014) Rawle, T. D., Egami, E., Bussmann, R. S., et al. 2014, ApJ, 783, 59, doi: 10.1088/0004-637X/783/1/59
- Rémy-Ruyer et al. (2014) Rémy-Ruyer, A., Madden, S. C., Galliano, F., et al. 2014, A&A, 563, A31, doi: 10.1051/0004-6361/201322803
- Riechers et al. (2009) Riechers, D. A., Walter, F., Bertoldi, F., et al. 2009, ApJ, 703, 1338, doi: 10.1088/0004-637X/703/2/1338
- Riechers et al. (2013) Riechers, D. A., Bradford, C. M., Clements, D. L., et al. 2013, Nature, 496, 329, doi: 10.1038/nature12050
- Riechers et al. (2017) Riechers, D. A., Leung, T. K. D., Ivison, R. J., et al. 2017, ApJ, 850, 1, doi: 10.3847/1538-4357/aa8ccf
- Riechers et al. (2020) Riechers, D. A., Hodge, J. A., Pavesi, R., et al. 2020, ApJ, 895, 81, doi: 10.3847/1538-4357/ab8c48
- Riechers et al. (2021) Riechers, D. A., Nayyeri, H., Burgarella, D., et al. 2021, ApJ, 907, 62, doi: 10.3847/1538-4357/abcf2e
- Rybak et al. (2020) Rybak, M., Zavala, J. A., Hodge, J. A., Casey, C. M., & Werf, P. v. d. 2020, ApJ, 889, L11, doi: 10.3847/2041-8213/ab63de
- Sakamoto (1999) Sakamoto, S. 1999, ApJ, 523, 701, doi: 10.1086/307741
- Scoville et al. (2016) Scoville, N., Sheth, K., Aussel, H., et al. 2016, ApJ, 820, 83, doi: 10.3847/0004-637X/820/2/83
- Shao et al. (2019) Shao, Y., Wang, R., Carilli, C. L., et al. 2019, ApJ, 876, 99, doi: 10.3847/1538-4357/ab133d
- Shi et al. (2016) Shi, Y., Wang, J., Zhang, Z.-Y., et al. 2016, Nature Communications, 7, 13789, doi: 10.1038/ncomms13789
- Shimajiri et al. (2013) Shimajiri, Y., Sakai, T., Tsukagoshi, T., et al. 2013, ApJ, 774, L20, doi: 10.1088/2041-8205/774/2/L20
- Solomon et al. (1992) Solomon, P. M., Downes, D., & Radford, S. J. E. 1992, ApJ, 398, L29, doi: 10.1086/186569
- Springel et al. (2018) Springel, V., Pakmor, R., Pillepich, A., et al. 2018, MNRAS, 475, 676, doi: 10.1093/mnras/stx3304
- Stefan et al. (2015) Stefan, I. I., Carilli, C. L., Wagg, J., et al. 2015, MNRAS, 451, 1713, doi: 10.1093/mnras/stv1108
- Strandet et al. (2016) Strandet, M. L., Weiss, A., Vieira, J. D., et al. 2016, ApJ, 822, 80, doi: 10.3847/0004-637X/822/2/80
- Strandet et al. (2017) Strandet, M. L., Weiss, A., De Breuck, C., et al. 2017, ApJ, 842, L15, doi: 10.3847/2041-8213/aa74b0
- Sugahara et al. (2021) Sugahara, Y., Inoue, A. K., Hashimoto, T., et al. 2021, ApJ, 923, 5, doi: 10.3847/1538-4357/ac2a36
- Tacconi et al. (2020) Tacconi, L. J., Genzel, R., & Sternberg, A. 2020, ARA&A, 58, 157, doi: 10.1146/annurev-astro-082812-141034
- Tacconi et al. (2018) Tacconi, L. J., Genzel, R., Saintonge, A., et al. 2018, ApJ, 853, 179, doi: 10.3847/1538-4357/aaa4b4
- Tunnard & Greve (2016) Tunnard, R., & Greve, T. R. 2016, ApJ, 819, 161, doi: 10.3847/0004-637X/819/2/161
- Valentino et al. (2018) Valentino, F., Magdis, G. E., Daddi, E., et al. 2018, ApJ, 869, 27, doi: 10.3847/1538-4357/aaeb88
- Valentino et al. (2020) Valentino, F., Tanaka, M., Davidzon, I., et al. 2020, ApJ, 889, 93, doi: 10.3847/1538-4357/ab64dc
- Vallini et al. (2015) Vallini, L., Gallerani, S., Ferrara, A., Pallottini, A., & Yue, B. 2015, ApJ, 813, 36, doi: 10.1088/0004-637X/813/1/36
- Vallini et al. (2019) Vallini, L., Tielens, A. G. G. M., Pallottini, A., et al. 2019, MNRAS, 490, 4502, doi: 10.1093/mnras/stz2837
- Venemans et al. (2017a) Venemans, B. P., Walter, F., Decarli, R., et al. 2017a, ApJ, 837, 146, doi: 10.3847/1538-4357/aa62ac
- Venemans et al. (2017b) —. 2017b, ApJ, 845, 154, doi: 10.3847/1538-4357/aa81cb
- Vieira et al. (2022) Vieira, D., Riechers, D. A., Pavesi, R., et al. 2022, ApJ, 925, 174, doi: 10.3847/1538-4357/ac403a
- Vieira et al. (2013) Vieira, J. D., Marrone, D. P., Chapman, S. C., et al. 2013, Nature, 495, 344, doi: 10.1038/nature12001
- Walter et al. (2003) Walter, F., Bertoldi, F., Carilli, C., et al. 2003, Nature, 424, 406, doi: 10.1038/nature01821
- Wang et al. (2019) Wang, F., Wang, R., Fan, X., et al. 2019, ApJ, 880, 2, doi: 10.3847/1538-4357/ab2717
- Wang et al. (2010) Wang, R., Carilli, C. L., Neri, R., et al. 2010, ApJ, 714, 699, doi: 10.1088/0004-637X/714/1/699
- Wang et al. (2011a) Wang, R., Wagg, J., Carilli, C. L., et al. 2011a, ApJ, 739, L34, doi: 10.1088/2041-8205/739/1/L34
- Wang et al. (2011b) —. 2011b, AJ, 142, 101, doi: 10.1088/0004-6256/142/4/101
- Wang et al. (2013) —. 2013, ApJ, 773, 44, doi: 10.1088/0004-637X/773/1/44
- Wang et al. (2016) Wang, R., Wu, X.-B., Neri, R., et al. 2016, ApJ, 830, 53, doi: 10.3847/0004-637X/830/1/53
- Wardlow et al. (2017) Wardlow, J. L., Cooray, A., Osage, W., et al. 2017, ApJ, 837, 12, doi: 10.3847/1538-4357/837/1/12
- Weiß et al. (2003) Weiß, A., Henkel, C., Downes, D., & Walter, F. 2003, A&A, 409, L41, doi: 10.1051/0004-6361:20031337
- Weiß et al. (2005) Weiß, A., Walter, F., & Scoville, N. Z. 2005, A&A, 438, 533, doi: 10.1051/0004-6361:20052667
- Wolfire et al. (2010) Wolfire, M. G., Hollenbach, D., & McKee, C. F. 2010, ApJ, 716, 1191, doi: 10.1088/0004-637X/716/2/1191
- Yang et al. (2019) Yang, J., Venemans, B., Wang, F., et al. 2019, ApJ, 880, 153, doi: 10.3847/1538-4357/ab2a02
- Zanella et al. (2018) Zanella, A., Daddi, E., Magdis, G., et al. 2018, MNRAS, 481, 1976, doi: 10.1093/mnras/sty2394
- Zavala et al. (2018) Zavala, J. A., Montaña, A., Hughes, D. H., et al. 2018, Nature Astronomy, 2, 56, doi: 10.1038/s41550-017-0297-8
- Zavala et al. (2022) Zavala, J. A., Casey, C. M., Spilker, J., et al. 2022, ApJ, 933, 242, doi: 10.3847/1538-4357/ac7560
- Zhang et al. (2016) Zhang, Z.-Y., Papadopoulos, P. P., Ivison, R. J., et al. 2016, Royal Society Open Science, 3, 160025, doi: 10.1098/rsos.160025