Energetic cost of measurements using quantum, coherent, and thermal light
Abstract
Quantum measurements are basic operations that play a critical role in the study and application of quantum information. We study how the use of quantum, coherent, and classical thermal states of light in a circuit quantum electrodynamics setup impacts the performance of quantum measurements, by comparing their respective measurement backaction and measurement signal to noise ratio per photon. In the strong dispersive limit, we find that thermal light is capable of performing quantum measurements with comparable efficiency to coherent light, both being outperformed by single-photon light. We then analyze the thermodynamic cost of each measurement scheme. We show that single-photon light shows an advantage in terms of energy cost per information gain, reaching the fundamental thermodynamic cost.
Quantum measurements are ubiquitous in quantum mechanics. They raise questions of fundamental nature [1] and are essential operations in emerging quantum technologies [2, 3]. In this view, it is of fundamental and practical importance to understand the cost of measuring in the quantum realm [4, 5, 6]. Pioneering contributions have analyzed the thermodynamic cost of measurement over an elementary cycle, as the energy cost of creating correlations between a system and a memory (readout step), followed by the cost of erasing the memory (erasure step) [7]. For a memory with degenerate energy states, the readout step is energetically free, and the overall cost reduces to the erasure cost. Generalizing to non-degenerate energy states, it was shown that the total energy cost of the cycle is always lower bounded by , where is the Boltzmann constant, is the temperature of the memory and is the mutual information between the measured system and the memory. Comparing the total energy cost of such a cycle to this fundamental bound defines an energetic efficiency for the measurement process.
The circuit quantum electrodynamics (cQED) architectures provide convenient platforms to study the energetic footprint of quantum measurement [8, 9]. A microwave cavity plays the role of the memory used to encode a qubit state [10, 11, 12]. In this study, we investigate the energy cost of qubit measurements in the strong dispersive limit. Here, the interaction is , where is the dispersive shift, is the annihilation (creation) operator for the cavity, and is the Pauli operator for the qubit. When the dispersive shift is much greater than the cavity dissipation rate , [13] the qubit state can be distinguished by probing the transmission amplitude of the cavity. The readout step consists in filling the initially empty cavity with a field, whose final energy depends on the qubit state. This can be performed using coherent, thermal and single-photon light, thereby enabling a direct comparison of the energy cost using different light sources. We examine the measurement backaction in these three scenarios, and quantify their energy cost in terms of emitted cavity photon number. Our analysis reveals that coherent light and thermal light have the same measurement backaction and similar measurement signal to noise ratio (SNR) per photon. We identify an advantage of single-photon light in that it has the lowest energy cost per information gain. In a second step, we theoretically estimate the final meter entropy and subsequent erasure cost assuming there is a Maxwell’s demon that can extract the cavity energy. This allows us to quantify the complete energy cost of the measurement-and-erasure cycle and the efficiency of the measurement process. While coherent and thermal light do not operate at maximal efficiency, we show that single photon light saturates the fundamental bound .
Setup.—The experimental system comprises a transmon circuit embedded in a 3-dimensional aluminum cavity. The cavity has two ports; a weakly coupled input port and a strongly coupled output port such that intracavity photons predominantly leak out of the output port. The transmon has a qubit transition frequency of GHz and an anharmonicity of MHz. The cavity frequency depends on the qubit state with GHz and GHz corresponding to the qubit in the ground () and excited () states respectively. When probed at high power, the frequency converges to the bare-cavity frequency GHz. The cavity is coupled with the qubit in the strong dispersive regime, with a dispersive shift MHz and a cavity dissipation rate MHz. The qubit has a relaxation time T µs and a dephasing time T µs. To perform quantum measurements in this setup, the cavity transmission is probed with different quantum and classical states of light, described below.
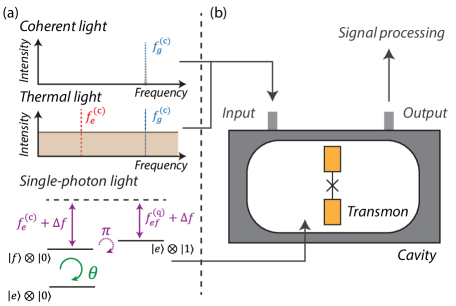
Coherent light.—To implement the readout step, we probe the initially empty cavity with a single-frequency microwave tone at frequency (Fig. 1(a,b)). In the strong dispersive limit (), as the two cavity resonances are well separated, the cavity is excited to a coherent state only if the qubit is in the state , changing the quantum states of the qubit and cavity in the following way:
| (1) | ||||
where the state denotes the qubit () and cavity () states. Here, is the vacuum state and is the coherent state established by the light where is a complex value that determines the amplitude and phase of the coherent state. The cavity output is amplified and demodulated to distinguish the qubit states [14].
Thermal light.—We generate thermal light from a 300 K, 50 resistor. The Johnson noise from the resistor is filtered, amplified, and attenuated before it is directed to the weakly coupled port of the cavity, resulting in broadband light that uniformly illuminates the and resonances of the cavity. A high-pass filter blocks the photons at the qubit transition to prevent decoherence from direct heating of the qubit. With thermal light, the quantum state of the qubit-cavity system changes as:
| (2) | ||||
where and correspond to the thermal states generated by the thermal light at frequencies and . The cavity output is collected and analyzed using Fourier transform to distinguish the qubit states [14].
Single-photon light.—Ideal single-photon illumination would consist of a temporally mode matched single itinerant photon [15, 16]. Here, we realize an effective single-photon illumination utilizing the state of the transmon to transfer a photon into the cavity. The effective single photon input is realized by first using a resonant rotation on the manifold by angle , mapping the state to a superposition . Then, two sideband pumps are applied to yield a coherent rotation between and [15], as illustrated in Fig. 1(a). The two sideband pumps used in the experiment are at frequency and , where is the frequency difference between the and states of the transmon and is a frequency detuning which is set at 0.5 GHz. We set the duration of the sideband pumps so that a -pulse is introduced between and . Following both rotations, the quantum state of the system changes as:
| (3) | ||||
The process is identical to single-photon light when and partial single-photon light when with being the average intracavity photon number. Since realizing a single-microwave-photon detector with near-unity efficiency is still a challenging task [17, 18, 19], in this work we only experimentally study the backaction of the single-photon source.
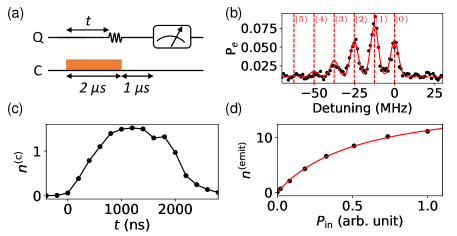
Characterization of the emitted photon number.—The metric we use to characterize the energy cost of a measurement is the total number of photons emitted by the cavity. For the case of single-photon light, the emitted photon number equals to the intracavity photon number, i.e. . For the coherent and thermal light, as the cavity states are established through quasi-continuous driving, the emitted photon number is determined by the integrated intracavity photon number. We calibrate the intracavity photon number using the ac-Stark effect. In the strong dispersive limit, a splitting can be observed in the qubit spectrum associated with different cavity Fock states [21, 13]. Figure 2(a) displays the procedure to obtain the qubit spectrum during the measurement pulse: the light source for the cavity is turned on for a duration of 2 µs and a 200 ns qubit drive is turned on with varying detuning and varying delay from the start of the cavity pulse. A qubit readout is applied at the end to determine the qubit excitation probability (). The resulting qubit spectrum is shown in Fig. 2(b) for a coherent light cavity probe. By fitting the qubit spectrum using Gaussian peaks assuming the integrated intensity of each peak following a coherent state distribution, the intracavity photon number is obtained. Figure 2(c) displays a typical dynamic of the intracavity photon number due to the applied pulse. The total emitted photon number is calculated by , where is the intracavity photon number at time , is the cavity dissipation rate and ns is the length of the qubit drive. The measured total emitted photon number as a function of the input power is shown in Fig. 2(d). The saturation of on the input power stems from the cavity nonlinearity [20, 22], i.e. the cavity resonances shift at large intracavity photon number. The data displayed in Fig. 2(b-d) are for coherent light and the corresponding data for thermal light are shown in [14].
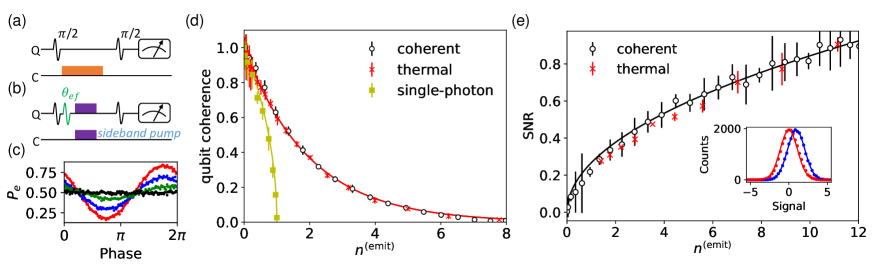
Measurement backaction.—The interaction between the qubit and cavity specifies a natural basis () for measurement. Measurement backaction refers to the reduction of qubit coherences in this basis, and the amount of backaction sets the ultimate limit on extractable information about the qubit [23, 24, 25, 26]. We use a Ramsey measurement to characterize this measurement backaction from the three different light sources. The Ramsey experiment consists of two pulses with a fixed time delay of 3 µs. For coherent and thermal light, the light source is turned on for 2 µs following the first pulse, as shown in Fig. 3(a). For single-photon light, the photon is injected after the first pulse by using a rotation in the manifold and then two sideband pumps, as shown in Fig. 3(b). The measured qubit state population after the Ramsey sequence oscillates due to the phase change of the second pulse, as shown in Fig. 3(c). The amplitude of the oscillation is proportional to the remaining qubit coherence.
The measured results of qubit coherence versus emitted photon number for the three different light sources are shown in Fig. 3(d). For single-photon light, as indicated by Eq. (3), the qubit coherence is proportional to . In contrast to coherent and thermal light which cannot achieve projective measurement even at , for single-photon light, one photon is sufficient to achieve a projective measurement, which indicates an advantage to this quantum light source in the strong dispersive limit. Remarkably, we find the coherent and thermal states have the same strength of measurement backaction. This equivalence is explained by the fact that at the limit of low photon numbers, a thermal field has the same number distribution as a coherent field. Even though the total emitted photon number can be large, as we use quasi-continuous drives for the coherent and thermal light, the driving pulse should be treated as multiple segments and the photon number in each segment is small (see [14] for details of the calculation). Note that the measured backaction of the coherent and thermal light differs from what is expected in the weak dispersive regime (), where at small photon number, the dephasing for thermal light is half of that for coherent light [27].
Measurement signal to noise ratio.— The backaction characterizes the effectiveness of the premeasurement, i.e. entanglement between the qubit and the cavity. To obtain the information of the qubit state, we now consider the classical measurement channels. These classical channels collapse the qubit–cavity entangled states. The performance of the classical measurement channels are characterized by their SNR. For both coherent and thermal light, the histogram of the measurement signals forms a Gaussian distribution and the distribution is different with qubit on different states, as shown in the inset of Fig. 3(e) [14].
The measurement SNR, defined as , where () and () are the center and standard deviation for the two states is shown in Fig. 3(e). The thermal and coherent light yield similar SNR per photon. This equivalence is unique to the strong dispersive limit studied here, and occurs because in this limit, information is encoded in the amplitude, not the phase of the transmitted light. Owing to the broadband nature of the thermal light, it may yield an important advantage in multi-qubit measurements by probing multiple qubits simultaneously without degradation of the SNR.
Measurement thermodynamics.—We now consider the total thermodynamic cost of the measurement for the three light sources. This encompasses the energy cost of the readout and the cost of resetting the cavity back to the vacuum state. The former is the photon energy multiplied by the average number of photons that leave the cavity. In the experiment, the cavity is reset by simply allowing the photons to dissipate into the detector, in which the cavity energy is wasted. While practically simple, this approach is thus highly inefficient from a thermodynamic perspective.
Here we analyze an ideal system where a Maxwell’s demon extracts the cavity energy after the readout step. The total energy cost for the whole cycle thus corresponds to the erasure cost of the demon’s memory and equals [29], where is the entropy of the cavity after readout and it is lower bounded by the mutual information between the cavity and the system. One recovers the fundamental measurement cost when [7]. Note that when is at mK-scale, this ideal energy cost is much lower than the work cost needed in our experiments.
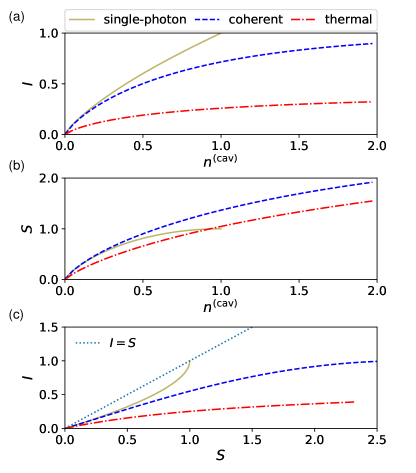
In the following analysis, we adopt a simple model where the cavity is treated as a closed system and the Maxwell demon measures the cavity in the Fock state basis, which is experimentally achievable [30, 31, 32]. Here, we analyze the results for a qubit at state before the readout. Figure 4(a) shows the calculated mutual information as a function of after the cavity is projected in the Fock state basis. An ideal projective measurement corresponds to extracting one bit of information ( bit). For single-photon light, this is achieved at . For coherent and thermal light, the measurement extracts less information per photon. The entropy of the cavity after the readout is computed for the three light sources and compared with the mutual information in Fig. 4(b-c). At small photon number, all of the three light sources stand below the limit that corresponds to a maximal measurement efficiency. This limit is achieved for a full single-photon readout, i.e. with , demonstrating the advantage of this quantum resource.
Conclusion.— We have experimentally characterized the measurement backaction and the corresponding energy cost for coherent, thermal, and single-photon light for a cQED device in the strong dispersive limit. We further analyze the theoretical bound of the work cost. Among the three light sources, we find the single-photon light consumes the minimum amount of energy cost, showing the advantage of this quantum resource. These results could be helpful for the future design of quantum engines in the cQED architecture [33, 34]. Additionally, we have demonstrated quantum measurements using thermal light in the strong dispersive limit and have showed that it has similar measurement SNR as the coherent light. This is a cheap resource and easy to implement, with a potential advantage in the measurements of large-scale qubit systems due to its broadband nature.
Acknowledgements.—This work was supported by the John Templeton Foundation Grant No. 61835, the Foundational Questions Institute Fund Grant No. FQXi-IAF19-05, the ANR Research Collaborative Project “Qu-DICE” Grant No. ANR-PRC-CES47, the NSF Grant No. PHY- 1752844 (CAREER) and use of facilities at the Institute of Materials Science and Engineering at Washington University.
References
- [1] Maudlin, T. Three measurement problems. Topoi 14, 7–15 (1995).
- [2] Briegel, H. J., Browne, D. E., Dür, W., Raussendorf, R. & Van den Nest, M. Measurement-Based Quantum Computation. Nat. Phys. 5, 19–26 (2009).
- [3] de Parny, L. d. F. et al. Satellite-Based Quantum Information Networks: Use Cases, Architecture, and Roadmap. arXiv eprint 2202.01817.
- [4] Guryanova, Y., Friis, N. & Huber, M. Ideal Projective Measurements Have Infinite Resource Costs. Quantum 4, 222 (2020).
- [5] Deffner, S., Paz, J. P. & Zurek, W. H. Quantum work and the thermodynamic cost of quantum measurements. Phys. Rev. E 94, 010103(R) (2016).
- [6] Jacobs, K. Quantum measurement and the first law of thermodynamics: The energy cost of measurement is the work value of the acquired information. Phys. Rev. E 86, 040106(R) (2012).
- [7] Sagawa, T. & Ueda, M. Minimal Energy Cost for Thermodynamic Information Processing: Measurement and Information Erasure. Phys. Rev. Lett. 102, 250602 (2009).
- [8] Blais, A., Huang, R.-S., Wallraff, A., Girvin, S. M. & Schoelkopf, R. J. Cavity quantum electrodynamics for superconducting electrical circuits: An architecture for quantum computation. Phys. Rev. A 69, 062320 (2004).
- [9] Blais, A., Grimsmo, A. L., Girvin, S. & Wallraff, A. Circuit quantum electrodynamics. Rev. Mod. Phys. 93, 025005 (2021).
- [10] Wallraff, A. et al. Approaching Unit Visibility for Control of a Superconducting Qubit with Dispersive Readout. Phys. Rev. Lett. 95, 060501 (2005).
- [11] Walter, T. et al. Rapid High-Fidelity Single-Shot Dispersive Readout of Superconducting Qubits. Phys. Rev. Applied 7, 054020 (2017).
- [12] Jeffrey, E. et al. Fast Accurate State Measurement with Superconducting Qubits. Phys. Rev. Lett. 112, 190504 (2014).
- [13] Schuster, D. I. et al. Resolving photon number states in a superconducting circuit. Nature 445, 515 (2007).
- [14] See Supplementary Information, which also includes Refs. [35, 36] for more details on the experiments and additional theory discussion.
- [15] Narla, A. et al. Robust Concurrent Remote Entanglement Between Two Superconducting Qubits. Phys. Rev. X 6, 031036 (2016).
- [16] Peng, Z. H., de Graaf, S. E., Tsai, J. S. & Astafiev, O. V. Tuneable on-demand single-photon source in the microwave range. Nat. Commun. 7, 12588 (2016).
- [17] Kono, S., Koshino, K., Tabuchi, Y., Noguchi, A. & Nakamura, Y. Quantum non-demolition detection of an itinerant microwave photon. Nature Phys. 14, 546 (2018).
- [18] Besse, J.-C. et al. Single-Shot Quantum Nondemolition Detection of Individual Itinerant Microwave Photons. Phys. Rev. X 8, 021003 (2018).
- [19] Lescanne, R. et al. Irreversible Qubit-Photon Coupling for the Detection of Itinerant Microwave Photons. Phys. Rev. X 10, 021038 (2020).
- [20] Reed, M. D. et al. High-Fidelity Readout in Circuit Quantum Electrodynamics Using the Jaynes-Cummings Nonlinearity. Phys. Rev. Lett. 105, 173601 (2010).
- [21] Schuster, D. I. et al. ac Stark Shift and Dephasing of a Superconducting Qubit Strongly Coupled to a Cavity Field. Phys. Rev. Lett. 94, 123602 (2005).
- [22] Boissonneault, M., Gambetta, J. M. & Blais, A. Improved Superconducting Qubit Readout by Qubit-Induced Nonlinearities. Phys. Rev. Lett. 105, 100504 (2010).
- [23] Gambetta, J. et al. Qubit-photon interactions in a cavity: Measurement-induced dephasing and number splitting. Phys. Rev. A 74, 042318 (2006).
- [24] Sears, A. P. et al. Photon shot noise dephasing in the strong-dispersive limit of circuit QED. Phys. Rev. B 86, 180504(R) (2012).
- [25] Hatridge, M. et al. Quantum Back-Action of an Individual Variable-Strength Measurement. Science 339, 178 (2013).
- [26] Murch, K. W., Weber, S. J., Macklin, C. & Siddiqi, I. Observing single quantum trajectories of a superconducting quantum bit. Nature 502, 211 (2013).
- [27] Goetz, J. et al. Photon Statistics of Propagating Thermal Microwaves. Phys. Rev. Lett. 118, 103602 (2017).
- [28] Bultink, C. C. et al. General method for extracting the quantum efficiency of dispersive qubit readout in circuit QED. Appl. Phys. Lett. 112, 092601 (2018).
- [29] Elouard, C., Herrera-Martí, D., Huard, B. & Auffèves, A. Extracting Work from Quantum Measurement in Maxwell’s Demon Engines. Phys. Rev. Lett. 118, 260603 (2017).
- [30] Peronnin, T., Marković, D., Ficheux, Q. & Huard, B. Sequential Dispersive Measurement of a Superconducting Qubit. Phys. Rev. Lett. 124, 180502 (2020).
- [31] Bretheau, L., Campagne-Ibarcq, P., Flurin, E., Mallet, F. & Huard, B. Quantum dynamics of an electromagnetic mode that cannot contain N photons. Science 348, 776–779 (2015).
- [32] Essig, A. et al. Multiplexed Photon Number Measurement. Phys. Rev. X 11, 031045 (2021).
- [33] Cottet, N. et al. Observing a quantum Maxwell demon at work. Proc. Natl. Acad. Sci. USA 114, 7561 (2017).
- [34] Quan, H. T., Wang, Y. D., xi Liu, Y., Sun, C. P. & Nori, F. Maxwell’s Demon Assisted Thermodynamic Cycle in Superconducting Quantum Circuits. Phys. Rev. Lett. 97, 180402 (2006).
- [35] Clerk, A. A., Devoret, M. H., Girvin, S. M., Marquardt, F. & Schoelkopf, R. J. Introduction to quantum noise, measurement, and amplification. Rev. Mod. Phys. 82, 1155 (2010).
- [36] Krantz, P. et al. A quantum engineer's guide to superconducting qubits. Appl. Phys. Rev. 6, 021318 (2019).